impact of variable renewable energy on european cross-border
TRANSCRIPT

Third International Engineering Systems Symposium
CESUN 2012, Delft University of Technology, 18-20 June 2012
Impact of Variable Renewable Energy on European
Cross-Border Electricity Transmission
Carlo Brancucci Martínez-Anido1,2, Laurens de Vries2, Gianluca Fulli1
1European Commission, Joint Research Centre, Institute for Energy and Transport.
Westerduinweg 3, Petten, 1755LE, The Netherlands. 2TU Delft, Infrastructure Systems and Services Department, Energy and Industry.
Jaffalaan 5, 2628BX, Delft, The Netherlands.
[email protected], [email protected], [email protected]
Abstract. The estimated growth of Europe’s electricity demand and the policy goals of
mitigating climate change result in an expected increase in variable renewable energy. A high
penetration of wind and solar energy will bring several new challenges to the European
electricity transmission network. The objective of this paper is to understand the effects of a
high penetration of variable renewable energy sources (RES) on the demand for cross-border
electricity transmission in Europe. EUPowerDispatch, a minimum cost dispatch model is used
to compare the impacts of different electricity generation and transmission portfolios on cross-
border electricity transmission in 2025. The analysis makes use of the best-estimate scenario
developed by the European Network of Transmission System Operators for Electricity (ENTSO-
E). Wind and solar energy curtailment needs and variations in load duration curves are
analyzed for different scenarios. In addition, the role of hydro energy storage and pumping is
analyzed as a complementary technology to transmission in the context of a high penetration of
variable RES. The study shows that the planned expansion of the European transmission
network is adequate for meeting the expected RES increase and it is needed to maintain the
current level of security of supply in the face of the expected demand growth. If RES growth is
faster than expected, cross-border transmission capacity will have to increase accordingly if
significant RES curtailment is to be avoided.
Keywords. Renewable Energy, Electricity Transmission, Hydro Storage.
1 Introduction
The European Commission (EC) recently called for a European power sector which
“can almost totally eliminate CO2 emissions by 2050” (EC, 2011). Such an ambitious
target is needed to reduce greenhouse gas (GHG) emissions by about 80% by that
time across the economy. The full decarbonization of the power sector is technically
feasible but requires substantial investment. The most critical ones for managing the
transition from today’s reality are grid extension, renewable energy sources (RES)
and carbon capture and storage (CCS) deployment and increased energy efficiency
(Roadmap2050, 2011).
In order to reach a fully decarbonized European power sector by 2050, the electricity
network must undergo several challenges in the nearer future. First of all, in 2009 the
EU adopted the Renewable Energy Directive (EC, 2009), which endorsed a
mandatory target of 20% share of energy from RES. Such a target implies that 34% of
EU’s electricity consumption will come from RES. This target must be met with an
estimated growth of electricity consumption in Europe of 30% in 2025 compared to
2010 levels (ENTSO-E, 2011). RES deployment expectations represented in several
scenarios, designed by different European organizations, converge around the
previously mentioned target (EWEA, 2011).
ENTSO-E’s 2025 best-estimate scenario (ENTSO-E, 2011) is used as reference for
the net generation capacity of each energy source in every European country in the
analysis. Power generation is modeled within EUPowerDispatch, a minimum cost
dispatch model developed by the EC’s Joint Research Centre (JRC) Smart Electricity
Systems research group (SES, 2012).
The objective of this paper is to model the European cross-border electricity network
flows in 2025 in order to study the impacts of variable RES on the demand for cross-
border transmission capacity. Interconnection capacity is considered a key element in
the integration of RES around Europe. A lack of coordination between all actors in
the European power system, including generation and transmission players, may lead
to underinvestment (Ifri, 2012). In this paper, we ask the question whether the
planned cross-border transmission capacity investments for 2025 are adequate,
considering the assumed generation scenarios, which include a high RES penetration?
We evaluate the impact of transmission capacity on the curtailment of wind and solar
energy.
Variable RES penetration is not only constrained by cross-border transmission.
Internal transmission and distribution congestion, as well as network stability
concerns, can also hinder RES generation. In order to evaluate these potential issues,
load duration curves (LDCs) are considered for the overall European power network
as well as for single countries. The impacts of wind and solar variable electricity
production on national LDCs are studied.
Finally, the role of hydro energy storage and pumping in a power grid with a high
RES penetration is studied. In addition, optimized annual hydro reservoir
management is analyzed for different scenarios.
The paper is structured as follows. Section 2 describes the methodology and the
scenarios. Section 3 provides the results and section 4 analyses them. Finally, section
5 summarizes the main outcomes of the study and proposes future work.

2 Methodology & Scenarios
The model EUPowerDispatch is used in order to study the impacts of variable RES on
the European cross-border transmission capacity needs in 2025. EUPowerDispatch
models 32 interconnected European countries, each represented as a single node,
meaning that internal network constraints are not considered. Cross-border network
capacities are considered and cross-border electricity exchanges are modeled.
Installed net generation capacities per energy source for each node and maximum
cross-border interconnection capacities are the major inputs to the model. The main
model outputs which are analyzed within the scope of this paper are RES curtailment
needs and load not served.
2.1 Model Definition
EUPowerDispatch is a minimum cost dispatch model, the optimization of which is
coded in the General Algebraic Modeling System (GAMS, 2012). CPLEX, a high-
performance mathematical programming solver (IBM, 2012) is used to solve the
model coded in the form of a mixed-integer linear problem. The objective function is
the minimization of annual electricity variable production costs in the interconnected
European power network.
The model covers a time-frame of one year with a time-step of one hour. A
preliminary run covering a whole year and with weekly time-steps sets the hydro
seasonal reservoir levels at the start and end of each week at each node. The reservoir
levels are inputs for 52 runs, each covering a week, with one hour time-step. All the
variables are modeled within the weekly run apart from the hydro seasonal reservoir
levels which have an annual management.
2.2 Electricity Consumption
In order to model electricity demand in 2025 for each European country included in
the model, one hour national time-series (ENTSO-E 2012) for year 2010 are
considered. Individual national demand growths up to 2025 are calculated (ENTSO-
E, 2011), (EC, 2010). Overall electricity consumption in the European countries
considered will increase by 30% in 2025 compared to 2010.
2.3 Generation
Power generation is modeled at each node for different energy sources: nuclear, fossil
fuels, hydro and renewable energies. A virtual power plant for each energy source
represents the total net installed generation capacity at each node based on the 2025
best-estimate scenario (ENTSO-E, 2011). Generation availability factors are
considered for each energy source (e.g. 84.5% for nuclear and 90% for fossil fuels)
and take into account power plant’s planned and unplanned unavailability.
Fig. 1 shows the total installed generation capacities in Europe in 2025 for each
energy source.

Fig. 1. Total installed generation capacities in Europe in 2025.
Different operational constraints are considered for each energy source. Nuclear
virtual power plant output is constrained between 70 and 100% of the available
power. Fossil-fired power plants are divided in the following categories: lignite, hard
coal, gas, oil and mixed fuels (oil and gas).
Lignite and hard coal virtual power plants are modeled differently from the other
ones. They are considered base load generation plants and their slower and costly
turn-on, ramp-up and shut-down times must be taken into account. The model divides
the total installed capacity of either lignite or hard coal power plants in a country in
single units of around 750 MW. Each unit is represented by a binary variable allowing
switching the power plant on or off and keeping the time between shut-down and
start-up and vice versa to a minimum of 4 hours. The present available computational
capabilities do not allow stricter constraints and therefore it is assumed that lignite
and hard coal power plants always have a hot start-up. Their unit power output is
limited between 70 and 100% of the rated available capacity.
Gas, oil and mixed fuels power plants are considered fast-reacting and therefore the
corresponding virtual power plant output is not constrained taking into account the
one-hour time-step.
Renewable energy sources including wind (both onshore and offshore), solar
photovoltaic (PV) and biomass are separately modeled as a virtual power plant at each
node. 2010 6-hour wind speed time series (Kalnay et al., 1996) with a 2.5° latitude –
longitude spatial resolution and linearly interpolated in time, are used together with
regional wind farm installed capacity data (Toorn, 2007) in order to obtain average
onshore and offshore wind power outputs for each hour of the year for each country.
For solar energy, 1-hour solar radiation data time-series (Suri et al., 2007), with a
1.51° latitude – longitude spatial resolution, represent the energy output delivered to
the grid (kW hour/MW installed). Due to data unavailability, PV installed capacity is
assumed to be equally distributed across a single country. The biomass virtual power
plant at each node is only constrained by the installed generation capacity. Its weekly
availability is constrained to 50% in order to take into account the fuel’s accessibility.
In order to simplify the modeling effort and to have a common approach throughout
Europe, hydro power plants are classified in three categories: run of river plants with

an uncontrollable generation which depends on natural inflows, seasonal storage
plants with an upper reservoir which is fed by a natural inflow and which is managed
with seasonal and daily strategies, and finally pure pumping plants which have a daily
dispatch strategy and where water is pumped from a lower reservoir into an upper one
with no natural inflow. In mountainous countries (e.g. Austria, Norway, Switzerland
or Sweden) water can be pumped in seasonal storage reservoirs which are also fed by
natural inflows. An ideal flexibility is assumed with negligible start-up, shut-down,
ramp-up or ramp-down costs. Reservoir levels are optimized for overall variable
electricity production costs only and the lower limits are set to 30% on seasonal
reservoir levels in order to partially consider environmental and landscape constraints.
Round trip pumping efficiency is assumed to be 75%.
2.4 Variable Electricity Production Costs
EUPowerDispatch’s objective function is the minimization of the annual European
electricity variable production costs. Each energy source has a different variable
electricity production cost. It comprises variable maintenance and operational costs,
fuel costs and CO2 taxes. The values, shown in Table 1, result from own calculations
and (Korpas et al., 2007). CO2 price is assumed to be equal to 22.5 Euro/tonne.
Table 1. Variable Electricity Production Costs in 2025.
Energy Source Var. El. Prod. Cost
(Euro/MWh)
Energy Source Var. El. Prod. Cost
(Euro/MWh)
Nuclear 11.00 Mixed Fuels 103.59
Lignite 47.61 Wind 0.00
Hard Coal 43.18 Solar (PV) 2.00
Gas 55.88 Biomass 53.09
Oil 98.40 Hydro 3.00
2.5 Transmission
EUPowerDispatch models the cross-border electricity flows between the 32 countries
considered. Each interconnection is defined by its maximum transfer capacity
following an approach developed by RSE (L’Abbate, 2012), which is based on the
ENTSO-E’s Ten-Year Network Development Plan (TYNDP) 2010-2020 (ENTSO-E,
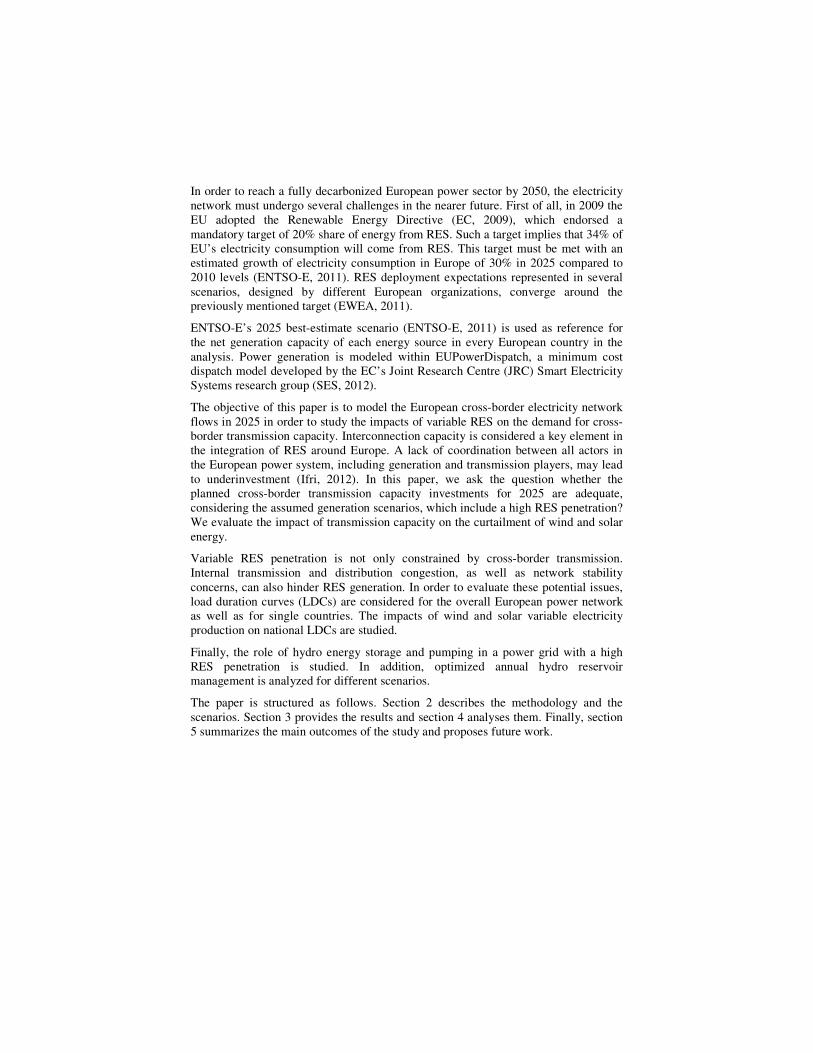
2010). Fig. 2 shows the assumed maximum cross-border transmission capacities, for
both directions, in 2025 for the European countries considered in the model.
Cross-border transmission losses are included in a simple way in order to avoid
electricity being transferred across borders at zero cost. Cross-border electricity flows
are subject to transmission losses which are proportional to the square root of their
geographical areas. In other words, power flows between two geographically large
countries are subject to higher losses that between two smaller ones.
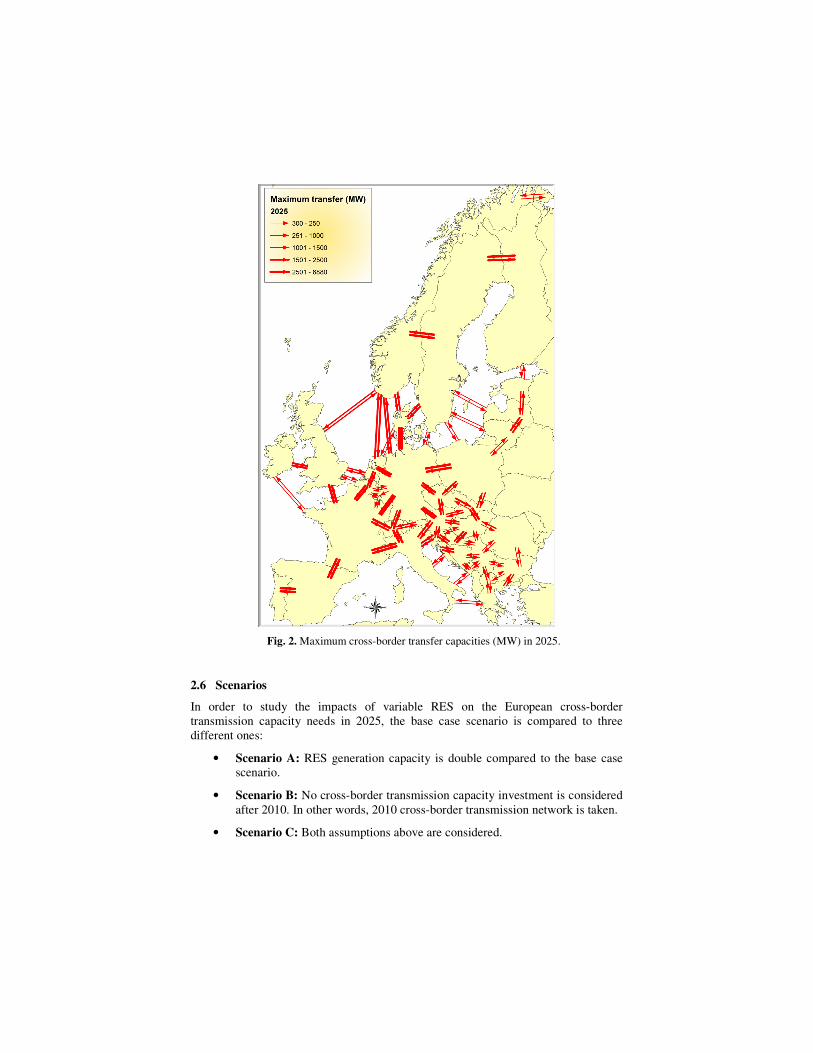
Fig. 2. Maximum cross-border transfer capacities (MW) in 2025.
2.6 Scenarios
In order to study the impacts of variable RES on the European cross-border
transmission capacity needs in 2025, the base case scenario is compared to three
different ones:
• Scenario A: RES generation capacity is double compared to the base case
scenario.
• Scenario B: No cross-border transmission capacity investment is considered
after 2010. In other words, 2010 cross-border transmission network is taken.
• Scenario C: Both assumptions above are considered.

3 Results
Table 2 provides the main results from the EUPowerDispatch simulations for the four
scenarios in 2025. Solar and wind curtailment needs are measured as volume of
curtailed energy divided by the total potential energy production by that source.
Unserved load is calculated in an analogous manner. The last line of the table
indicates the volume of energy that is stored in pumped hydro.
Table 2. Main Results.
Scenario Base Case A B C
Solar Curtailment (%) 0.000 0.000 0.000 0.000
Wind Curtailment (%) 0.000 1.276 0.033 2.610
Load Not Served (%) 0.000 0.000 0.498 0.377
Hydro Pumping (TWh) 8.978 9.329 24.580 22.950
Table 3 shows the European countries with higher variable RES share (wind and solar
energy) in the energy mix for the base case scenario. The RES share is calculated as
the volume of energy that is produced as a percentage of the total volume of
electricity generation in the country. In addition, the net generation capacities of wind
and solar plants as well as peak load are given.
Table 3. Countries with higher RES (wind& solar) share in energy mix (base case scenario).
Country RES (wind &
solar) in energy
mix (%)
Installed
Wind
(GW)
Installed
Solar
(GW)
Peak
Load
(MW)
Denmark 39.1 6.97 0.00 7214
Portugal 35.1 7.95 0.54 1153
Ireland 33.6 4.89 0.00 6401
Greece 26.7 9.10 2.45 1232
Spain 21.6 40.20 11.20 5774
Latvia 21.0 0.75 0.00 1671
Italy 20.2 21.20 1.50 6932
United Kingdom 19.2 31.12 0 6672
Germany 16.7 52.50 20.00 9993
Belgium 10.8 4.82 2.00 1711

Table 4 shows the European countries with higher wind curtailment needs in
scenarios A and C.
Table 4. Countries with higher wind curtailment needs (%) for scenarios A and C.
Country Scenario A Scenario C
Portugal 8.32 9.12
Ireland 6.59 21.45
Greece 2.84 5.11
Spain 2.84 4.43
United Kingdom 1.71 3.27
Denmark 0.69 5.11
Germany 0.0105 0.3624
Latvia 0.00 8.91
Lithuania 0.00 4.15
Fig. 3 shows the LDC for overall Europe. The solid black line is the load; the dotted is
the residual load (load minus variable RES generation) in the base case scenario. The
red lines represent scenario A. The dotted red line shows the potential residual load
curve if all RES are utilized; the solid red line represents the same scenario, but with
curtailment of RES due to cross-border transmission constraints. The green line
represents scenario C, in which there is no increase in cross-border transmission after
2010.
Fig. 3. LDC for Europe.

Fig. 4 shows the LDC for Portugal, Ireland and Denmark. The lines in the graphs
below represent the same scenarios as in Fig. 3.
Fig. 4. LDC for Portugal, Ireland and Denmark.
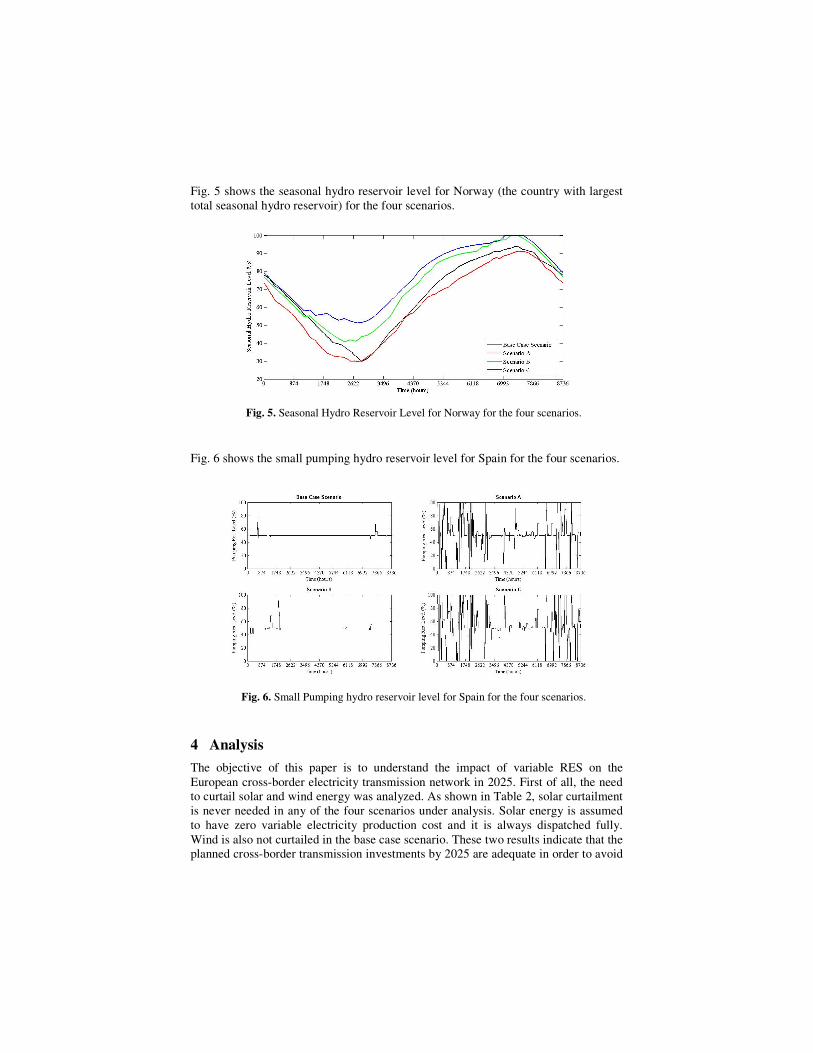
Fig. 5 shows the seasonal hydro reservoir level for Norway (the country with largest
total seasonal hydro reservoir) for the four scenarios.
Fig. 5. Seasonal Hydro Reservoir Level for Norway for the four scenarios.
Fig. 6 shows the small pumping hydro reservoir level for Spain for the four scenarios.
Fig. 6. Small Pumping hydro reservoir level for Spain for the four scenarios.
4 Analysis
The objective of this paper is to understand the impact of variable RES on the
European cross-border electricity transmission network in 2025. First of all, the need
to curtail solar and wind energy was analyzed. As shown in Table 2, solar curtailment
is never needed in any of the four scenarios under analysis. Solar energy is assumed
to have zero variable electricity production cost and it is always dispatched fully.
Wind is also not curtailed in the base case scenario. These two results indicate that the
planned cross-border transmission investments by 2025 are adequate in order to avoid

variable RES curtailment. (Note that we only analyzed the impact of cross-border
transmission capacity on curtailment; we cannot exclude the possibility that
curtailment may be necessary due to constraints within the national networks.)
In scenario B, in which cross-border transmission capacities are kept the same as in
2010, solar curtailment still is zero and wind curtailment is insignificant, below 0.1%
of the available wind power. This result would suggest that no cross-border
transmission capacity investments are needed by 2025. However, in this case there
would be an equivalent of about two days of unserved load for the whole European
region, so the transmission capacity is needed for security of supply. In addition,
several model assumptions must be taken into account. For instance, internal
transmission and distribution congestion and a more realistic representation of start-
up costs and time of base load power plants are not considered due to data and
computational capacity constraints. Curtailment needs for variable RES would be
larger is the latter two features would be considered.
In scenarios with high volumes of variable RES generation, scenarios A and C, the
need to curtail wind increases. Curtailment is highest in scenario C in which the cross-
border transmission capacities are smaller. Table 3 and Table 4 show how countries
with higher variable RES shares in their energy mix have higher wind curtailment
needs. The two countries with the highest wind curtailment needs in scenarios A and
C are Portugal and Ireland, which are only interconnected with one and two other
countries respectively. This result illustrates the importance of cross-border
transmission in a power network with a high share of RES. We may conclude that if
the variable RES penetration in Europe turns out to be higher than in ENTSO-E’s best
-estimate scenario, the importance of investment in cross-border transmission
capacity becomes even more important for the energy transition. At this point, for
instance, Italy already has more installed photovoltaic capacity than is expected in
2025 in the ENTSO-E best-estimate scenario (GSE, 2012).
The model shows that cross-border electricity exchanges do not substitute the need
for backup generation capacity. When looking at Portugal, Ireland and Denmark (Fig.
4), it can be observed how the need to curtail wind increases as the RES generation
capacity increases as a result of cross-border transmission constraints. This effect
becomes larger, of course, when cross-border transmission capacity is lower.
Another interesting and challenging issue when increasing the variable RES
penetration is the possible negative effects that it can cause on the power network
stability. Fig. 4 shows how in Denmark there are several hours in the year in which
available RES generation is higher than peak demand. There are many more hours in
the year in which RES generation is larger than the electricity load at that moment,
mainly in low demand periods. During these hours, the excess RES generation needs
to be exported or curtailed. This effect increases with more RES generation capacity
and is visible for Portugal and Ireland as well. Can a power network manage a
variable RES generation which is higher than the load in a secure and reliable way?
Cross-border electricity transmission is not the only helpful and necessary feature of a
power system for managing a high penetration of RES. Hydro reservoirs are a crucial
element for managing more efficiently the variability of RES. As shown in Fig. 5,
hydro generation is managed and controlled differently depending on the installed

RES and on the available transmission capacities. Hydro pumping is also very
important for managing RES. Spain is one of the countries with higher RES
penetration and hydro pumping capacity. As shown in Fig. 6, hydro pumping in pure
pumping stations increases exceptionally as RES capacity is doubled. This increase is
also noticed if cross-border transmission capacity is decreased. Table 2 shows how in
Europe hydro pumping triplicates in 2025 if cross-border transmission investments
are not considered since 2010. These results show how energy storage, in this case
hydro storage and pumping, is a complementary technology to electricity transmission
in the context of a large RES penetration.
4 Conclusions & Future Work
The planned expansion of the European transmission network is adequate for meeting
the expected increase in variable renewable energy generation, as described in the
ENTSO-E’s TYNDP and best-estimate scenario (2011-2025). The planned expansion
of cross-border transmission capacity is also needed to maintain the current level of
security of supply in the face of the expected demand growth. If the growth in
renewable energy is faster than expected, cross-border transmission capacity will have
to increase accordingly if significant curtailment of renewable energy sources is to be
avoided. Cross-border transmission capacity reduces the need for back-up generation
capacity to some degree, but it is not a substitute in scenarios with high volumes of
renewable energy.
Hydro energy storage and pumping are complementary technologies for managing a
European power network with a very large share of variable generation. If in the
future other forms of efficient and affordable energy storage would be available, they
would definitely contribute to a smoother energy transition.
The needs for cross-border transmission capacity investments will be further analyzed
in the future by taking into account the effects on CO2 emissions and social welfare
benefits. In addition, EUPowerDispatch will be used to study the future impacts of
electric vehicles and the effects of climate change on the European power network.
Acknowledgments. The authors would like to thank Angelo L’Abbate (RSE) for his
contribution providing the 2025 expected maximum cross-border transmission
capacities and Corina Alecu (EC JRC Smart Electricity Systems research group) for
her contribution drawing the European map.

References
EC (2009), Directive 2009/28/EC of the European parliament and of the Council of 23 April
2009 on the promotion of the use of energy from renewable energy sources and amending and
subsequently repealing Directives 2001/77/EC and 2003/30/EC.
EC (2010), EU Energy Trends to 2030 – update 2009. A report from European Coommission
DG-Energy.
EC (2011), A roadmap for moving to a competitive low carbon economy in 2050. European
Commission Communication SEC 2011 (211).
ENTSO-E (2010), Ten-Year Network Development Plan (TYNDP) 2010-2020.
https://www.entsoe.eu/index.php?id=232
ENTSO-E (2011), Scenario Outlook & Adequacy Forecasts, 2011 – 2025.
https://www.entsoe.eu/system-development/system-adequacy-and-market-modeling/soaf-2011-
2025/
ENTSO-E’s consumption data. https://www.entsoe.eu/resources/data-portal/cosnumption/. (last
accessed on 15 January 2012)
EWEA, European Wind Energy Association (2011), EU Energy Policy to 2050, achieving 80-
95% emissions reductions.
GAMS, http://www.gams.com/. (last accessed on 27 February 2012).
GSE, Gestore Servizi Energetici, http://www.gse.it/. (last accessed on 27 February 2012).
IBM, http://www-01.ibm.com/software/integration/optimization/cplex-optimizer/. (last
accessed on 27 February 2012).
Ifri, Insitut français des relations internationals (2012), The European Power System,
Decarbonization and Cost Reduction: Lost in Transmission?
Kalnay et al. (1996), The NCEP/NCAR 40-year reanalysis project, Bull. Amer. Meteor. Soc.,
77, 437-470.
Korpas, M., Warland, L., Tande, J.O.G., Uhlen, K., Purchala, K., Wagemans, S. (2007),
TradeWind Deliverable D 3.2 Grid modelling and power system data.
L’Abbate, A. (2012), Transmission interconnections database, RSE, 2009-2011.
Roadmap2050 (2011), Power Perspectives 2030, on the road to a decarbonised power sector. A
contributing study to roadmap 2050: a practical guide to a prosperous, low-carbon Europe.
SES, Smart Electricity Systems, http://ses.jrc.ec.europa.eu/. (last accessed on 27 February
2012).
Suri, M., Huld, T., Dunlop, E., Ossenbrink, H. (2007), Potential of Solar Electricity Generation
in the European Union Member States and Candidate Countries, SOLAR ENERGY vol. 81 no.
10 p. 1295-1305.
Toorn G. (2007), EU Tradewind, WP2.1: Wind Power Capacity Data Collection.
http://www.trade-
wind.eu/fileadmin/documents/publications/D2.1_Scenarios_of_installed_wind_capacity__WIT
H_ANNEXES.pdf