impact of priority and protected areas on deforestation in
TRANSCRIPT

IN DEGREE PROJECT ENVIRONMENTAL ENGINEERING,SECOND CYCLE, 30 CREDITS
, STOCKHOLM SWEDEN 2018
Impact of Priority and Protected Areas on Deforestation in Brazilian Legal Amazon
TITI SARI NURUL RACHMAWATI
KTH ROYAL INSTITUTE OF TECHNOLOGYSCHOOL OF ARCHITECTURE AND THE BUILT ENVIRONMENT

TRITA 18400
www.kth.se
Impact of Priority and Protected Areas on Deforestation in Brazilian Legal Amazon
TITI SARI NURUL RACHMAWATI
Supervisor FLÁVIO LUIZ MAZZARO DE FREITAS
Examiner ULLA MÖRTBERG
Degree Project in Environmental Engineering and Sustainable Infrastructure
KTH Royal Institute of Technology
School of Architecture and Built Environment
Department of Sustainable Development, Environmental Science and Engineering
SE-100 44 Stockholm, Sweden

2
TRITA-ABE-MBT 18400

i
Abstract
Legal Amazon, the Brazilian region where much of the global tropical forest is
located, has suffered from rapid deforestation for decades, undermining the
provision of ecosystem services and the conservation of biodiversity on local and
global scales. In order to prevent deforestation, the Brazilian government has
established priority and protected areas to ensure the preservation of high
biodiversity areas and ecosystem services. This study analyses whether the
establishment of priority and protected areas have an impact in preventing
deforestation, thus promoting biodiversity and ecosystem services. Furthermore,
this study also analyses the extent to which deforestation affects priority areas for
biodiversity conservation. Deforestation datasets from 2001 to 2014 of the Legal
Amazon was processed and analyzed. The total area and density of deforestation
were compared across three categories of land: (1) protected priority areas, (2)
unprotected priority areas, and (3) non-priority areas. Spatial methods of
geoprocessing and the statistical method one-way ANOVA were used to analyse the
deforestation trends. As a result, the deforestation density was found to be lowest
inside protected areas than in unprotected areas and non-priority areas. This implied
that land-use restrictions in protected areas had more impact compared to
unprotected areas and non-priority areas. Furthermore, deforestation has been
more intensive in regions of lower biodiversity importance. Despite this positive
evaluation, substantial tracts of forest had been converted within regions of high
biodiversity importance. Therefore, the regulation of priority and protected areas
must be evaluated and improved in the future.
Keywords
Deforestation, Legal Amazon, priority areas, protected areas, biodiversity, remote
sensing data


iii
Sammanfattning
Den brasilianska regionen Legal Amazon, där mycket av den globala andelen av
tropisk skog ligger, har drabbats av snabb avskogning i årtionden, vilket
underminerar tillhandahållandet av ekosystemtjänster och bevarandet av den
biologiska mångfalden både på lokal och global skala. För att förhindra avskogning
har den brasilianska regeringen etablerat prioriterade och skyddade områden för att
säkerställa bevarandet av områden med hög biologisk mångfald och
ekosystemtjänster. Denna studie analyserar huruvida etableringen av prioriterade
och skyddade områden påverkar förebyggandet av denna avskogning. Dessutom
analyserar denna undersökning också hur omfattningen av avskogningen påverkar
prioriterade områden för bevarande av biologisk mångfald. Avskogningsdata från
2001 till 2014 i Legal Amazon bearbetades och analyserades. Total areal och densitet
av avskogningen jämfördes mellan tre kategorier av mark: (1) skyddade prioriterade
områden, (2) oskyddade prioriterade områden och (3) icke prioriterade områden.
Rumsliga metoder för bearbetning och den statistiska metoden envägs-ANOVA
användes för att analysera avskogningstrenderna. Resultaten visar att
avskogningstätheten var lägst inom skyddade områden jämfört med oskyddade
områden och icke-prioriterade områden. Det innebär att
markanvändningsbegränsningar i skyddade områden har haft större inverkan
jämfört med oskyddade områden och icke prioriterade områden. Vidare har
avskogningen varit mer intensiv i områden med lägre värden för biologisk mångfald.
Trots denna positiva utvärdering hade ett betydande skogsområde omvandlats inom
områden med höga värden för biologisk mångfald. Därför måste regleringen av
prioriterade och skyddade områden utvärderas och förbättras i framtiden.
Nyckelord
Avskogning, Legal Amazon, prioriterade områden, skyddade områden, biologisk
mångfald, fjärranalysdata

iv
Acknowledgments
I would like to offer my sincere gratitude to my thesis supervisors, Flávio Luiz
Mazzaro De Freitas, for the opportunity to do this Master's thesis and providing me
with continuous supports and dedication throughout the project.
I would also like to thank Prof. Ulla Mörtberg as the examiner of this thesis,
for the supports and valuable feedbacks.
Finally, I would like to thank my parents, family, and friends for the endless
support and prayers.
Stockholm, July 2018
Titi Sari Nurul Rachmawati

v
Table of contents
Abstract ...................................................................................... i Keywords ................................................................................................. i
Sammanfattning ...................................................................... iii Nyckelord ............................................................................................... iii
Acknowledgments ................................................................... iv
Table of contents ...................................................................... v
List of figures .......................................................................... vii List of tables ............................................................................ ix
List of acronyms and abbreviations ....................................... xi 1 Introduction ....................................................................... 13
1.1 Background ................................................................................ 13 1.2 Aim and objectives .................................................................... 14
1.3 Relevance of the study .............................................................. 15 1.4 Scope and delimitations of the study ....................................... 15 1.5 Structure of the thesis ............................................................... 15
2 Background ....................................................................... 16
2.1 Drivers and actors of deforestation in Legal Amazon ............ 16
2.2 Set of policies and initiatives related to the protection of native vegetation ........................................................................ 18
2.2.1 Conservation framework in public lands .......................... 19
2.2.2 The conservation framework in private lands .................. 20
2.2.3 Deforestation monitoring system in Legal Amazon ......... 20 2.2.4 Supply chain interventions ............................................... 21
2.3 Priority areas establishment ..................................................... 21 2.4 Ecosystem services and biodiversity in Legal Amazon ......... 22
3 Methodology ...................................................................... 24
3.1 Description of the study area .................................................... 24 3.2 Overview of the research methodology ................................... 25
3.3 Literature review ........................................................................ 26 3.4 Data acquisition ......................................................................... 26 3.5 Dataset processing .................................................................... 27
3.5.1 Identifying deforestation in priority and protected areas .. 28 3.5.2 Identifying deforestation based on years ......................... 32
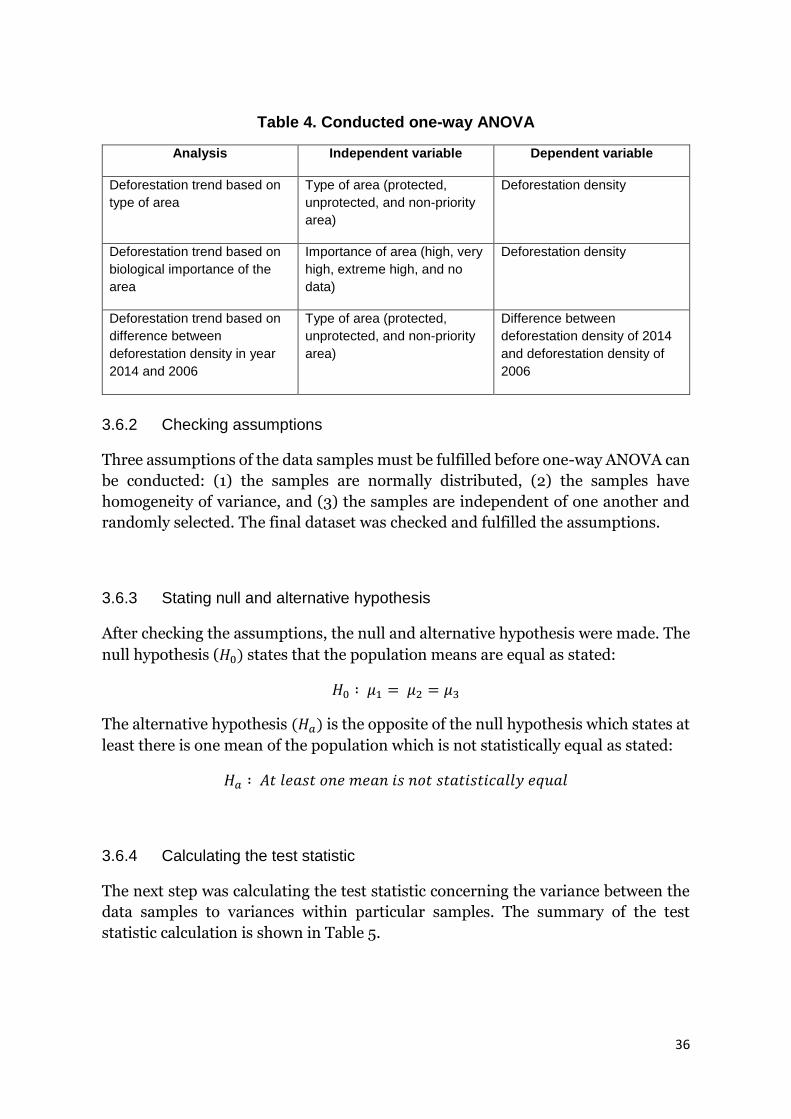
3.6 Analysis of variance (ANOVA) .................................................. 34
3.6.1 Defining independent and dependent variables .............. 34 3.6.2 Checking assumptions .................................................... 36 3.6.3 Stating null and alternative hypothesis ............................ 36 3.6.4 Calculating the test statistic ............................................. 36 3.6.5 Interpreting the results ..................................................... 37
3.7 Visualization with Tableau ........................................................ 38
4 Results ............................................................................... 39

vi
4.1 Deforestation trend based on area type ................................... 39
4.2 Deforestation trends and the biological importance of priority areas .............................................................................. 41
4.3 Deforestation differences of year 2006 and 2014 .................... 44
5 Discussion ......................................................................... 46
5.1 Deforestation trends analysis ................................................... 46 5.2 Limitations .................................................................................. 48 5.3 Suggestions for future work ..................................................... 48
6 Conclusions ....................................................................... 49
References .............................................................................. 51

vii
List of figures
Figure 1. Annual deforestation rate in the Brazilian Amazon (INPE, 2017) ........................................................................................ 17
Figure 2. Clear cut deforestation (Bergen, 2018) .......................................... 18 Figure 3. Sets of public policies and NGO initiatives ................................... 18 Figure 4. The relationship between priority and protected areas in Legal
Amazon .................................................................................... 19 Figure 5. Legal Amazon in Brazil ................................................................... 25 Figure 6. Overview of the research methodology .......................................... 25 Figure 7. Priority areas of Legal Amazon (MMA, 2006) ............................... 27 Figure 8. Data processing for identification priority and protected areas
in reference to deforestation ................................................... 28 Figure 9. Exporting deforestation data based on years ................................ 29 Figure 10. The deforestation layer in priority areas in 2006 with its
attribute table .......................................................................... 29 Figure 11. The process of creating polygons outside the priority areas
using the erase function ...........................................................30 Figure 12. Deforestation outside priority areas in 2006 with its attribute
table .......................................................................................... 31 Figure 13 Data processing for identifying deforestation ............................... 32 Figure 14. Deforestation in protected and unprotected areas ...................... 33 Figure 15. Overview of the ANOVA workflow ............................................... 34 Figure 16. Deforestation trend based on type of area ................................... 39 Figure 17. Deforestation trends based on areas of biological importance .... 42


ix
List of tables
Table 1. A slice of the final table of deforestation in priority areas ...............30 Table 2. A slice of the final table of deforestation outside priority areas ..... 31 Table 3. A Slice of the final table of deforestation based on type of area ..... 33 Table 4. Conducted one-way ANOVA ............................................................ 36 Table 5. Test statistic calculation of one-way ANOVA .................................. 37 Table 6. Deforestation based on type of area ............................................... 40 Table 7. Descriptive table of first analysis of one-way ANOVA ................... 40 Table 8. ANOVA table of the first analysis one-way ANOVA ....................... 41 Table 9. Multiple comparisons table of the first analysis with one-way
ANOVA ..................................................................................... 41 Table 10. Deforestation trend based on areas of biological importance ....... 42 Table 11. Descriptive table of the second analysis with one-way ANOVA .... 43 Table 12. ANOVA table of the second analysis by one-way ANOVA ............ 43 Table 13. Multiple comparisons table of the second analysis with one-
way ANOVA ............................................................................. 44 Table 14. Descriptive table of the third analysis with one-way ANOVA ....... 44 Table 15. ANOVA table of the third analysis with one-way ANOVA ............ 45 Table 16. Multiple comparisons table of the third analysis with one-way
ANOVA ..................................................................................... 45

xi
List of acronyms and abbreviations
ANOVA Analysis of Variance
CBD Convention on Biological Diversity
CUFP Conservation Unit of Full Protection
CUSU Conservation Unit of Sustainable Use
DETER Real-Time System for Detection of Deforestation
GIS Geographic Information System
GWF Global Forest Watch
IBGE Brazilian Institute of Geography and Statistics
INPE Brazilian Spatial Research Institute
MMA Brazilian Ministry of Environment
NGO Non-Governmental Organization
Pg Petagrams
PPCDAm Action Plan for the Prevention and Control of Deforestation in
the Legal Amazon
PROBIO Project for the Conservation and Sustainable Use of Brazilian
Biological Diversity
PRODES Project for Monitoring the Brazilian Amazon Forest by Satellite
SNUC National System of Conservation Units
SPSS Statistical Package for the Social Sciences
MAPA Brazilian Agriculture Ministry


13
1 Introduction
1.1 Background
The Brazilian tropical forest located in the Legal Amazon plays a major role in the
world’s climate system, biodiversity, and ecosystem services by storing 52 Gt of
carbon in the above-ground biomass (Freitas et al., 2018) and hosting more than
40,000 different plants and more than 5,000 vertebrate species (Mittermeier et al.,
2002). The Brazilian Legal Amazon (Figure 5) also plays vital role in keeping the
water balance that gives services to human life on local and global scales (Davidson
et al., 2012).
Regardless of its richness of biodiversity, Legal Amazon has suffered from rapid
deforestation and land use change into farmland. From 2004 to 2017, the total
deforestation reached 142,714 km2 (INPE, 2017). Due to current deforestation and
forest degradation, many endemic species are affected and restricted to parts of their
habitat (Michalski and Peres, 2005). Specifically, trees and fauna mortality is
strongly affected by edge effects of forest fragmentation (Peres et al., 2010). Due to
national and global demand for food, timber and bioenergy (MAPA, 2016), more
areas of native forest may be converted leading to substantial impact for biodiversity
(Freitas et al., 2018).
To address this issue, the Brazilian government defined priority areas for
conservation, sustainable use and sharing of biodiversity benefits. This is one of the
efforts to fulfil the Convention on Biological Diversity (CBD) (UN 1992) that
represents a worldwide effort for the conservation and sustainable use of
biodiversity. The purpose of priority area establishment is to serve as a guideline of
policies that aims to find a balance between the demand for economic growth and
the conservation efforts.
The most recent nationwide database available on priority area was produced in
2006 by the Brazilian Ministry of Environment (MMA) when 900 priority areas were
established all around Brazil with 80 % located in the Amazon region (MMA, 2007).
Before the establishment of priority areas, the Brazilian government also established
protected areas through the National System of Conservation Units (SNUC,
Portuguese acronym). SNUC was stipulated in 2000 through Law 9,985, 19 July
2000. SNUC categorised protected areas as Indigenous Lands and Conservation
Units. These protected areas are included in the priority areas that was established
in 2006 (MMA, 2007) and protected by legal mechanisms that prevent the
conversion of native vegetation into agricultural land. On the other hand, the rest of
the priority areas named unprotected areas (for biodiversity conservation) are not
protected and available for legal deforestation (CBD, 2007).
14
A study by Soares-Filho et al. (2010) pointed out that protected areas in the Amazon
biome can avoid emissions as much as 47 ± 9 Pg of carbon. Furthermore, the
expansion of protected areas in 2006 have partially contributed to decreasing the
deforestation up to 75 % in the Amazon forest from 2004 to 2009 (INPE, 2009).
Several studies have quantified the effectiveness of protected areas in preventing
deforestation and protecting biodiversity (Soares-Filho et al., 2010, Nolte et al.,
2013; Brun et al., 2015; Miranda et al., 2016). These studies used varied methods
with different conclusions on protected areas’ efficiency from positive to no effect
(Soares-Filho et al., 2010) although most of the studies have shown positive impacts
of protected areas (Nolte et al., 2013; Brun et al., 2015; Miranda et al., 2016).
No studies could be found that analyse the extent to which deforestation is affecting
priority areas or if priority areas have contributed to reducing deforestation. The
impacts of priority areas and protected areas in preventing deforestation is still
uncertain even though it is highly essential to measure the effectiveness of
conservation strategies. The results of measurement can be used to justify further
investments and policies and to identify the need of adjustment in the existing
strategies (Mace et al., 2008). Hence, there is a need to address this issue and to
analyse the impacts of priority areas and protected areas in protecting biodiversity
from deforestation.
1.2 Aim and objectives
The aim of this thesis project was to analyse the impacts of priority and protected
areas for biodiversity conservation in preventing deforestation. Further, this study
investigates the efficiency of protected areas in preventing deforestation. An
investigation to which extent deforestation has affected priority areas for
biodiversity conservation was also conducted.
Thus, the research questions associated with the aim were:
1. Is the establishment of high biodiversity areas (priority areas) and land use
restrictions (protected areas) impactful in preventing deforestation?
2. Has deforestation affected areas of high biodiversity value?
The following objectives were established to meet the aim of this research:
1. To evaluate deforestation in relation to three categories of land tenure: (1)
protected priority areas, (2) unprotected priority areas, and (3) non-priority
areas.
2. To evaluate deforestation in relation to the biodiversity importance of the
native vegetation: (1) high importance, (2) very high importance, (3) extreme
high importance, and (4) no data.
15
3. To analyse the impacts of priority areas establishment in 2006 by analysing
the difference of deforestation in 2006 to the latest deforestation data in 2014.
1.3 Relevance of the study
The knowledge generated in this project may be used to support the management of
deforestation in priority and protected areas in the Legal Amazon. In the short term,
the gained knowledge will improve the understanding of the current situation, the
pattern of deforestation and how biodiversity is affected. In the long term, the
concepts and data-driven analysis presented here can serve as the basis for more
elaborated toolkits for evaluating the current public policies and producing
improved strategic plans, public policies and initiatives.
1.4 Scope and delimitations of the study
This study is limited to priority areas established in 2006 by the Brazilian Ministry
of Environment, and protected areas stipulated in 2000 through Law 9,985, 19 July
2000 in the Legal Amazon of Brazil. Furthermore, the deforestation datasets used
were provided by the INPE (Instituto Nacional de Pesquisas Espaciais) through
Project for Monitoring the Brazilian Amazon Forest by Satellite program (PRODES,
Portuguese acronym) where deforestation is available yearly from 2001 to 2014.
1.5 Structure of the thesis
This master’s thesis comprises six chapters. Chapter 1 presents the background, aim,
and objectives of the study. Chapter 2 describes the theoretical background and
related works to biodiversity and historical deforestation of the Legal Amazon and
discusses the major policies and initiatives related to land use governance in the
study region. Chapter 3 provides the study area and detailed description of the
research methodology employed to conduct the spatial and statistical analysis.
Chapter 4 presents a summary of the major results, while Chapter 5 discusses the
results in relation to existing literature and suggests possible future work which
could be built upon this project. Finally, Chapter 6 gives the key conclusion.

16
2 Background
This chapter provides the history of deforestation in Legal Amazon, which is the area
of this study. Furthermore, this chapter also explains the set of policies and
initiatives that has been established by government and private sector to address
deforestation in the Legal Amazon. Lastly, this chapter provides an overview on the
biodiversity in the study area and the establishment of priority and protected areas
as the means to protection such biodiversity.
2.1 Drivers and actors of deforestation in Legal Amazon
Deforestation in the Amazon region is closely related to the development of road
infrastructure in the region (Fearnside, 2017). An important event which indirectly
has triggered the deforestation process in the Amazon region was the construction
of Trans Amazon Highway (BR-230) in 1972 (Fearnside, 2017). The highway crossed
over the states of Paraiba, Ceara, Piau, Maranhao, Tocantins, Para, and Amazonas.
Due to the economic crisis, it was only paved from the beginning to Maraba.
However, it was enough to give access to public and private companies to penetrate
the Legal Amazon (Fearnside, 2017). Besides the highway construction, other major
drivers are agricultural intensification, cattle ranching and soybean expansion,
timber business, policy failures and land tenure establishment (Jean et al., 2011).
The complex natures and interconnectedness between these drivers resulted in
widely varied deforestation rates over the decades.
Until 1970, deforestation in Legal Amazon covered approximately 98,000 km2
(Fearnside, 2009). Afterwards, deforestation increased until 1987 because of fiscal
incentives by the government to the large ranches before it decreased due to the
economic recession until 1991 (Fearnside, 2017). However, it increased after 1991 as
the economy recovered and reached its peak in 1995 (29,100 km2) as shown in Figure
1. Deforestation decreased drastically in 1996 before it increased gradually until it
reached the peak again in 2004 (27,772 km2) because of the strengthening economy
and rising commodity prices (Fearnside, 2017). At that span of time, technological
advances favoured large scale expansion of soy and soy prices spiked in 2004
(Nepstad et al., 2014).

17
Figure 1. Annual deforestation rate in the Brazilian Amazon (INPE, 2017)
Eventually, in 2004 the Brazilian government launched the Action Plan for the
Prevention and Control of Deforestation in the Legal Amazon (PPCDAm). Several
studies pointed out that deforestation from 2004 to 2012 not only decreased because
of PPCDAm but that it was also triggered by the reduction of commodity prices,
especially soybeans and beef, and an initiative by the Brazilian Central Bank (BACEN
3545/2008) (Fearnside, 2017; Assuncao, 2015). The Bank blocked loans that gave
significant impact to large agriculture and ranching companies (Fearnside, 2017).
The Brazilian Institute for the Environment and Renewable Natural Resources also
initiated a policy to blacklist municipalities with high deforestation rates who
suffered restrictions on agricultural credits (Fearnside, 2017; Nepstad, 2014).
However, since 2009 the deforestation have stabilized at 5,000-7,000 km2 (INPE,
2017) as shown in Figure 2, and often occurs as small patches in remote parts of
Legal Amazon by smallholders (Assunção et al., 2017). Looking back at the
deforestation from 1970 until 2014, deforestation and forest degradation are
concentrated in the eastern and southern parts of Legal Amazon, mostly in the Mato
Grosso, Tocantins, and Maranhao states (Morton et al., 2006). Based on actors, the
deforestation between 2004 and 2011 was dominated by large holders and only small
parts by smallholders (Godar et al., 2014).
Nevertheless, the current deforestation data that has been collected has a limitation.
Both the current deforestation monitoring system named PRODES and Real-Time
System for Detection of Deforestation (DETER, Portuguese acronym) which is
21
,05
0
17
,77
0
13
,73
0
11
,03
0
13
,78
6
14
,89
6
14
,89
6
29
,05
9
18
,16
1
13
,22
7 1
7,3
83
17
,25
9
18
,22
6
18
,16
5
21
,39
4 25
,24
7
27
,42
3
18
,84
6
14
,10
9
11
,53
2
12
,91
1
7,4
64
7,0
00
6,4
18
4,5
71
5,8
91
5,0
12
6,2
07
7,8
93
6,6
24
-
5,000
10,000
15,000
20,000
25,000
30,000
35,000
19
88
19
89
19
90
19
91
19
92
19
93
19
94
19
95
19
96
19
97
19
98
19
99
20
00
20
01
20
02
20
03
20
04
20
05
20
06
20
07
20
08
20
09
20
10
20
11
20
12
20
13
20
14
20
15
20
16
20
17
De
fore
stat
ion
(km
2/y
ear
)
Year

18
explained in Subchapter 2.2 can only detect clear-cutting deforestation (Figure 2)
and not forest degradation or tree loss by selective logging. Furthermore, PRODES
can only identify deforestation of at least 6.25 hectares while DETER can only
identify deforestation of at least 25 hectares (Assunção et al., 2017).
Figure 2. Clear cut deforestation (Bergen, 2018)
2.2 Set of policies and initiatives related to the protection of native vegetation
The Brazilian government has stipulated several legal policies to regulate a
framework for conservation in public and private lands. Besides that, the Brazilian
government also established priority areas that are public areas with high richness
of biodiversity and created for environmental conservation. On Legal Amazon scale,
remote-sensing based monitoring of deforestation was also established through the
PRODES and DETER programmes. On the other hand, the Non-Governmental
Organization (NGO) sector also set initiatives concerning the supply chain of soy and
cattle that put pressure on the deforestation actors. The set of policies and initiatives
as explained above that will be discussed in this study are shown in Figure 3.
Figure 3. Sets of public policies and NGO initiatives
Public Policies
Conservation Framework
In Public Land
In Private Land
Deforestation Monitoring System
PRODES DETER
Priority Areas
NGO Initiatives
Supply Chain Intervention
Soy Moratorium
Cattle Agreement

19
2.2.1 Conservation framework in public lands
Public lands in Brazil are categorised as Conservation Units, Indigenous Lands and
Military Lands. In 2000, the Brazilian government stipulated the National System
of Conservation Units (SNUC) through Law no 9,985 (MMA, 2017). The SNUC law
gives clear guidance in the procedure of creation, implementation, and management
of protected areas. Based on the government level, the areas were categorised as
federal, state, municipal, and district protected areas that were managed in an
integrated manner (MMA, 2017). The protected areas under the Law covered 17.2 %
of the continental area and 1.5 % of the marine area of Brazilian territory (MMA,
2017).
Besides that, protected areas were also categorised based on conservation type called
(1) conservation unit of full protection (CUFP) and (2) conservation unit of
sustainable use (CUSU) (MMA, 2015). CUFP serves the purpose of parks and
reserves while CUSU has a function of natural resources extraction in a sustainable
manner (MMA, 2017). A study by Nepstad et al., (2006) pointed out that the location
and category of protected areas affect the effectiveness in preventing deforestation.
Protected areas located near deforestation frontiers have a higher chance of
deforestation (Nepstad et al., 2006).
In 2004, the Ministry of the Environment stipulated Decree No. 5,092 that stated
the establishment of 900 priority areas. Furthermore, there were initiatives to
include the existing protected areas into priority areas. Finally, in 2006, 490
protected areas were included in priority areas in the Amazon biome. The relation
between both areas is displayed in Figure 4.
Figure 4. The relationship between priority and protected areas in Legal
Amazon
Concerning Indigenous Lands, the Constitution was stipulated in 1988. The
Constitution gives the right to indigenous people that they have usufruct rights to
the land including the soil, the rivers and the lakes existing therein but not to possess

20
mineral resources inside the lands (Ramos, 1988). Because of that, Indigenous Lands
have the lowest risk of deforestation (Nepstad et al., 2006). A study by Ricketts et al.
(2010) showed that the probability of deforestation was 7 to 11 times lower within
Indigenous Lands than protected areas in public and private lands.
2.2.2 The conservation framework in private lands
To ensure the preservation of native vegetation in private property, the Brazilian
government stipulated the Brazilian Forest Act (Law no 4,771) in 1965 which acted
as the central framework to limit agricultural expansion over private lands. However,
this law was highly ineffective in stopping deforestation due to its strict rules and
weak enforcement, resulting in very low compliance (Fearnside, 2017). In 2012, the
Act was replaced by the New Forest Act (Law no. 12,651), which brought a number
of changes to facilitate compliance and balance production and conservation
(Sparovek et al., 2012; Freitas, 2017; Fearnside, 2017).
The main feature of the New Act is the Rural Environmental Registry (CAR,
Portuguese acronym) which regulates the protection and registration mechanisms
of permanent preservation areas and legal reserves on private territory (Freitas et
al., 2018). Studies pointed out that the New Forest Act has both drawbacks and
positive aspects compared to the previous Act (Sparovek et al., 2012; Soares-Filho et
al., 2014). It reduces restriction for deforestation on steep hillsides and near rivers
and approves illegal clearing done by 2008. Nonetheless, it introduced more efficient
command and control regulations to reduce illegal deforestation (Soares-Filho et al.,
2014).
2.2.3 Deforestation monitoring system in Legal Amazon
The Brazilian government launched a diverse set of policy interventions named the
Action Plan for the Prevention and Control in the Legal Amazon (PPCDAm) in 2004
specifically for the Legal Amazon (MMA, 2013). PPCDAm runs in inter-ministerial
format between federal, state, and municipal governments as well as environmental
organisations and civil society (Assunção et al., 2017). PPCDAm has three main
policies: land tenure regulation (MMA, 2013), land use monitoring (Arima et al.,
2014), and sustainable agricultural promotion (Dalla-Nora et al., 2014).
The projects under the second policy of PPCDAm are PRODES and DETER
(Assunção et al., 2017). PRODES is a deforestation monitoring programme covering
the Legal Amazon. It uses satellite images of LANDSAT with a spatial resolution of
20 to 30 m. PRODES releases deforestation data annually, and it has been run since
21
1988. PRODES has a limitation as it only identifies clear-cut deforestation with
cleared areas of at least 6.25 hectares (Assunção et al., 2017).
Meanwhile, DETER is a near-real-time monitoring system of deforestation based on
satellite images. DETER’s sources images are from the MODIS sensor on the Terra
satellite. Although DETER releases monthly data which is more often than PRODES,
it has a limitation as it can only detect deforestation greater than 25 hectares due to
that the spatial resolution of the satellite images is 250 m (Assunção et al., 2017).
Both the PRODES and DETER programmes have contributed to the planning and
development of public policies in the Legal Amazon.
2.2.4 Supply chain interventions
In addition to governmental policies, NGOs also put pressure on deforestation
actors, such as private companies and commodity exporters. In 2006, the NGO
Greenpeace succeeded in pressuring major soy exporters to sign a “soy moratorium”
that stated that exporters cannot buy soy commodities produced from illegal
deforestation that happened after 2006 (Fearnside, 2017). Afterwards, the
moratorium was renewed in 2016 and has had an effect on reducing deforestation
(Adario, 2016; Gibbs et al., 2015). In 2009, cattle agreements named “term of
adjustment of conduct” and “zero deforestation agreement” were signed, leading to
a significant effect in the reduction of deforestation (Fearnside, 2017).
2.3 Priority areas establishment
A report by MMA (2007) stated that the priority areas were first established between
1998 and 2000 under Project for the Conservation and Sustainable Use of Brazilian
Biological Diversity (PROBIO). The result was stipulated through Law no. 5,092 that
state a 900 priority areas establishment. The purpose of the priority areas
establishment was to serve as a guideline of policies especially in conserving
biodiversity but also maintaining economic growth. The results of these priority
areas were updated in 2006 by MMA. The scope of the project covered the entire
area of Brazil. The result of this process was an increase of priority areas (MMA,
2007).
The process of establishing priority areas in 2006 was conducted in three stages:
technical meetings, data processing, and regional seminars (MMA, 2007). In the
technical meetings, three broad categories were established to determine the
biological importance of priority areas. The classes are (1) biodiversity, whether there
are endemic species, endangered species, etc., (2) sustainable use, whether there are

22
species, economic, or cultural importance, etc., and (3) processes, whether the area
possesses environmental services, biogeochemical cycles, etc. (MMA, 2007). As a
result, the biological importance was categorised as extremely high, very high, high,
and no data. While the priority areas were produced during data processing, in
regional seminars, the urgency of action to priority areas was established. The
urgency of action was categorised as extremely high, very high, and high (MMA,
2007).
The process itself involved the participation of various stakeholders with different
interests (government officials, academic experts, environmental organisations,
traditional communities and the private sector) (Castro and Albernaz, 2016).
Furthermore, the result was strongly based on the experience of the stakeholders and
available information of biodiversity in each biome.
Priority areas themselves were defined as areas with high quality of native
ecosystems and biodiversity richness and were created for environmental
conservation. Priority areas were divided into two types named protected and
unprotected areas. Protected areas as defined in the SNUC (Law no. 9,985, 2000)
belong to priority areas and are protected by legal mechanisms that prevent the
conversion of native vegetation into agricultural land. On the other hand,
unprotected areas are areas also with high biodiversity value but are not protected
and available for legal deforestation (CBD, 2007).
Currently, the second update of priority areas is ongoing. The update for the Cerrado,
Pantanal, and Caatinga biomes was done in 2016 while the update for the Amazon,
Pampa, Atlantic forest, and Coastal and Marine Zones is expected to be finished by
the end of 2018 (MMA, 2017).
2.4 Ecosystem services and biodiversity in Legal Amazon
Legal Amazon hosts the largest area of tropical rainforest in the world. It stores
carbon as much as 54 Gt and maintains habitat for 5,526 vertebrate species
(Mittermeier et al., 2002). Legal Amazon consists of three biomes: the Amazon and
parts of the Cerrado and Pantanal biomes. A study by Vieira et al. (2008) pointed
out that the Amazon biome consists of at least 50,000 plant species of which 30,000-
35,000 endemic. Meanwhile, the Cerrado biome accommodates about 90,000 insect
species, 150 mammal species, and 550 bird species, which are also endemic (Ratter
et al., 1997). Lastly, the Pantanal biome contains several aquatic species and stores a
large quantity of carbon (Liengaard et al., 2012). The diverse plant and vertebrate
species in these three biomes are highly threatened by deforestation.

23
Considering the capacity above of Legal Amazon, deforestation in Legal Amazon will
not just affect this area but also the sustainability of the world. Deforestation means
loss of ecosystem services including its roles in storing carbon, maintaining
biodiversity and recycling water (Fearnside, 2017). Due to the current deforestation
and forest degradation, many endemic species are affected and restricted to parts of
their habitat (Michalski and Peres, 2005). Also, especially tree and fauna mortality
is strongly affected by edge effects of forest fragmentation (Peres et al., 2010).
The main drivers of deforestation in Legal Amazon are human activities, mainly in
the form of land use and land cover changes from rainforest to agricultural land and
road and urban infrastructure, which are likely to continue to happen in the future
(Goldewijk, 2001). These activities resulted in direct effect on ecosystem dynamics,
among others nitrogen dynamic (Melillo et al., 2001), water balance, biodiversity
loss (Foley et al., 2005), as well as forest degradation, fragmentation and destruction
(Freitas et al., 2018). A study by Barlow et al., (2016) revealed that biodiversity is
decreasing at alarming rates.
The policies and initiatives to protect biodiversity in the Legal Amazon should at
least maintain core ecosystem services, among others nutrient cycling, water
balance, and hydrological cycles. They should as well involve environmental
organisations, the private sector and the civil society in the conservation efforts
(Ometto et al., 2011).
24
3 Methodology
3.1 Description of the study area
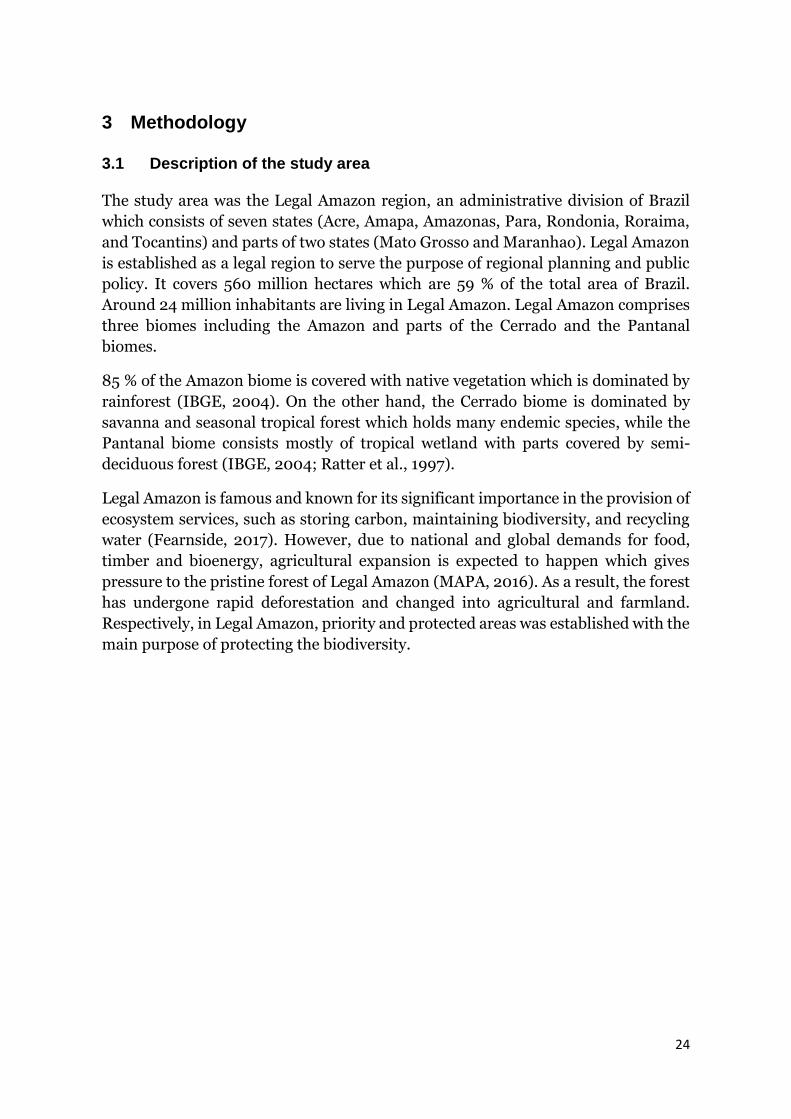
The study area was the Legal Amazon region, an administrative division of Brazil
which consists of seven states (Acre, Amapa, Amazonas, Para, Rondonia, Roraima,
and Tocantins) and parts of two states (Mato Grosso and Maranhao). Legal Amazon
is established as a legal region to serve the purpose of regional planning and public
policy. It covers 560 million hectares which are 59 % of the total area of Brazil.
Around 24 million inhabitants are living in Legal Amazon. Legal Amazon comprises
three biomes including the Amazon and parts of the Cerrado and the Pantanal
biomes.
85 % of the Amazon biome is covered with native vegetation which is dominated by
rainforest (IBGE, 2004). On the other hand, the Cerrado biome is dominated by
savanna and seasonal tropical forest which holds many endemic species, while the
Pantanal biome consists mostly of tropical wetland with parts covered by semi-
deciduous forest (IBGE, 2004; Ratter et al., 1997).
Legal Amazon is famous and known for its significant importance in the provision of
ecosystem services, such as storing carbon, maintaining biodiversity, and recycling
water (Fearnside, 2017). However, due to national and global demands for food,
timber and bioenergy, agricultural expansion is expected to happen which gives
pressure to the pristine forest of Legal Amazon (MAPA, 2016). As a result, the forest
has undergone rapid deforestation and changed into agricultural and farmland.
Respectively, in Legal Amazon, priority and protected areas was established with the
main purpose of protecting the biodiversity.
25
Figure 5. Legal Amazon in Brazil
3.2 Overview of the research methodology
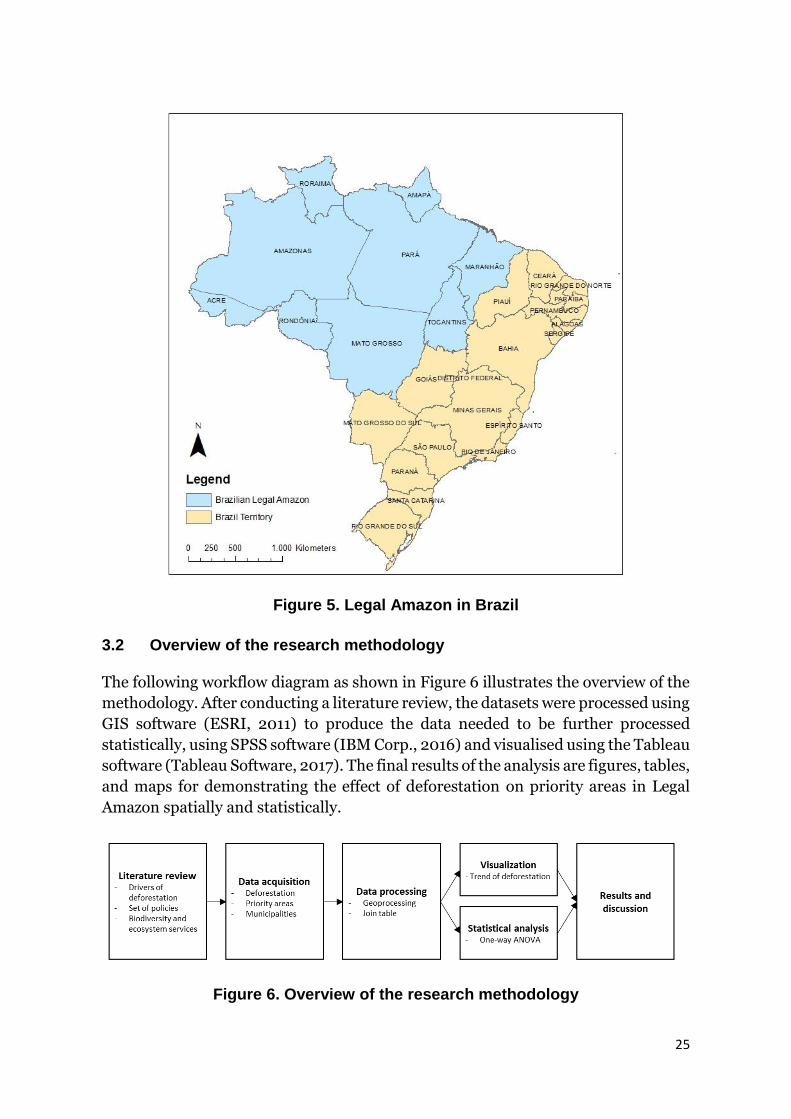
The following workflow diagram as shown in Figure 6 illustrates the overview of the
methodology. After conducting a literature review, the datasets were processed using
GIS software (ESRI, 2011) to produce the data needed to be further processed
statistically, using SPSS software (IBM Corp., 2016) and visualised using the Tableau
software (Tableau Software, 2017). The final results of the analysis are figures, tables,
and maps for demonstrating the effect of deforestation on priority areas in Legal
Amazon spatially and statistically.
Figure 6. Overview of the research methodology
26
3.3 Literature review
A literature review was conducted covering relevant scientific literature, policy
documents, governmental reports and websites as well as environmental
organisation reports. An extensive review was carried out to understand the history
of deforestation in Legal Amazon that is addressed by sets of diverse policies by
governments and initiatives by environmental organisations. In addition, a review of
governmental official reports was done to understand the establishment of priority
areas in Legal Amazon. Lastly, a review of scientific papers was done to comprehend
the method to address the efficiency of priority and protected areas in preventing
deforestation and protecting biodiversity.
3.4 Data acquisition
Four main datasets were used in the spatial and statistical analysis produced in this
study, including a) a dataset of priority areas for conservation in the Legal Amazon
conducted by the Brazilian Ministry of Environment (MMA) in 2006; b) a dataset of
deforestation of Legal Amazon from 2001 to 2014 that is yearly conducted by INPE
(Instituto Nacional de Pesquisas Espaciais) through the PRODES program; c) an
area of Legal Amazon by INPE and d) a dataset of municipalities in Legal Amazon by
the Brazilian Institute of Geography and Statistics (IBGE) in 2018. All datasets were
set in a projected coordinate system named South America Albers Equal Area Conic
so that the total area of the polygons could be calculated.
The priority areas dataset has 1,125 priority areas and consist of 616 protected areas
and 509 unprotected areas. The priority areas are displayed as polygons which are
features of closed shape. Each polygon has data of its biological importance and
location in the biome. The dataset was derived from the MMA website. On the other
hand, the municipalities’ datasets contained 1,046 municipalities’ polygons and was
derived from the IBGE website. Meanwhile, the area of the Legal Amazon dataset is
also displayed as polygon features showing border lines of Legal Amazon and also
states border lines inside Legal Amazon.
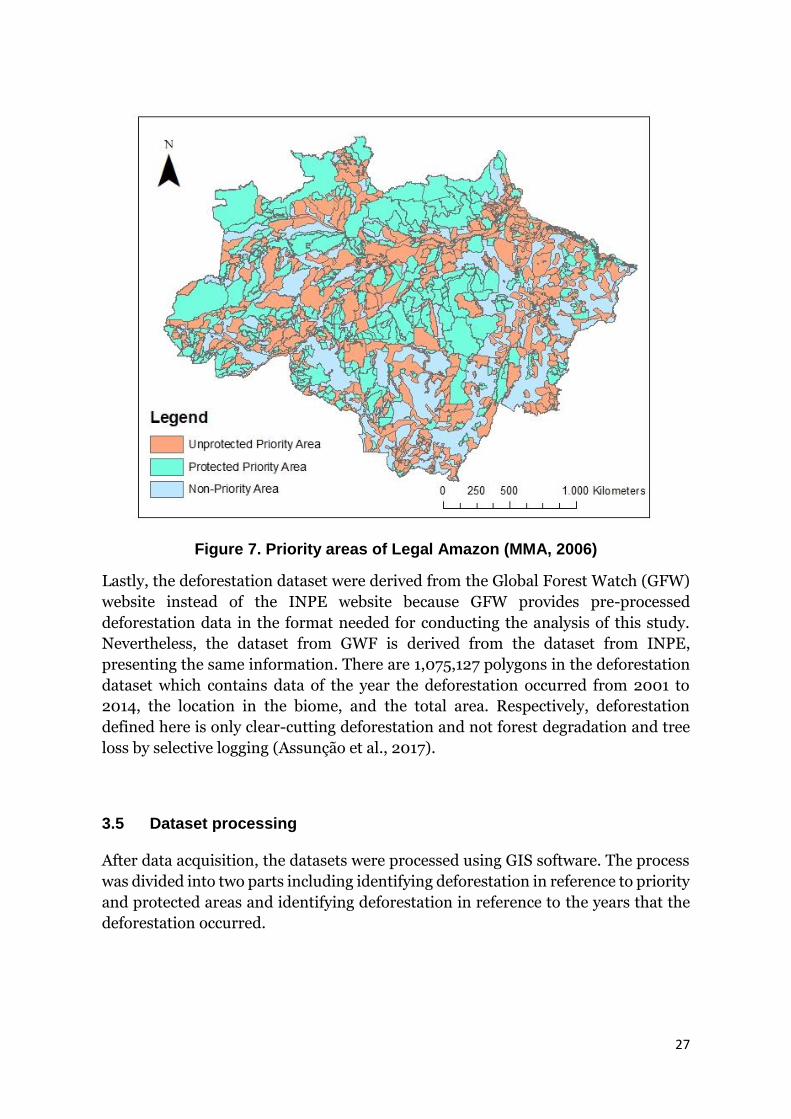
27
Figure 7. Priority areas of Legal Amazon (MMA, 2006)
Lastly, the deforestation dataset were derived from the Global Forest Watch (GFW)
website instead of the INPE website because GFW provides pre-processed
deforestation data in the format needed for conducting the analysis of this study.
Nevertheless, the dataset from GWF is derived from the dataset from INPE,
presenting the same information. There are 1,075,127 polygons in the deforestation
dataset which contains data of the year the deforestation occurred from 2001 to
2014, the location in the biome, and the total area. Respectively, deforestation
defined here is only clear-cutting deforestation and not forest degradation and tree
loss by selective logging (Assunção et al., 2017).
3.5 Dataset processing
After data acquisition, the datasets were processed using GIS software. The process
was divided into two parts including identifying deforestation in reference to priority
and protected areas and identifying deforestation in reference to the years that the
deforestation occurred.

28
3.5.1 Identifying deforestation in priority and protected areas
In identifying priority and protected areas with reference to deforestation, the
datasets of deforestation, priority areas, and municipalities were added into GIS
software. The overall dataset processing of this part is shown in Figure 8.
Figure 8. Data processing for identification priority and protected areas in
reference to deforestation
The deforestation dataset which consists of deforestation from 2001 to 2014 was
exported based on year. Exporting data works by allowing the user of GIS software
to optionally choose specific data, change the format of the data, and produce new
datasets. In this study, data was exported by choosing data based on year (Figure 9).
As a result, 14 layers of deforestation from year 2001 to 2014 were produced.
However, since priority areas used in this study was established in 2006, only
deforestation datasets from 2006 to 2014 were used.

29
Figure 9. Exporting deforestation data based on years
Hereafter, the layer of deforestation of each year and priority areas dataset were set
as input features for the geometric intersection function. The intersection function
works by producing overlapping features or portions of features in both layers as the
output feature class. As a result, 9 layers of deforestation that occurred only in
priority areas were produced. An example of deforestation that occurred in priority
areas in 2006 along with its attribute table is displayed in Figure 10. The
deforestation is displayed as polygons. Then the area of these polygons were
calculated in km2 using the calculate geometry function.
Figure 10. The deforestation layer in priority areas in 2006 with its attribute
table

30
Then, the tables of each layer were extracted into a database file format which is
needed so that all the tables can be joined in the next step. A database file is one of
the file types in GIS which only contains tables. Next, the tables were joined into a
table of priority areas dataset using the join function. Joining data works by
appending the fields of one table to those of another through an attribute or field
common to both tables. In this case, the common field was ID of priority areas and
the tables of deforestation from 2006 to 2014 were joined into a table of priority
areas. As a result, the map and table of deforestation from 2006 to 2014 in each
polygon of the priority areas were produced. Table 1 shows a slice of 20 records from
the final dataset.
Table 1. A slice of the final table of deforestation in priority areas
A similar procedure was done to produce a map and table of deforestation in non-
priority areas. In this case, the municipalities’ boundaries was used. The
municipalities’ dataset was processed together with the priority areas dataset with
the erase function in GIS to produce polygons in non-priority areas as shown in
Figure 11. Erase works by overlaying the polygons of the erase coverage with the
features of the input coverage. The portions of the input coverage features outside
the erase polygons outer boundaries were copied to the output coverage. As a result,
a layer of polygons outside priority areas was produced.
Figure 11. The process of creating polygons outside the priority areas using
the erase function
31
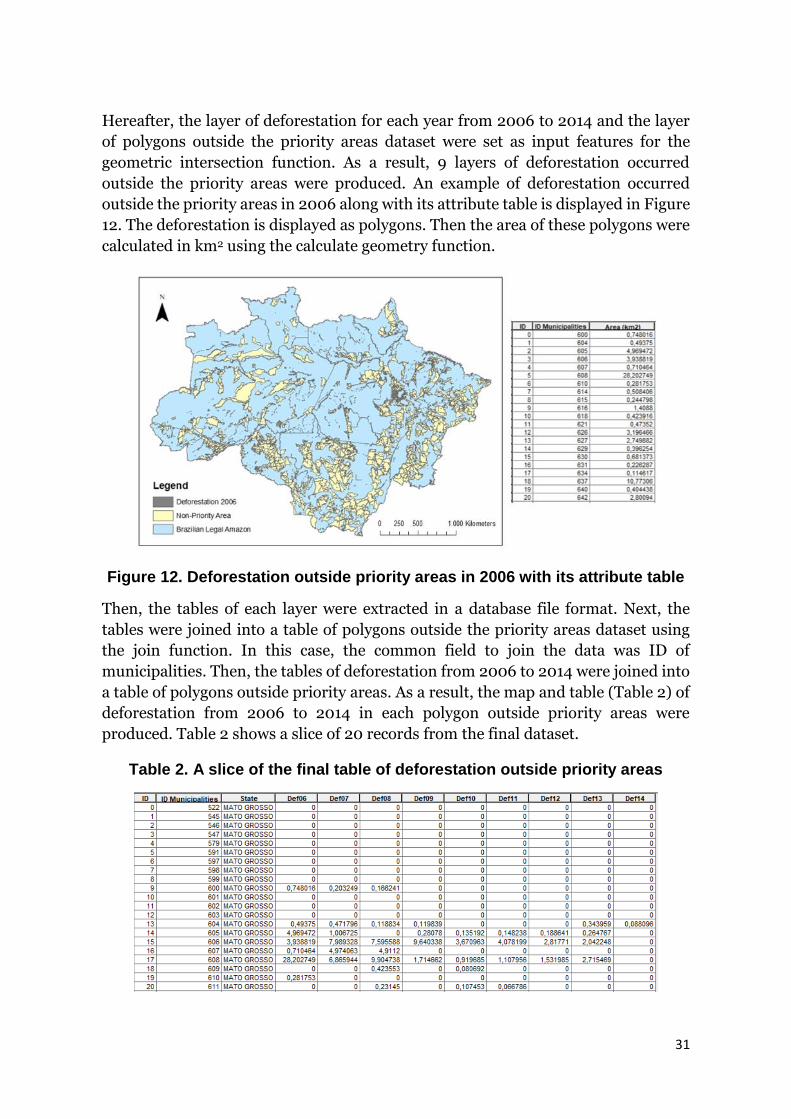
Hereafter, the layer of deforestation for each year from 2006 to 2014 and the layer
of polygons outside the priority areas dataset were set as input features for the
geometric intersection function. As a result, 9 layers of deforestation occurred
outside the priority areas were produced. An example of deforestation occurred
outside the priority areas in 2006 along with its attribute table is displayed in Figure
12. The deforestation is displayed as polygons. Then the area of these polygons were
calculated in km2 using the calculate geometry function.
Figure 12. Deforestation outside priority areas in 2006 with its attribute table
Then, the tables of each layer were extracted in a database file format. Next, the
tables were joined into a table of polygons outside the priority areas dataset using
the join function. In this case, the common field to join the data was ID of
municipalities. Then, the tables of deforestation from 2006 to 2014 were joined into
a table of polygons outside priority areas. As a result, the map and table (Table 2) of
deforestation from 2006 to 2014 in each polygon outside priority areas were
produced. Table 2 shows a slice of 20 records from the final dataset.
Table 2. A slice of the final table of deforestation outside priority areas

32
Finally, the dataset of deforestation inside and outside priority areas were combined
and became the final dataset containing 616 protected areas, 509 unprotected areas,
and 504 non-priority areas. Information about the biological importance, total area
in km2, and total deforestation of each year from 2006 to 2014 were attached to each
polygon. Then, the final dataset were converted to an excel file (Appendix 1) and
processed further in SPSS software which will be explained in Subsection 3.6.
3.5.2 Identifying deforestation based on years
In identifying deforestation with reference to the year the deforestation occurred, the
dataset of deforestation and priority areas were added into the GIS software. The
overall dataset processing of this part is shown in Figure 13.
Figure 13 Data processing for identifying deforestation
33
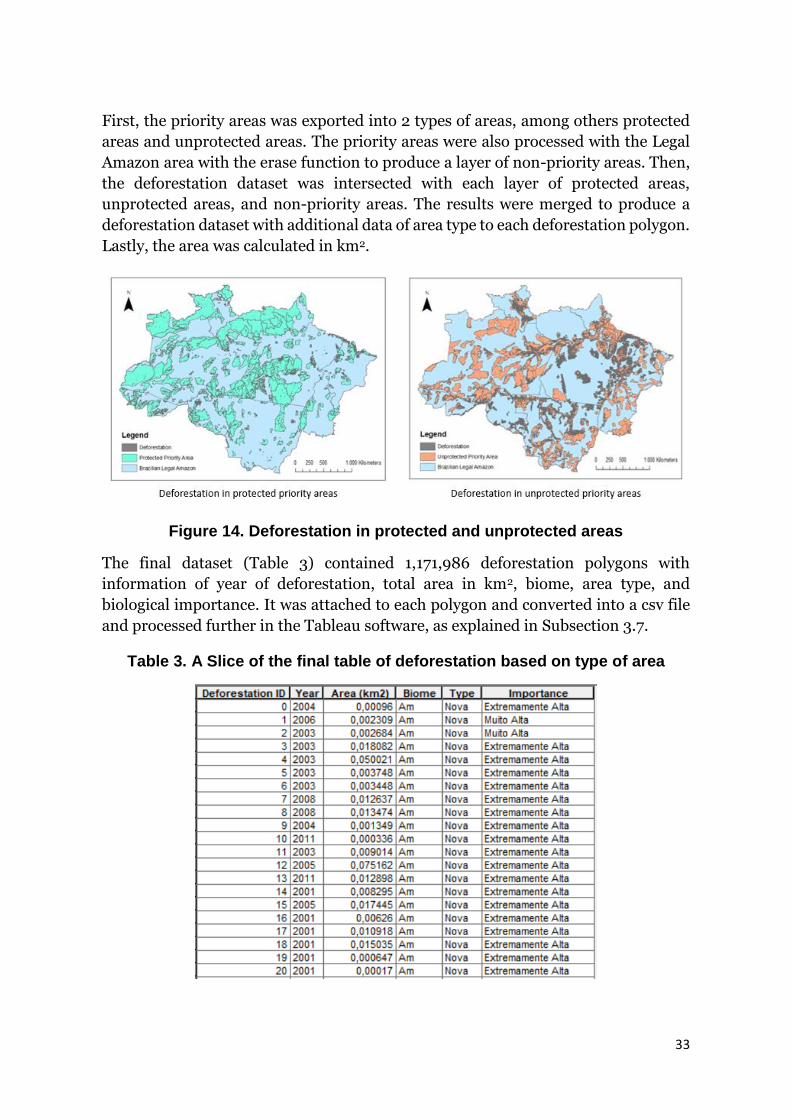
First, the priority areas was exported into 2 types of areas, among others protected
areas and unprotected areas. The priority areas were also processed with the Legal
Amazon area with the erase function to produce a layer of non-priority areas. Then,
the deforestation dataset was intersected with each layer of protected areas,
unprotected areas, and non-priority areas. The results were merged to produce a
deforestation dataset with additional data of area type to each deforestation polygon.
Lastly, the area was calculated in km2.
Figure 14. Deforestation in protected and unprotected areas
The final dataset (Table 3) contained 1,171,986 deforestation polygons with
information of year of deforestation, total area in km2, biome, area type, and
biological importance. It was attached to each polygon and converted into a csv file
and processed further in the Tableau software, as explained in Subsection 3.7.
Table 3. A Slice of the final table of deforestation based on type of area

34
3.6 Analysis of variance (ANOVA)
An analysis of variance (ANOVA) was performed with the SPSS software to analyse
the data resulting from the data processing in the GIS software. ANOVA was used to
test whether there are statistically significant differences between the means of two
or more independent variables in the dependent variable. ANOVA works by
examining the variance between the data samples to variances within particular
samples. In this study, one-way ANOVA was applied to one independent variable
and one dependent variable. The workflow diagram as shown in Figure 15 illustrates
the steps of conducting one-way ANOVA.
Figure 15. Overview of the ANOVA workflow
3.6.1 Defining independent and dependent variables
In this study, three one-way ANOVA analyses were conducted. First, one-way
ANOVA was conducted to see whether there are statistically significant differences
between deforestation in protected, unprotected, and non-priority areas. The dataset
from the data processing based on type of area was used, which contained 1,629 areas
(616 protected areas, 509 unprotected areas, and 504 non-priority areas).
Information about the biological importance, total area in km2, and total
deforestation of each year from 2006 to 2014 were attached to each areas.
In order for the deforestation of each areas to be compared in one-way ANOVA,
deforestation density (𝐷𝑒𝑓𝑑𝑒𝑛) was established. Deforestation density is defined as
the density of total deforestation from 2006 to 2014 to the total area of the polygon
based on type of area. The equation is stated as:
𝐷𝑒𝑓𝑑𝑒𝑛 = 𝑇𝑜𝑡𝑎𝑙 𝑑𝑒𝑓𝑜𝑟𝑒𝑠𝑡𝑎𝑡𝑖𝑜𝑛2006−2014 (𝑘𝑚2)
𝐴𝑟𝑒𝑎 𝑜𝑓 𝑝𝑜𝑙𝑦𝑔𝑜𝑛 (𝑘𝑚2) × 1000
35
The deforestation density was multiplied by 1000 so that the value is not too small
and can be analysed in SPSS. As a result, there are 1,629 deforestation density values
calculated for each type of area. The deforestation density was set as a dependent
variable while the type of area was the independent variable.
Regarding the second analysis, one-way ANOVA was conducted to see whether there
are statistically significant differences between deforestation in areas based on
importance (high, very high, extremely high, and no data). In this second analysis,
deforestation density was also used as the dependent variable while biological
importance was the independent variable. The dataset from data processing based
on type of area was used, which contained of 1,125 areas (249 areas of high
importance, 270 areas of very high importance, 590 areas of extremely high
importance, and 16 areas of no data) with information about the biological
importance, total area in km2, and total deforestation of each year from 2006 to 2014
attached to each area.
One-way ANOVA was conducted to analyse the impact of priority areas
establishment in 2006 in preventing deforestation. This aim was answered by
analysing the difference of deforestation in 2006 as the year of priority areas
establishment to the latest deforestation data in 2014. In this third analysis,
deforestation density in 2006 and 2014 were established. Then, deforestation
density in 2014 was reduced with deforestation density in 2006. The equation is
stated as:
𝐷𝑒𝑓𝑑𝑒𝑛2014− 𝐷𝑒𝑓𝑑𝑒𝑛2006
= (𝑇𝑜𝑡𝑎𝑙 𝑑𝑒𝑓𝑜𝑟𝑒𝑠𝑡𝑎𝑡𝑖𝑜𝑛2014 (𝑘𝑚2)
𝐴𝑟𝑒𝑎 𝑜𝑓 𝑝𝑜𝑙𝑦𝑔𝑜𝑛 (𝑘𝑚2) × 1000) − (
𝑇𝑜𝑡𝑎𝑙 𝑑𝑒𝑓𝑜𝑟𝑒𝑠𝑡𝑎𝑡𝑖𝑜𝑛2006 (𝑘𝑚2)
𝐴𝑟𝑒𝑎 𝑜𝑓 𝑝𝑜𝑙𝑦𝑔𝑜𝑛 (𝑘𝑚2) × 1000)
Finally, one-way ANOVA was run with the difference of deforestation density in year
2014 with year 2006 as the dependent variable and type of area as the independent
variable. The dataset used in this analysis was the same as the dataset from the first
analysis. The summary of the one-way ANOVA analysis is shown in Table 4.
36
Table 4. Conducted one-way ANOVA
Analysis Independent variable Dependent variable
Deforestation trend based on
type of area
Type of area (protected,
unprotected, and non-priority
area)
Deforestation density
Deforestation trend based on
biological importance of the
area
Importance of area (high, very
high, extreme high, and no
data)
Deforestation density
Deforestation trend based on
difference between
deforestation density in year
2014 and 2006
Type of area (protected,
unprotected, and non-priority
area)
Difference between
deforestation density of 2014
and deforestation density of
2006
3.6.2 Checking assumptions
Three assumptions of the data samples must be fulfilled before one-way ANOVA can
be conducted: (1) the samples are normally distributed, (2) the samples have
homogeneity of variance, and (3) the samples are independent of one another and
randomly selected. The final dataset was checked and fulfilled the assumptions.
3.6.3 Stating null and alternative hypothesis
After checking the assumptions, the null and alternative hypothesis were made. The
null hypothesis (𝐻0) states that the population means are equal as stated:
𝐻0 ∶ 𝜇1 = 𝜇2 = 𝜇3
The alternative hypothesis (𝐻𝑎) is the opposite of the null hypothesis which states at
least there is one mean of the population which is not statistically equal as stated:
𝐻𝑎 ∶ 𝐴𝑡 𝑙𝑒𝑎𝑠𝑡 𝑜𝑛𝑒 𝑚𝑒𝑎𝑛 𝑖𝑠 𝑛𝑜𝑡 𝑠𝑡𝑎𝑡𝑖𝑠𝑡𝑖𝑐𝑎𝑙𝑙𝑦 𝑒𝑞𝑢𝑎𝑙
3.6.4 Calculating the test statistic
The next step was calculating the test statistic concerning the variance between the
data samples to variances within particular samples. The summary of the test
statistic calculation is shown in Table 5.
37
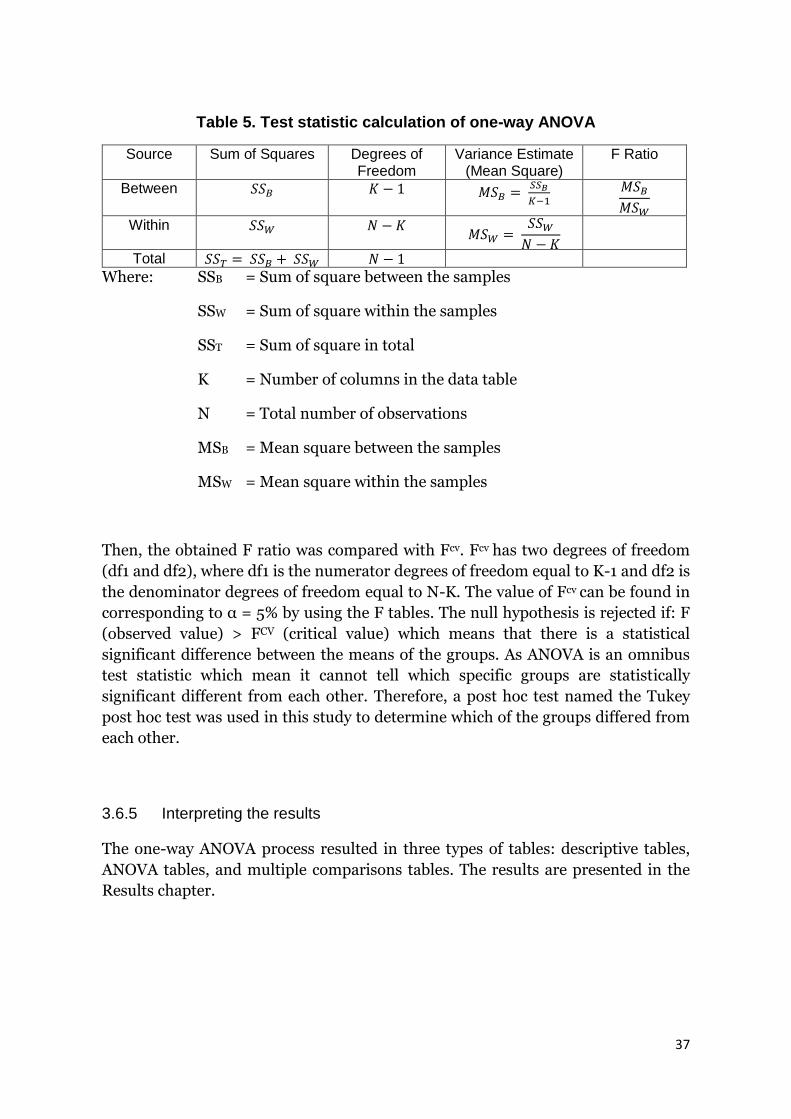
Table 5. Test statistic calculation of one-way ANOVA
Source Sum of Squares Degrees of Freedom
Variance Estimate (Mean Square)
F Ratio
Between 𝑆𝑆𝐵 𝐾 − 1 𝑀𝑆𝐵 = 𝑆𝑆𝐵
𝐾−1 𝑀𝑆𝐵
𝑀𝑆𝑊
Within 𝑆𝑆𝑊 𝑁 − 𝐾 𝑀𝑆𝑊 =
𝑆𝑆𝑊
𝑁 − 𝐾
Total 𝑆𝑆𝑇 = 𝑆𝑆𝐵 + 𝑆𝑆𝑊 𝑁 − 1
Where: SSB = Sum of square between the samples
SSW = Sum of square within the samples
SST = Sum of square in total
K = Number of columns in the data table
N = Total number of observations
MSB = Mean square between the samples
MSW = Mean square within the samples
Then, the obtained F ratio was compared with Fcv. Fcv has two degrees of freedom
(df1 and df2), where df1 is the numerator degrees of freedom equal to K-1 and df2 is
the denominator degrees of freedom equal to N-K. The value of Fcv can be found in
corresponding to α = 5% by using the F tables. The null hypothesis is rejected if: F
(observed value) > FCV (critical value) which means that there is a statistical
significant difference between the means of the groups. As ANOVA is an omnibus
test statistic which mean it cannot tell which specific groups are statistically
significant different from each other. Therefore, a post hoc test named the Tukey
post hoc test was used in this study to determine which of the groups differed from
each other.
3.6.5 Interpreting the results
The one-way ANOVA process resulted in three types of tables: descriptive tables,
ANOVA tables, and multiple comparisons tables. The results are presented in the
Results chapter.
38
3.7 Visualization with Tableau
The Tableau software was used to produce interactive visualizations and tables of the
data resulting from the data processing in GIS. The results are presented in the
Results chapter.

39
4 Results
This chapter presents the results of visualization using the Tableau software and the
one-way ANOVA results using the SPSS software.
4.1 Deforestation trend based on area type
Figure 16 illustrates the deforestation in protected priority areas, unprotected
priority areas and non-priority areas from year 2001 to 2014. Overall, the
deforestation increased from 2001 and reached the most peaked deforestation in
2004. Afterwards, it decreased drastically from 2004 to 2006 although it increased
a little in 2008 before deforestation decreased and stabilized from 2009 to 2014.
Figure 16. Deforestation trend based on type of area
Half of the deforestation from 2001 to 2014 occurred in non-priority area as
illustrated in Table 6, where 94,260 km2 of forest had been deforested. Without land-
use restrictions, deforestation that reached to 43% still took place in unprotected
priority areas. On the other hand, protected areas with land-use restrictions are the
area with the lowest occurred deforestation which is only 7 % of the total
deforestation.

40
Table 6. Deforestation based on type of area
Year Deforestation (km2/year)
Protected priority areas
Unprotected priority areas
Non-priority areas
2001 859 7,484 11,176
2002 1,456 9,577 13,622
2003 1,695 10,863 13,567
2004 2,043 11,753 13,086
2005 1,399 10,422 11,882
2006 730 4,975 5,171
2007 985 5,116 5,362
2008 997 6,423 5,934
2009 716 2,801 3,076
2010 619 3,161 2,551
2011 560 2,551 2,598
2012 462 2,071 1,913
2013 621 2,387 2,386
2014 421 2,072 1,936
SUM 13,563 81,656 94,260
% 7% 43% 50%
Furthermore, the ANOVA analysis shows that there is a significant difference of
deforestation density based on type of area. This one-way ANOVA produced three
tables including descriptive, ANOVA, and multiple comparisons table. Table 7
displays that protected priority areas, unprotected priority areas, and non-priority
areas had different mean values of deforestation density. Non-priority areas had the
highest deforestation density (94) which is very high compare to the deforestation
density of unprotected priority areas (16,2) and even more to protected priority areas
(7).
Table 7. Descriptive table of first analysis of one-way ANOVA
The ANOVA analysis displayed in Table 8 shows that there is a statistically
significant difference between types of area determined by one-way ANOVA
(F(2,1626) = 42.019, p<0.001) shown by the lower significance value (p<0.001)
which was below 0.05.

41
Table 8. ANOVA table of the first analysis one-way ANOVA
Furthermore, a Tukey post hoc test revealed which areas differed from each other.
The result as shown in Table 9 shows statistically significant differences in
deforestation density between protected priority areas and non-priority areas
(p<0.05) as well as between unprotected priority areas and non-priority areas
(p<0.05). However, there are no significant differences in deforestation density
between protected priority areas and unprotected priority areas (p>0.05) as shown
in Table 9.
Table 9. Multiple comparisons table of the first analysis with one-way ANOVA
4.2 Deforestation trends and the biological importance of priority areas
The diagram in Figure 17 illustrates the deforestation trend in relation to the
biological importance of priority areas. Overall, deforestation that occurred in areas
of very high and extremely high importance is more or less similar while
deforestation occurred less in areas of high importance and almost none in areas
with no data of importance.

42
Figure 17. Deforestation trends based on areas of biological importance
Most of deforestation occurred in areas with very high importance (43 %) and
extremely high importance (38 %). On the other hand, deforestation occurred only
by 17 % in areas with high importance and 2 % in areas with no data of importance
as shown in Table 10.
Table 10. Deforestation trend based on areas of biological importance
Year Deforestation (km2/year)
High Very High Extremely High No Data
2001 1,895 3,398 2,983 66
2002 2,436 4,638 3,905 54
2003 1,960 5,547 4,934 117
2004 1,957 6,470 5,181 187
2005 2,019 5,112 4,503 187
2006 1,018 2,438 2,132 116
2007 1,183 2,508 2,302 108
2008 1,255 2,986 3,077 102
2009 555 1,559 1,313 90
2010 622 1,303 1,775 80
2011 406 1,352 1,265 87
2012 450 945 1,011 127
2013 397 1,251 1,205 155
2014 362 1,086 921 124
SUM 16,515 40,593 36,507 1,600
% 17% 43% 38% 2%

43
Furthermore, the second analysis with one-way ANOVA shows that there is a
significant difference of deforestation density based on biological importance of the
area. This one-way ANOVA produced three tables including descriptive, ANOVA,
and multiple comparisons tables. Table 11 displays that areas of high, very high,
extremely high, and no data of importance had different mean values of
deforestation density. Deforestation density of areas with high (15.57) and very
importance (15.19) was more or less similar. The deforestation density of areas with
extremely high (7.68) and no data (7.32) of importance had lower value than the
areas mentioned before.
Table 11. Descriptive table of the second analysis with one-way ANOVA
The ANOVA analysis displayed in Table 12 shows that there is a statistically
significant difference between areas of different biological importance determined
by one-way ANOVA (F(3,1121)=5.979, p<0.001) shown by a lower significance value
(p<0.001) which is below 0.05.
Table 12. ANOVA table of the second analysis by one-way ANOVA
Furthermore, the Tukey post hoc test revealed which areas differed from each other.
The result as shown in Table 13 shows statistically significant differences in
deforestation density between areas of high and extremely high importance
(p=0.003) and areas of very high and extremely high importance (p=0.004).
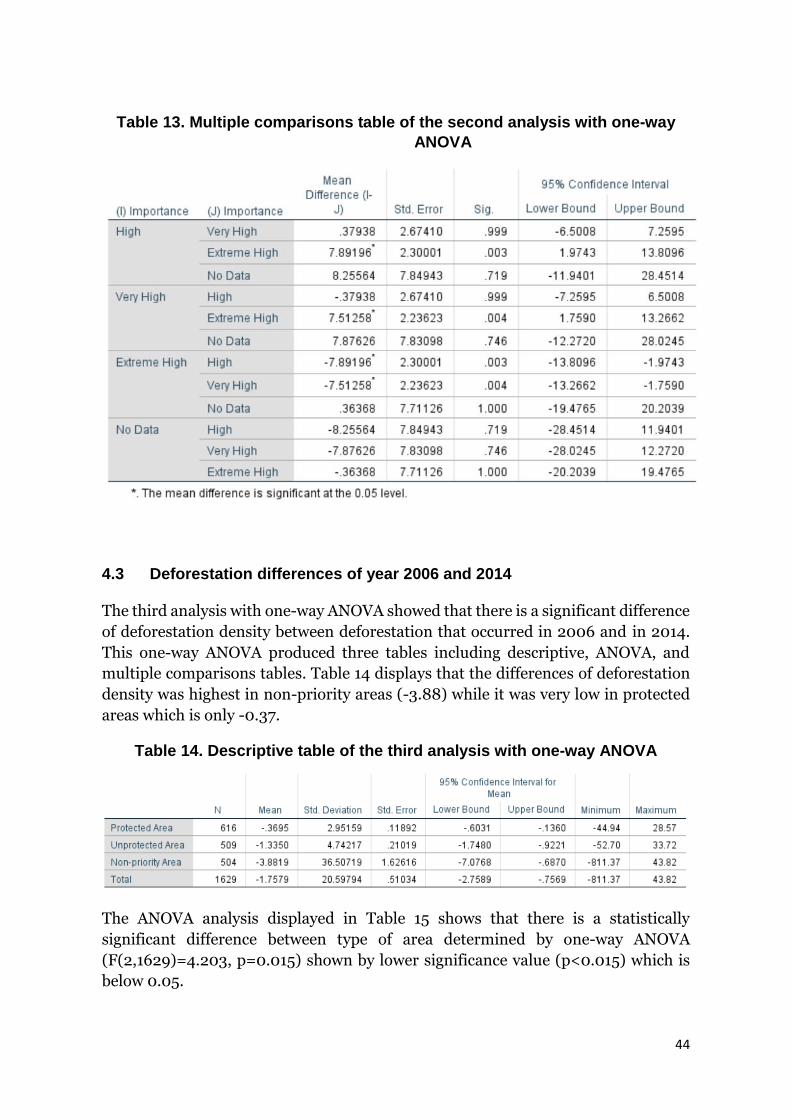
44
Table 13. Multiple comparisons table of the second analysis with one-way
ANOVA
4.3 Deforestation differences of year 2006 and 2014
The third analysis with one-way ANOVA showed that there is a significant difference
of deforestation density between deforestation that occurred in 2006 and in 2014.
This one-way ANOVA produced three tables including descriptive, ANOVA, and
multiple comparisons tables. Table 14 displays that the differences of deforestation
density was highest in non-priority areas (-3.88) while it was very low in protected
areas which is only -0.37.
Table 14. Descriptive table of the third analysis with one-way ANOVA
The ANOVA analysis displayed in Table 15 shows that there is a statistically
significant difference between type of area determined by one-way ANOVA
(F(2,1629)=4.203, p=0.015) shown by lower significance value (p<0.015) which is
below 0.05.

45
Table 15. ANOVA table of the third analysis with one-way ANOVA
Furthermore, a Tukey post hoc test revealed which areas differed from each other.
The result as shown in Table 16 shows statistically significant differences in
deforestation density between protected and non-priority areas (p=0.013).
Table 16. Multiple comparisons table of the third analysis with one-way
ANOVA

46
5 Discussion
This study focused on analysing the impact of priority and protected areas by the
deforestation trend in Legal Amazon. Furthermore, this study also analysed the
impact of deforestation in areas based on biological importance. Finally, analysis
regarding the implication of priority areas establishment was also conducted.
5.1 Deforestation trends analysis
Priority and protected areas are areas of high biodiversity value, which are
established to conserve biodiversity and maintain economic growth in a sustainable
way (CBD, 2007). While protected areas under SNUC Law no. 9,985 are included in
public lands, priority areas under Decree no. 5,092 in 2006 are to a large extent are
included in undesignated lands (Damasceno et al., 2017; Damasceno, 2016). This
undesignated land has unclear land-use rights with high rates of illegal deforestation
although most of the areas contained rich biodiversity (Damasceno et al., 2017;
Damasceno, 2016). Therefore, in a way to guide the creation of protected areas,
priority areas were established. Protecting a legalizing is crucial considering that
clear ownership of land enable more intensive monitoring by the government and
indigenous people (Damasceno et al., 2017; Nepstad et al., 2006; Soares-Filho et al.,
2010).
Differences in regulation and ownership of land between protected priority areas,
unprotected priority areas, and non-priority areas resulted in different deforestation
trends in each area. The results demonstrates that there is not much difference
between total deforestation in unprotected areas (77,041 km2, 42 %) and non-
priority areas (94,260 km2, 51 %). In contrast, total deforestation in protected areas
was much smaller (13,563 km2, 7%) than unprotected and non-priority areas. This
indicates that protected areas have impact while priority areas that are unprotected
do not bring much impact in preventing deforestation.
However, based on deforestation density, priority areas do have an impact. The
mean of deforestation density in unprotected priority areas was 16.2 which is 5.8
times lower than in non-priority area that had a value of 94. Further, deforestation
density in protected areas was 7 which is 2 times lower than deforestation density in
unprotected areas. It can be concluded that priority areas have an impact in
preventing deforestation. Even so, protected areas have more significant impact in
slowing down deforestation. These results converge with previous research by
Nepstad (2014) and Soares-Filho et al. (2010). Nepstad (2014) argued that protected
areas expansion reduced the area of undesignated lands while Soares-Filho et al.
(2010) suggested that expansion of protected areas led to 37 % of reduction in
deforestation. The most likely reason for the significant impact of protected areas
compared to priority areas is that protected areas are monitored more intensively by
the government and indigenous people. This makes it more difficult for deforesters.
47
In contrast, the priority areas that are mostly undesignated lands give more
opportunities for deforesters, who promote deforestation in this areas. Thus, highly
biodiverse areas under priority areas for biodiversity conservation may need to be
converted to protected areas to facilitate surveillance and ensure its preservation of
nature in these regions.
The spatial analysis showed that deforestation was concentrated in non-priority
areas that surround the priority and protected areas. This finding is consistent with
studies by Armsworth et al. (2006) and Wittemyer et al. (2008) who stated that
deforestation still occurred and only moved to adjacent non-priority areas. Even
though protected areas are restricted from land-use, there are still small patches of
deforestation. Deforestation that occurred in restricted land-use of protected areas
shows the necessity to increase the monitoring in these vast areas and also increase
the integration of governmental actors (the army, police, and agencies) as well as
indigenous people (References).
Based on total deforestation, 43 % deforestation occurred in areas of very high
importance and 38 % in areas of extremely high importance. On the other hand,
deforestation occurred less in areas of high importance (17 %). Thus, deforestation
affected areas of high biodiversity value regardless the biological importance status
of the areas. Furthermore, based on deforestation density, deforestation density in
areas of extremely high importance (7.68) was 2 times lower than in areas of high
(15.57) and very high importance (15.19). It can be concluded that deforestation
affected more in areas with less biodiversity value.
Finally, the impact of Decree No 5,092 in 2006 was analysed by calculating the
difference of deforestation density between deforestation that occurred in 2006 and
2014. It is assumed that if priority areas are effective, the difference of deforestation
density in priority areas will be higher than in non-priority areas. However, the
results demonstrated that the difference of deforestation density was highest in non-
priority areas (-3.88) while it was very low in protected areas which is only -0.37.
The most likely reason for these results are that priority areas are not necessarily the
only factor that affected the drop of deforestation. Nepstad (2014) stated that the
drop of deforestation occurred because of interconnectedness of supply chain
intervention, enforcement of law, economic conditions as well as the expansion of
protected areas.
It is worth highlighting that deforestation is still behind the Brazilian government
target, as Brazil has set a target in the Conference of Parties of the United Nations
Framework Convention on Climate Change in 2009 to decrease the national GHG
emissions by 2020 (Jean et al., 2011). This target can be accomplished by reducing
deforestation in Legal Amazon by 80 % over a decade (Jean et al., 2011). Therefore,
the regulation of priority and protected areas must be evaluated and improved in the
future.

48
5.2 Limitations
This study had several limitations. Firstly, this study only considered deforestation
as defined by the PRODES system even though PRODES can only detect
deforestation as large as 6.25 hectares. This underestimates the loss through forest
degradation, selective logging, and decline of conservation capacity (Nepstad et al.,
1999). Secondly, the simple inside-outside comparison conducted in this study may
have overestimated the effect of priority and protected areas (Andam et al., 2008).
This study do not consider that location of priority and protected areas influences
the chance of deforestation. Remote areas are and areas surrounded by other areas
are less likely to be deforested even without priority and protected areas
establishment (Pressey et al., 1993; DeFries et al., 2005). Furthermore, this kind of
establishments can displace the deforestation to non-priority areas as Joppa et al.
(2008) stated as ‘neighbourhood leakage’.
5.3 Suggestions for future work
Changes in deforestation trends in Legal Amazon can be attributed to various drivers
such as highway construction, agricultural intensification, cattle ranching and
soybean expansion, land tenure establishment, and policy failures (Jean et al., 2011).
The complex nature and interconnectedness between these drivers has resulted in
widely varied of deforestation rates over the decades. However, this study only
considered priority and protected areas establishment as a driver that affect
deforesters in choosing the type of area to be deforested while this might not be the
case in actuality. Nevertheless, this study is able to draw deforestation trends in
accordance to priority and protected areas from 2001 to 2014. However, this study
can be further developed by considering other drivers which will become a more
representative input as so produce more actual results. Otherwise, this study can also
analyse deforestation in priority and protected areas while at the same time
considering the size, the location, the purpose, and the responsible party of the areas
which should produce a better assessment of the impacts of priority and protected
areas.

49
6 Conclusions
This thesis provided series of spatial and statistical analysis to analyse the impact of
priority and protected areas on deforestation trends in the Brazilian Legal Amazon.
From the outcomes of this thesis, it is possible to conclude that deforestation had
been statistically more intensive in non-priority areas when compared with priority
areas. Furthermore, land-use restrictions in protected areas had more impact
compared to unprotected areas.
In addition, the statistical analysis of deforestation according to biological
importance of the priority areas showed that deforestation had been more intensive
in areas classified as having lower biological importance. Yet, substantial tracts of
forest had been converted within areas of high biological importance. Areas of
extremely high importance for biodiversity had 2 times lower deforestation density
than areas of high and very high importance.
Nonetheless, the statistical analysis regarding implication of Decree no. 5,092 in
2006 showed that the difference in deforestation density that occurred in 2006 and
2014 was highest in non-priority areas while it was very low in protected areas. It can
be concluded that priority areas not necessarily affected the deforestation drop but
might this may have been caused by other policies. This implies that the regulation
of priority and protected areas can be improved in the future. Therefore, the creation
of protected areas constitute a key towards the preservation of biodiversity.


51
References
Adario, P., 2016. The soy moratorium, 10 years on: How one commitment is stopping
Amazon destruction? Amsterdam, the Netherlands: Greenpeace International.
Andam, K.S., Ferraro, P.J., Pfaff, A., Sanchez-Azofeifa, G.A. & Robalino, J., 2008.
Measuring the effectiveness of protected areas networks in reducing
deforestation. Proceedings of the National Academy of Sciences USA, 105,
16089–16094.
Arima EY, Barreto P, Araújo E, Soares-Filho B., 2014. Public policies can reduce
tropical deforestation: Lessons and challenges from Brazil. Land Use Policy
41:465–473.
Armsworth, P.R., Daily, G.C., Kareiva, P. & Sanchirico, J.N., 2006. Land market
feedbacks can undermine biodiversity conservation. Proceedings of the
National Academy of Sciences USA, 103, 5403–5408.
Assunção J, Gandour C, Rocha R, 2015. Deforestation slowdown in the Brazilian
Amazon: prices or policies? Environment and Development Economics, 20,
697-722.
Assunção, J., Gandour, C., Pessoa, P., & Rocha, R., 2017. Property-level assessment
of change in forest clearing patterns: The need for tailoring policy in the
Amazon. Land Use Policy, 66, 18-27. doi:10.1016/j.landusepol.2017.04.022
Barlow, J., Lennox, G.D., Ferreira, J., Berenguer, E., Lees, A.C., Nally, R.M.,
Thomson, J.R., Ferraz, S.F.d.B., Louzada, J., Oliveira, V.H.F., Parry, L., Ribeiro
de Castro Solar, R., Vieira, I.C.G., Aragão, L.E.O.C., Begotti, R.A., Braga, R.F.,
Cardoso, T.M., Jr, R.C.d.O., Souza Jr, C.M., Moura, N.G., Nunes, S.S., Siqueira,
J.V., Pardini, R., Silveira, J.M., Vaz-de-Mello, F.Z., Veiga, R.C.S., Venturieri, A.,
Gardner, T.A., 2016. Anthropogenic disturbance in tropical forests can double
biodiversity loss from deforestation. Nature 535, 144-147.
Bergen, M., 2018. Stopping deforestation in the Amazon by 2020? Human Nature –
Conservation International Blog. Available at:
https://blog.conservation.org/2016/08/stopping-deforestation-in-the-
amazon-by-2020-its-possible/ [Accessed 29 Jun. 2018].
Brasil, 2012. Brazilian Native Vegetation Protection Law "LEI Nº 12.651, DE 25 DE
MAIO DE 2012", Law Nº 12.651, 25-May-2012, Brasilia, Brazil.
Castro, R. and Albernaz, A., 2016. Consistency and use of information about threats
in the participatory process for identification of priority conservation areas in
the Brazilian Amazon. Journal for Nature Conservation, 30, pp.44-51.
52
CBD, 2007. Review of implementation of the programme of work on protected areas
for the period 2004–2007 UNEP/CBD/WGPA/2/2.
Dalla-Nora E.L., de Aguiar A.P.D., Lapola D.M. and Woltjer G., 2014. Why have land
use change models for the Amazon failed to capture the amount of
deforestation over the last decade? Land Use Policy 39:403–411.
Damasceno, R., 2016. Insecure land rights in Brazil: Consequences for rural areas
and challenges for improvement. In: Núcleo de Avaliacao de Politicas
Climaticas. PUC-Rio, Climate Policy Initiative.
Damasceno, R., Chiavar, J., & Lopes, C. L., 2017. Evolution of land rights in Brazil.
In: Nucleo de Avaliacao de Politicas Climaticas. PUC-Rio, Climate Policy
Initiative.
Davidson EA, et al., 2012. The Amazon basin in transition. Nature 481(7381):321–
328.
DeFries, R., Hansen, A., Newton, A. and Hansen, M., 2005. Increasing Isolation of
Protected Areas in Tropical Forests Over the Past Twenty Years. Ecological
Applications, 15(1), pp.19-26.
ESRI, 2011. ArcGIS desktop, Release 10 (Tenth edition). Redlands, CA:
Environmental Systems Research Institute.
Fearnside, P., 2017. Deforestation of the Brazilian Amazon. Oxford Research
Encyclopedia of Environmental Science.
Fearnside, P.M., 2009. Carbon benefits from Amazonian forest reserves: Leakage
accounting and the value of time. Mitigation and Adaptation Strategies for
Global Change 14(6):557-567. [doi: 10.1007/s11027-009-9174-9].
Foley JA, Defries R, Asner GP et al., 2005. Global consequences of land use. Science
309, 570–574.
Freitas, F. L. M., 2017. Brazilian land use policies and the development of ecosystem
services. Stockholm: KTH Royal Institute of Technology.
Freitas, F. L. M., Englund, O., Sparovek, G., Berndes, G., Guidotti, V., Pinto, L. F. G.,
& Mörtberg, U., 2018. Who owns the Brazilian carbon? Global change biology.
doi:10.1111/gcb.14011
Gibbs, H.K., L. Rausch, J. Munger, I. Schelly, D.C. Morton, P. Noojipady, B. Soares-
Filho, P. Barreto, L. Micol, and N.F. Walker., 2015. Brazil’s soy moratorium.
Science 347:377-378. [doi: 10.1126/science.aaa0181].

53
Godar, J., Gardner, T.A., Tizado, E. J., & Pacheco, P., 2014. Actor-specific
contributions to the deforestation slowdown in the Brazilian Amazon. Proc
Natl Acad Sci U S A, 111(43), 15591-15596. doi:10.1073/pnas.1322825111
Goldewijk, K.K., 2001. Estimating global land use change over the past 300 years:
The HYDE Database. Global Biogeochemical Cycles 15, 417-433.
IBM Corp., 2016. IBM SPSS Statistics for Windows, Version 24.0. Armonk, NY: IBM
Corp.
Instituto Nacional de Pesquisas Espaciais, 2009. PRODES: Assessment of
deforestation in Brazilian Amazonia. Available at
http://www.obt.inpe.br/prodes/.
INPE (2017) Projeto PRODES: Monitoramento da floresta Amazônica Brasileira por
satélite. Available at www.obt.inpe.br/prodes.
Jean P.O., Ana P.D.A., and Luiz A.M., 2011. Amazon deforestation in Brazil: effects,
drivers and challenges, Carbon Management, 2:5, 575-585, DOI:
10.4155/cmt.11.48
Joppa, L.N., Loarie, S.R. & Pimm, S.L., 2008. On the protection of ‘protected areas’.
Proceedings of the National Academy of Sciences USA, 105, 6673–6678.
Liengaard, L., Nielsen, L.P., Revsbech, N.P., Priemé, A., Elberling, B., Enrich-Prast,
A., Kühl, M., 2012. Extreme Emission of N(2)O from Tropical Wetland Soil
(Pantanal, South America). Frontiers in Microbiology 3, 433.
MAPA, 2016. Brasil Projeções do agronegócio 2015/2016 a 2025/2026, 7ª ed.
Ministério da Agricultura, Pecuária e Abastecimento, Brasília-DF.
Melillo, J., Steudler, P., Feigl, B., Neill, C., Garcia, D., Piccolo, M., Cerri, C. and Tian,
H., 2001. Nitrous oxide emissions from forests and pastures of various ages in
the Brazilian Amazon. Journal of Geophysical Research: Atmospheres,
106(D24), pp.34179-34188.
Michalski, F., and C.A. Peres., 2005. Anthropogenic determinants of primate and
carnivore local extinctions in a fragmented forest landscape of southern
Amazonia. Biological Conservation 124: 383–396. [doi:
10.1016/j.biocon.2005.01.045].
Mittermeier, R.A., Mittermeier, C.G., Gil, P.R., Pilgrim, J., Fonseca, G.A.B., Brooks,
T. & Konstant, W.R., 2002. Wilderness: Earth’s Last WildPlaces. CEMEXS.A.,
Mexico City.

54
MMA (Ministério do Meio Ambiente), 2007. Áreas Prioritárias para Conservac¸
ão,Uso Sustentável e Repartic¸ ão de Benefícios da Biodiversidade Brasileira.
pp. 29–38.Secretaria de Biodiversidade e Florestas.
MMA, 2015. Cadastro Nacional de Unidades de Conservação. MMA, Brasília, DF,
Brazil.
MMA, 2013. Action plan for prevention and control of the Legal Amazon
deforestation (PPCDAm): 3rd phase (2012-2015) towards sustainable use and
forest conservation (MMA).
MMA, 2017. National Biodiversity Strategy and Action Plan. MMA.
Morton D.C., DeFries R.S., Shimabukuro Y.E. et al., 2006. Cropland expansion
changes deforestation dynamics in the southern Brazilian Amazon. Proc. Natl
Acad. Sci. USA 103(39), 14637–14641.
Nepstad, D. C., A. Verissimo, A. Alencar, C. Nobre, E. Lima, P. Lefebvre, P.
Schlesinger, C. Potter, P. Moutinho, E. Mendoza, M. Cochrane, and V. Brooks.
1999. Large-scale impoverishment of Amazonian forests by logging and fire.
Nature 398:505–508.
Nepstad, D.C., S. Schwartzman, B. Bamberger, M. Santilli, D. Ray, P. Schlesinger, R.
Lefebvre, A. Alencar, E. Prinz, G. Fiske, and A. Rolla., 2006. Inhibition of
Amazon deforestation and fire by parks and indigenous lands. Conservation
Biology 20:65-73. [doi: 10.1111/j.1523-1739.2006.00351.x].
Nepstad, D., McGrath, D., Stickler, C., Alencar, A., Azevedo, A., Swette, B., and Hess,
L., 2014. Slowing Amazon deforestation through public policy and
interventions in beef and soy supply chains.(Report)(Author abstract). Science,
344(6188), 1118. doi:10.1126/science.1248525
Peres C.A., Gardner T.A., Barlow J. et al., 2010. Biodiversity conservation in
humanmodified Amazonian forest landscapes. Biol. Conserv. 143 (10), 2314–
2323.
Pressey, R.L., Humphries, C.J. & Margules, C.R., 1993. Beyond opportunism: key
principles for systematic reserve selection. Trends in Ecology and Evolution, 8,
124–128.
Ratter, J.A., Ribeiro, J.F., Bridgewater, S., 1997, The Brazilian Cerrado Vegetation
and Threats to its Biodiversity. Annals of Botany 80, 223-230
Ramos, A.R., 1998. Indigenism: Ethnic Politics in Brazil. University of Wisconsin
Press, Madison, Wisconsin.

55
Ricketts T.H., Soares-Filho B., da Fonseca G.A.B. et al., 2010. Indigenous lands,
protected areas, and slowing climate change. PLoS Biol. 8(3), e1000331.
Rylands, A. and Brandon, K., 2005. Brazilian Protected Areas. Conservation Biology,
19(3), pp.612-618.
Soares-Filho, B., Moutinho, P., Nepstad, D., Anderson, A., Rodrigues, H., Garcia, R.,
and Maretti, C., 2010. Role of Brazilian Amazon protected areas in climate
change mitigation. Proceedings of the National Academy of Sciences of the
United States, 107(24), 10821. doi:10.1073/pnas.0913048107
Sparovek G., Berndes G., Barretto A. G. D. O. P., Klug I. L. F., 2012. The revision of
the Brazilian Forest Act: increased deforestation or a historic step towards
balancing agricultural development and nature conservation? Environmental
Science & Policy, 16, 65-72.
Tableau Software. 2017. Tableau Software version 10.4.
Vieira ICG, Toledo PM, Silva JMC, Higuchi H., 2008. Deforestation and threats to
the biodiversity of Amazonia. Braz. J. Biol. 68(Suppl. 4), 949–956.
Wittemyer, G., Elsen, P., Bean, W.T., Coleman, A., Burton, O. & Brashares, J.S.,
2008. Accelerated human population growth at protected area edges. Science,
321, 123–126.


TRITA-ABE-MBT 18400
www.kth.se