impact of camel ratios toward profitability of sharia
TRANSCRIPT

IMPACT OF CAMEL RATIOS TOWARD
PROFITABILITY OF SHARIA BANKS IN INDONESIA
By
Sarah Ruen Soekarno
014201400116
A Skripsi presented to the
Faculty of Business President University
in partial fulfillment of the requirement for
Bachelor Degree in Management
April 2018

PANEL OF EXAMINERS
APPROVAL SHEET
The Panel of Examiners declare that the skripsi entitled “IMPACT OF
CAMEL RATIOS TOWARD PROFITABILITY OF SHARIA BANK IN
INDONESIA” that was submitted by Sarah Ruen Soekarno majoring in
Management from the Faculty of Business was assessed and approved to
have passed the Oral Examinations on April 18, 2018.
Christina Liem, S.T., M. Comm
Chair - Panel of Examiners
Liswandi, S.Pd., M.M., Ph.D
Examiner 1
Liswandi, S.Pd., M.M., Ph.D
Examiner 2

SKRIPSI ADVISER
RECOMMENDATION LETTER
This skripsi entitled “IMPACT OF CAMEL RATIOS TOWARD
PROFITABILITY OF SHARIA BANK IN INDONESIA” prepared and
submitted by Sarah Ruen Soekarno in partial fulfillment of the
requirements for the degree of Bachelor in the Faculty of Business has been
reviewed and found to have satisfied the requirements for a skripsi fit to be
examined. I therefore recommend this skripsi for Oral Defense.
Cikarang, March 29th, 2018
Acknowledged by, Recommended by,
Dr. Dra. Genoveva, M.M Purwanto, ST., MM
Head of Management Study Program Adviser

DECLARATION OF
ORIGINALITY
I declare that this skripsi, entitled “IMPACT OF CAMEL RATIOS
TOWARD PROFITABILITY OF SHARIA BANKS IN INDONESIA” is,
to the best of my knowledge and belief, an original piece of work that has
not been submitted, either in whole or in part, to another university to
obtain a degree.
Cikarang, March 29th, 2018
Sarah Ruen Soekarno
i
ABSTRACT
The development of the banking world in Indonesia has undergone significant
transformation, for example, the establishment of Sharia banks. Profitability becomes
a tool for a business to maintain its continuity in the long term. This research will study
about the impact of CAMEL ratios toward profitability of sharia banks in Indonesia.
Ratios that is being applied in this research is Capital Adequacy Ratio, Non Performing
Financing, Net Profit Margin, Net Operating Margin and Financing to Deposit ratio.
Methodology sampling used is purposive sampling. Sample of this research are 11
Sharia Banks in Indonesia from 2015 until 2017. This research uses descriptive
analysis, multi regression analysis, classical assumption test, coefficient of
determination, and hypothesis testing using F-test and T-test. T-test results show that
NPM have positive and significant influence toward ROA of Sharia Bank. And CAR
and NOM variable has positive but not significant towards ROA on Sharia bank
operating in Indonesia. While FDR has negative and significant towards ROA of Sharia
Bank and NPF has negative but not significant towards ROA. F-test shows that CAR,
NPF, NPM, NOM, and FDR simultaneously has influence on profitability. Coefficient
of determination shows the independent variables explains 73,2% variance in
profitability. And NPM is variable that has the most influence toward profitability.
With the result of this research, thus management of Sharia bank should pay attention
to CAR, NPF, NPM, NOM, and FDR because those variable have influence on ROA.
Keywords: CAMEL, Ratios, Profitability, Sharia Bank, Regression.

ii
DEDICATION
I would like to dedicate this thesis to my family who always support me and
helping me finish this study. And to President University as my contribution as a
student.

iii
ACKNOWLEDGMENT
Thanks to Allah SWT who has given me his gifts and strengths, so that I can finish this
thesis. The completion of this thesis is not only because of my hard work alone, but
those around me who have provided support in any form. So I also want to thank people
who play a role in completing this thesis
First and foremost, I would like to thank my family. Especially to my mother, Endang
Rukmiati. She is the one who have provided moral and material support to me so as to
facilitate my process in submitting this thesis. Without her support, this thesis could not
be finished.
Not to forget also to sir Pandu and sir Purwanto who have been willing to be my thesis
advisors. They have given their time, energy, support and mind whenever and wherever
to help me finish this thesis. Thank you for the guidance so far.
Thanks to the lecturers of other lecturers who have been willing to help me through the
knowledge that has been given during science studying in this campus. To mam Marie
Ann Jinenea, and other lecturers who are not quite my name I mention here.
Not to forget also, for Wiwin, Rahmah Maulinda, Geovany and Hemas Amelita who
have contributed by providing his knowledge for this thesis and always provide help
and spirit starting from the first day of admission until my day thesis trial. And to friends
of the Faculty of management for 4 years that is not forgotten.
During my college days, I also met a great friend Lisa, Dani Siwi, and Helga Fairuz.
Thank you for your support and making my day in college fun.
I also want to express my gratitude to people who have been present in my life until
this moment and still willing to accompany me in joy and sorrow. My second family
(Untitled) namely Kartika Findra Resiandi, Farhena Allya, Pavita Raudina Sari. And
thanks to Rizky who has passed us because of his illness, I want to realize his dream
for college who couldnt finished because of lupus through this thesis i made for her.
Last but not least, to everyone who is not enough I mention here who also provide
assistance to me so far. Thank you for your support and prayers until I get my bachelor
degree.

iv
TABLE OF CONTENT
ABSTRACT ............................................................................................................... i
DEDICATION .......................................................................................................... ii
ACKNOWLEDGMENT ......................................................................................... iii
TABLE OF CONTENT ........................................................................................... iv
LIST OF TABLES ................................................................................................... vi
LIST OF FIGURES ................................................................................................. vii
LIST OF EQUATION ........................................................................................... viii
LIST OF ACRONYM .............................................................................................. ix
CHAPTER I INTRODUCTION ............................................................................... 1
1.1. Background of Study ....................................................................................... 1
1.1.1. Need of Study ................................................................................................. 7
1.2. Problem Statement .......................................................................................... 7
1.3. Research Question ........................................................................................... 8
1.4. Research Objectives ........................................................................................ 8
1.5. Significance of Study ...................................................................................... 9
1.6. Scope and Limitation ...................................................................................... 9
1.7. Thesis Organization....................................................................................... 10
CHAPTER II LITERATURE REVIEW ................................................................. 12
2.1 Theoritical Review ........................................................................................ 12
2.1.1. Agency Theory.............................................................................................. 12
2.1.2. Profit Sharing Theory ................................................................................... 13
2.2. Variable Review ............................................................................................ 13
2.2.1 CAMEL Ratios ............................................................................................. 13
2.2.2. Profitability ................................................................................................... 20
2.3. Research Gap................................................................................................. 21
CHAPTER III RESEARCH METHODOLOGY .................................................... 27
3.1. Research Framework ..................................................................................... 27
3.2. Hypotheses .................................................................................................... 27
3.3. Operational Definition................................................................................... 28
3.4. Research Design ............................................................................................ 31
3.5. Sampling plan ................................................................................................ 39
3.5.1. Population and Sample .................................................................................. 39
3.5.2. Data Collection Method ................................................................................ 47

v
CHAPTER IV RESEARCH ANALYSIS ............................................................... 48
4.1. Descriptive Analysis ......................................................................................... 48
4.2. Inferential Analysis ....................................................................................... 51
4.2.1. Classical Assumption Test ............................................................................ 51
4.2.2. The Goodness of Fit ...................................................................................... 57
4.2.3. Interpretation Result ...................................................................................... 62
CHAPTER V CONCLUSION AND RECOMMENDATION ............................... 69
References ............................................................................................................... 73
Appendix ................................................................................................................. 80

vi
LIST OF TABLES
Table 2.1 Previous Research ........................................................................................ 21
Table 3.1 Operational Definition ................................................................................. 31
Table 3.2 Population of Research ................................................................................ 40
Table 3.3 Sample of Research ..................................................................................... 41
Table 4.1 Descriptive Statistics (Before Data Elimination) ......................................... 49
Table 4.2 Descriptive Statistics (After Data Elimination) ........................................... 50
Table 4.3 Result of Normality Test (Before Data Elimination)................................... 52
Table 4.4 Result of Normality Test (After Data Elimination) .................................... 53
Table 4.5 Result of Multicollinearity test ................................................................... 53
Table 4.6 Result of Heteroscedasticity test ................................................................. 54
Table 4.7 Result of Autocorrelation Test .................................................................... 55
Table 4.8 Result of Multiple linear regression Analysis ............................................. 56
Table 4.9 Result of Adjusted R Square ........................................................................ 58
Table 4.10 Result of F-Test ......................................................................................... 59
Table 4.11 Result of T-Test ......................................................................................... 60

vii
LIST OF FIGURES
Figure 1.1 Q.S. Al Baqarah: 275 ............................................................................... 3
Figure 1.2 The Development of Commercial and Sharia banks Assets .................... 5
Figure 1.3 Graph of ROA on Sharia Bank ................................................................ 6
Figure 2.1 Theoretical Framework .......................................................................... 26
Figure 3.1 Research Framework ............................................................................. 27

viii
LIST OF EQUATION
Equation 2.1 Capital Adequacy Ratio Formulation ................................................ 14
Equation 2.2 Non Performing Financing Ratio Formulation .................................. 16
Equation 2.3 Net Profit MarginRatio Formulation ................................................. 18
Equation 2.4 Net Operating Margin Ratio Formulation ......................................... 19
Equation 2.5 Financing to Deposit Ratio Formulation ........................................... 20
Equation 2.6 Return on Assets Ratio Formulation .................................................. 21
Equation 3.1 Multiple Regression Analysis Equation ............................................ 37
Equation 4.1 Multiple Regression Analysis Result Equation ................................. 56

ix
LIST OF ACRONYM
CAR : Capital Adequacy Ratio
NPF : Non Performing Financing
NPL : Non Performing Loan
NPM : Net Profit Margin
NIM : Net Interest Margin
NOM : Net Operating Margin
LDR : Loan to Deposit Ratio
FDR : Financing to Deposit Ratio

1
CHAPTER I
INTRODUCTION
In the first chapter is an introduction that contains its background, need of study,
problem statement, research questions, research objectives, significant of study, scope
and limitation, and thesis organization.
1.1. Background of Study
By dominating 80% of the financial market, Bank has facilitated economic growth and
has an important role in maintaining the economic movement of a country by becoming
an intermediary institution (Jaseviciene, 2012). According to (Kasmir, 2009), Bank is
a financial institution that has functions to collect and channel funds in the community
through the authority. It has to receive a deposit and provide a loan to improve the lives
of many people. Fund raising activities such as in the form of savings, demand deposits,
or deposits, funding activities such as lending, and provide other banking services.
Banks are getting their profit by collecting funds from the public in the form of a
deposit. Banks make deposits as a source of capital and funds to provide credit.
Therefore, banks should attract customers to deposit their money by offering bank
interest. Depositors will take the money along with the interest of the bank that has been
promised to be given by the bank as a sign of merit. Funds collected in the form of
deposits will be lent to borrowers who have been selected in advance to receive the
loan. Accepting credit proposals from untrusted borrowers can lead to failure to repay
a loan and ended with lowering bank's income. Strict policies needed to protect bank
income. However, too strict policy can lead to lower income as well as making it
difficult for banks to use available funds. With a time of period that has been set, the
borrower will return the borrowed money along with the current interest applied by the
bank, which the amount is greater than the interest of the bank to depositors. If the
interest rates given by the bank to the loan are greater than the bank's interest offered
to depositors, the bank will able to generate income. Profit generated from the bank is

2
from the difference between bank’s interest given to depositors and bank’s interest
arranged for the borrower (Central for Financial Training, 2010). The other incomes
such as income from investment on government stock investment and other first class
industrial securities in accordance with OJK rule No.36/POJK.03/2017 which said that
the bank's equity participation activities is one part of the bank's investment activities
in addition to other activities such as credit distribution or financing, fund placements
in the form of securities, and interbank money market activities. As a fund-raising
activity, beside receive benefits in the form of revenue from equity participation, it is
also potentially exposed to risk from such activities.
In addition, banks also provide services that apply fee and commission to its users or
commonly referred to as fee-based income. Examples include locker rent for customers
to store their valuables, underwriting shares for companies who issue their shares, card
fees that comes from joining fees, payment fees, fines imposed for late payment or
others, commission from the guarantee between two parties’ transaction administration
fee. There is also foreign services such as travel check, letter of credit, act as brokers
on foreign exchange, etc (Drs.Ismail, 2010). The banking in Indonesia has undergone
significant development, for example, the emergence of Sharia banks. According to
(Kasmir, 2009), there are several types of banking that can be divided from various
aspects. Type of bank when viewed in terms or ways in determining the price of
products or services can be divided into two, those are bank based on conventional and
Sharia principles
Bank based on haria principle is bank that implement Islamic law in bank activities
with other parties to deposit funds or business financing or other banking activities.
Banks based on Sharia principles in determining the price of its products are very
different from conventional banks based on, profit sharing principle (Mudarabah and
Wadiah), equity participation (Musyarakah), buying and selling of goods with gain
(Murabahah), pure lease without option (Ijarah).
Sharia banks themselves have the meaning of a financial institution that operates based
on the principles of Sharia, namely by making the Quran and Hadith as a guide
(Wangsawidjaja, Pembiayaan Bank Syariah, 2013). Quran and Hadis forbid “Riba” or
to take interest in its verses including with cause and effect. One of the verses is Q.S.
Al Baqarah verse 275 as shown in Figure 1.1,

3
Figure 1.1 Q.S. Al Baqarah: 275
Source: https://tafsirq.com/2-al-baqarah/ayat-275
Which means that “Those who consume interest cannot stand [on the Day of
Resurrection] except as one stands who is being beaten by Satan into insanity. That is
because they say, "Trade is [just] like interest." But Allah has permitted trade and has
forbidden interest. So whoever has received an admonition from his Lord and desists
may have what is past, and his affair rests with Allah. But whoever returns to [dealing
in interest or usury] - those are the companions of the Fire; they will abide eternally
therein” (Sudaryo & Yudanegara, 2017).
For its products, it can be divided into 3 kinds of fund raising products, the distribution
of funds products based on the principles of lease, sale and purchase, and the products
of services consisting of Sharf and Ijarah (Ikit, 2015).
The product of fund raising in Islamic banks includes demand deposits, savings
accounts, and time deposits with 2 principles those are Wadiah Principle and
Mudharabah principle, Wadiah is a deposit from one party to another party (in this case
is Sharia bank), the deposit should be kept and return whenever the depositor wants.
Implementation of Wadiah principle on Sharia bank is using Wadiah Yad Dhamanah
and Wadiah Yad Amanah. Wadiah Yad Dhamanah is a principle that allow the bank to
take advantage on the deposit but have to be responsible for it. While on Wadiah Yad
Amanah. The deposit cannot be utilized by the bank and the bank not responsible for
any kind of damage. In Mudarabah principle, the depositor acts as the owner of the
capital while the bank acts as the manager. The funds saved by the bank are then used

4
for financing, in which case the bank uses it for Mudharabah financing, the bank is
responsible for any possible losses.
The product of fund raising in Islamic banks based on 3 principles those are principles
of sale and purchase (Ba'i) which means because of the transfer of ownership of goods.
The bank's profit is mentioned in front & includes the price of the sold price, and rental
principles (Ijarah) which means an agreement for the transfer of use rights to goods or
services through lease without being followed by transfer of ownership of leased goods.
In this case the bank rents the equipment to the customer at a predetermined fee. And
profit sharing principle (Syirkah) which consists of 2 kind of products consists of
Musharakah and Mudharabah .
For the history of Sharia bank themselves, starting from in the past where bank had a
meaning of a financial institution that used the concept of credit where credit must be
followed by interest based on Law no. 14 of 1967. Then the government had a problem
with the bank stability and interest control caused by conventional bank has triggered
the enactment of Sharia principles with 0% interest in Indonesia.
First by Deregulation that issued in June 1, 1967. And then followed by PAKTO
(Package of Government Policy in October) issued by the government that support the
establishment of new banks with low budget in purpose of mobilizing public funds to
support development. Law Number 10 Year 1998 also contributed to the development
of Sharia bank (Marimin, Romdhoni, & Fitria, 2015).
The development of Islamic banks began in 1990, in which the Indonesian Ulema
Council (MUI) formed a working group to establish Islamic Banking in Indonesia. As
a result of the work of MUI, the first syariah bank in Indonesia is established namely
PT Bank Muamalat Indonesia (BMI). At the end of 2013, the banking regulatory and
supervisory functions moved from Bank Indonesia to the Financial Services Authority
(OJK). As the financial services sector authority, OJK continues to refine the vision and
strategy of sharia finance sector development policy (Otoritas Jasa Keuangan, 2018).
In addition to the emergence of new sharia banks, OJK as the new bank authority also
makes the regulation of OJK no.64 / POJK.03 / 2016 Year 2016 about the change of
conventional Business Operations into Bank Syariah which stipulates that conventional
banks can do change of business activities to become Sharia Bank. This increases the
number of Sharia banks.

5
With the number of Moslem in Indonesia, which is the largest Moslem population in a
country around the world, also has helped Sharia banking in Indonesia to grow rapidly.
There are 12 Sharia banks, 161 Sharia rural banks, and 22 Sharia business units in
Indonesia by 2015 (Haribowo, 2017).
Figure 1.2 The Development of Commercial and Sharia banks Assets
Source: www.Kompasiana.com
From Figure 1.2, the researcher instead found that the development of Sharia banks
may still relative low compare to the development of commercial bank. Even though
Sharia banks are growing every year, but the other banks are growing as well. The total
amount of Sharia bank assets is 679 trillion in 2016, which means only 5% from what
commercial banksdispose have already had.
Starting from lack of coordination among the authorities in the development of Islamic
banking, many sharia banks that do not have adequate capital, Sharia banking funding
structures that still rely on financing from expensive funds, lack of variance in products
and services that have not met the expectations of society, Fiture of Islamic banks have
not complete as conventional bank, inadequate number and quality of human resources
and lack of information technology to support the development of products and
services. Then the understanding and awareness of the community is still low to Islamic
banks and regulation and supervision that is still not maximum, those became the causes
why the development of Islamic banks is relatively slow compared to conventional
banks (Aditiasari, 2018). So that is why commercial banks become Sharia bank’s hard
competitors.

6
In order to compete with other banks and attract more of the enthusiasm from investors
and customers, Sharia bank should maintain their performance. Besides, Sharia bank
with its no interest system becomes the main alternative solution in maintaining the
stability of financial system and prevent global crisis happen (Sitepu, 2015). Therefore,
Sharia bank’s condition must be monitored for its important role.
Because all business organizations’ main motive is profit (V. Rajasekaran & R.Lalitha,
2011). That is why profitability becomes one of the important things in the healthy bank
and is being used as a parameter of financial soundness in a company.
Investors can see the advantages of investing in the company and the basis of the
decision to continue investing or not. As for potential investors, profitability can be
made for a comparison tool with other companies in the same industry to decide where
they should invest their money. Therefore, profitability also becomes a picture in the
business of a bank to maintain its business continuity in the long term, because
profitability indicates whether the business has a good prospect in the future (Hery,
2017). This is why management must keep on eye on this aspect.
Figure 1.3 Graph of ROA on Sharia Bank
Source: Financial Report of Sharia Banks in Indonesia
Figure 1.3 is showing the average of ROA of Sharia bank in the period of 2015-2017.
As shown in the graph, the profitability of Sharia bank itself is not in a good condition
because of instability in ROA. ROA is one of many ratios that is used to calculate the
profitability in a bank (Gitman & Joenk, 2008).
(0,56)(0,30)
(0,98)
1,47
(0,70)(0,98)
0,65
1,86
1,38
(1,50)
(1,00)
(0,50)
-
0,50
1,00
1,50
2,00
2015Q2 2015Q3 2015Q4 2016Q1 2016Q2 2016Q3 2016Q4 2017Q1 2017Q2
RO
A (
%)
Period
ROA OF SHARIA BANKS

7
Financial report is presented to help assessing a company's condition. By using the
financial report, we can visualize the condition and development of a business currently
(Sugiyono & Untung, 2008). Financial ratios can be used as a tool of assessment for its
performance by using financial report. It can shows the change in financial condition
or operational activity in the past, help to show the trend of the changing pattern, and
show the risk and opportunity that the company has (Fahmi, 2011). Ratio means turning
the financial condition of a company into a measurable number. So it is possible to
compare a company's financial aspects with other companies and financial aspects
between different times. Creating a financial ratio itself utilize financial data of a
company that has been calculated in such a way that produces a number that can
describe a financial aspect in the company. The purpose of analyzing using financial
ratios is to evaluate the current situation and predict the financial (Rangkuti, 2006).
One of the systems in assessing a soundness of bank is CAMEL According to Bank
Indonesia rules No. 9/24/DpBs about assesing the level of healthiness of a bank based
on the Sharia principles can be done by calculating the factor of CAMEL. A healthy
bank is a bank that can manage those five aspects. In case that a bank is in problem due
to a certain aspect, it means that the financial report will get some difficulties (Matnin,
2016).
1.1.1. Need of Study
This research is going to find out the problem on profitability. Profitability is one of the
important aspects in a business, including bank. Although profitability of Sharia bank
is not stable. That condition can be caused by many factor, for example CAMEL aspect.
In case that a bank is in problem due to a certain aspect, it means that the financial
report will get some difficulties. Based on that fact, the researcher wants to know the
problem that caused the instability of its profitability. This research can give useful
information to Sharia bank and the researcher wants to know in detail about profitability
of Sharia bank in Indonesia.
1.2. Problem Statement
In this study, the researcher tries to find out CAMEL ratios effect on profitability on
Sharia bank in Indonesia. As shown in Figure 1.3, the researcher found that there is a
fluctuation in the ROA which is resulting a profitability of Sharia bank. The fluctuation
makes the researcher wants to research what the factors are behind the profitability.

8
According to (Matnin, 2016), if one problem of aspects in CAMEL occurs, then there
will be a problem in financial report of a bank. The financial report contains many
aspects, one of them is profitability. CAMEL itself can be measured using financial
ratio. This research wants to know whether there is a correlation between the effects of
CAMEL ratios with profitability. Therefore, the researcher will use CAMEL ratios to
understand in detail about what factors behind profitability of Sharia Bank.
1.3. Research Question
On the basis of the above thinking, it can be formulated research questions as follows:
1. Is there a significant influence of capital ratio towards profitability of Sharia
bank in Indonesia?
2. Is there a significant influence of asset quality ratio towards profitability of
Sharia bank in Indonesia?
3. Is there a significant influence of management ratio towards profitability of
Sharia bank in Indonesia?
4. Is there a significant influence of earnings ratio towards profitability of Sharia
bank in Indonesia?
5. Is there a significant influence of liquidity ratio towards profitability of Sharia
bank in Indonesia?
6. Is there a significant influence of capital, asset quality, management, earnings,
and liquidity ratios toward profitability of Sharia bank in Indonesia?
7. Which variable has the most significant influence towards profitability of Sharia
bank in Indonesia?
1.4. Research Objectives
This research has 7 objectives that need to be found. Those are:
1. Find out the impact of capital ratio on profitability of Sharia bank in Indonesia.
2. Find out the impact of asset quality ratio on profitability of Sharia bank in
Indonesia.
3. Find out the impact of management ratio on profitability of Sharia bank in
Indonesia.
4. Find out the impact of earnings ratio on profitability of Sharia bank in Indonesia.

9
5. Find out the impact of liquidity ratio on profitability of Sharia bank in Indonesia.
6. Find out the impact of capital, asset quality, management, earnings, and
liquidity ratio on profitability of Sharia bank in Indonesia.
7. Find out which variable has the most significant influence towards profitability
of Sharia bank in Indonesia.
From the objectives above, this research is entitled with “THE IMPACT OF
CAMEL RATIOS TOWARD PROFITABILITY OF SHARIA BANKS IN
INDONESIA”.
1.5. Significance of Study
By finding the effect of camel ratio to profitability on Sharia bank, the result can be
exploited by related party that is:
a. As another reference for decision-making by the management of Sharia banks in
managing the activities of Islamic banks to maintain the continuity of the business.
b. Help OJK in monitoring Sharia bank in order to maintain the country's economic
stability and as a source of information in the formulation of state policy.
c. Assisting current investors in determining investment options and being a
consideration of potential investors to invest in Sharia banks. Because profitability
is one factor of financial performance of a bank that describes the current financial
condition and prospects in the future.
d. As a reference for other researchers to conduct other related studies and as an idea
to conduct similar research but more about profitability in Sharia banks.
e. Increase knowledge for the researcher especially about profitability in Sharia bank
and how to do research so hopefully there will be other research in the future.
1.6. Scope and Limitation
The purpose of this study is to determine the effect of CAMEL ratio to profitability.
The population that is the subject of research is Sharia bank in Indonesia which amounts
to 12 banks. But this study used 11 Sharia banks as samples. The data period of this
study starts from June 2015 until June 2017.
This study will have several limitations, there are:
10
a. Sharia banks used as research samples do not cover all Islamic banks in Indonesia.
Because there are several criteria that are not met by the bank and not able to to
meet the classical assumption test that requires researchers to use only a few Sharia
banks from all Sharia banks operating in Indonesia
b. The results are based on data from 2015Q2 to 2017Q2.
1.7. Thesis Organization
This thesis consists of 5 chapters. The chapters contained in this essay consist of
introduction, methodology, literature study, analysis, conclusions, and
recommendations.
The contents of each chapter are outlined in the following lines:
CHAPTER 1 – INTRODUCTION
In the first chapter is an introduction that contains the explanation of what is the
background of the research, need of study, problem statement, research questions,
research objectives, significant of study, scope and limitation, thesis organization. In
the background of the research, there is an explanation of the topic to be researched.
Need of study contains the importance of doing this research. The problem statement
contains the explanation of problem source and the thing you want to find out the
answer to. Research questions also show the things to be researched and it confirms in
the form of questions. Then research’s objectives contain what this research is looking
for and what it wants to discover through this research. Significant of study contains
the parties who can take advantage of the results of this research when it has already
found the answer and how they use the results of research. The next one is scope and
limitation which contains what you want to examine in detail about the subject and the
period will be used. Scope and limitation also contain the limitation of research and
things that are not included in the study. Thesis organization is an outline thesis which
contains an explanation of the contents in each chapter. In either the subject, time or
topic.
CHAPTER 2 - LITERATURE STUDY

11
Chapter 2 of the literature review contains relevant previous research studies that can
be used for reference in diagnosing discussion and supporting the results of research as
a process of finding answers to the problem. The contents of this chapter consist of
theoritical review, variables review and research gap. The subject discussed in this
chapter is the theory, formulas, and explanation from previous research related to
variables, object and topic in this research.
CHAPTER 3 – RESEARCH METHODOLOGY
This chapter 3 contains a research methodology that explains what methods are used in
both data processing and analysis. The contents of this chapter are research framework,
hypotheses, operational definition, research design, and sampling plan.
CHAPTER 4 - DATA ANALYSIS
This chapter contains the core of the research itself is a process of data analysis that has
been prepared using SPSS software and research methods that have been determined
and described in Chapter 3. The process is classical assumption testing consisting
normality test, heteroscedasticity, autocorrelation, and multicollinearity. Then it will be
continued with coefficient of determination and hypothesis testing using T-test and F-
test. And explanation and interpretation of the results obtained.
CHAPTER 5 CONCLUSION AND RECOMMENDATION
This chapter contains the result of the analysis is formed into the conclusion of the
answer to the problem contained in the problem statement. Then it contains the
recommendations indicated for the company and what can be added in the futures
research.

12
CHAPTER II
LITERATURE REVIEW
Chapter 2 of the literature review contains relevant previous research studies that can
be used for reference in diagnosing discussion and supporting the results of research as
a process of finding answers to the problem. The contents of this chapter consist of
theoritical review, variables review, research gap. The subject discussed in this chapter
is the theory, formulas, and explanation from previous research related to variables,
object and topic in this research.
2.1. Theoritical Review
2.1.1. Agency Theory
It is known as principal-agent relationship. the thory is about a contract between two or
more parties where one or more persons able to do things to delegate their behalf in
decision making. There are two parties involved, those are agent which are the
managers or employees who working in an organization and is responsible for
managing the business activities of the company to the owner. The second is principal
who is the owners of a company that delegates and transfers responsibilities or capital
to the appointed agent. in this case, shareholders will become the principal and bank
management as the agent. Management is a party contracted by shareholders to work
in the interests of shareholders. Because they are elected, the management must account
for all of their work to shareholders (Shamsuddin & Ismail, 2013).
The agency relationship always creates a problem between the owner and the agent
because of the difference of mindset and the difference of the prominent interest. the
company has many contracts, for example the contract of work between the company
and its managers and the loan contract between the company and its creditors. The work
contract referred to in the writing of this paper is the employment contract between the
owner of capital and the manager of the company. Where between agent and principal
want to maximize their utility with information owned. But on the one hand, the agent
has more information than the principal on the other hand, resulting in asymmetry

13
information. More information owned by managers can trigger to perform actions in
accordance with the wishes and interests to maximize its utility. As for investors in this
case investors, it will be difficult to effectively control the actions taken by management
because it has little information available. Therefore, sometimes certain policies are
carried out by the management company without the knowledge of the owners of capital
or investor (Scott, 2000).
2.1.2. Profit Sharing Theory
Sharing System Based on Revenue is a revenue sharing system based on revenue
(revenue) earned before the costs incurred in the production process. The revenue
sharing scheme used as the basis for calculation is the sales / business income. Thus the
risks faced by the contracting parties are low. The owner of the fund only faces
uncertainty over the high low income of the business and does not face uncertainty over
business costs (cost of goods sold / production costs, sales costs and general and
administrative costs). The low risk in the revenue sharing scheme is certainly
accompanied by a decrease in the potential for the owners of funds to enjoy a higher
surplus which is contributed by the efficiency of business costs or the decrease in costs
at the time of the business activity down. Profit sharing scheme is a profit-sharing
scheme that should be used in sharia banking such as mudharabah or musyarakah
financing. On mudharabah financing is at least a gross profit sharing scheme. But now
the profit sharing scheme is not widely used because some sharia banks assume that the
risk is high. In addition, Islamic banks are still difficult to apply the scheme of profit
sharing because the reality does not generate great enthusiasm on the depositors who
are afraid of losing savings (Aswad, 2014).
2.2. Variable Review
2.2.1. CAMEL Ratios
This research use CAMEL ratio as its independent variables. CAMEL itself is one of
the approaches to analyze a bank that has been used in many countries. Assessment is
done in quantitative or qualitative method and is to ensure whether the bank is classified
as safe or not in accordance with the conditions specified (Gandapradja, 2004). It is
formed so that the level of bank health can be assessed. Through this approach, bank

14
can be categorized into a healthy bank, healthy enough, or unhealthy. For a healthy
bank, it should maintain its performance. In contrast, an unhealthy bank should increase
its performance. This valuation is important because to keep the bank able to perform
its functions properly by having sufficient capital, maintaining good asset quality, well
managed and operated on the basis of prudential principles, generate sufficient profit to
maintain its business continuity, and maintain its liquidity so that it can fulfil the
regulation of Bank Indonesia rules No. 9/24/DpBs about assesing the level of
healthiness of a bank based on the Sharia principles can be done by calculating the
factor of CAMEL. CAMEL consists of Capital, Asset Quality, Management, Earnings,
and Liquidity. This approach covers the aspects that can be used to assess the stability
of a bank (Fight, 2004). And each of these aspects can be measured through financial
ratios.
2.2.1.1. Capital
Banks must sets aside some of capital funds to be kept as reserve. According to Bank
Indonesia regulation No. 20/3/PBI/2018 about rupiah and foreign currencysStatutory
reserve requirements, reserve on Sharia bank should be more than 3% from its third
party fund. And later the capital will be used to anticipate when the bank is experiencing
any unexpected losses. Adequate capital is very important for the bank to ensure the
bank can remain well operated and perform its function properly. Capital aspect can be
measured using Capital Adequacy Ratio (Laluas, Mangantar, & Mekel, 2014).
CAR is the ratio derived from dividing the capital against risk weighted assets. Risk
weighted assets are assets measured with its risk (Fatima, 2014). Asset owned will be
categorized into several classes and calculated according to the respective weight. The
function is to tell bank's capability to absorb all loses before going bankrupt and lose
deposit funds. According to (Ikatan Bankir Indonesia, 2013), CAR can be measured
using this method:
𝐶𝑎𝑝𝑖𝑡𝑎𝑙
𝑅𝑖𝑠𝑘 𝑊𝑒𝑖𝑔ℎ𝑡𝑒𝑑 𝐴𝑠𝑠𝑒𝑡𝑠× 100%
(Eq. 2.1)

15
Since bank has important role in economy as what I have already explained in
background of the research. It is important to have regulations to ensure the funds
availability in meeting customer demand and need (Chinonye, 2011). Basel Committee
on Banking Supervision sets a minimum CAR 8% for every bank in Basel accord 1
which is then adopted by Bank Indonesia as the bank supervisory authority in
Indonesia. Keeping the CAR above 8% means that the bank has maintained overall
financial system stability and protects its customers. Bank which has a CAR above the
standard can be said that the bank can manage its capital well. The higher the CAR
ratio, the higher the bank's ability to support business growth, including covering
unexpected losses (Yusmad, 2018).
A. The impact of CAR on ROA
Theoretically, CAR describes the company's capital adequacy that serves to
accommodate the loss of the assets that may be risky. The higher this ratio, the
better the bank manages its capital to anticipate the unexpected losse (Ikatan Bankir
Indonesia, 2016). If a bank has a high CAR number, it means that funds set aside
for capital are high. It has a positive impact on the bank's ability on absorb
unexpected losses by using the fund reserve. In addition, Sharia bank involves the
risks derived from the model of financing based on profit-sharing principle where
profit snd losses are divided between the bank which provide financing with the
recipients of financing, Because there is the risk of losses if the project bank losses
and it will give negative impact for the bank (Centre for Strategic and Imternational
Studies, 2005). Reserve funds in the form of capital that already prepared can be
used in the future and affect the profit of the bank (Ismail, 2015). High capital means
high reserve so the amount of losses that can be reduced by using capital is bigger.
With the increasing reserve, the higher the ability of banks in increasing the amount
of profit belonging to banks and led to a rise in ROA (Hadinoto, 2008). It will bring
positive impact to the profitability. Thus, the greater the CAR, will result in
increasing ROA. Vice versa, if CAR decreases, then ROA will decrease (Armereo,
2015).

16
2.2.1.2. Asset Quality
Assessment on this aspect is done to assess the management of financing risk and
condition of bank asset. Asset quality assessment is intended to assess the condition of
bank assets as a mesurement of risk that bank have towards financing default, so bank
management can observe and analyze it periodically. So if there is a problem with asset,
bank management can anticipate immediately (Husein & Hasib, 2016).
For asset quality aspect can be measured by NPF ratio (Wangsawidjaja, 2012) . NPF
itself stands for Non Performing Financing which means status of credit consist of
substandard credit, doubtful, and loss financing. NPF is a term used for Sharia bank in
replacement of NPL which used for conventional bank (Ikatan Bankir Indonesia, 2018)
the ratio of Non Performing Financing is the ratio obtained by calculating total non
performing financing from its total financing. (Yusmad, 2018). There are two types of
NPF, those are gross NPF and NPF net. The difference between these two is NPF net
exclude CKPN from the total of NPF, in the other hand, the gross of NPF is not (Ikatan
Bankir Indonesia, 2014). As a matter of this research, the researcher will use net NPF
as representative for asset quality aspect on CAMEL. Due to net NPF excludes losses
has already recognised by the bank, therefore it represents the potential of additional
loss of the bank (Resolving non-performing loans in Europe, 2017). According to OJK
circular letter No.18/SEOJK.03/2015, the formula of net NPF is stated below
𝑁𝑜𝑛 𝑃𝑒𝑟𝑓𝑜𝑟𝑚𝑖𝑛𝑔 𝐹𝑖𝑛𝑎𝑛𝑐𝑖𝑛𝑔 −𝑃𝑟𝑜𝑣𝑖𝑠𝑖𝑜𝑛 𝑓𝑜𝑟 𝐹𝑖𝑛𝑎𝑛𝑐𝑖𝑛𝑔 𝑙𝑜𝑠𝑠𝑒𝑠
𝑇𝑜𝑡𝑎𝑙 𝐹𝑖𝑛𝑎𝑛𝑐𝑖𝑛𝑔× 100%
(Eq. 2.2)
Banks are required to good standard of net NPF in a bank to maintain the level of trust
from the people (Khotibul, 2016). According to Bank Indonesia Regulation Number
6/10 / PBI / 2004, if the ratio of net NPF is above 5%, meaning that the bank has poor
quality assets. Good bank is the one which has Net NPF below 5% which means the
bank has managed to manage its assets well.

17
A. Impact of NPF toward ROA
Theoretically, NPF describes the quality of assets owned by Islamic banks, low in this
ratio, the better the bank in managing financing with its risk. If a bank has a high NPF
ratio, the number of problem assets owned by the bank is high (Wangsawidjaja,
Pembiayaan Bank Syariah, 2013). It has a bad impact on the profit that will be obtained
by the bank because funds that have been used as financing to borrower will not return,
but it is also profit from financing that failed to get (Arifi, 2012). The funds owned by
these banks are getting smaller and rarely to be used in their daily activities, and that
leads to the decline in profits and its ROA. It will bring negative impact to the
profitability .Thus, the greater the NPF, will result in decreasing ROA. Vice versa, if
NPF decreases, then ROA will increase (Zulfiah & Susilowibowo, 2014).
2.2.1.3. Management
According to Bank Indonesia regulation No. 6/10/PBI/2004 about system rating of
health of commercial banks and management assessment, is done qualitatively and
quantitatively to the following components:
a. General Management
b. Implementation of risk management system
c. Bank's decision on the provisions as well as commitments to Indonesian banks
and / or other parties.
In addition to use the financial statements, the assessment should also be done by
interviewing and filling the survey by the relevant bank.
The assessment conducted by using around a hundred questionnaires is classified into
two major groups, ,there are: general management and the risk management
questionnaire. General management questionnaire is further divided into subgroups of
questions related to strategy, structure, system, human resources, leadership, and work
culture. Meanwhile, risk management questionnaire is divided into sub-categories
related to liquidity risk, market risk, credit risk, operational risk, legal risk and risk of
owners and managers. However, qualitative assessment is quite difficult to use because
it is confidential.

18
Management aspects can be reflected by using Net Profit Margin. Due to operating
income itself reflects the results of strategies made by banks to generate operating
income. Besides, Net income itself is the result of liquidity risk management, credit,
operational risk, legal risk, and owner risk (Jacob, 2013). Net Profit Margin is ratio that
shows financial condition at certain period and the efficiency level of bank (Bellalah &
Masood, 2013). NPM can be found through this formula (Laluas, Mangantar, & Mekel,
2014),
𝑁𝑒𝑡 𝑃𝑟𝑜𝑓𝑖𝑡
𝑂𝑝𝑒𝑟𝑎𝑡𝑖𝑛𝑔 𝐼𝑛𝑐𝑜𝑚𝑒× 100%
(Eq. 2.3)
A. Impact of NPM toward ROA
Theoretically, Net Profit Margin describes the quality of a bank's management in
applying its strategy and managing its risks to generate income. If a bank has high NPM,
then the bank has good management aspect that comes from planning and executing a
strategy nicely and managing all possible risks that cause failure in applying the
strategy. If a strategy of a bank in finding incomes is success, then, the incomes will be
received. If a strategy of quality management from a bank is high, which is represented
by NPM, the income will also be higher. It means that the higher its ratio, the better the
bank's management in generating income. If a bank has a high NPM ratio, the amount
of income received will also be high. It has a good impact on the total profit earned by
the bank. It will bring positive impact to the profitability. Thus, the greater the NPM,
the higher the ROA will be since ROA put profit to its account. Vice versa, if NPM
decreases, then ROA will decrease (Indyarwati, 2017).
2.2.1.4. Earnings
Earnings aspect assesses the condition and ability of banks in obtaining profit in order
to support operational activities and provide capital. A bank can be said to be healthy
if its profit is high, so that it can have a high assessment of earnings aspect too.
Earnings aspect can be represented by Net Interest Margin. NIM is the amount of
interest earned and paid by the bank to average productive assets and banks usually use

19
NIM, but NIM use the amount of interest income earned but Sharia banks adopt 0%
interest (Anwar, 2016). So this research will be using Net Operating Margin or NOM
that include income from profit and loss sharing instead of interest. NOM is a ratio that
measures the ability of banks to process their productive asset to generate income.
According to Bank Indonesia, a healthy bank is a bank which has NOM is 8% and or
greater. According to OJK circular letter No.18/SEOJK.03/2015, NOM can be
measured through this formula:
𝐼𝑛𝑐𝑜𝑚𝑒 𝑓𝑟𝑜𝑚 𝑝𝑟𝑜𝑓𝑖𝑡 𝑠ℎ𝑎𝑟𝑖𝑛𝑔 −𝑂𝑝𝑒𝑟𝑎𝑡𝑖𝑜𝑛𝑎𝑙 𝑒𝑥𝑝𝑒𝑛𝑠𝑒
𝐴𝑣𝑒𝑟𝑎𝑔𝑒 𝑃𝑟𝑜𝑑𝑢𝑐𝑡𝑖𝑣𝑒 𝐴𝑠𝑠𝑒𝑡× 100%
(Eq. 2.4)
A. Impact of NOM toward ROA
Theoretically, NOM portrays the ability of bank to use their productive asset to generate
operating income (Anwar, 2016). The higher the ratio, more efficient the bank is in
using its productive assets to generate operating income. By using its productive assets
efficiently, bank can get more income from its limited assets. Increasing in operating
income lead to higher net income. It will give positive impact on ROA since ROA also
include net income. It will bring positive impact to the profitability. Thus, the greater
the NOM, will be giving impact on high ROA. Vice versa, if NOM decreases, ROA
will decrease (Trisnigtyas & Mutaher, 2013).
2.2.1.5. Liquidity
Liquidity is the ability of the bank to meet its financial obligations when it’s due. A
bank is declared liquid if the bank can fulfil its debt obligations, can repay all customer
deposits, and can fulfil the loan request without problem (Rachmawati, 2017). With a
deposit that can be taken at any time, the bank must pay attention to its liquidity that
can be monitored from the Loan to Deposit ratio. LDR can be calculated by comparing
the loan amount to the bank deposit. it is shows the bank's ability to pay all the customer
deposit withdrawal by using credit given as liquidity source. Since this research use

20
Sharia bank as its research subject, then the researcher will use Financing to Deposit
Ratio instead of LDR because Loan to Deposit Ratio is for conventional bank which
use interest for its loan. While Sharia banks adopt 0% of interest financing so the ratio
will be financing deposit ratio.
Financing to Deposit ratio is the ratio of financing to the funds received. This ratio
shows the amount of funds used in financing (Yusmad, 2018). According to OJK
circular letter No.18/SEOJK.03/2015, FDR can be found through this formula
𝑇𝑜𝑡𝑎𝑙 𝐹𝑖𝑛𝑎𝑛𝑐𝑖𝑛𝑔
𝑇ℎ𝑖𝑟𝑑 𝑝𝑎𝑟𝑡𝑦 𝑓𝑢𝑛𝑑× 100%
(Eq. 2.5)
According to Bank Indonesia, a bank with good liquidity is a bank that has LDR
Between 85% - 100%. The lower the FDR ratio, more liquid the bank. So the bank can
easily fulfill its obligations.
A. Impact of FDR toward ROA
Theoretically, FDR visualizes the ability of bank to fulfil their debt obligation. It can
repay all customer deposits, and fulfil the loan request without any problems
(Rachmawati, 2017). The lower this ratio, more funds available to the bank. If a bank
has a low FDR number, it means that the amount of bank funds deposited is more than
the deposit that the bank gives to the borrowers as financing. Thus, the rest of deposit
will remain at bank and cannot be used to generate profits (Suryani, 2011). So if the
FDR of a bank is low, then the likelihood of getting profit is also low. Low in profit
means a negative impact on ROA obtained by banks. It will bring positive impact to
the profitability . Thus, the greater the FDR, will result in the higher of ROA. Vice
versa, if the FDR decreases, the ROA will decrease (Armereo, 2015).
2.2.2. Profitability
This research uses profitability as its dependent variable. Profitability is the ability of
banks in the search for profit. In addition, this aspect also becomes a symbol of
effectiveness and efficiency of the company in conducting its business. Investors are
able to see the profit that they will get from investing in a company and the basis of the
decision to continue with investing or not. As for potential investors, profitability can

21
be made for a comparison tool with other companies in the same industry to decide
where they should invest their money. To measure profitability, various ways can be
used and one of them is using the ratio.
Profitability ratio is a ratio that measures the ability of a company in searching for profit
that are coming from sales and investment income (Kasmir, 2009).
For profitability aspect, the researcher uses return on assets ratio to be a measurement
tool on how effective the management of a business are in generating profit from its
assets. ROA is the ratio derived from dividing the net income against average total
assets. The higher the ratio, more profitable the company (Gitman & Joenk, 2008).
According to OJK circular letter No.18/SEOJK.03/2015, ROA can be measured using
this method:
𝑁𝑒𝑡 𝐼𝑛𝑐𝑜𝑚𝑒
𝐴𝑣𝑒𝑟𝑎𝑔𝑒 𝑇𝑜𝑡𝑎𝑙 𝐴𝑠𝑠𝑒𝑡𝑠× 100%
(Eq. 2.6)
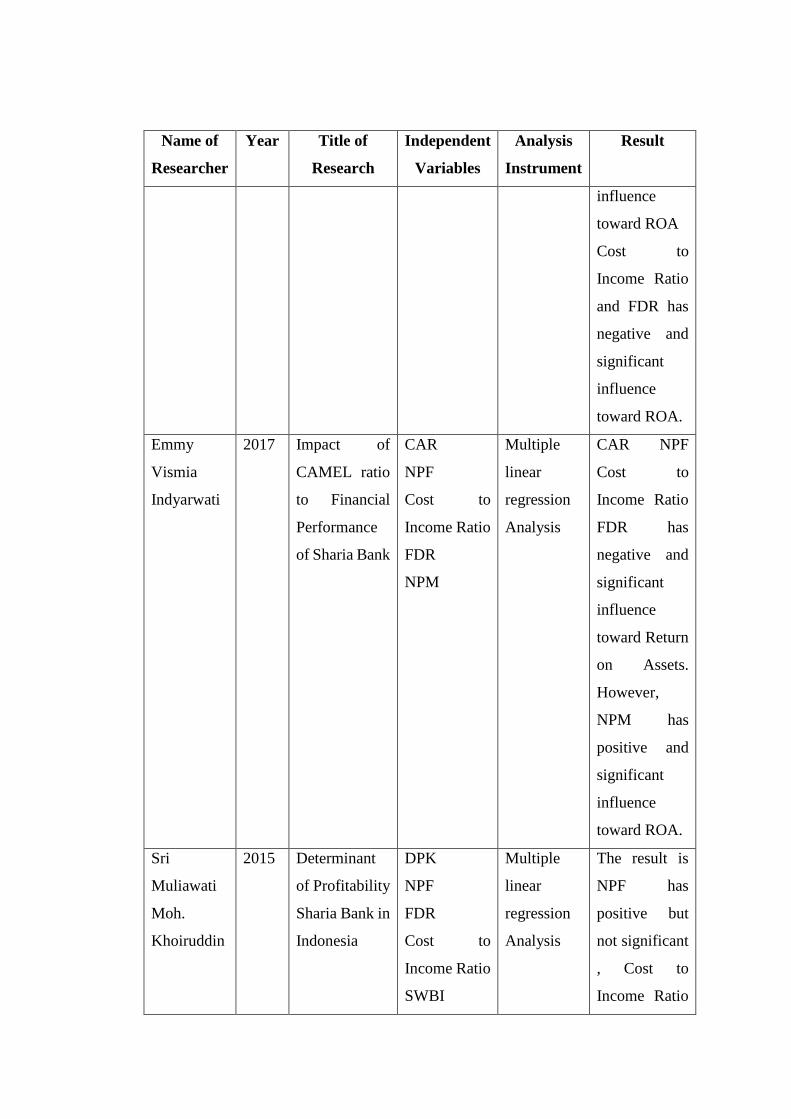
2.3. Research Gap
Various studies which use CAMEL ratios as independent variables, profitability as
dependent variables that have been carried out, and summarized in the Table 2.1,
Table 2.1 Previous Research
Name of
Researcher
Year Title of
Research
Independent
Variables
Analysis
Instrument
Result
Cystha
Armereo
2014 Analysis
Factor
Affecting
Profitability of
Syariah Bank
Listed on
Indonesia
CAR
FDR
NPF
Multiple
linear
regression
CAR and
FDR has
positive but
significant
toward ROA.
While NPF
has negative

22
Name of
Researcher
Year Title of
Research
Independent
Variables
Analysis
Instrument
Result
Stock
Exchange
Indonesia
and
significant
toward ROA.
Fathya
Khaira
Ummah and
Edy
Suprapto
2015 Factor
Affecting
Profitability of
Muamalat
Bank
CAR
Cost to
Income Ratio
NPF
FDR
Vector
Error
Correction
First analysis
by using short
term VECM,
the result are
CAR and NPF
not has
significant
influence
toward
probability of
Muamalat
Bank. And
Cost to
Income Ratio
and FDR has
negative and
significant
influence
toward ROA.
Second
analysis by
using long
term VECM,
the result are
CAR and NPF
has negative
but significant
23
Name of
Researcher
Year Title of
Research
Independent
Variables
Analysis
Instrument
Result
influence
toward ROA
Cost to
Income Ratio
and FDR has
negative and
significant
influence
toward ROA.
Emmy
Vismia
Indyarwati
2017 Impact of
CAMEL ratio
to Financial
Performance
of Sharia Bank
CAR
NPF
Cost to
Income Ratio
FDR
NPM
Multiple
linear
regression
Analysis
CAR NPF
Cost to
Income Ratio
FDR has
negative and
significant
influence
toward Return
on Assets.
However,
NPM has
positive and
significant
influence
toward ROA.
Sri
Muliawati
Moh.
Khoiruddin
2015 Determinant
of Profitability
Sharia Bank in
Indonesia
DPK
NPF
FDR
Cost to
Income Ratio
SWBI
Multiple
linear
regression
Analysis
The result is
NPF has
positive but
not significant
, Cost to
Income Ratio

24
Name of
Researcher
Year Title of
Research
Independent
Variables
Analysis
Instrument
Result
has negative
and
significant
influence on
ROA. While
FDR has
negative but
not significant
influence on
ROA and
DPK has
positive and
significant
influence
towards ROA
Suci Inayati
2014 Analysis the
impact of
CAMEL
Ratios to
profitability
Syariah Bank
listed in Bank
Indonesia
CAR
NPF
Cost to
Income Ratio
FDR
NOM
Multiple
linear
regression
Analysis
CAR has
negative but
not significant
influence
toward Return
on Assets.
However,
NPF Cost to
Income Ratio
has negative
and
significant
influence
toward ROA.
Meanwhile,

25
Name of
Researcher
Year Title of
Research
Independent
Variables
Analysis
Instrument
Result
FDR has
positive but
not significant
toward Return
on Assets.
However,
NOM has
positive and
significant
influence
toward ROA.
Source: International journal and books
This study has been made due to research gap from previous research conducted by
other research which has same topic. The gap comes from any difference exist between
those research, for example period, sample, population, variable both independent or
dependent variable, research method, or the result. This research uses internal factor
from a bank thus are CAMEL ratio that consists of CAR, NPF, NPM, NOM, and FDR
as independent variable, while ROA as dependent variable. Instead, research from
(Indyarwati, 2017) used other camel ratios to seek for its impact on profitability of
Sharia bank, which is using Cost to Income Ratio for earnings aspect.
The other researchers have different result on their research, for example as the research
held by research held by (Armereo, 2015), CAR has a positive and significant influence
towards ROA But another study held by (Inayati, 2014), CAR has negative but not
significant towards ROA. Other different result shows from research of (Ummah &
Suprapto, 2015) that shows NPF has negative but not significant influence towards
ROA while research from (Inayati, 2014) that shows NPF has negative but significant
influence towards ROA. Then research from (Anggita, 2012) that shows NPM has
negative and not singificant influence towards ROA while (Indyarwati, 2017) that

26
shows NPM has positive and significant influence towards ROA. Then research from
(Inayati, 2014) shows NOM has positive and significant nfluence towards ROA while
(Purnamasari & Ariyanto, 2016) that shows NOM has positive but not significant
influence towards ROA. Then research from (Muliawati & Khoiruddin, 2015) shows
FDR has negative but not significant influence towards ROA while (Indyarwati, 2017)
that shows FDR has negative and significant influence towards ROA.
This research contains the renewable period which is 2015-2017 and more bank as
samples. Also, the researcher will use some of different ratios for represent CAMEL.
Thus, this research objective is intended to fill the research the gap in the study.
This research wants to find out the influence of every independent variable partially to
variable dependent and find out the effect of independent variables simultaneously to
the dependent variable. There are 6 hypotheses that will be tested out and the result will
be stated in chapter 4. Based on the literature review and problem statement, the
researcher builds a theoretical framework as shown in Figure 2.1. It is based on the
title of this research “Impact of CAMEL Ratios toward Profitability of Sharia Banks in
Indonesia”.
Figure 2.1 Theoretical Framework
Source: The researcher

27
CHAPTER III
RESEARCH METHODOLOGY
This chapter 3 contains a research methodology that explains what methods are used in
both data processing and analysis. The contents of this chapter are research framework,
hypotheses, operational definition, research design, and sampling plan.
3.1. Research Framework
Figure 3.1 Research Framework
Source: The Researcher
3.2. Hypotheses
Hypothesis is preconceived notions about the results of research by researchers. But not
just any hypotheses can made. The hypothesis of this research is taken based on the
background issues, the formulation of problems, the purpose of the research and
literature review which had been done before.The study will be conducted to test the

28
truth of the hypothesis have been made. Then the researcher built the hypothesis for
this research below:
H01= There is a significant influence of CAR towards ROA of Sharia bank.
Ha2 = There is no significant influence of CAR towards ROA of Sharia bank.
H01= There is a significant influence of NPF towards ROA of Sharia bank.
Ha2 = There is no significant influence of NPF towards ROA of Sharia bank.
H01= There is a significant influence of NPM towards ROA of Sharia bank.
Ha2 = There is no significant influence of NPM towards ROA of Sharia bank.
H01= There is a significant influence of NOM towards ROA of Sharia bank.
Ha2 = There is no significant influence of NOM towards ROA of Sharia bank.
H01= There is a significant influence of FDR towards ROA of Sharia bank.
Ha2 = There is no significant influence of FDR towards ROA of Sharia bank.
H01= There is a significant influence of CAR, NPF, NPM, NOM, FDR toward ROA of
Sharia bank.
Ha2 = There is no significant influence of of CAR, NPF, NPM, NOM, FDR toward
ROA of Sharia bank.
3.3. Operational Definition
Operational definition is to explain the variables to be researched with an indicator for
the variables are easily measured (DR. Juliansyah Noor, 2017). Indicator can be
determined by looking at traits characteristics, related aspects, and behaviors. The
indicator will lead us to measure the concept of a variable significantly within the scope
of our research. Variables owned are still vague and too large scope, but in this
operational definition we will reinforce the definition of these variables so that
sampling research will be more accurate in accordance with the purpose of research.
This section will explain more about the variables used are ratio camel and profitability
Sharia bank in detail.
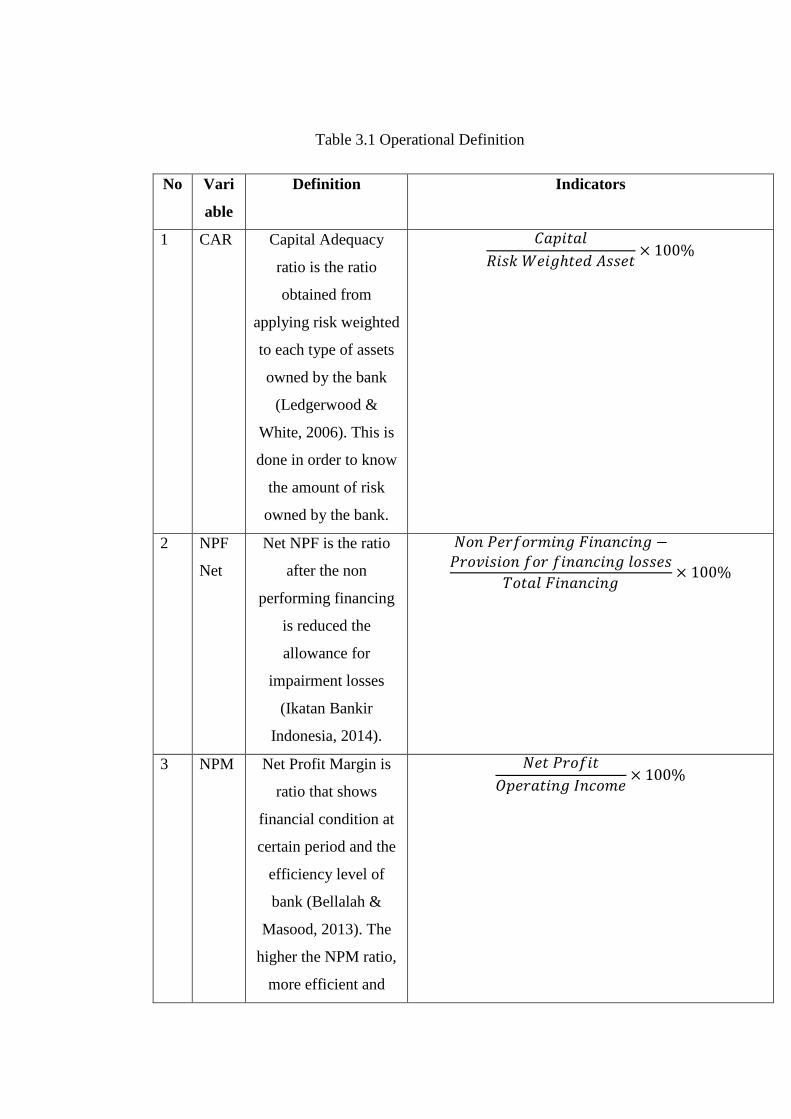
29
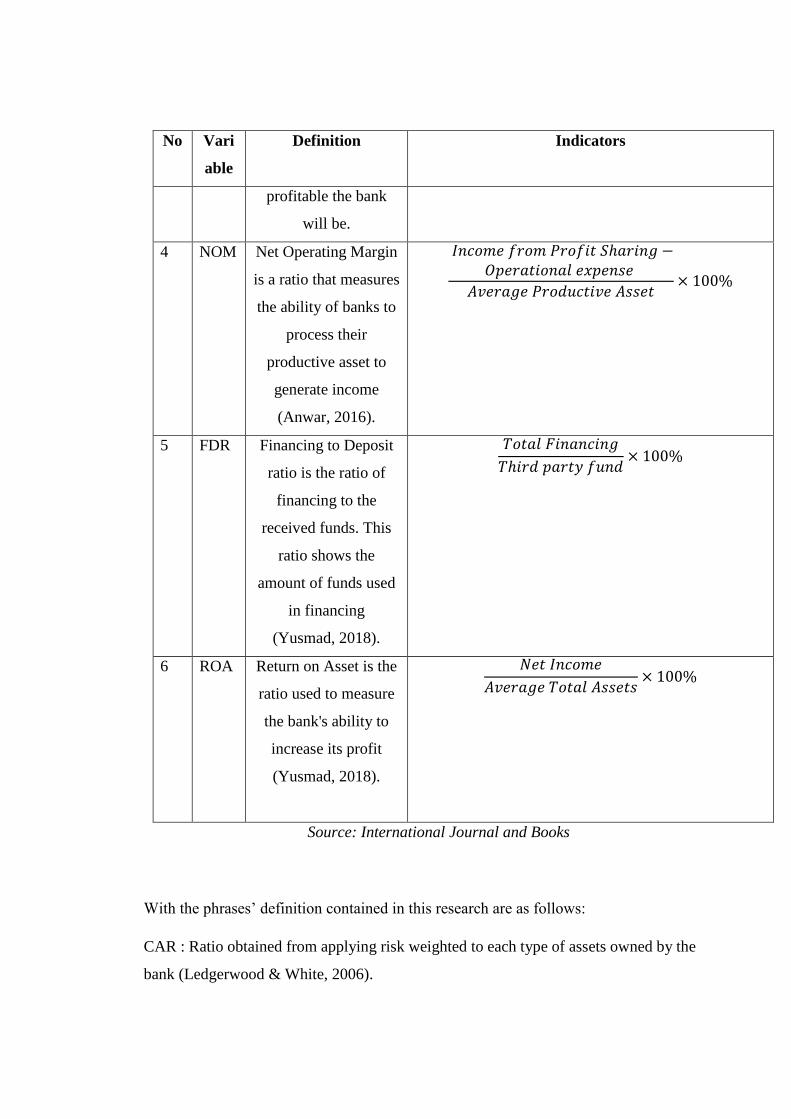
Table 3.1 Operational Definition
No Vari
able
Definition Indicators
1 CAR Capital Adequacy
ratio is the ratio
obtained from
applying risk weighted
to each type of assets
owned by the bank
(Ledgerwood &
White, 2006). This is
done in order to know
the amount of risk
owned by the bank.
𝐶𝑎𝑝𝑖𝑡𝑎𝑙
𝑅𝑖𝑠𝑘 𝑊𝑒𝑖𝑔ℎ𝑡𝑒𝑑 𝐴𝑠𝑠𝑒𝑡× 100%
2 NPF
Net
Net NPF is the ratio
after the non
performing financing
is reduced the
allowance for
impairment losses
(Ikatan Bankir
Indonesia, 2014).
𝑁𝑜𝑛 𝑃𝑒𝑟𝑓𝑜𝑟𝑚𝑖𝑛𝑔 𝐹𝑖𝑛𝑎𝑛𝑐𝑖𝑛𝑔 −𝑃𝑟𝑜𝑣𝑖𝑠𝑖𝑜𝑛 𝑓𝑜𝑟 𝑓𝑖𝑛𝑎𝑛𝑐𝑖𝑛𝑔 𝑙𝑜𝑠𝑠𝑒𝑠
𝑇𝑜𝑡𝑎𝑙 𝐹𝑖𝑛𝑎𝑛𝑐𝑖𝑛𝑔× 100%
3 NPM Net Profit Margin is
ratio that shows
financial condition at
certain period and the
efficiency level of
bank (Bellalah &
Masood, 2013). The
higher the NPM ratio,
more efficient and
𝑁𝑒𝑡 𝑃𝑟𝑜𝑓𝑖𝑡
𝑂𝑝𝑒𝑟𝑎𝑡𝑖𝑛𝑔 𝐼𝑛𝑐𝑜𝑚𝑒× 100%
30
No Vari
able
Definition Indicators
profitable the bank
will be.
4 NOM Net Operating Margin
is a ratio that measures
the ability of banks to
process their
productive asset to
generate income
(Anwar, 2016).
𝐼𝑛𝑐𝑜𝑚𝑒 𝑓𝑟𝑜𝑚 𝑃𝑟𝑜𝑓𝑖𝑡 𝑆ℎ𝑎𝑟𝑖𝑛𝑔 −𝑂𝑝𝑒𝑟𝑎𝑡𝑖𝑜𝑛𝑎𝑙 𝑒𝑥𝑝𝑒𝑛𝑠𝑒
𝐴𝑣𝑒𝑟𝑎𝑔𝑒 𝑃𝑟𝑜𝑑𝑢𝑐𝑡𝑖𝑣𝑒 𝐴𝑠𝑠𝑒𝑡× 100%
5 FDR Financing to Deposit
ratio is the ratio of
financing to the
received funds. This
ratio shows the
amount of funds used
in financing
(Yusmad, 2018).
𝑇𝑜𝑡𝑎𝑙 𝐹𝑖𝑛𝑎𝑛𝑐𝑖𝑛𝑔
𝑇ℎ𝑖𝑟𝑑 𝑝𝑎𝑟𝑡𝑦 𝑓𝑢𝑛𝑑× 100%
6 ROA Return on Asset is the
ratio used to measure
the bank's ability to
increase its profit
(Yusmad, 2018).
𝑁𝑒𝑡 𝐼𝑛𝑐𝑜𝑚𝑒
𝐴𝑣𝑒𝑟𝑎𝑔𝑒 𝑇𝑜𝑡𝑎𝑙 𝐴𝑠𝑠𝑒𝑡𝑠× 100%
Source: International Journal and Books
With the phrases’ definition contained in this research are as follows:
CAR : Ratio obtained from applying risk weighted to each type of assets owned by the
bank (Ledgerwood & White, 2006).

31
NPL: ratio used to measure asset quality of a conventional bank (Ikatan Bankir
Indonesia, 2018)
NPF: ratio used to measure asset quality of a Sharia bank (Wangsawidjaja, Pembiayaan
Bank Syariah, 2012)
NPM: ratio that shows financial condition at certain period and the efficiency level of
bank (Bellalah & Masood, 2013).
NIM : ratio can be used to measure earnings aspect in a conventional bank (Anwar,
2016)
NOM : ratio that measure measures the ability of Sharia banks to process their
productive asset to generate income (Anwar, 2016).
LDR: ratio used to measure liquidity condition of a conventional bank (Yusmad, 2018).
FDR: ratio of financing to the received funds. This ratio shows the amount of funds
used in financing (Yusmad, 2018).
ROA: ratio used to measure profit earned. This ratio can measure the bank's ability to
earn its profit (Yusmad, 2018).
3.4. Research Design
Design research is a strategy that holds the method, processes, procedures, and
techniques that researchers need in conducting a study. This will be used for providing
specific direction for procedures in a research study including data measurement,
collection, and analysis. The research design also means the process of research process
which can be divided into two, namely research planning that starts from identification,
choosing and problem formulation, up to the formulation of hypothesis and its relation
with existing theory and reference. Second is the implementation of research or
operational research process (Sekaran & Bougie, 2013).
Research problem will determine the research design used. The usefulness of research
design is as a guide for researchers in the process of research so that the evidence
collected can effectively address the problem in a study in accordance with the purpose
of research (Vogt, Gardner, & Haeffele, 2012). When research is made without research

32
design, then the problem cannot be delivered properly which leads to the conclusion
drawn will be weak and not convincing.
Research design has 3 methods to choose, there are: Quantitative methods, Qualitative
methods, and Mixed method. Quantitative method is a research method has objective
to test the existed theory by making hypothesis from the data collected and make a
summarization from the hypothesis. Qualitative method is used to identify an issue or
to describe a certain phenomenon from the participant’s point of view. While Mixed
method is a research method that use both quantitative and qualitative method. It can
be quantitative design and supported by qualitative, or qualitative design that is
supported by quantitative or to use both of them in a balance (Creswell & Creswell,
2017).
Quantitative research method will be used for this research because this research is to
test the existed theory and to use the data collected in which it will be analyzed using
statistic, clear planning of research which has been set before the research started as a
guideline of the research. It matches with the criteria of research that uses quantitative
method.
By using quantitative research method, the data are analyzed with descriptive analysis
and inferential analysis that will be done with the help of Statistical Package for Social
Science (SPSS) 20.0 software and can be described as follows:
A. Descriptive Analysis
Descriptive analysis is an analysis that seeks to describe data that have been collected
first without any conclusion (Purwanto, 2007). In this analysis, the presentation of data
are more emphasized in the form of statistical measurements for example mean,
minimum, maximum, and standard deviation. However, this kind of analysis is created
to visualize or analyze the statistic of the data, and is not just getting its summary. It is
done in order to make the data easier to be summarized and interpreted (Juliandi, Irfan,
& Manurung, 2014).
In this case, the researcher will use minimum, maximum, mean, and standard valuation.
Minimum is the smallest value from a data set, while maximum is the largest value.

33
Mean is the average from a data set and standard deviation is a variance of data set
around its mean (Tampomas, 2003).
B. Inferential Analysis
Inferential analysis is an analysis derived from research on the sample data held
(Purwanto, 2007). The usage of inferential analysis in quantitative research is as a basic
of hypothesis and to support the development of the research’s instrument, as a basic
of the planning of the research, as an analyses in creating a planning of research, as an
analyses in deciding the sample of research, and as a tool to manage and analyze the
result of research.
Sample of the research is used to draw general conclusions on the population according
to the problem of the research. This part of analysis will test the significance and level
of inferential error. Both of them will be used to identify an error in generalization. At
the end, the researcher will make a conclusion based on the result from inferential
analysis (Sutopo & Slamet, 2017).
1. Classical Assumption Test
The classical assumption is the statistical requirement that must be fulfilled in the use
of multiple linear regression with ordinary least square method (Sutopo & Slamet,
2017). There are 4 types of test in the classical assumption test. These tests are tested
for normality, heteroscedasticity, autocorrelation, and multicollinearity tests (Juliandi,
Irfan, & Manurung, 2014). There are many tests to choose from for those four test types.
Further details about the test can be seen below:
a. Normality Test
Normality test is a test to determine whether the research data has a normal distribution
or not (Juliandi, Irfan, & Manurung, 2014). This test is used to test whether a particular
value is significantly different or not with the average of a sample (Purwanto, 2007).
This study used a parametric statistic that requires normal distributed data. In other
words, the data which will be analyzed using parametric statistic must satisfy the
assumption of normality. Because if the data is not normally distributed then the usage
of T-test and F-test are invalid. The research should use non parametric statistic because

34
the T-test and the F-test are derived from the assumption of y or e are normally
distributed. The reason for abnormal data is because the data contained extreme data
(Sahai & I, 2007).
Testing of normality can be done with Kolmogorov Simonov. This research uses
statistical methods are compared with chart method because it can more easily
determine normality by using figures identified as determining normality, whereas the
graphic method is too subjective. By creating a null hypothesis that has been formed,
then data will be tested by the criteria below:
1. By comparing Kolmogorov Smirnov with Kolmogorov Smirnov table. When
Kolmogorov Smirnov smaller than Kolmogorov Smirnov from the table then a null
hypothesis is accepted which means data has normal distribution. But when
Kolmogorov Smirnov count greater than Kolmogorov Smirnov table then null
hypothesis is rejected which means data has outlier data or not normal.
2. Or by looking at the magnitude of assymp. Sig. when assymp. Sig is higher than
significance level then the null hypothesis is accepted which means data is in normal
distribution. When assymp. sig is lower than significance level then the null
hypothesis is rejected which means data is not normal (Santoso, 2010).
b. Multi-collinearity Test
Multi collinearity test is being used to see if there any correlation between independent
variables in a regression model (Juliandi, Irfan, & Manurung, 2014). This can be
happening if there is 2 or more independent variables who measure the same thing in a
different way or correlated between each other. Two independent variables can be said
to have a very strong correlation in r more than 0,9. Independent variables needed to
pass this multi-collinearity test should have r less than 0,9 has no meaning
(Yudiaatmaja, 2013).
The assumptions of regression will be met when multicollinearity test from research
data shows have no multicollinearity. It can be seen from its variant of the Inflation
Factor. It is an index that shows the increasement of variance caused by collinearity
problem (CTI Reviews, 2016). By using the principle of Tolerance = 10% then the VIF
= 10, There will be no multicollinearity if Variant Inflation Factor is below 10. The data

35
that have VIF higher than 10 do not pass the multicollinearity test because it proves to
have autocorrelation problem (Sutopo & Slamet, 2017).
c. Autocorrelation Test
Autocorrelation is used for testing whether there is residual error that relates to each
other. This usually occurs in time series data. It can be cause by data from the past affect
current data. If there is autocorrelation, there will be an error in the calculation of R2
that discusses the explained and unexplained variances. R2 that appears can be larger
or smaller than it should be. T statistic and F statistic can also be affected by showing
opposite results than they should (Juliandi, Irfan, & Manurung, 2014).
There are several kinds of tests that can be used to test the existence of autocorrelation
problem (Gani & Amalia, 2015).
Examples include Langrage Multiplier test, Durbin Watson test, etc. The research will
use Durbin Watson to test its autocorrelation. A test of regression assumptions is met
when the research data do not contain autocorrelation. It can be found by comparing
the value of the Durbin Watson from the calculation with Durbin Watson values
contained in the table. Durbin Watson on the table can be found by considering the
aspects of aspects such as the number of observation data, significance level, and the
number of independent variables. Value of the DW, dL and dU found will be matched
against the criteria below to determine the presence of autocorrelation
1. When DW < dL, then there is autocorrelation in the data in the form of positive
autocorrelation yatu research. It means if the difference between the actual value
and the estimated value of the dependent variable in one period is positive, then it
will be followed in the next period with positive error term instead of purely
random error and vice versa.
2. When dL < DW < dU atau 4 - dU < DW < 4 - dL, then autocorrelation existence
cannot be explained.
3. When dU < 4 - DW < dU, then there is autocorrelation in the research data that is
in the form of negative autocorrelation. It means if the difference between the
actual value and the estimated value of the dependent variable in one period is

36
positive, then it will be followed in the next period with negative error term instead
of purely random error and vice versa (Schroeder, Sjoquist, & Stephan, 2017).
d. Heteroscedasticity Test
Heteroscedasticity test is used to know whether the data has homoscedasticity or not.
Good data is data that have homoscedasticity or have no heteroscedasticity problem
(Juliandi, Irfan, & Manurung, 2014). Homoscedasticity and heteroscedasticity tells the
difference in the size of error term across values of an independent variable.
Homoscedasticity has the same size of error, but heteroscedastic is the reverse. The
presence of heteroscedasticity will affect the magnitude of the standard error of
regression models are made in a research and therefore biasing the result of hypothesis
testing (Schroeder, Sjoquist, & Stephan, 2017).
I use Spearman test as heteroscedasticity test. To meet the test of regression
assumptions, the data must be null hypothesis of homoscedasticity. To know whether
the data has heteroscedasticity or not, significant coefficient will be used to determine
whether the null hypothesis or accepted. When significant coefficient is higher than
0,05 then the data have homoscedasticity. When significand is less than 0,05, data have
a heteroscedasticity problem (Pramesti, 2016).
2. Regression
Regression is data analysis method that have purpose on discovering one, or more
variables, or independent variable impact on other variables, or dependent variables
(Ashish & Sri, 2012). Regression is a statistic in social science common to use because
it is so versatile. There are two kind of regressions, those are simple and multiple linear
regressions. Simple regression only uses one independent variable while multiple
regression involves two or more independent variables (Urda, 2011). Thus, this
research will use multiple linear regression since independent variable will be used in
this research consist of 5 variables. The method of analysis used is multiple linear
regression model. This method is used to know relationship between two or more
independent variables and one independent variable. Multiple linear regression analysis
will be used with ordinary least square in order to produce efficient and unbiased
estimators. It can be done when all the assumptions of the regression model is met

37
(Berry & Feldman, 1985). With independent and dependent variables in this research,
the model can be seen as below:
𝑌 = 𝛽0 + 𝛽1𝑥1 + 𝛽2𝑥2 + 𝛽3𝑥3 + 𝛽4𝑥4 + 𝛽5𝑥5 + 𝑒
(Eq. 3.1)
Explanation:
Y = Dependent Variable
𝛽0 = Y intercept
𝛽 = Regression coefficients of independent variables
𝑥= Independent Variable
𝑒 = Random error term
3. The Goodness of Fit
The goodness of fit of the model is used to measure the precision of the sample
regression functions in estimating the actual value. If the model passes this test, then it
can be said that this reliable model is to predict the data that have already existed. The
goodness of fit of a model can be known through coefficient of determination,
hypothesis testing consists of F-test and T-test.
4. Coefficient of Determination
Adjusted R2 is a single summary number that tells you how much shows how much the
independent variable is able to explain the change of the dependent variable. The rest
is explained by other variables. The magnitude of the influence of other variables are
referred to as error (e) derived from the formula e = 1-R2 (Sarwono & Budiono, 2012).
5. Hypothesis Testing
The hypothesis is the science of statistics used to make prediction answers to problems
that are still a presumption because it still has to be confirmed. This hypothesis is
obtained from a variety of theory, or personal experience, and or others. Hypothesis
will be recognized true when it has been tested and symptoms arising do not conflict
with what is outlined in the hypothesis. Hypothesis testing is the test procedure

38
performed in order to determine whether the hypothesis that have been created
previously will be accepted or not by doing research (Arifin J. , 2017). After going
through the test of the hypothesis, the hypothesis may be true or not. The likelihood of
hypothesis that may be true is called as probability. This research uses the parametric
statistics to find the proper method in managing data. Parametric statistics are statistics
for the population of the sample that have met certain requirements, such as the test of
normality, etc (Kuswadi & Mutiara, 2004). With this, hypothesis test that will be used
as follows:
1. F-Test
F-test is used to know the effect of independent variable along with other independent
variable to dependent variable (Arifin Z. , 2008). F-test is used to test hypotheses about
where the relationship of all the dependent variables against independent variable will
be accepted. According to (Kurniawan & Yuniarto, 2016), the null and alternative
hypotheses formed as stated below:
- Hypothesis null = All independent variables simultaneously have influence on
dependent variable
- Hypothesis alternative = All independent variables simultaneously have no
influence on dependent variable
To know which hypothesis to be accepted, significant coefficient can be used. When
significance have smaller coefficient from significance level used in this research, then
the null hypothesis will be accepted. However, the hypothesis will be rejected when
significance have larger coefficient from significance level used in this research, then
the alternative hypothesis would be received.
2. T-Test
T-test is used to determine the magnitude of the effect of independent variables partially
to the dependent variable (Arifin Z. , 2008). Unlike F-test, these tests only measure the
correlation between two variables for example one independent variable and a
dependent variable. T-test also holds the test to find out which hypothesis will be
accepted whether the null hypothesis or alternative hypotheses. According to
(Kurniawan & Yuniarto, 2016), the null and alternative hypotheses formed as stated
below:
39
- Hypothesis null = There is a significant influence of A (Independent variable)
toward B (dependent variable)
- Hypothesis alternative = There is no significant influence of A (Independent
variable) toward B (dependent variable)
To know which hypothesis to be accepted, significant coefficient can be used. When
the T-test has significant less than significant research is used, then, the null hypothesis
will be accepted. In the other hand, the alternative hypothesis be accepted only if
significant results of T-test more than significant which is being used.
3.5. Sampling plan
3.5.1. Population and Sample
Sampling is an activity that takes some representative from population that becomes
the object of the research to take a conclusion from a population. Population is a group
of objects or subjects that have a certain characteristic while the sample is a part of the
population taken by the researcher to be the object of research (Arifin Z. , 2008). The
purpose of sampling is to obtain information about the object of research by observing
some of the population alone because it can save the time cost and energy needed to
examine the object of research.
Methods used to take samples from a population is called sampling method. There are
two types of sampling method. First is probability sampling where every element on
population has equal chance to be choose. Second is non probability sampling where
element of population has no chance because of using the knowledge and opinion of
the researcher as a basic of receiving the sample (Siagian, 2006).
The population of this study is Sharia banks which currently operating in Indonesia.
Sharia banks are chosen because in accordance with the title of research. But in this
study, Sharia bank which is researched is Sharia bank which operates in Indonesia
either foreign bank or domestic bank. Based on Indonesia bank, Sharia banks consist
of 12 banks stated in Table 3.2 below,

40
Table 3.2 Population of Research
No. Name of Bank
1 PT Bank BNI Sharia
2 PT Bank Mega Sharia
3 PT Bank Muamalat Indonesia
4 PT Bank Bukopin Sharia
5 PT Bank BCA Sharia
6 PT Bank BRI Sharia
7 PT Bank Jabar Banten Sharia
8 PT Bank Panin Dubai Sharia
9 PT Bank Sharia Mandiri
10 PT Bank Victoria Sharia
11 PT Bank Maybank Sharia
12 PT Bank Tabungan Pensiunan Nasional
Source: Bank Indonesia Official Website (2018)
The researcher will take some sample from that population. The method to be used is
non probability sampling, specificly purposive sampling. The sample units chosen are
having similarity in common to some certain criteria that have been set related to
research objectives or research problems. Criteria that the sample used in this study
should meet the following requirements:
1. Banks in the form of Sharia commercial banks
2. Banks have been conducting its business activities in Indonesia
3. Banks that have been operating for more than 3 years
4. Banks that publish its financial statements from 2015 to 2017
Data from 11 banks were taken from 8 quarter observation year from 2nd quarter of
2015 until second quarter of 2017, so the observation in research became 11x9 = 99
observed data.

41
In terms of conditions, sample bank has been selected. It consists of 11 Sharia that can
be seen in Table 3.3,
Table 3.3 Sample of Research
No. Name of Bank
1 PT Bank BNI Sharia
2 PT Bank Mega Sharia
3 PT Bank Muamalat Indonesia
4 PT Bank Bukopin Sharia
5 PT Bank BCA Sharia
6 PT Bank BRI Sharia
7 PT Bank Jabar Banten Sharia
8 PT Bank Panin Dubai Sharia
9 PT Bank Sharia Mandiri
10 PT Bank Victoria Sharia
11 PT Bank Maybank Sharia
Source: Population of the Research
Detailed information from each samples can be seen below:
A. Sharia bank Bukopin
Vission: To be chosen Sharia bank with the best service
Mission: To give the best service to customer, to creating human resource that is
proffesional and amanah, focusing on development of business in small and medium
business, and increase added value to stakeholders
The history of Bukopin bank started from the bank bukopin which acquired by PT. BRI
(Bank Persyarikatan Indonesia). PT BRI changed the direction of its business from
conventional bank to Sharia bank then changed its name into PT.Bank Bukopin Syariah
and start actively operate in 2008. Until the end of 2013, office network owned consists
of 1 Head Office and Operational, 11 Branch Offices, 7 Sub-Branch Offices, 4 Cash

42
Offices, 1 Mobile Cash Unit, and 76 Sharia Service Offices, and 27 ATM machines
with Prima network and Bank Bukopin ATM.
The bank is operating with the value of trust, integrity, caring, cooperation, and quality.
Some awards have also been achieved such as first physical islamic commercial bank
from infobank and MRI. Another example is the award of the Indonesian business
award 2016 as the most efficient bank. Its products consisting of financing, financing,
and services such as iB SiAga Savings, iB Plans Saving, and iB guarantee bank are
those in the form of warrants issued by the bank resulting in liabilities.
B. BCA Syariah
Vision: to be reliable bank and what people choose
Mission: Develop human resources and infrastructure as a reliable Shariah financing
service provider in order to understand the need of customer and give better service to
them, Build Sharia Financial institution that excel in the settlement of payment,
collecting funds, and financing for business and individual customer .
BCA shariah is a Sharia bank which started from PT BCA which acquired PT Utama
Internasional bank which was renamed to Bank BCA Syariah Stock ownership is
dominated by PT BCA Tbk of 99.9% and the rest is owned by PT BCA Finance. BCA
Syariah, which started its operations on 3 March 2010, has now expanded and has 49
branches spread across DKI Jakarta, Tangerang, Bogor, Depok, Bekasi, Surabaya,
Semarang, Bandung, Solo, and Yogyaikarta.
Banking products offered by BCA sharia today are both funding products such as,
GIRO, and iB Deposit as well as financing products such as KPR ib, etc. Ownership of
shares by PT BCA enables BCA sharia to increase transaction convenience for
customers That is with the use of BCA bank facilities for independent such as the use
of atm or branch of BCA.
BCA Syariah has been awarded many awards such as Indonesia Banking Award, the
most reliable bank, the most efficient bank, and the best in productivity for banks with
assets below 10 trillion. And other awards like awards in the Islamic Finance Award
nite in the four categories namely The Most Expansive Funding, The most efficient
bank, 2nd Best Islamic bank, and the most effective bank

43
C. Bank Panin Dubai Syariah
Vision: To be Sharia selected banks into role model based on partnership and economy
Mission: Providing creative, innovative and capable products and services to meet the
needs of the community, Developing partnerships to support people's economic growth,
Developing human resources with integrity and professional based on spiritual values
based on merit system, Applying corporate governance and integrated control system
accordingly Sharia principles, Increase added value to stakeholders.
Bank Panin Dubai Syariah is a Sharia bank which at the end of 2017 is owned by PT
Bank Panin Tbk with 44.69 of the total shares, Dubai Islamic bank with 38.25%, and
the rest is owned by the community, the bank started operation on 2 December 2009 by
holding the value value below
-Collaboration Which means Pro active, synergies and solutions
Accountability which means Measured, accurate, objective and responsible
Respect which means Humility, empathy and mutual respect
Excellence which means Fast, precise and friendly.
Currently, Panin Dubai Syariah is based in Jakarta and already has 22 branch offices
and a number of Panin Bank branches in various provinces in Indonesia.Products
offered various examples such as fund products such as Savings SmPel, Tabungan PaS,
Flexible Savings then there is also financing products such as PaS Purchase Ownership
(PPR) and Car Ownership Financing Pas, then service products such as ATM CARD
Pas and SDB Pas
Awards received include The Most Efficient Bank at Bisnis Indonesia Financial
Awards 2017 provided by Bisnis Indonesia, Best Performance Banking 2013 in the
Sharia Bank Book 1 category provided by Tempo media group and other awards.
D. Bank BNI Syariah
Vision: Becoming a Sharia bank of society's choice that has superior service and
performance.

44
Mission: To contribute positively to the society and care for the environment
sustainability, Provide solutions for the community for the needs of syariah banking
services, Providing optimum investment value for investors, Creating the best place as
a place of pride to work and achievement for employees as the embodiment of worship,
and become a reference a trustworthy corporate governance.
BNI sharia is Sharia bank that started from BNI Sharia bank unit. but this UUS has been
listed on UUS BNI corporate plan year 2003 where the bank unit will be converted into
syariah bank. And it is done based on the authorization from the Governor of Bank
Indonesia Number 12/41 / KEP.GBI / 2010 dated May 21, 2010.
The Sharia Bank, which started operations on 19 June 1910, is owned by oleh PT BNI
TBK 99.9% and PT BNI Life Insurance with 0.1% of Sharia Bank shares. BNI Syariah
has 67 Branch Offices, 165 Sub-branches, 17 Office of Cash Office, 8 Functional
Office, 22 Mobile Services Vehicles, 20 Payment Points, 202 BNI ATM Machines, and
1500 Outlets.
Awards has been achieved including Top Bank Award 2017 for Top Sharia bank 2017
from Business News Indonesia, Bisnis Indonesia Banking Award 2016 for Most
Efficient Bank Category Sharia Bank and Most Efficient Bank Category Sharia bank,
etc. Products offered for example BNI dollar IB Hasanah saving product, BNI Baitullah
IB Hasanah saving product, etc
E. Bank BRI Syariah
Vision: To be a leading modern retail bank with a wide range of financial services to
meet customers' needs with the easiest reach for a more meaningful life.
Mission: Understanding the diversity of individuals and accommodate the various
financial needs of customers, Providing products and services that promote ethics in
accordance with the principles of Sharia, Providing access ternyaman through various
means whenever and wherever, Allow each individual to improve the quality of life
and bring peace of mind
BRI syariah is one of the subsidiaries of Bank BRI that focus on Sharia banking which
started from the acquisition of Artha Graha Bank on 2007 by PT BRI. Then it is
operating actively from 17 November 2008 as uus. But the spin off in 2009 to make

45
this bank turned into a sharia commercial bank. Currently PT. Bank BRI Syariah
became the third largest Sharia bank by assets.
The bank is wholly owned by PT BRI Tbk of 99.9% and the rest is owned by BRI
employee welfare foundation. Examples of products issued are Savings of BRI Syariah
Saving, Branch of Haji BRI, financing products such as Qardh Beragun Emas BRI
Syariah, etc.
Starting operations on 17 November 2008, the bank BRI Syariah has won quite a lot of
awards such as Banking Service Excellence 2017 which is Physical 1 Ranking of Sharia
Commercial Banking from Infobank & MRI Category on June 2017, and the best Bank
in Retail Banking Services from Tempo Media Group & Indonesia Banking School on
September 7, 2016, etc.
F. Bank Muamalat
Starting from the idea of the Indonesian Ulema Council (MUI), the Indonesian Muslim
Scholars Association (ICMI) and Muslim businessmen who later received support from
the Government of the Republic of Indonesia, Bank Muamalat officially operated on 1
May 1992 and became the first Sharia Bank in Indonesia.
To date, the bank has 325 service offices including 1 branch office in Malaysia. The
Bank's operations are also supported by a wide service network of 710 units of ATM
Muamalat, 120,000 ATM Bersama and Prima ATM networks, and more than 11,000
ATM networks in Malaysia via Malaysia Electronic Payment (MEPS). is the only
Sharia bank that has opened an overseas branch, namely in Kuala Lumpur, Malaysia.
Its product become innovation and breakthrough for sharia financial product products
such as Takaful Insurance, Muamalat Financial Pension Fund (DPLK Muamalat) and
sharia multifinance (Al-Ijarah Indonesia Finance), and Shar-e which was launched in
2004 also is the first instant savings in Indonesia.
The bank has a subsidiary, PT Al-Ijarah Indonesia Finance, which was established to
meet the financial needs of Indonesian society and Muamalat Pension Fund in the form
of legal entity. Awards which are owned by the bank are Top Sharia bank 2017 from
Top Bank Award 2017, Top 5 Best Consumer Choise Islamic Bank from Indonesia

46
Best Banking Brand Award 2017, and Top 5 Most Reputable Companies In Islamic
Banking Sector from Indonesia Best Corporate Reputations Award,etc.
G. Bank Mandiri Syariah
Vision: Leading and Modern Sharia Bank
Mission: Achieve growth and profit above the industry average sustainable, Improving
the quality of technology-based products and services that exceed customer
expectations, Prioritizing low-cost funding and financing channeling in the retail
segment, Developing business on the basis of universal sharia values, Developing
management talents and a healthy working environment, and Increase awareness of the
community and the environment
PT Sharia Bank Mandiri officially started operation on November 1, 1999. Starting
from PT Bank Susila Bakti was negatively affected by the monetary and political crisis
in 1997 and 1998 and the independent banks as majority owners decided to conduct PT.
Bank Susila Bakti from conventional bank to become Sharia bank in 199 and changed
its name to PT Sharia Bank Mandiri.The shareholding of Sharia Bank Mandiri is
dominated by PT Bank Mandiri Tbk with 99.9% and the rest is dimllliiki by PT Mandiri
Sekuritas. It operates with a high value point of ETHIC that consists of
-Excellence which means Working hard, smart, thoroughly wholehearted to give the
best results
-Teamwork which means Active which means to work together to succeed together
-Humanity which means Caring, sincere, giving maslahat and flowing blessings for the
country
-Integrity which means Honest, obedient, trustworthy and responsible
-Customer Focus which means Oriented to sustainable customer satisfaction and
mutual benefit
By the end of 2016, Sharia Bank Mandiri has 765 service offices throughout Indonesia,
996 units of Syariah Mandiri ATM with access to more than 100,000 ATM. owned

47
products are diverse, for example like BSM implant financing, umrah financing, BSM
gold pawn, pension fund, euro giro, etc.
During its operation, the bank has achieved outstanding achievements such as winning
the Islamic Retail Banking Awards 2017 organized by Cambridge Analytica Islamic
Finance on November 14, 2017, and The Best Islamic Bank in Indonesia, Best Islamic
Bank Award awarded by The asset Asian Hongkong on May 26, 2014 and many more.
3.5.2. Data Collection Method
The method of collecting the data is a method to get the information that is used in the
research. The method used is a documentary method because this document contains
data from previous period as a need this research. Documentary method is a method of
collecting data to get the old information in a form of document (W.Gulo, Metodologi
Penelitian, 2010). This information is needed to solve the problem of the research.
The data collected from the financial statement are being published by a certain bank
from its official website. In addition, the researcher also uses books, international
journals, articles, news, as well as official websites such as www.bi.go.id, www.ojk.com
to retrieve information as references.
The type of data can be divided into two types according to the way of the acquisition
of primary data taken and collected directly by the researcher against the object of
research to be used in various ways and methods and secondary data is data obtained
by researchers from other people so that researchers get data about the object research
indirectly from other parties who do not direct data retrieval of the object (Beri, 2005).
For this research, data is secondary data because this research data is quarterly financial
ratio in a bank. The data is obtained from the financial statements that have been
published by the bank in its official website. The financial statements contain data
describing the immediate situation of the bank collected by the bank management.
The data taken are quantitative data types with numerical scale that form the data panel.
Panel data is a data type that is a combination of time series and cross section data.
Time series data obtained from data derived from several quarterly financial statements.
And cross section data derived from data taken from the financial statements of various
banks.

48
CHAPTER IV
RESEARCH ANALYSIS
This chapter contains the core of the research itself is a process of data analysis that has
been prepared using SPSS software and research methods that have been determined
and described in Chapter 3. The process is classical assumption testing consisting
normality test, heteroscedasticity, autocorrelation, and multicollinearity. Then it will
becontinued by explanation of coefficient of determination and hypothesis testing using
T-test and F-test. And explanation and interpretation of the results obtained.
4.1. Descriptive Analysis
In this part, the researcher will summarize the data to be easily interpreted. Descriptive
analysis is an analysis that seeks to describe data that has been collected first without
any conclusion. In this analysis, the presentation of data is more emphasized in the form
of tables, graphs, statistical measurements for example mean, variation, correlation. In
this case, the researcher will use minimum, maximum, mean, and standard valuation
for each variable.
Based on the collection of sample data that meets the criteria consists of 11 Islamic
banks operating in Indonesia, from 3 years period starting from quarter 2 2015 to
quarter 2 2017 then the data collected consists of 99 observation data.
In the research of the influence of the ratio of CAMEL against profitability includes 5
independent variables consists of CAR which is representative of the capital aspect as
an independent variable, the NPF is representative of the asset quality aspect as an
independent variable, the NPM is representative of management aspect as an
independent variable, the NOM which is the representative of earnings aspect as
independent variable, earning FDR which is representative of the liquidity aspect as an
independent variable, and ROA that represents profitability aspect will become its
independent variable. Below is the result of descriptive analysis of this research

49
Table 4.2 Descriptive Statistics (Before Data Elimination)
Source: SPSS 20.0 Software
Based on Table 4.1, it can be compiled descriptions for each variable as follows:
The average value of CAR that becomes capital measurement tool in all samples in this
study is 21,65%, with a standard deviation of 11,22. the CAR value of all samples
ranged from the minimum value of 11,03% owned by BRI Sharia bank up to the
maximum value of 61,44% owned by Maybank Sharia Bank.
The average value of NPF which becomes the benchmark of asset quality in all samples
in this study is 2,97%, with a standard deviation of 1,8, the NPF value of all samples
ranged from the minimum value of 0% owned by Maybank Sharia Bank to 13,54%
owned by Bank Jabar Banten Sharia.
The average value of NPM that becomes the benchmark of management in all samples
in this study is equal to -1,34%, with a standard deviation of 20,75 then the NPM value
of all samples ranged from the minimum value of 98,49% owned by Mega Sharia bank
to 61,89% owned by Maybank Sharia Bank.
The average value of NOM which becomes the benchmark of earnings on all samples
in this study amounted to -3,07%, with a standard deviation of 9,41 then the NOM value
of all samples ranged from the minimum value of -53,06% owned by Victoria Sharia
Bank to 6,16% owned by Mandiri Sharia Bank .
The average value of FDR that becomes the benchmark of liquidity in all samples in
this study was 97,07%, with a standard deviation of 22,85 then the FDR value of all

50
samples ranged from the minimum value of 76,79% owned by BRI Sharia bank to
227,11% owned by Maybank Sharia Bank.
The average value of ROA that becomes the benchmark of lprofitability in all samples
in this study was -0,234%, with a standard deviation of 4,03 then the ROA value of all
samples ranged from the minimum value of -20,13% owned by Maybank Sharia bank
to 11,97% owned by Mega Sharia Bank .
However, after data elimination, the resulting descriptive analysis changes as shown
Table 4.2,
Table 4.2 Descriptive Statistics (After Data Elimination)
Source: SPSS 20.0 Software
Based on Table 4.2., the researcher is able to prepare a description for each variable as
follows:
The average value of CAR that becomes capital benchmark in all samples in this study
is 18,467%, with a standard deviation of 8,005. The CAR value of all samples ranged
from the minimum value of 11,03% owned by BRI Sharia bank up to its maximum
value of 43,20% owned by BCA Sharia Bank.
The average value of NPF which becomes the benchmark of asset quality in all samples
in this study is 2,37%, with a standard deviation of 1,34. The NPF value of all samples
ranged from the minimum value of 0,17% owned by BCA Sharia Bank up to 4,7%
owned by Mandiri Sharia Bank.
The average value of NPM that becomes the benchmark of management on all samples
in this study amounted to 4,82%, with a standard deviation of 2,68. the NPM value of

51
all samples ranged from the minimum value of -0.69% owned by Mandiri Sharia bank
up to 10.78% owned by BNI Sharia Bank.
The average value of NOM which becomes the measurement tool of earnings aspect in
all samples in this study was 0,68%, with a standard deviation of 0,79. The NOM value
of all samples ranged from the minimum value of -0,08% owned by Bukopin Sharia
bank up to 6.16% owned by Mandiri Sharia Bank.
The average value of FDR that becomes the measurement tool of liquidity in all samples
in this study is 89,25%, with a standard deviation of 6,13. The FDR value of all samples
ranged from the minimum value of 76.,9% owned by BRI Sharia bank up to 102,10%
owned by BCA Sharia Bank.
The average value of ROA that becomes the measurement tool of profitability in all
samples in this study is 0,77%, with a standard deviation of 0,41. The ROA value of all
samples ranged from the minimum value of 0,08% owned by BRI Sharia bank up to
1,65% owned by BNI Sharia Bank.
4.2. Inferential Analysis
In this part, the researcher will do the inferential analysis to the data collected.
Inferential analysis is an analysis derived from research on the sample data. This part
of analysis will test the significance and level of inferential error. Both of them can be
used for identifying the error in generalization. At the end, the researcher will make a
conclusion based on the result from inferential analysis. Analysis that will be implement
consist of regression analysis, classical assumption, and the goodness of fit that will be
explained as follows
4.2.1. Classical Assumption Test
In order to use regression analysis with ordinary least square, data should be tested with
classical assumption testing. There are 4 types of test in the classical assumption test.
These tests are tested for normality, heteroscedasticity, autocorrelation, and
multicollinearity tests.

52
4.2.1.1. Normality Test
This test is used to test whether a particular value is significantly different or not with
the average of a sample. The result will determine whether the research data has a
normal distribution or dont have extreme data. The data which will be analyzed using
parametric statistics must satisfy the assumption of normality to avoid getting invalid
T-test and F-test. This research will use Kolmogorov Smirnov method for normality
test by looking at assymp Sig. value. Assymp.sig will be used to test the hypothesis
below
H0: Normally distributed data
Ha: The data is not normally distributed
Table 4.3 Result of Normality Test (Before Data Elimination)
Source: SPSS 20.0 Software
From the processed data, it produces Asymp. Sig 0,00 that can be seen in Table 4.3. By
comparing with significance level used in this research that is 0,05, got information that
Asym. Sig owned research data is smaller than a significance level that has been
determined. This means that data is not normally distributed or there is a problem of
normality that occurs in this data. Since normal distributed data is required to pass this
regression assumption test, the researcher will transform the data or eliminate the data
outliers to obtain normally distributed data.

53
After eliminating the data, the number of samples from 99 observational data from 11
banks to 63 observational data from 7 Sharia banks. After recalculation with the data
that has been updated, obtained results as in Table 4.4,
Table 4.4 Result of Normality Test (After Data Elimination)
Source: SPSS 20.0 Software
From the processed data using data that has been eliminated the outlier, Asymp. Sig
produced is 0,521. By comparing with significance level used in this research that is
0,05, we got information that Asym. Sig owned greater than a significance level that
has been determined. This means that the data is normally distributed or there is no
problem of normality that occurs in this data.
4.2.1.2. Multicollinearity Test
Regression assumption test will be fulfilled when multicollinearity test from research
data showed have no multicollinearity. To know the presence or absence of
multicollinearity in this research data, used Variance Inflation Factor. The Variance
Inflation Factor is used to measure the closeness of relationships between variables.
Table 4.5 Result of Multi-Collinearity Test
Source: SPSS 20.0 Software

54
Based on multicollinearity test results in table 4.5, it shows the results of
multicollinearity test that has been done. It can be seen the VIF value of the test < VIF
= 10 and all tolerance more than 10%. So it can be concluded in the form of the research
data does not contain multicollinearity problem.
4.2.1.3. Heteroscedasticity test
Heteroscedasticity test is used to know whether it contains homoscedasticity or not. It
usually occurs in time series data. Since the form of data from this research is data panel
that consist of time series and cross sectional data, it is needed to do the autocorrelation.
A test of regression assumptions will be fulfilled if the research data contains
homoscedasticity. Heteroscedasticity tests will be performed to test the following
hypotheses:
H0: Research data is homoscedasticity.
H1: Research data is not homoscedasticity
Then heteroscedasticity test on SPSS 2.0 software and the results as shown in Table 4.6
below
Table 4.6 Result of Heteroscedasticity test
Source: SPSS 20.0 Software
55
To determine the existence of heteroscedasticity in this research is to see significant
coefficient of each variable from Spearman test. In Table 4.6. It can be seen significant
coefficient of every variable greater than 0,05. In theory, if significant coefficient >
0,05 then the null hypothesis is accepted. With these conditions can be concluded in
this research data does not occur heteroscedasticity or in other words this research data
contains homoscedasticity.
4.2.1.4. Autocorrelation Test
Autocorrelation is used for testing whether there is residual error that relates to each
other. It usually occurs in time series data. Since the form of data from this research is
data panel that consist of time series and cross sectional data, it is needed to perform
the autocorrelation test. Regression assumptions will be fulfilled if the data of research
has no autocorrelation. The research will use Durbin Watson test as its autocorrelation
test. This test will use Durbin Watson coefficient obtained from running the
autocorrelation test in SPPS to detect an autocorrelation problem in this research data
and will compare it with Durbin Watson from the Table 4.7 below,
Table 4.7 Result of Autocorrelation Test
Source: SPSS 20.0 Software
Based on the results of autocorrelation test contained in Table 4.7., it can be seen the
value of Durbin Watson obtained is 1,573. Researchers looked for Durbin Watson in
the Table using α = 0,05; k = 5 and n = 63 and found dL of 1,4265 and dU of 1,7671.
By using the criteria, it has already described in the research methodology, it can be
concluded that autocorrelation cannot be explained.
Due to this matter, the researcher uses another criterion that the research data can be
concluded not having autocorrelation as long as the Durbin Watson value has been
calculated to be between -2 and 2 (Jaya, 2014). And Durbin Watson from the
56
calculation using SPSS 20.0 software produces 1,573 and lies between -2 and +2, it can
be concluded that this research data does not have autocorrelation problem.
4.3.2. Multiple linear regression Analysis
Researchers process data by using multiple linear regression with ordinary least square
method. The method is used to know the relationship between two or more independent
variables and one independent variable. By using SPSS 20.0 software, it is known that
the coefficient can be used to complete the regression model, as shown in Table 4.8.
below,
Table 4.8 Result of Multiple linear regression Analysis
Source: SPSS 20.0 Software
To create a regression model, the researcher will use the value in the unstandardized
coefficient column. The constant value of the column will be the Y intercept of the
regression model, while the other value is the coefficient for the influence of each
independent variable to the dependent variable. By using the unstandardized regression
coefficient contained in the table and the regression model described previously,
obtained regression model for this study can be seen below
Y = 1,275 + 0,007x1 − 0,056x2 + 0,113x3 + 0,021x4 − 0,012x2
(Eq. 4.1)
Explanation:
Y = Return on Assets (ROA)
x1 = Capital Adequacy Ratio (CAR)
57
x2 = Non Performing Financing(NPF)
x3= Net Profit Margin (NPM)
x4= Net Operating Margin (NOM)
x5 = Financing to Deposit Ratio (FDR)
Based on regression model and Table 4.8 above, the result of multiple linear regression
can be explained as follows.
1. In the table, it can be seen that constant coefficient is 1,275 with a positive sign. This
means that if all independent variables are zero, then the dependent variable which is
ROA will rise by 1,275%.
2. In the table, it can be seen that unstandardized regression coefficient of CAR is 0,007
with positive sign. This means that if the CAR has increased by 1%, then the dependent
variable which is ROA will rise by 0,007%.
3. In the table, it can be seen that unstandardized regression coefficient of NPF is 0.056
with a negative sign. This means that if the NPF increased by 1%, then the dependent
variable that is ROA will decrease by 0,056%.
4. In the table, it can be seen that unstandardized regression coefficient is NPM of 0,113
with a positive sign. This means that if the NPM increased by 1%, then the dependent
variable which is ROA will rise by 0,113%
5. In the table, it can be seen that unstandardized regression coefficient of NOM of
0,021 with a positive sign. This means that if the NOM has increased by 1%, then the
dependent variable which is ROA will rise by 0,021%.
6. In the table, it can be seen that unstandardized regression coefficient of FDR is 0,012
with the negative sign. This means that if the FDR has increased by 1%, then the
dependent variable which is ROA will decrease by 0,012%.
4.2.2. The Goodness of Fit
The goodness of fit or test the feasibility of the model used to measure the precision of
the sample regression functions in estimating the actual value. The goodness of fit of a

58
model can be known through coefficient of dertemination, hypothesis testing consists
of F-test and T-test.
4.2.2.1. Coefficient of Determination
To see how big, the influence of the independent variables to the dependent variable,
can use coefficient of determination or by looking at the coefficient of adjusted R
Square.
Table 4.9 Result of Adjusted R Square
Source: SPSS 20.0 Software
Based on the above table, it can be seen adjusted R Square value of 0,732. This indicates
that the independent variables studied have a 73,2% effect on the variation of the
dependent variable. In conclusion CAR, NPF, NPM, NOM, and FDR have an effect of
73,2% on variations that occur in ROA. And obtained the amount of error that is 1-
0,732 = 0,268. It means that 26,8% of the dependent variables are explained by other
independent variables not included in this study.
4.2.2.2. F test
F-test is used to determine the magnitude of the effect of independent variables
simultaneously to the dependent variable. Simultaneously means the effect of
independent variable along with the independent variable to dependent variable. In the
F-test will determine the hypothesis to be accepted, whether null hypothesis or
alternative hypothesis below
Hypothesis null = CAR, NPF, NPM, NOM, and FDR simultaneously have
significant influence on ROA of Sharia bank operating in
Indonesia

59
Hypothesis alternative = CAR, NPF, NPM, NOM, and FDR simultaneously have not
signficant influence on ROA of Sharia bank operating in
Indonesia.
To perform the F-test, the researcher process the research sample using SPSS 20.0
Software and produce the following results
Table 4.10 Result of F-Test
Source: SPSS 20.0 Software
In table 4.10 above can be seen that the results of F test shows the value of F-Testc
amounted to 34.806 with a significance of 0,000. The value of that significance will be
compared with the significance level used in this study. A significance level in this
study is 5% meaning the risk of mistake to make is 5%. It turns out that the significance
value is smaller than 0,05 it shows that the independent variables simultaneously affect
the dependent variable so that the proposed hypothesis is CAR, NPF, NPM, NOM, and
FDR influence simultaneously to the Return On Assets (ROA) accepted. That is, any
changes that occur in the independent variables of CAR, NPF, NPM, NOM, and FDR
simultaneously or together will affect ROA of Sharia bank operating in Indonesia.
4.2.2.3. T-test
T-test is used to determine the magnitude of the effect of independent variables partially
to the dependent variable. This test measures correlation for each independent variable
with one variable dependent in this research. The T-test will determine whether or not
a hypothesis has been made in the research methodology chapter below

60
Hypothesis 1 = There is a significant influence of CAR toward ROA of Sharia banks
in Indonesia
Hypothesis 2 = There is a significant influence of NPF toward ROA of Sharia banks
in Indonesia
Hypothesis 3 = There is a significant influence of NPM toward ROA of Sharia banks
in Indonesia
Hypothesis 4 = There is a significant influence of NOM toward ROA of Sharia banks
in Indonesia
Hypothesis 5 = There is a significant influence of FDR toward ROA of Sharia banks
in Indonesia
To perform T-Test, the researcher process the research sample using SPSS 20.0
Software and produce the following results.
Table 4.11 Result of T-Test
Source: SPSS 20.0 Software
From table 4.11 above, then the result of multiple linear regression can analyze the
influence of each variable of CAR, NPF, NPM, NOM, and FDR and know the direction
of its influence to ROA by looking to the coefficient on unstandardized coefficient
(Beta) column and see the sign. In addition, from the table, it can also be seen how
significant the influence of independent variables are CAR, NPF, NPM, NOM, FDR to
dependent variable that is ROA. The researcher describes the results of the T-test for
each of the following variables:
61
A. T-test result of CAR effect towards ROA
As the result of this research, it can be seen that the beta coefficient for CAR is 0,007
which means that it has positive impacts to ROA. In the other hand, the significant
value from the calculation or p value is 0,138 in which this value is not significant
because it is higher than 0,05. Due to p value is higher than 0,05, then, in this case,
the impact CAR to ROA is not significant as well. Therefore, hypothesis 1 is
rejected.
B. T-test result of NPF effect towards ROA
As the result of the research, it can be seen that coefficient regression for NPF is -
0,056 which means that it has negative impacts to ROA. In the other hand, p value
is 0,090 in which this value is not significant because it is higher than 0,05. Due to
p value is higher than 0,05%, then, in this case, the impact of NPF to ROA is not
significant. Therefore, hypothesis 2 is rejected.
C. T-test result of NPM effect towards ROA
As the result of the research, it can be seen that the coefficient regression for NPM
is 0,113 which means that it has positive impacts to ROA. In the other hand, p value
is 0,000 in which the value is significant because it is lower than 0,05%., so that in
this case, the impacts of NPM to ROA is significant. Therefore, hypothesis 3 is
accepted.
A. T-test result of NOM effect towards ROA
As the result of the research, it can be seen that the coeficient regrression for the
NOM is 0,021 which means that it gives positive impacts to ROA. In the other hand,
p value is 0,548, in which this value is not significant because it is higher than 0,05.
Due to p value is higher than 0,05%, then it will not give the significant impacts of
FDR to ROA. Therefore, hypothesis 4 is rejected.
B. T-test result of FDR effect towards ROA
As the result of the research, it can be seen that the coeficient of regression for FDR
is -0,012 which means that it has negative impacts to ROA. In the other hand, p value
is 0,019 in which that it is significant because it is lower than 0,05. Due to p value is

62
lower than 0,05%, then, in this case, the impacts of FDR to ROA is significant.
Therefore, hyphotesis 5 is accepted.
4.2.3. Interpretation Result
4.2.3.1. The Influence of CAR, NPF, NPM, NOM, and FDR Simultaneously
toward ROA
As what we can see in the table 4.10, it can be seen that the results of the test show the
value of F-test is 53.357 with p value of 0,000. It is smaller than 0.05 means that
independent variables signficantly affect simultaneously against the dependent
variables. So that the proposed hypothesis, namely CAR, NPF, NPM, NOM, and FDR
have influence simultaneously against the Return On Assets (ROA) is received. This
means that any changes that occur in the independent variable tthat consist of CAR,
NPF, NPM, NOM, and FDR simultaneously or together will affect ROA on Sharia bank
in Indonesia. And its ajusted R2 from table is 73,2%. It means 73,2% variation of ROA
can be explained by CAR, NPF, NPM, NOM, and FDR. While the rest which is 26,8
are explained by other independent variables not included in this study.
4.3.1. The Influence of Capital Adequacy Ratio (X1) towards Return on Assets (Y)
As what we know that the aspect of capital in CAMEL consists of adequate capital that
is very important to ensure the bank to be well operated and performed its function
properly by saving enough assets. However, the high number of CAR can reduce the
ROA because the assets, which is stored in a bank as capital, cannot be used for
producing the profit or doing any expansion activities. CAR is used to measure capital
by calculating the capital available to anticipate risk from its risk weighted assets.
Because of that the bank is required to keep the CAR is above the conditions on or
around 8% to keep the stability of the bank and keep the bank's expansion activities.
The research’s results have obtained for unstandardized regression coefficient variable
of CAR is 0,007 meaning it influences positively against ROA. Because the better the
bank manages its capital to anticipate the unexpected losses because funds set aside for
capital are high. With the increasing reserves, the ability of bank in generating profit
will increase and led to the increasing of ROA. Thus the increase in the ratio of the
CAR will cause a rise in the ratio of the ROA which means CAR has positive impact

63
against ROA. In addition, the significance of the value owned by this variable is 0,139
where this value was not significant because it is greater than 0,05 or 5% significance
level of this research. So in this case the influence of CAR against ROA is not
significant. Thus, the hypothesis null 1 states that CAR affect ROA rejected.
This finding supports the results of the study of (Armereo, 2015) which suggests that
the influence of the CAR partially has no significant effect against ROA by using
multiple linear regression method to know the influence of CAR against ROA. The
results of his research is the coefficient of the variable capital aspect of CAMEL which
being measured with the Capital Adequacy Ratio (CAR) with probability value of
0,120. That means that CAR has no significant impact on ROA.
It is happen because capital in CAR only absorb potential losses (Ikatan Bankir
Indonesia, 2013). So if there is no losses happen at that period, capital will not able to
increase its profit.
It means that management can put attention on the bank capital in order to maintain and
improve profitability of the bank. Because CAR has a positive but not significant effect
in ROA, while CAR is the measurement tool of capital and ROA is the measurement
tool of profitability. It means that bank with higher capital will have higher profitability
rather than bank with low capital.
4.2.3.2. The Influence of Non Performing Financing (X2) towards Return on
Assets (Y).
As what we know that Asset Quality aspect in CAMEL functioning to assess the
management of financing risk and condition of bank assets. These aspects can be
quantified by using NPF ratio which has the formula of dividing non performing
financing from its total financing. This is to explain the quality of assets of all assets
owned by Islamic banks.
The research’s results have obtained for unstandardized regression coefficients of NPF
is -0,056 meaning it influences negatively against ROA. Because the larger the NPF
then if a bank has a high ratio of NPF, the number of problem assets owned by the bank
is high. It has a bad impact on the profit that will be obtained by the bank because in
addition to funds that have been used on financing to the borrower's will not return, but

64
also profit from lending is failed to get. Thus the increase in the ratio of NPF will cause
a rise in the ratio of ROA who enter profit into its formulas, which means that NPF has
a negative impact against ROA. In addition, the p value is 0,090 where this p value was
not significant because is greater than 0,05. Because of the level of signification is more
than 5% so in this case the influence of NPF against ROA is not significant. Thus, the
hypothesis null 2 states that NPF affect ROA rejected.
This finding supports the research results from (Ummah & Suprapto, 2015) which
suggests that the influence of the NPF partially effect against ROA. (Ummah &
Suprapto, 2015) do the analysis using Vector Correction Model with the aim of
analyzing the influence of variable NPF against ROA. The results of their research is
one of the independent variable that is asset quality which is represented with the Non
Performing Financing. NPF influence variables are negative towards the ROA so that
it can be interpreted that the higher value of NPF sharia bank result in the higher ROA.
And based on the results of testing on VECM on short term using short term VECM,
the result are NPF has no significant influence towards probability. That means the NPF
effects negatively and no significant towards ROA.
It is happen because non performing financing also incluse substandard financing and
doubtfull financing (Solihin, 2010). In which it still has probability of the borrower to
give profit to bank. So higher in non performing financing ratio which means higher
NPF doesnt necessarily lowering profitability.
It means that management can put attention on the bank capital in order to maintain and
improve profitability of the bank. Because NPF has a negative but not significant effect
in ROA, while NPF is the measurement tool of asset quality and ROA is the
measurement tool of profitability. It means that bank with lower capital will have higher
profitability rather than bank with high capital.
4.2.3.3. The Influence of Net Profit Margin (X3) towards Return on Assets (Y).
As what we know that aspect of management in CAMEL consider general management,
implementation of risk management system, the bank's decision on the provisions as
well as commitments to Indonesian banks on his judgement. Net Profit Margin
describes the quality of a bank's management in applying its strategy and managing its

65
risks can represent aspects of management. Due to net profit contained in net profit is
the result of managing credit risk, liquidity, operational risk, legal risk, and owner risk.
The research’s results have obtained for unstandardized regression coefficients of NPM
is 0,113 meaning it influences positively against ROA. Because higher NPM of a bank,
higher the ROA that the bank has. The higher this ratio, the better the bank's
management in generating income. Thus the higher the ability of bank to generate
income which will also increase ROA that consist of net profit. Thus the increase in the
ratio of the NPM will cause a rise in the ratio of the NPM means that NPM has positive
and significant impact against ROA. In addition, the p value is 0,000 and smaller than
0,05. Because of the p value less than 5% then in this case the influence of NPM against
ROA is significant. Thus, the hypothesis null 3 that states NPM has a significant effect
against ROA is acceptable.
This is in accordance with the results of research conducted by (Indyarwati, 2017) that
shows that the influence of NPM partially positive effect against ROA. By using
multiple linear regression analysis with the aim of analyzing the influence of NPM
variable against ROA, the results of her research are the coefficients of the regression
of the NPM is 0,002 where it is lower than the significance level is 5%. It means that
NPM has a positive effect and significant against ROA.
It means that management can put more attention on the bank capital in order to
maintain and improve profitability of the bank. Because NPM has a positive and
significant effect in ROA, while NPM is the measurement tool of management and
ROA is the measurement tool of profitability. It means that bank with higher capital
will have higher profitability rather than bank with low capital.
4.2.3.4. The Influence of Net Operating Margin (X3) towards Return on Assets
(Y).
As what we know that aspect of earnings in CAMEL assesses the condition and ability
of banks in obtaining profit in order to support operational activities and provide capital.
NOM is a ratio that measures the ability of banks to process their productive asset to
generate income. Because is the amount of profit and loss sharing earned and paid by
the bank to total productive assets
66
The research’s results have obtained for unstandardized regression coefficient variable
of NOM is 0,021 meaning it influences positively against ROA. The higher this ratio,
the better the bank's management in generating income. Thus the higher the ability of
banks to generate income which will also increase ROA that consist of net profit results
showed that the greater the NPM then getting bigger also ROA which is owned by the
bank. The higher this ratio, the better the bank's management in generating income.
The higher the ability of banks to generate income which will also increase ROA that
consist of net profit. Thus the increase in the ratio of NOM will cause a rise in the ratio
of the ROA means that NOM has positive impact againsts ROA. In addition, the p value
which has been calculated by using SPSS software is 0,548 in which this value is not
significant because is greater than 0,05. Because of the p value is more that 5% so in
this case the influence of NOM against ROA is not significant. Thus, the hypothesis
null 4 states that NOM has significant effect on ROA is rejected.
This is in accordance with the results of research conducted by (Purnamasari &
Ariyanto, 2016) that shows that the influence of NOM partially positive effect against
ROA. (Purnamasari & Ariyanto, 2016) do the anaylsis using multiple linear regression
methods with the aim of analyzing the influence of variable NOM against ROA. The
results of their research are the coefficients of the regression of the NOM is 0,232 where
it is higher than the significance level which is 5% which means that that NOM
influence positively towards ROA but not significant.
It is happen because bank depend more on its operational activities for generating
income so increasing in profit from profit and loss sharing in NOM will not
significantly affect profit which measured by ROA (Stephani, Adenan, & Hanim,
2017).
It means that management can put more attention on the bank capital in order to
maintain and improve profitability of the bank. Because NOM has a positive but not
significant effect in ROA, while NOM is the measurement tool of earnings and ROA is
the measurement tool of profitability. It means that bank with higher capital will have
higher profitability rather than bank with low capital.

67
4.2.4. The Influence of Financing to Deposit Ratio (X3) towards Return on Assets
(Y)
The research’s results have obtained for unstandardized regression coefficient of FDR
is -0,012 variable which means the effect in negative against ROA. In addition, the
significance level of FDR has values of 0,019 which this value is significant because is
smaller than 0,05. Because the level of signification is smaller than 5% then in this case
the influence of FDR against ROA is significant.
As what we know that aspect of liquidity on a CAMEL assess the ability of the bank to
meet its financial obligations when its due, it can be measured by using LDR. It is shows
the bank's ability to fulfill their debt obligation can repay all customer without problem
by pay all the customer deposit withdrawals by using credit given. Since Sharia bank
adopt 0% interest financing so the ratio will be financing to deposit ratio.
The research’s results have obtained for unstandardized regression coefficients of FDR
is -0,012 variable meaning it influences negatively towards. The lower ROA this ratio,
more funds available to the bank. Therefore, the rest of the deposit will remain at the
bank and cannot be used to generate profits that led to the decrease in profit. Low in
profit means a negative impact on ROA obtained by banks because ROA put net income
on its account. Thus the increase in the ratio of the FDR will cause a decrease in the
ratio of the ROA means that FDR has negative impact against ROA. In addition, the p
value which has been calculated is 0,019 in which this value is not significant because
is smaller than 0,05. Because the p value is less than 5% so in this case the influence of
FDR against ROA is significant. Thus, the hypothesis null 5 states that FDR affects
significantly against ROA is accepted.
This is in accordance with the results of research conducted by (Indyarwati, 2017)
which suggests that the influence of FDR in partial effect negatively to ROA. By using
multiple linear regression methods with the aim of analyzing the influence of variable
FDR against ROA. The results of her research are the coefficients of the regression of
the FDR is -0,013 and the p value is 0,000. That means FDR affect negative and
significantly againsts ROA.

68
It means that management can put more attention on the bank capital in order to
maintain and improve profitability of the bank. Because FDR has a negative and
significant effect in ROA, while FDR is the measurement tool of liquidity and ROA is
the measurement tool of profitability. It means that bank with lower capital will have
higher profitability rather than bank with high capital.
4.2.3.5. The Most Significant Variable Influence towards ROA
In order to find out where is the independent variable that influence most dominant
against the independent variable (ROA), can be seen from the highest value in the
column Unstandardized β coefficient in Table 4.8. The beta coefficient of the variable
component CAR, NPF, NPM, NOM, and FDR respectively are: 0,007; -0,056; 0,113;
0,021; -0,012 indicates that the NPM variable that has the dominant influence against
ROA. NPM has dominant influence can be described in the quality of a bank's
management in applying its strategy and managing its risks so as to generate income.
The higher this ratio, the better the bank's management in generating income which will
also increase ROA that consist of net profit. Thus, the greater the NPM, the higher the
ROA.
It means among CAMEL ratios, the management of bank can put more attention on the
NPM in order to maintain and increase ROA because this ratio has the most signifiicant
impact on the variance of ROA.
69
CHAPTER V
CONCLUSION AND RECOMMENDATION
This chapter contains the results of data that have been analyzed supported by literature
study that has been done. The result of the analysis is formed into the conclusion of the
answer to the problem contained in the problem statement. Then it contains the
recommendations indicated for the company and what can be added in the futures
research.
5.1. Conclusion
Based on data analysis and explanation of research result, the researcher conclude this
research result into some point, those are:
1. Based on F-test result, the research shows independent variables that consist of
CAR, NPF, NPM, NOM, and FDR simultaneously has significant influence toward
ROA. It means every change happen on independent variable which are CAR, NPF,
NPM, NOM, and FDR together and simultaneously affect Profitability that are
symbolized by Return On Assets (ROA) on Sharia Bank operating in Indonesia
2. Based on T-test result, Independent variables that consists of CAR, NPF, NPM,
NOM, and FDR partially has influence toward ROA. The influence of every
independent variable can be briefly described as statements below:
a. From the capital aspect ratio, which is CAR , partially has no significant and
positive influence towards ROA so the null hyphotesis (Ha) is rejected, because
CAR has more than 5% of p value. This condition conclude that the movement of
CAR cannot signfiicant influence the ROA movement.
b. From the asset quality aspect ratio, which is NPF, partially has no significant
influence toward ROA. This means alternative hypothesis is accepted, because
NPF has p value more than 5%. This condition conclude that the movement of
NPF cannot signfiicant influence the ROA movement.
c. From the management aspect ratio, which is NPM, it partially has significant
influence toward ROA. This means alternative hypothesis is accepted, because
NPM has p value less than 5%. This condition conclude that the movement of
NPM significant iinfluence the ROA movement. The positive effect of NPM
70
indicates that NPM is positively influence toward ROA. If NPM is increasing, the
better the bank's management in generating income. Thus the higher the ability of
banks to generate income which will also increase ROA that consist of net profit.
The higher NPM the ability of banks to earn profit, make the investor have
favorable to deposit their funds in a healthy bank and management can have more
funds for expansion activities
d. From the earnings aspect ratio, which is NOM, partially has a positive but not
significant influence towards ROA so the null hypothesis (Ha) is rejected, because
NOM has higher than 5% significance level. . This condition conclude that the
movement of NOM cannot signfiicant influence the ROA movement.
e. From the liquidity aspect ratio, which is FDR, partially has a significant negative
influence towards ROA so the null hypothesis (Ha) is accepted, because FDR has
p value less than than 5% of significance level. The effect of FDR indicates that
FDR is negative and significant influence toward ROA. The lower this ratio, more
funds available to the bank. Therefore, the rest of the deposit will remain at the
bank and cannot be used to generate profits that led to the decrease in profit. Low
in profit means a negative impact on ROA. The lower the ratio, the better ability
of banks to fulfill their debt obligation can repay all customer without problem by
pay all the customer deposit withdrawals by using credit given, make the depositor
have favorable to deposit their funds in a trusted and responsible bank.
f. Based on the unstandardized β coefficient, the independent variable that has the
most influence toward profitability (ROA) of Sharia bank operating in In Indonesia
is Net Profit Margin (NPM). It means among CAMEL ratios, the management of
bank can put more attention on the NPM in order to maintain and increase ROA
because this ratio has the most significant impact on the variance of ROA.
B. Recommendation
1. Sharia bank’s Management
Result of research on the impact of camel ratio to profitability can give more
knowledge to the owner and management of Sharia bank about the contribution of
CAMEL ratios to profitability.

71
With this research result, bank suggested to have high NPM and low FDR because
these ratio has been proved to have significant impact on Sharia banks’ ROA
2. Government
Given the importance of banks in a country's economy. OJK as bank supervisory
institution can put more attention to the ratio of camel in the assessment of a
condition of Sharia banks because the result of this study indicates that there is a
significant influence of CAMEL ratios to profitability. The result of this research
can give more consideration for OJK in taking or changing policies that may impact
on the profitability of Islamic banks either directly or indirectly through the ratio of
his and the others.
3. Current investor and potential investor
The profit of the investor also depends on the performance of the company where
the investor put his investment. Performance can be seen through the profitability.
This study gives another consideration for investors who invest in Sharia bank in
predicting the profit or loss that will be obtained is the ratio of camel in determining
the correct decision in determining whether he should withdraw or keep investing
his funds in the Sharia bank. Because the results of this study indicate the significant
influence of camel ratio on the profitability of Sharia banks.
The result of this research is also useful for potential investors to determine where
he will put his investment by putting more attention to the the ratio of camel as
another benchmark. Because the ratio of camel impact on profitability and
profitability can illustrate the current financial condition and prospects in the future.
4. Future research
This study has boundaries and scope of the subjects studied. This can be used other
researchers as a reference to conduct further research on the profitability of Sharia
banks. Other studies may examine with a wider scope of discussion and less
limitation. For example, this study only looks for the influence of camel ratios on
proficiency, subsequent research can include other ratios as other independent
variables that may have an influence on profitability. In addition, it not only

72
discusses the internal factors, but also can add external factors as independent
variables and use other dependent variables
5. The Researcher
Increase knowledge for the researcher especially about profitability in Sharia bank
and how to do research so hopefully there will be other research made in the future.

73
References
Journals
Aditiasari, D. (2018, April 11). Detik Finance. Retrieved from Detik.com:
https://finance.detik.com/moneter/d-3076959/7-hambatan-yang-buat-bank-
syariah-lambat-berkembang
Anggita, E. (2012). Analisis CAMEL untuk menilai profitabilitas di bank syariah
periode 2008-2011.
Anwar, A. N. (2016). Analysis of Indonesian Islamic and Conventional Banking Before
and After 2008 . International Journal of Economics and Finance, 8(11), 196.
Arifi, Z. (2012). Dasar Dasar Manajemen Bank Syariah (Revisi ed., Vol. 7). Pustaka
Alfabet.
Arifin, J. (2017). SPSS 24 untuk Penelitian dan Skripsi. Jakarta: Elex Media
Computindo.
Arifin, Z. (2008). Dasar-Dasar Penulisan Ilmiah (4 ed., Vol. 7). Jakarta: Grasindo.
Armereo, C. (2015). Analisis Faktor-Faktor yang Mempengaruhi Profitabilitas Bank
Syariah yang Terdaftar di Bursa Efek Indonesia. Jurnal Ilmuah Ekonomi
Gllobal Masa Kini, 6(1).
Ashish, S., & Sri, S. (2012). Regression Anaysis: Theory, Methods, and Approach. New
York: Springer Science and BusinessMedia.
Aswad, M. (2014). SKEMA BAGI HASIL MUDHARABAH: Studi Feasibility
Terhadap Pemberdayaan Usaha Mikro Syari’ah. ADDIN, 8(1), 35.
Bellalah, M. B., & Masood, O. (2013). Islamic Banking and Finance (First Edition ed.).
Newcastle: Cambridge Scholars Publishing.
Beri, G. C. (2005). Business Statistics (Second edition ed.). New Delhi: Tata McGraw-
Hill Education.
Berry, W., & Feldman, S. (1985). Multiple Regression in Practice. USA: Sage.
Books

74
Central for Financial Training. (2010). Banking System (Second Edition ed.). USA:
South Western Cengage Learning.
Centre for Strategic and Imternational Studies. (2005). Dunia Ekuin dan Perbankan
(Vol. 18). Jakarta: Centre for Strategic and INternational Studies.
Chinonye, O. (2011). The effect of Capital Adequaccy on Banks' Performance. Journal
of Management, 31, 2.
Creswell, J., & Creswell, J. (2017). Research Design (Fifth edition ed.). SAGE.
CTI Reviews. (2016). Managerial Statistics: A cse-Based Approach. Cram101
Textbook Reviews.
DR. Juliansyah Noor, S. M. (2017). Metodologi Penelitina : Skripsi, Tesis, disertasi,
dan Karya Ilmiah (First Edition ed.). Jakarta: Kencana.
Drs.Ismail, M. A. (2010). Akuntansi Bank: Teori dan Aplikasi dalam Rupiah (Edisi
Revisi ed.). Jakarta: Kencana.
Electronic Sources
European System of IFnancial Supervision. (2017, July). Resolving non-performing
loans in Europe. European Systemic Risk Board, 7.
Fahmi, I. (2011). Analisis Kinerja Keuangan, Panduan bagi Akademis, Manajer, dan
Investor untuk Menilai dan Menganalisis Bisnis dari Aspek Keuangan.
Bandung: Alfabeta.
Fatima, N. (2014). Capital Adequacy : A FInancial Soundness INdicator for Banks.
Global Journal of Finance and Management, 773.
Fight, A. (2004). Understanding international bank risk. England: Wiley Finance.
Gandapradja, P. (2004). Dasar dan Prinsip Pengawasan Bank. Jakarta: PT Gramedia
Pustaka Utama.
Gani, I., & Amalia, S. (2015). Alat Analisis Data: APlikasi Statistik untuk penelitian
bidang ekonomi dan sosial. Yogyakarta: Andi.
Gitman, L., & Joenk, M. (2008). Fundamentals of Investing. Pearson.

75
Hadinoto, S. (2008). Bank Strategy on Funding and Liability. Jakarta: Elex Media
Komputindo.
Haribowo, I. (2017). The Indonesia Islamic Bank's Spin Off: A study in regional
development Banks.
Hery. (2017). Kajian Riset Akuntansi. Jakarta: PT Gramedia.
Husein, A., & Hasib, F. (2016). Tingkat Kesehatan Bank : Analisa perbandingan
pendekatan camels dan RGEC. Jurnal Ekonomi SYariah Teori dan Terapan,
3(2), 104.
Ikatan Bankir Indonesia. (2013). Memahami Bisnis Bank. Jakarta: Gramedia Pustaka
Utama.
Ikatan Bankir Indonesia. (2014). Mengelola Bank Syariah : Model Sertifikasi Tingkat
II General Banking Syariah (1 ed.). Jakarta: PT Gramedia Pustaka Utana.
Ikatan Bankir Indonesia. (2016). Supervisi Manajemen Resiko Bank. Jakarta: Gramedia
Pustaka Utama.
Ikatan Bankir Indonesia. (2018). Bisnis Kredit Perbankakn. Jakarta: PT Gramedia
Utama Pustaka Utama.
Ikit. (2015). Akuntansi Penghimpunan Dana Bank Syariah. Yogyakarta: Deepublish.
Inayati, S. (2014). Analysis the impact of CAMEL Ratios to profitability Syariah Bank
listed in Bank Indonesia. Jurnal KIAFE, 3(4).
Indyarwati, E. (2017). Pengaruh rasio CAMEL terhadap Kinerja Keuangan Perbankan
Syariah. Jurnal Ilmu dan RIset Akuntansi.
Jacob, J. (2013). Analisis Laporan Keuangan dengan menggunakan Metode CAMEL
untuk menilai tingkat kesehatan perbankan. Jurnal EMBA, 3(2), 867.
Jaseviciene, F. (2012). The Ethics of Banking: Analysis and Estimates. Ekonomika,
91(101).

76
Jaya, I. (2014). Pengaruh Disiplin Pegawai dan Lingkungan Kerja terhadap kinerja
apatur kelurahan di kecamatan tanjung redep kabupaten Berau. Jurnal
Administrasi Publik dan Birokrasi, 1(3), 67.
Juliandi, A., Irfan, & Manurung, S. (2014). Metodologi Penelitian Bisnis. Medan:
UMSU Press.
Kasmir. (2009). Pengantar Manajemen Keuangan (Second ed.). Jakarta: Kencana.
Khotibul, U. (2016). Perbankan Syariah: Dasar-dasar dan Dinamika
Perkembangannya di Indonesia. Jakarta: Rajawali Pers.
KLaluas, A., Mangantar, M., & Mekel, P. (2014). Analisis Kinerja Bank BUMN
menggunakan metode CAMEL. Jurnal EMBA, 2(3), 178.
Kurniawan, R., & Yuniarto, B. (2016). Analisis Regresi : Dasar dan Peneraoannya.
Jakarta: Kencana.
Kuswadi, & Mutiara, E. (2004). Delapan Langkah dan Tujuh Alat Statistik untuk
peniingkatan mutu berbasis komputer. Jakarta: Delta.
Ledgerwood, J., & White, V. (2006). Transforming Microfinance Institution :
Providing Full Financial Services to the Poor. Washington DC, USA: The
World Bank.
Marimin, A., Romdhoni, A. H., & Fitria, T. N. (2015). Perkembangan Bank Syariah
Di Indonesia. Jurnal Ilmiah Ekonomi islam, 81.
Matnin. (2016). Kinerja dan Kesehatan Bank Islam (Vol. 1). Surabaya: Jurnal DINAR
Ekonomi Syariah.
Muliawati, S., & Khoiruddin, M. (2015). Faktor Faktor Penentu Profitabilitas Bank
Syariah Di Indonesia. Management Analysis Journal, 4(1).
Pramesti, G. (2016). Staatistika Lengkap secara Teori dan Aplikasi dengan SPSS 23.
Jakarta: PT Elex Media Komputindo

77
Purnamasari, G., & Ariyanto, D. (2016). Analisis Perbandingan Kinerja Keuangan
Bank Konvensional dan Bank Syariah Periode 2010-2024. E-journal Akuntansi
Universitas Udayana, 15(1).
Purwanto, A. (2007). Peraturan Laboratorium Statistik Inferential. Jakarta: Grasindo.
Rachmawati, L. (2017). Analisis Rasi CAMELS dengan Pendekatan PBI NO.
9/1/PBI/2007) terhadap Return On Equity. Wacana Equilibrium, 2(2).
Rangkuti, F. (2006). Analisis SWOT: Teknik Membedah Kasus Bisnis. Jakarta: PT
Gramedia Pustaka Utama.
Sahai, H., & I, M. A. (2007). The Analysis of Variance: Fixed, Random and Mixed
Model. Boston: Birkhauser.
Santoso, S. (2010). Statistik Nonparametrik. Jakarta: PT Elex Media Komputindo.
Sarwono, J., & Budiono, H. (2012). Aplikasi untuk Riset Skripsi, Tesis, dan Disertasi
Menggunakan SPSS, AMOS, dan Exel. Jakarta: PT. Exel Media Komputindo.
Schroeder, L., Sjoquist, D., & Stephan, P. (2017). Understanding Regression Analysis
(Second ed.). USA: Sage.
Scott, W. R. (2000). Financial Accounting Theory (Second ed.). Canada: Pearson.
Sekaran, U., & Bougie, R. (2013). Research Moethod for Business. Wiley.
Shamsuddin, Z., & Ismail, A. G. (2013). Agency Theory in Explaining Islamic
Financial Contracts. Middle-East Journal Scientific Research, 532
Siagian, D. S. (2006). Metode Statistika Untuk bisnis dan Ekonomi. Jakarta: PT
Gramedia Pustaka Utama.
Sitepu, N. (2015). Peran Bank Syariah. Jurnal Perspektif Ekonomi Darussalam, 56.
smail. (2015). Akuntansi Bank (Vol. 5). Jakarta: Prenadamedia Grup.
Solihin, A. I. (2010). Buku Pintar Ekonomi Syariah. Jakarrta: PT Gramedia Pustaka
Utama.

78
Stephani, R., Adenan, M., & Hanim, A. (2017). Analysis of FInancial Ratio Influenca
to Commercial Bank's Performance in Indonesia. e-Journal Ekonomi Bisnis dan
Akuntansi, 4(2).
Sudaryo, Y., & Yudanegara, A. (2017). Investasi bank dan lembaga keuangan.
Yogyakarta: CV. Andi Offset.
Sugiyono, A., & Untung, E. (2008). Panduan Praktis Dasar Analisa Laporan
Keuangan. Jakarta: Grasindo.
Suryani. (2011). Analisis Pengaruh Financing To Deposit terhadap Profitabilitas
perbankan syariah di Indonesia. Walisongo, 19(1), 49.
Sutopo, Y., & Slamet, A. (2017). Statistika Inferential. Yogyakarta: ANDI.
Tampomas, H. (2003). Sistem Persamaan Linear Statistika. Jakarta: Grasindo.
Trisnigtyas, V., & Mutaher, P. (2013). analisis Faktor Faktor yang mempengaruhi
kinerja keuangan pada bank umum syariah di indonesia. Jurnal Akuntansi
Indonesia, 3(2), 134.
Ummah, F. K., & Suprapto, E. (2015). Faktor Faktor yang mempengaruhi profitabilitas
pada bank muamalat indonesia. Jurnal Ekonomi dan Perbankan Syariah, 3(2).
Urda, T. C. (2011). Statistic in Plain (Third ed.). New York: Taylor and Francis Group.
V. Rajasekaran, & R.Lalitha. (2011). Financial Accounting. India: Pearson.
Vogt, W., Gardner, D. C., & Haeffele, L. M. (2012). When to Use What Research
Design. New York: The Guildford Press.
W.Gulo. (2010). Metodologi Penelitian. (6), 126. Jakarta: Grasindo.
Wangsawidjaja. (2012). Pembiayaan Bank Syariah. Jakarta: PT Gramedia Pustaka
Utama.
Wangsawidjaja. (2013). Pembiayaan Bank Syariah. Jakarta: Gramedia Pustaka Utama.
Yudiaatmaja, F. (2013). Analisis regresi dengan menggunakan aplikasi komputer
statistik SPSS. Jakarta: PT Gramedia Pustaka Utama.

79
Yusmad, M. A. (2018). Aspek Hukum Perbankan Syariah dari Teori ke Praktik (first
ed., Vol. 1). Sleman: Deepublish.
Zulfiah, F., & Susilowibowo, J. (2014). Pengaruh Inflansi, BI Rate, Capital Adequacy
Ratio (CAR), Non Perfoeming Finance (NPF), Biaya Operasional dan
Pendapata Operasional (BOPO) Terhadap Profitabilitas Bank Umum Syariah
Periode 2008-2012. Jurnal Ilmu Manajement, 2(3).
Electronic Sources
Bank Indonesia. (2017, 3 11). Bank Indonesia. Retrieved from Bank Indonesia:
https://www.bi.go.id/id/publikasi/laporan-keuangan/bank/umum-
syariah/Default.aspx
Kurniawan, Z. A. (2017, 3 11). Kompasiana. Retrieved from Kompasiana:
https://www.kompasiana.com/zulfaahmadkurniawan/mengukur-keberhasilan-
spin-off-bank-syariah-di-indonesia_58b05a7df77e61e41b7fc6f0
Otoritas Jasa Keuangan. (2018, 4 11). Otorita Jasa Keuangan. Retrieved from Otoritas
Jasa Keuangan: https://www.ojk.go.id/id/kanal/perbankan/data-dan-
statistik/booklet-perbankan-
indonesia/Documents/booklet_2014_opt_1395931938.pdf
Sage Publishing. (2017, 3 11). Sage Publishing. Retrieved from Sage Publishing:
https://www.sagepub.com/sites/default/files/upm-
binaries/57732_Chapter_8.pdf

80
Appendix
Company Quarter
CAR
(%)
NPF
(%)
NPM
(%)
NOM
(%)
FDR
(%)
ROA
(%)
BCA Syariah 30/06/2015
27,59
0,49
3,72
0,84
94,13
0,78
BCA Syariah 30/09/2015
43,20
0,50
3,96
0,90
102,10
0,90
BCA Syariah 31/12/2015
40,00
0,52
4,25
0,98
91,41
0,90
BCA Syariah 31/03/2016
39,16
0,40
3,56
0,79
92,76
0,76
BCA Syariah 30/06/2016
37,93
0,47
4,18
0,94
99,60
0,90
BCA Syariah 30/09/2016
37,10
0,30
4,25
1,00
97,60
1,00
BCA Syariah 31/12/2016
36,78
0,21
4,74
1,15
90,12
1,00
BCA Syariah 31/03/2017
35,26
0,17
4,23
1,03
83,44
0,99
BCA Syariah 30/06/2017
30,99
0,18
4,40
1,09
91,51
1,05
Bukopin Syariah 30/06/2015
14,10
2,47
4,62
0,61
93,82
0,49
Bukopin Syariah 30/09/2015
16,26
2,45
5,99
0,81
91,82
0,66
Bukopin Syariah 31/12/2015
16,31
2,74
4,98
0,27
90,56
0,79
Bukopin Syariah 31/03/2016
15,62
2,34
10,63
1,28
92,14
1,13
Bukopin Syariah 30/06/2016
14,82
2,37
8,12
0,65
92,25
1,00
Bukopin Syariah 30/09/2016
15,06
2,05
8,13
0,79
87,95
0,99
Bukopin Syariah 31/12/2016
17,00
2,72
4,87
0,40
88,18
0,76
Bukopin Syariah 31/03/2017
16,71
1,69
5,27
0,19
91,58
0,53
Bukopin Syariah 30/06/2017
16,41
2,25
2,33
(0,08)
89,42
0,39
Panin Dubai
Syariah 30/06/2015
21,88
0,56
8,33
0,81
96,43
1,22
Panin Dubai
Syariah 30/09/2015
21,37
1,24
6,57
0,78
96,10
1,13
Panin Dubai
Syariah 31/12/2015
20,30
1,94
7,30
0,86
96,43
1,12

81
Company Quarter
CAR
(%)
NPF
(%)
NPM
(%)
NOM
(%)
FDR
(%)
ROA
(%)
Panin Dubai
Syariah
31/03/2016
19,80
1,69
1,44
0,02
94,03
0,37
Panin Dubai
Syariah 30/06/2016
19,51
1,96
2,72
0,15
89,60
0,33
Panin Dubai
Syariah 30/09/2016
19,86
1,84
3,22
0,14
89,14
0,42
Panin Dubai
Syariah 31/12/2016
18,17
1,86
2,72
0,05
91,99
0,37
Panin Dubai
Syariah 31/03/2017
18,04
2,01
6,42
0,50
90,34
0,80
Panin Dubai
Syariah 30/06/2017
16,41
0,30
3,62
0,60
92,00
0,45
BNI Syariah 30/06/2015
15,11
1,38
7,98
0,61
96,65
1,30
BNI Syariah 30/09/2015
15,38
1,33
8,21
0,43
89,65
1,32
BNI Syariah 31/12/2015
15,48
1,46
5,66
0,67
91,94
1,43
BNI Syariah 31/03/2016
15,85
1,59
10,78
1,30
86,26
1,65
BNI Syariah 30/06/2016
15,56
1,50
10,24
1,18
86,92
1,59
BNI Syariah 30/09/2016
15,82
1,41
9,91
1,03
85,79
1,53
BNI Syariah 31/12/2016
14,92
1,64
5,38
0,90
84,57
1,44
BNI Syariah 31/03/2017
14,44
1,63
9,36
0,73
82,32
1,40
BNI Syariah 30/06/2017
14,33
1,76
9,82
0,77
84,40
1,48
Bri Syariah 30/06/2015
11,03
4,38
4,74
1,67
92,05
0,78
Bri Syariah 30/09/2015
13,82
3,86
4,90
0,08
86,61
0,08
Bri Syariah 31/12/2015
13,94
3,89
4,78
0,07
84,16
0,77
Bri Syariah 31/03/2016
14,66
3,90
6,32
0,44
82,73
0,99
Bri Syariah 30/06/2016
14,06
3,83
6,60
0,51
87,92
1,03
Bri Syariah 30/09/2016
14,30
3,89
6,60
0,45
83,98
0,98
Bri Syariah 31/12/2016
20,63
3,19
6,12
0,39
81,42
0,95

82
Company Quarter
CAR
(%)
NPF
(%)
NPM
(%)
NOM
(%)
FDR
(%)
ROA
(%)
Bri Syariah 31/03/2017
21,14
3,33
4,68
0,20
77,56
0,65
Bri Syariah 30/06/2017
20,38
3,50
4,91
0,25
76,79
0,71
Muamalat 30/06/2015
14,91
3,18
3,84
0,54
99,05
0,51
Muamalat 30/09/2015
13,71
3,49
2,99
0,42
96,09
0,36
Muamalat 31/12/2015
12,36
4,20
1,41
0,27
90,30
0,20
Muamalat 31/03/2016
12,10
4,33
2,36
0,30
97,30
0,25
Muamalat 30/06/2016
12,78
4,61
1,29
0,01
99,11
0,15
Muamalat 30/09/2016
12,75
1,92
1,30
0,10
96,47
0,13
Muamalat 31/12/2016
12,74
1,40
1,94
0,20
95,13
0,13
Muamalat 31/03/2017
12,83
2,92
1,38
0,16
90,93
0,12
Muamalat 30/06/2017
12,74
3,74
1,46
0,23
89,00
0,15
Mandiri Syariah 30/06/2015
11,97
4,70
3,89
0,59
85,01
0,55
Mandiri Syariah 30/09/2015
11,84
4,34
2,92
0,45
84,49
0,60
Mandiri Syariah 31/12/2015
12,85
4,05
(0,69)
0,58
81,99
0,56
Mandiri Syariah 31/03/2016
13,39
4,32
0,09
0,60
80,16
0,56
Mandiri Syariah 30/06/2016
13,69
3,74
4,76
0,67
82,31
0,62
Mandiri Syariah 30/09/2016
13,50
3,63
4,62
0,65
80,40
0,56
Mandiri Syariah 31/12/2016
14,01
3,13
4,20
6,16
79,19
0,59
Mandiri Syariah 31/03/2017
14,40
3,16
0,02
0,68
77,75
0,60
Mandiri Syariah 30/06/2017
14,37
3,23
4,53
0,67
80,03
0,59

83