impact assesment of agricultural exports from south asia
TRANSCRIPT

Asia‐Pacific Research and Training Network on Trade
www.artnetontrade.org
Trade‐led Growth in Times of CrisisAsia‐Pacific Trade Economists’ Conference
2‐3 November 2009, Bangkok
Session 11
Impacts of Non Tariff Measures on Agricultural Trade: A Gravity Modeling Approach
Aloka Bellanawithana Bimali WijeratneJeevika Weerahewa

Impacts of Non Tariff Measures on Agricultural Trade: A Gravity Modeling Approach
Aloka Bellanawithana Bimali Wijeratne Jeevika WeerahewaDepartment of Agricultural Economics and Business Management
Faculty of Agriculture University of Peradeniya
Sri Lanka
Barriers to Trade
Any restriction imposed on the free flow of trade
Types of BarriersGeographical barriers – distance, Cultural barriers - different customs, traditions, laws, languages 2 main categories
Tariff measuresNon Tariff measures

Non Tariff Measures (NTMs)
Any restriction other than traditional custom duties that distort trade
NTMs include:Measures to control the volumes of importsMeasures to control the price of imported goodsMonitoring measuresProduction and export measuresTechnical barriers
NTMs cont…..
Primary intention of imposing NTMs
To protect health, safety, or sanitation among humans, plants and animalsTo protect the environmentTo improve national welfare by correcting market failures
Over bearing use of NTMs Barrier

Effects of NTMs on Agricultural Trade;Findings of Previous StudiesOtsuki et al. (2001):10% tighter EU aflatoxin contamination levels reduces African exports by 4.3% (cereals) and 11% (nuts and dried fruits)
Herath (2001):Loss of foreign exchange earning due to non-compliance in Sri Lankan beverage and spice sector is US$2.9 million in 99/2000

Findings of previous studies cont…
Calvin, L. & Krissof, B. (1998):Removal of Japanese TBs on apples would increase Fuji apple imports by 88,200 mt in 1996/97
Moenius (1999):Found that shared standard has large trade promoting effect between the nations

Agricultural Trade in South Asia
World Trade in agricultural products, 2005 – US$ 852 billionsShare of South Asia – 1.75%Major exporting commoditiesTea, Paddy, Animal products (meat, milk), Spices, Fruits and Vegetables Major exporting marketsUnited States, European Union, Japan

Overall Objective
To compare the impacts of NTMs with other sources of barriers on agricultural exports of South Asian countries and their major trading partners
Specific ObjectivesTo estimate the impacts of NTMs for the trade patterns of South countriesTo estimate the impacts of NTMs for the trade patterns of North countries

Data cont….
4 different trade patterns were obtained to do the estimations
South-South tradeSouth-North tradeNorth-South tradeNorth-North trade
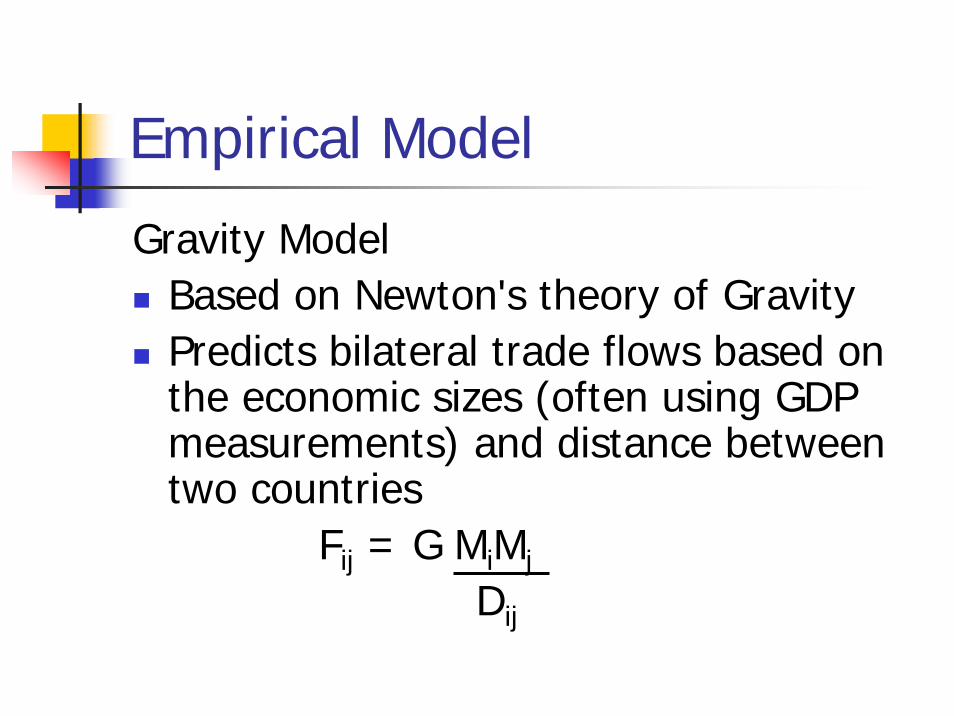
Empirical Model
Gravity ModelBased on Newton's theory of GravityPredicts bilateral trade flows based on the economic sizes (often using GDP measurements) and distance between two countries
Fij = G MiMj
Dij
Conventional Variables
Dependant variable –Value of bilateral exports of agricultural products
Independent variables –Agricultural GDP of the two countries, distance between two countries

Other Variables
Official common language, colonial ties, common border, landlocked countriesRegion dummy variablesTrade restrictiveness measures
Overall trade restrictiveness index (OTRI)Tariff trade restrictiveness index (TTRI)
Trade Restrictiveness Measures
OTRI (Agricultural)OTRI is based on importsCaptures the impact of each country’s trade policies in its aggregate agricultural importsCaptures the effects of both tariffs and non tariff measures

Trade Restrictiveness Measures cont…
TTRI (Agricultural)Captures the impact of each country’s tariff trade policies in its aggregate agricultural imports
OTRI – TTRI = Measures the impact of NTM

Data Sources
Variables (2005) Source
Bilateral trade values (HS code 1- 24)
Trade Map – International Trade centre
GDP & Agricultural GDP World Economic outlook -IMF
Distance CEPII
Trade restrictiveness indices
World Trade Indicators –World Bank

Data Sources cont…..
Common border
Colony Ties
Official Language
Landlocked countries
CEPII

Data cont….
40 Countries8 South Asian countriesTop 10 export destinations of SAARC
membersFunctional Form – log-logOrdinary Least Squares and Robust Estimations

ResultsTrade of Developing Countries
South-South South-North
Variables Coefficient Std. Errors Coefficient Std. Errors
Constant 2.003 8.770 11.730*** 4.179GDP exp (log) 1.054*** 0.283 1.356*** 0.171GDP imp (log) 1.789*** 0.387 0.422*** 0.159Distance (log) -2.927*** 0.968 -2.783*** 0.442NTM -0.111* 0.064 -0.009 0.026TTRI -0.065** 0.028 -0.027 0.040Dntm*SA 0.004 0.086 0.029 0.040
*** Significant at 1%, **Significant at 5%, * Significant at 10%
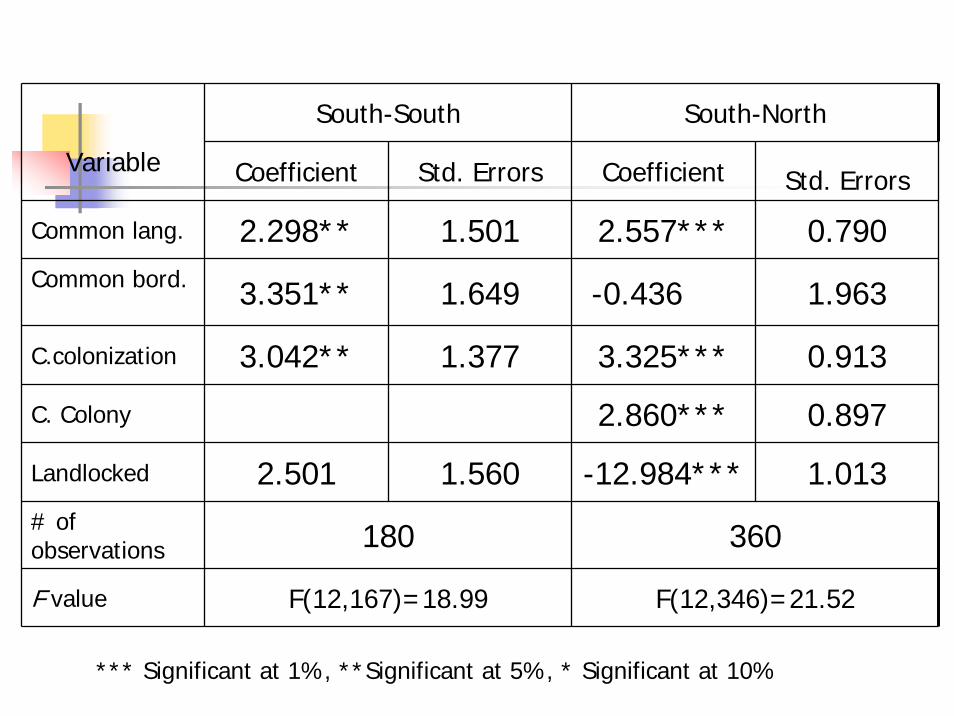
South-South South-North
Variable Coefficient Std. Errors Coefficient Std. Errors
Common lang. 2.298** 1.501 2.557*** 0.790Common bord. 3.351** 1.649 -0.436 1.963
C.colonization 3.042** 1.377 3.325*** 0.913
C. Colony 2.860*** 0.897
Landlocked 2.501 1.560 -12.984*** 1.013# of observations 180 360
F value F(12,167)=18.99 F(12,346)=21.52
*** Significant at 1%, **Significant at 5%, * Significant at 10%

Trade of Developed Countries
North-South North-NorthVariables
Coefficient Std. Errors Coefficient Std. Errors
Constant 9.825*** 5.122 14.063* 1.280
GDP exp (log) 0.376** 0.176 0.195*** 0.050
GDP imp (log) 2.612*** 0.303 0.140*** 0.052
Distance (log) -2.997*** 0.511 -1.360*** 0.114
NTM -0.085*** 0.029 -0.012 0.009
TTRI -0.118*** 0.020 -0.009 0.018
*** Significant at 1%, **Significant at 5%, * Significant at 10%
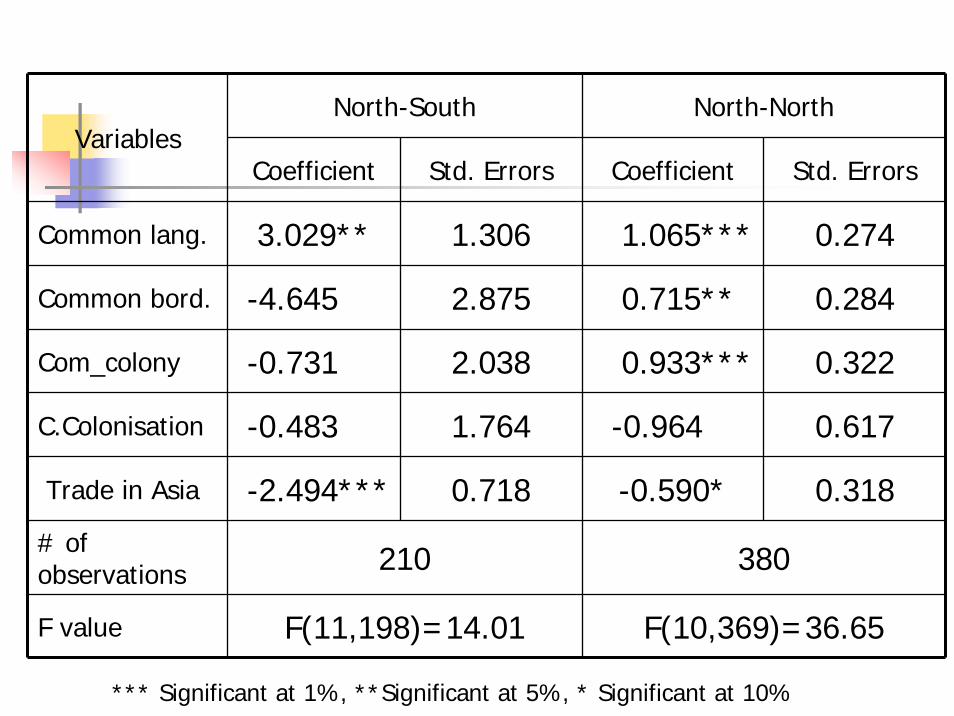
North-South North-NorthVariables
Coefficient Std. Errors Coefficient Std. Errors
Common lang. 3.029** 1.306 1.065*** 0.274
Common bord. -4.645 2.875 0.715** 0.284
Com_colony -0.731 2.038 0.933*** 0.322
C.Colonisation -0.483 1.764 -0.964 0.617
Trade in Asia -2.494*** 0.718 -0.590* 0.318
# of observations 210 380
F value F(11,198)=14.01 F(10,369)=36.65
*** Significant at 1%, **Significant at 5%, * Significant at 10%
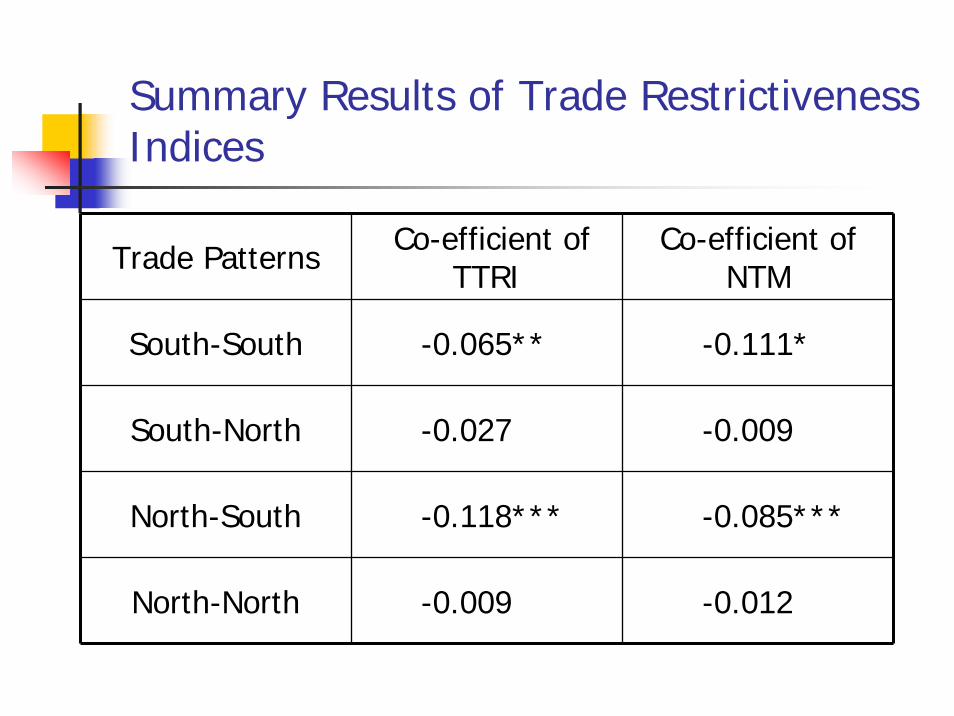
Summary Results of Trade Restrictiveness Indices
Trade Patterns Co-efficient of TTRI
Co-efficient of NTM
South-South -0.065** -0.111*
South-North -0.027 -0.009
North-South -0.118*** -0.085***
North-North -0.009 -0.012
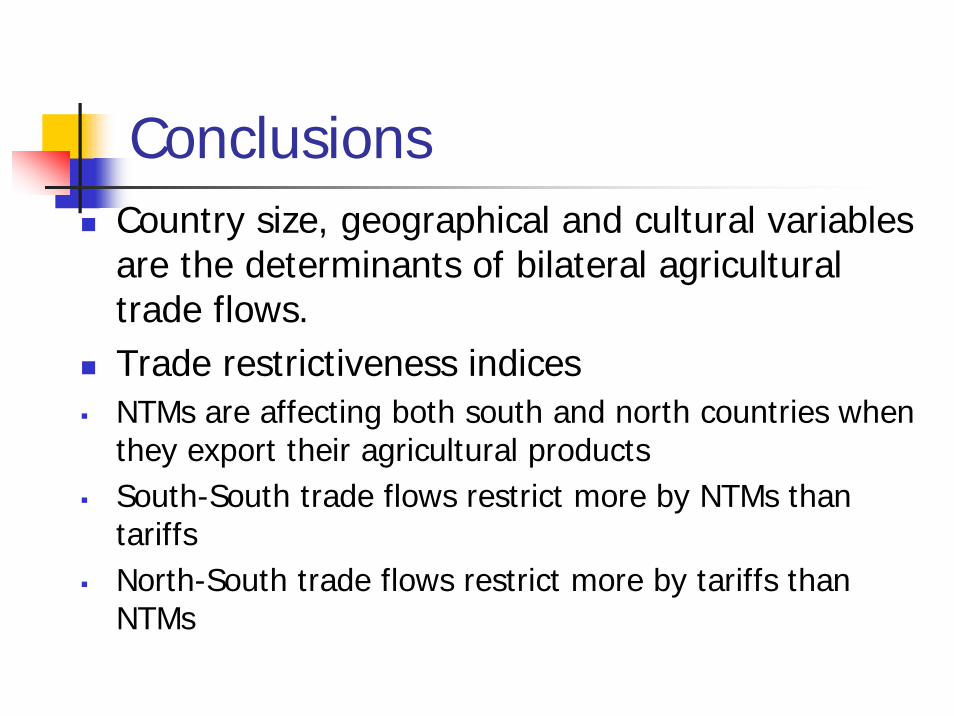
ConclusionsCountry size, geographical and cultural variables are the determinants of bilateral agricultural trade flows.Trade restrictiveness indicesNTMs are affecting both south and north countries when they export their agricultural products South-South trade flows restrict more by NTMs than tariffsNorth-South trade flows restrict more by tariffs than NTMs
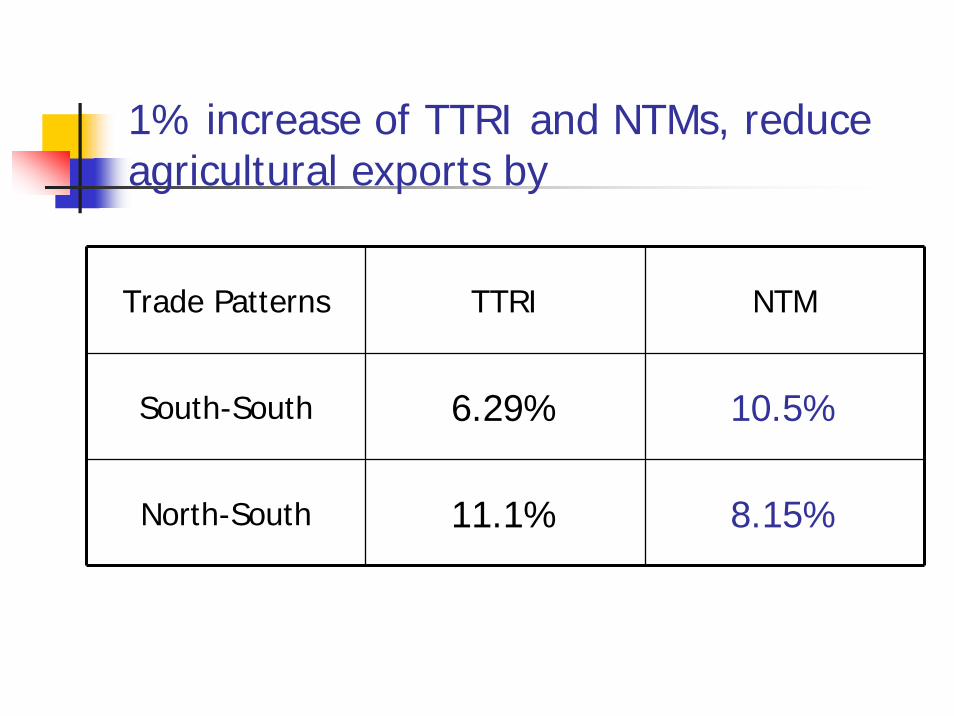
1% increase of TTRI and NTMs, reduce agricultural exports by
Trade Patterns TTRI NTM
South-South 6.29% 10.5%
North-South 11.1% 8.15%

Thank You