image courtesy of nasa/gsfc - kansas state university · pdf file ·...
TRANSCRIPT

Image courtesy of NASA/GSFC
Current Efforts in Climate Current Efforts in Climate Forecasting and ModelingForecasting and Modeling
Eugene S. TakleDirector, Climate Science InitiativeProfessor of Atmospheric Science
Eugene S. TakleDirector, Climate Science InitiativeProfessor of Atmospheric ScienceProfessor of Atmospheric Science
Department of Geological and Atmospheric SciencesProfessor of Agricultural Meteorology
Department of Agronomy
Professor of Atmospheric ScienceDepartment of Geological and Atmospheric Sciences
Professor of Agricultural MeteorologyDepartment of Agronomyp g y
Iowa State UniversityAmes, Iowa 50011
p g yIowa State University
Ames, Iowa [email protected]
Greenhouse Gases, Carbon Taxes and Trading, and Carbon SequestrationCHE 670 Sustainability SeminarCHE 670 – Sustainability Seminar
Kansas State UniversityManhattan, KS
6-8 Jan 2010

OutlineOutline
Changes in atmospheric carbon dioxideChanges in atmospheric carbon dioxideCauses of climate changeChanges in future climate aroundCauses of climate changeChanges in future climate aroundChanges in future climate around the globeEmission reductions to reach
Changes in future climate around the globeEmission reductions to reachEmission reductions to reach stabilizationClimate change for the US
Emission reductions to reach stabilizationClimate change for the USClimate change for the US MidwestClimate change for the US Midwest

MTons CarbonMTons Carbon
IPCC Third Assessment Report


Global Carbon Emissions (Gt)
Actual emissions are exceeding worst i j t d i 1990case scenarios projected in 1990
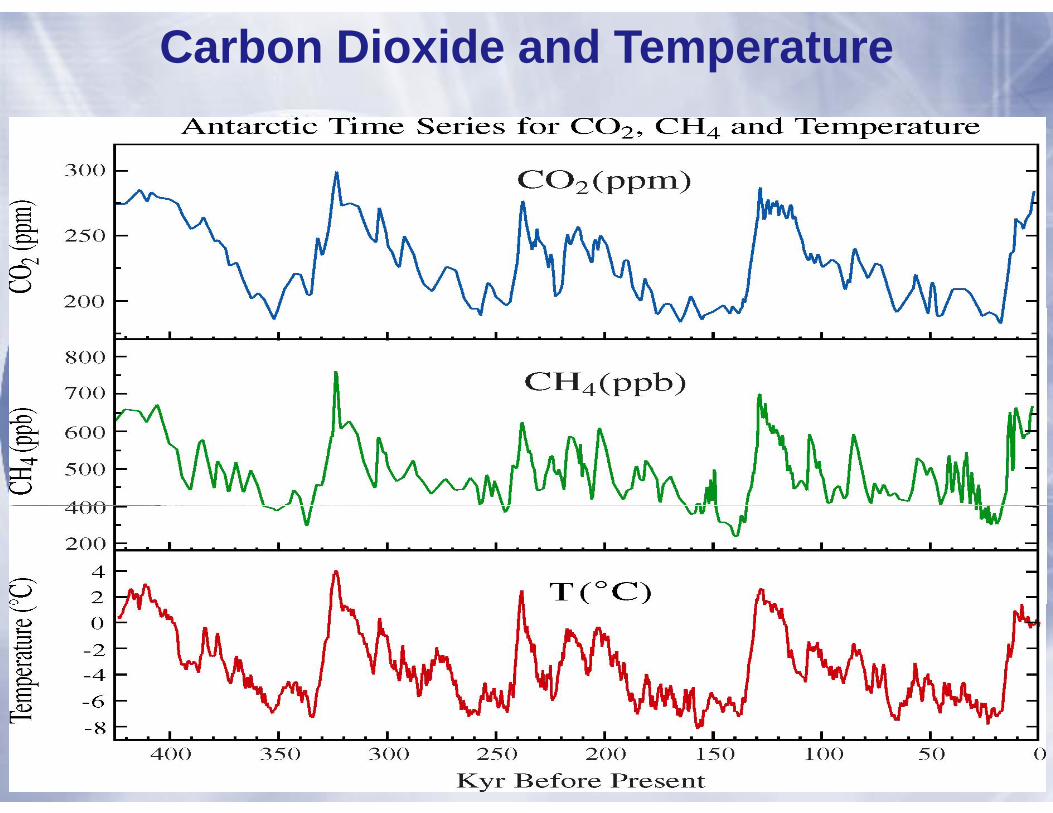
Carbon Dioxide and Temperature

Carbon Dioxide and Temperature
20102010384 ppm
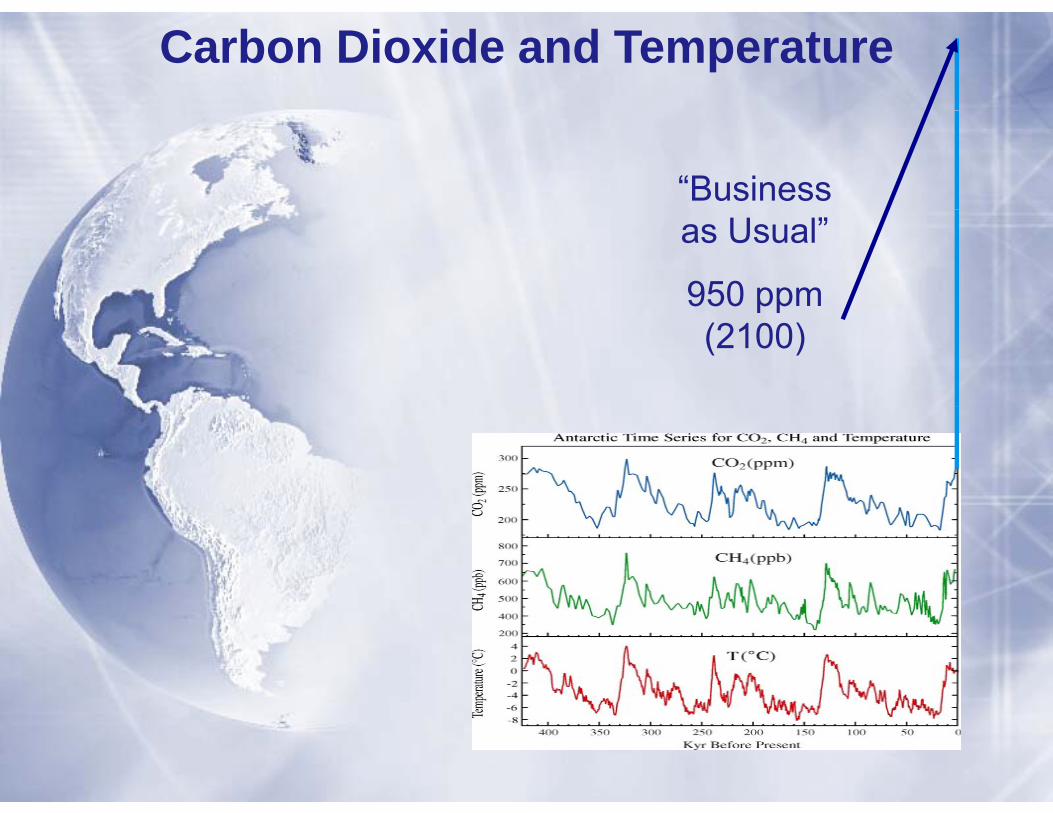
Carbon Dioxide and Temperature
“Business as Usual”
950 ppm pp(2100)
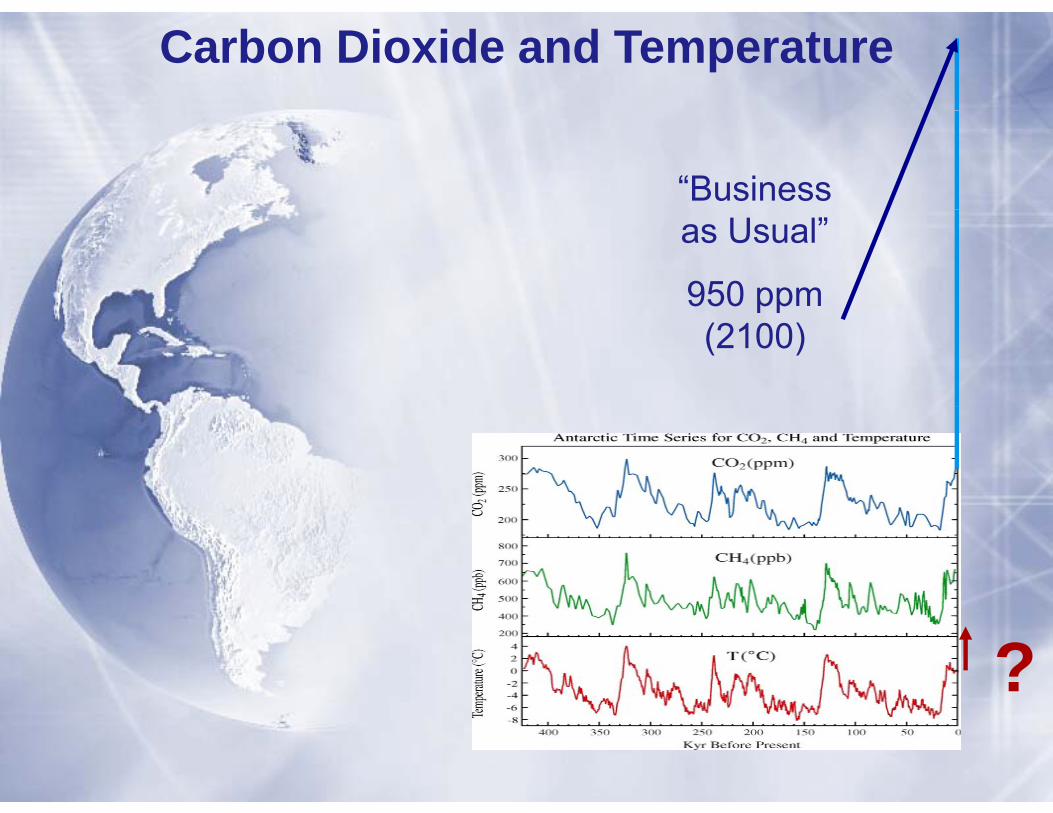
Carbon Dioxide and Temperature
“Business as Usual”
950 ppm pp(2100)
?

Increasing Increasing Increasing Increasing greenhouse greenhouse gases increases gases increases gases increases gases increases heating of the heating of the EarthEarth
Increased Greenhouse Gases Increased Greenhouse Gases Increased Greenhouse Gases Increased Greenhouse Gases EarthEarth
=> Global Heating=> Global Heating=> Global Heating=> Global Heating
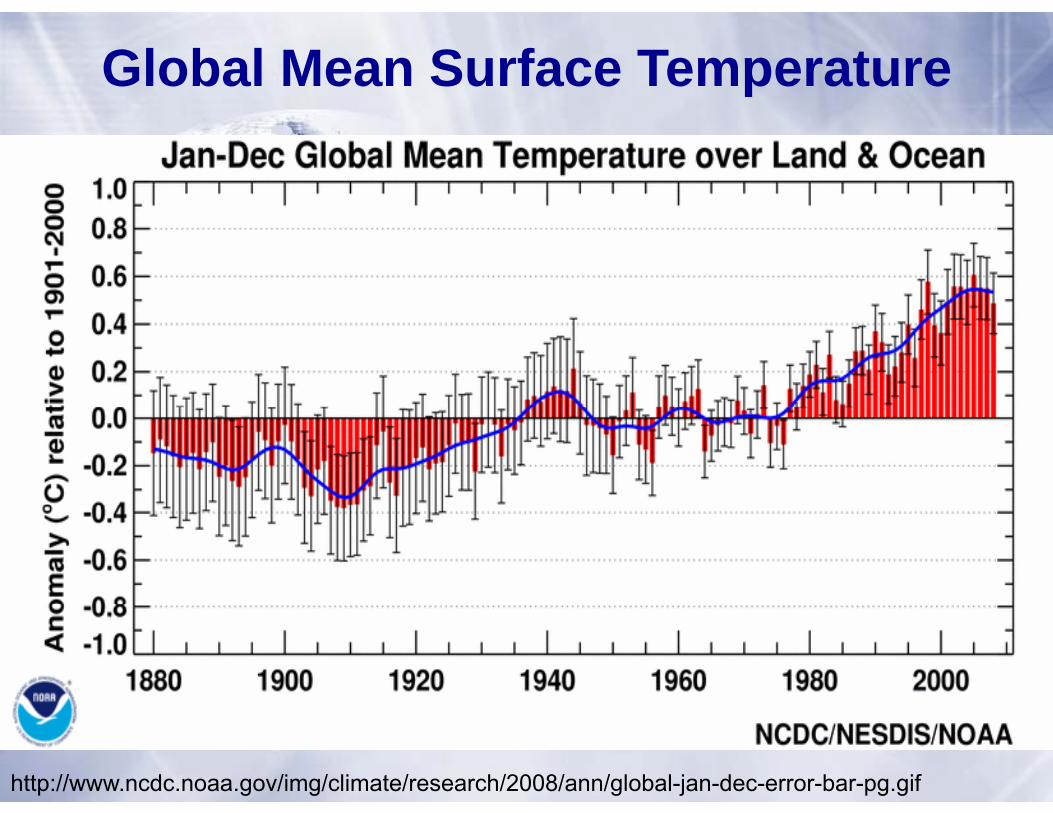
Global Mean Surface Temperature
http://www.ncdc.noaa.gov/img/climate/research/2008/ann/global-jan-dec-error-bar-pg.gif

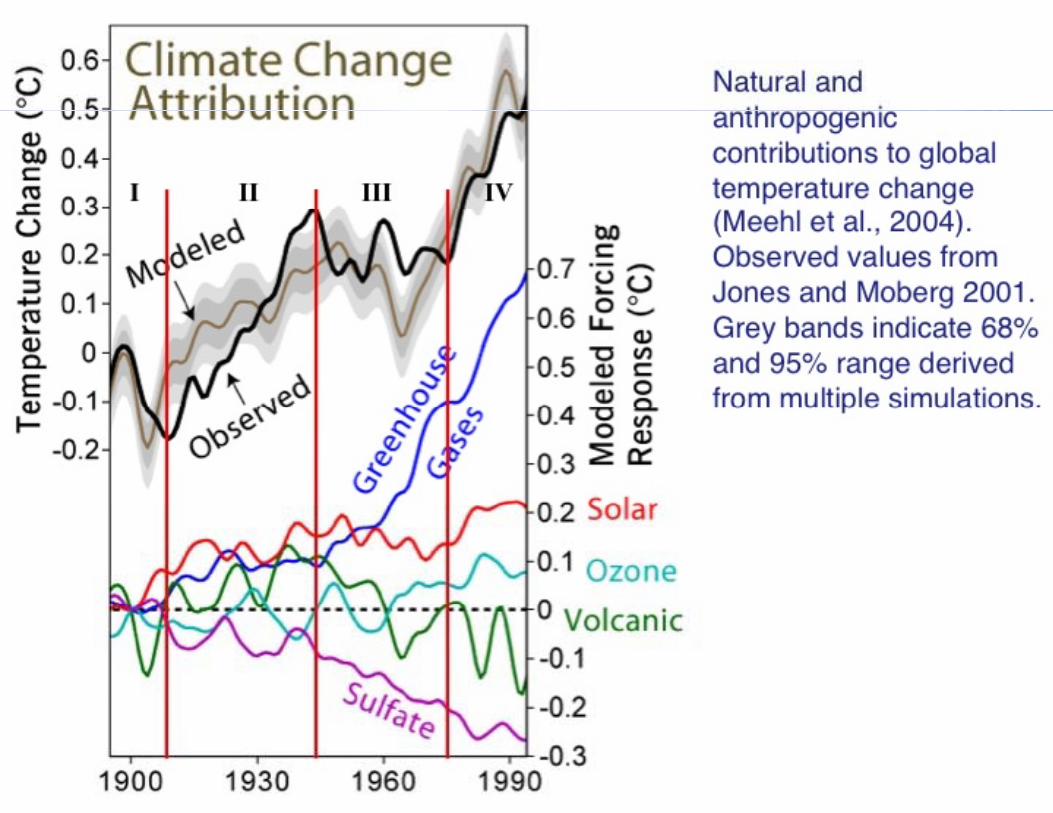
Global Mean Surface Temperature
I II III IV
http://www.ncdc.noaa.gov/img/climate/research/2008/ann/global-jan-dec-error-bar-pg.gif

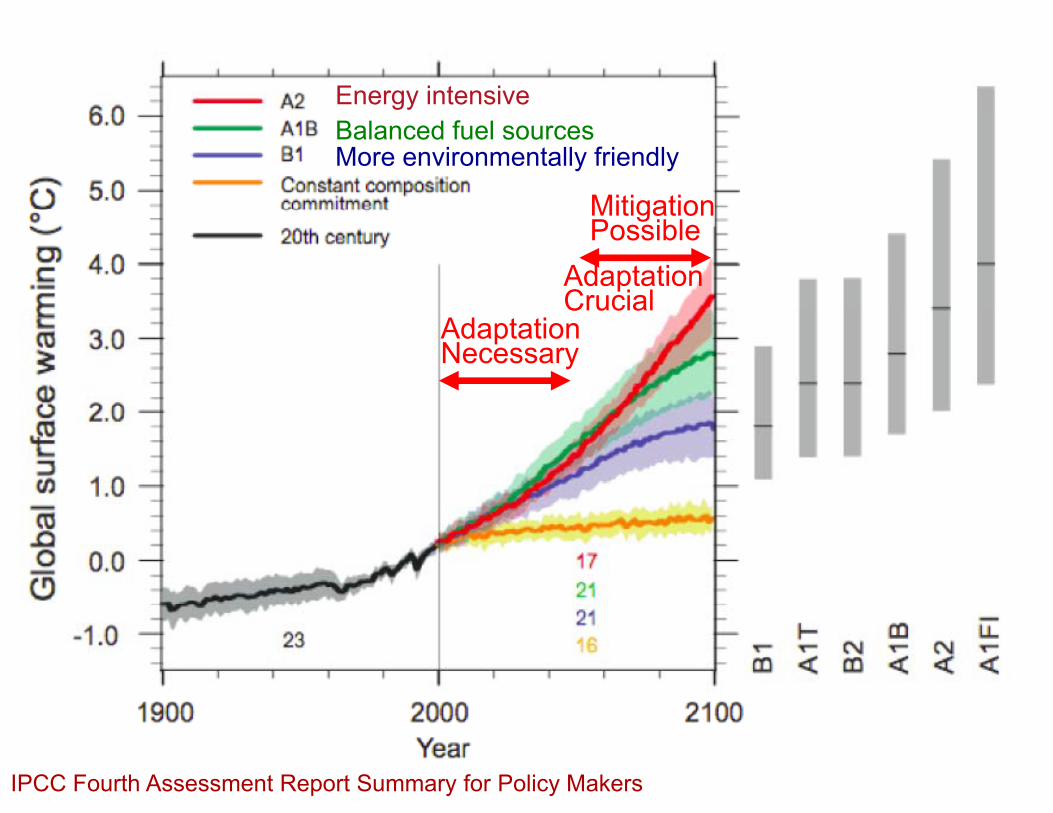
Energy intensiveBalanced fuel sourcesMore environmentally friendly
If current emission trends continue global temperature risecontinue, global temperature rise will exceed worst case scenarios projected in 2007
IPCC Fourth Assessment Report Summary for Policy Makers
FI =fossil intensive

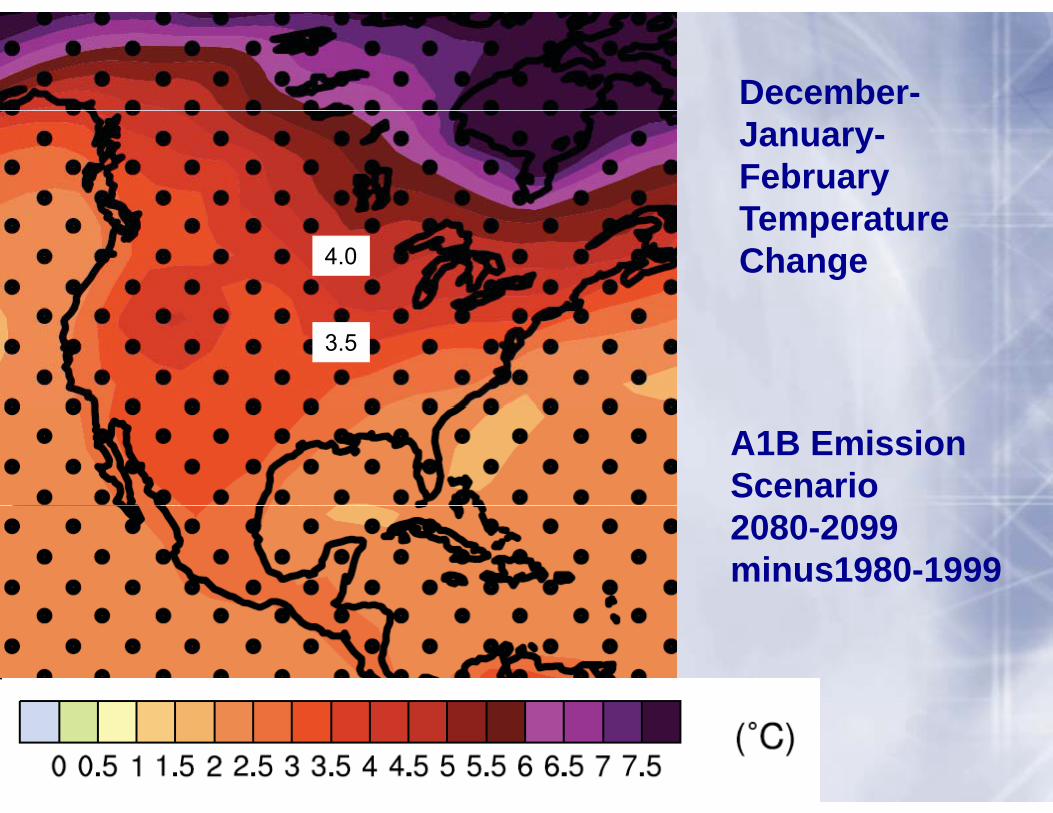
December-January-February T tTemperature Change4.0
3.5
A1B Emission Scenario2080-2099 minus1980-1999

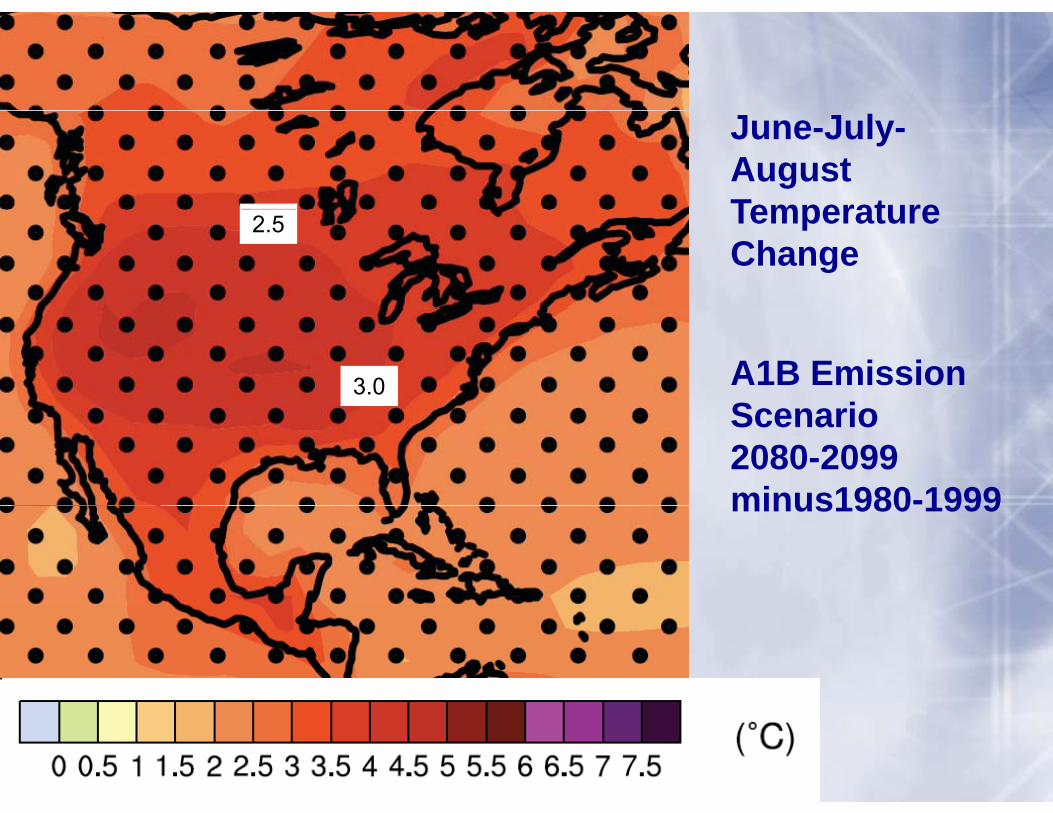
June-July-August TemperatureTemperature Change
2.5
A1B Emission S i
3.0Scenario2080-2099 minus1980-1999minus1980 1999
Source: IPCC 4th Assessment Report, 2007
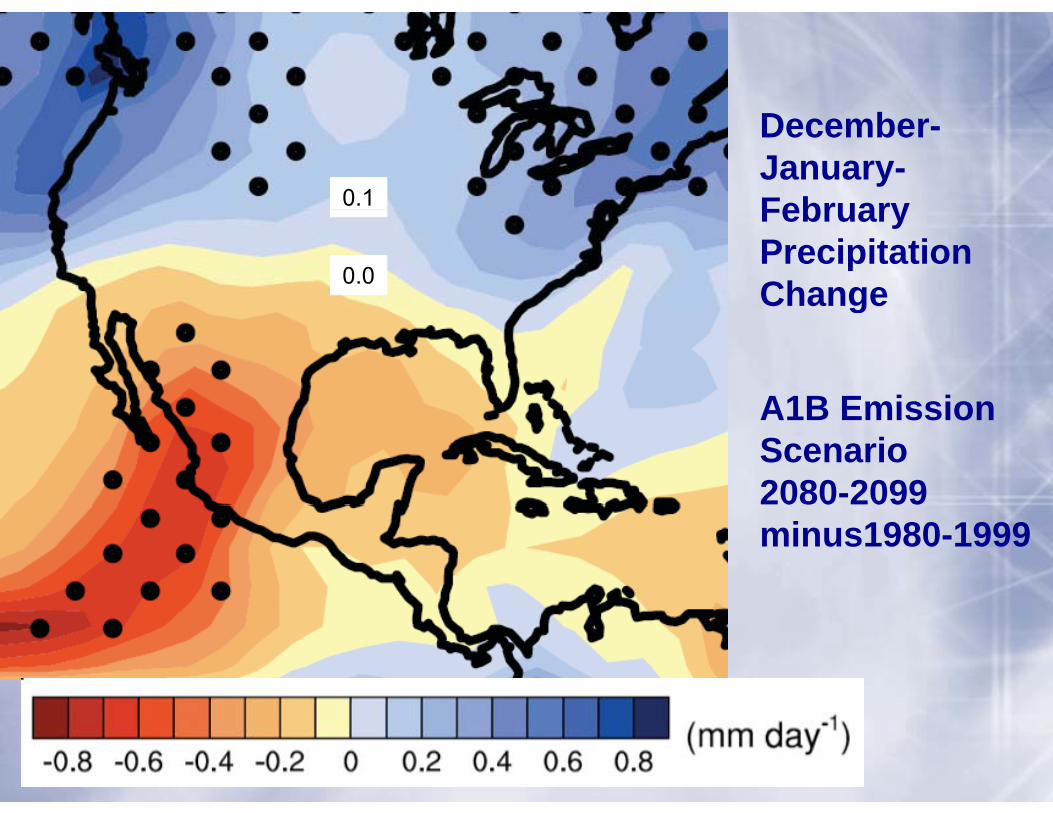
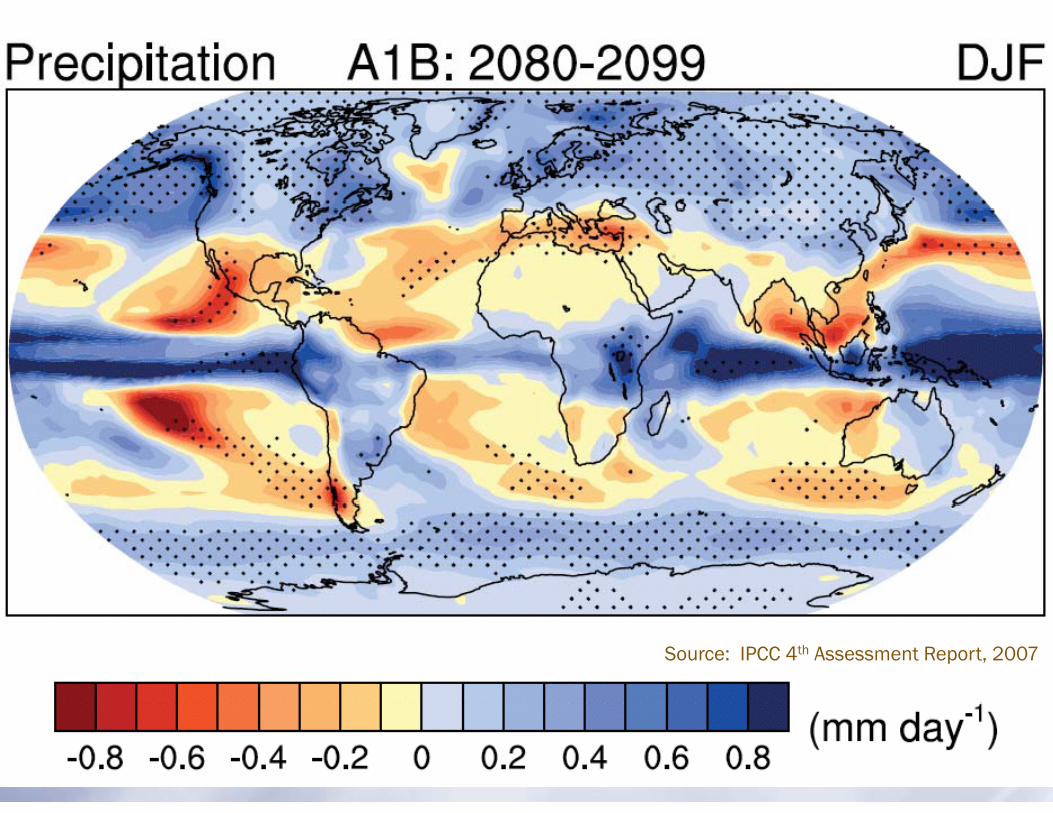
December-January-February0.1 February Precipitation Change0.0 g
A1B EmissionA1B Emission Scenario2080-2099 minus1980-1999

Source: IPCC 4th Assessment Report, 2007

June-July-August Precipitation
0.0Precipitation Change
-0.1
A1B Emission S iScenario2080-2099 minus1980-1999minus1980 1999

Change in Annual Cloud Cover

Change in Annual Cloud Cover
A1B Emission Scenario2080-2099 minus1980-1999
-1 01.0
-1.5

Annual Change in Soil Moisture
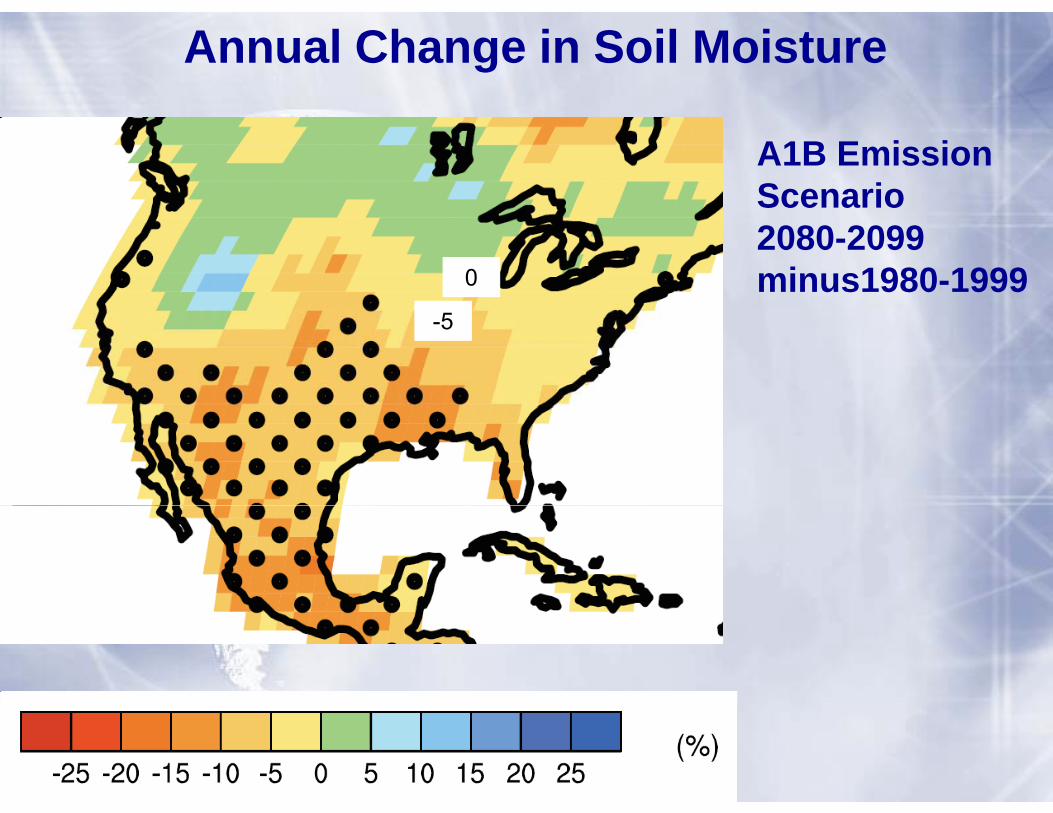
Annual Change in Soil Moisture
A1B Emission Scenario2080-2099 minus1980-19990
-5
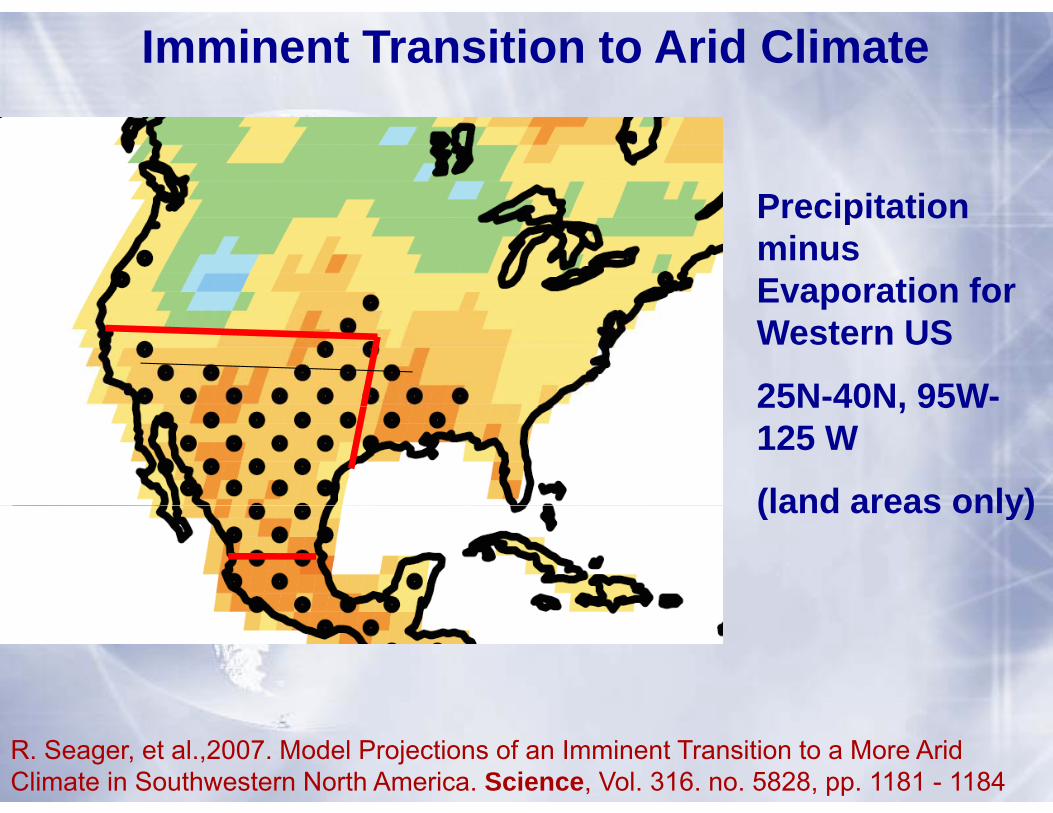
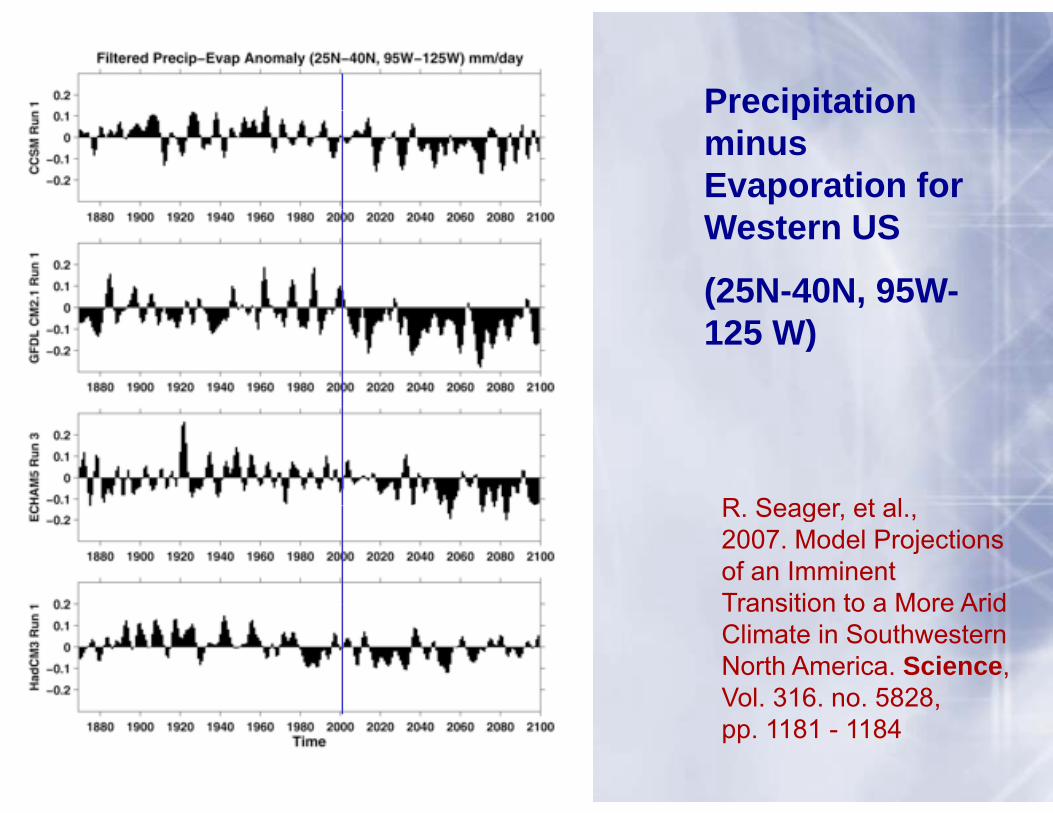
Imminent Transition to Arid Climate
PrecipitationPrecipitation minus Evaporation for pWestern US
25N-40N, 95W-25N 40N, 95W125 W
(land areas only)(land areas only)
R. Seager, et al.,2007. Model Projections of an Imminent Transition to a More Arid Climate in Southwestern North America. Science, Vol. 316. no. 5828, pp. 1181 - 1184
PrecipitationPrecipitation minus Evaporation for Western US
(25N-40N, 95W-(125 W)
R Seager et alR. Seager, et al.,2007. Model Projections of an Imminent Transition to a More AridTransition to a More Arid Climate in Southwestern North America. Science, Vol 316 no 5828Vol. 316. no. 5828, pp. 1181 - 1184

Precipitation minus Evaporation for Western US
(25N-40N, 95W-125 W)
R. Seager, et al.,2007. Model Projections of an Imminent Transition to a More Arid Climate in Southwestern North America. Science, Vol. 316. no. 5828, pp. 1181 - 1184

Precipitation minus Evaporation for Western US
(25N-40N, 95W-125 W)(25N 40N, 95W 125 W)
Colorado River Compact established, 1922
R. Seager, et al.,2007. Model Projections of an Imminent Transition to a More Arid Climate in Southwestern North America. Science, Vol. 316. no. 5828, pp. 1181 - 1184
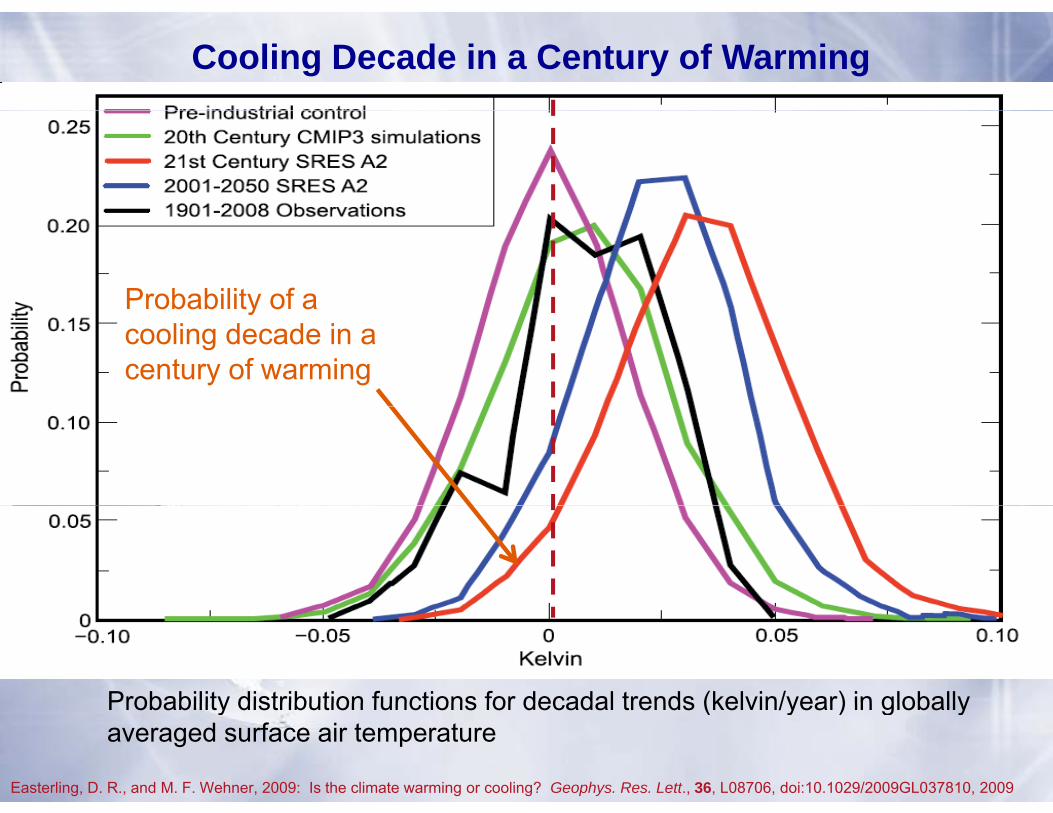
Cooling Decade in a Century of Warming
Probability of aProbability of a cooling decade in a century of warming
Probability distribution functions for decadal trends (kelvin/year) in globally
Easterling, D. R., and M. F. Wehner, 2009: Is the climate warming or cooling? Geophys. Res. Lett., 36, L08706, doi:10.1029/2009GL037810, 2009
Probability distribution functions for decadal trends (kelvin/year) in globally averaged surface air temperature
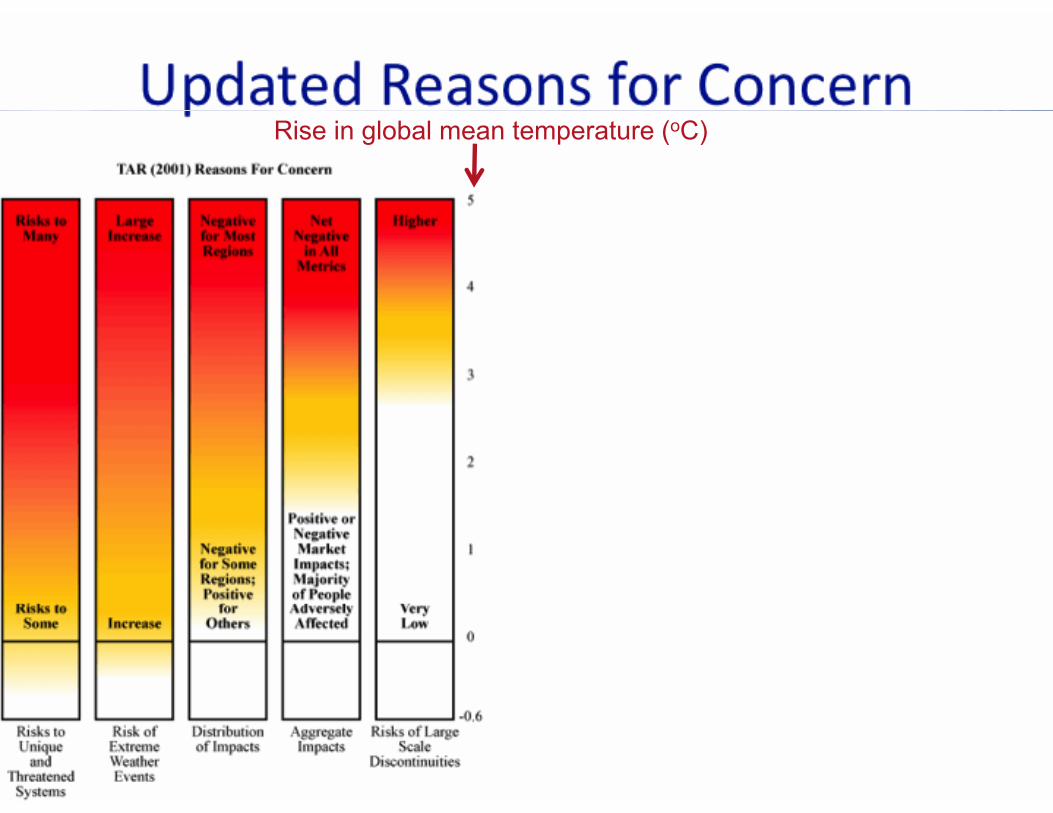
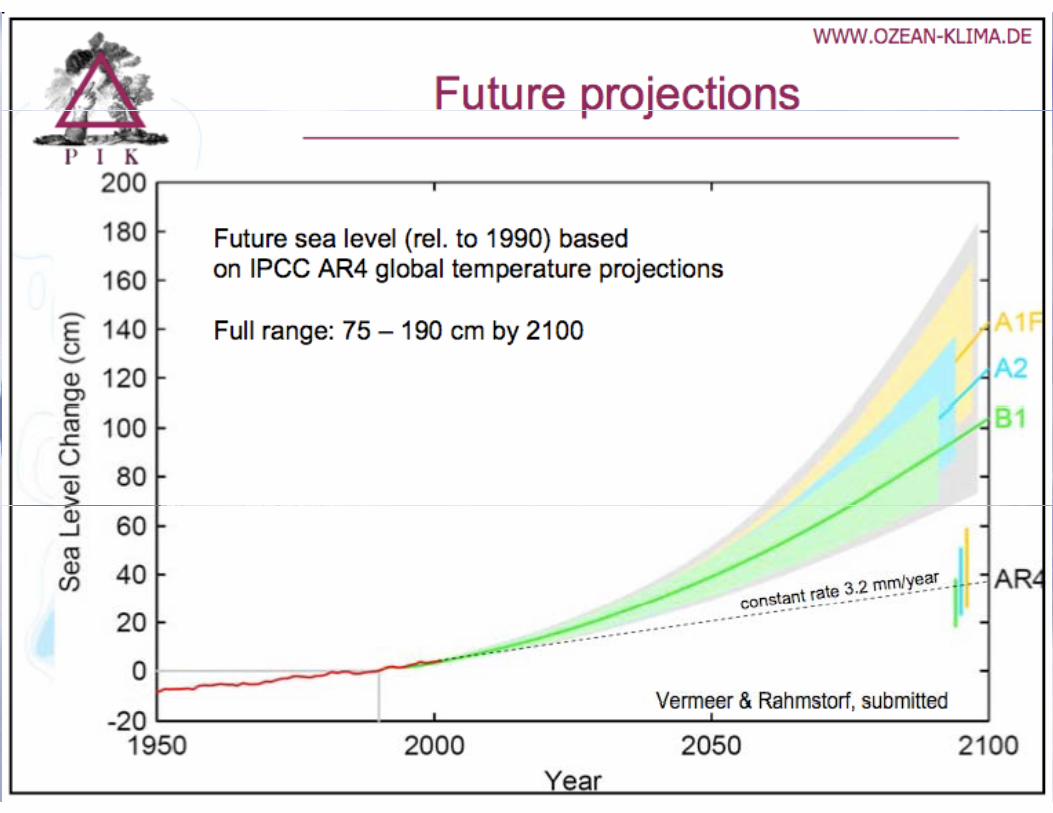
Rise in global mean temperature (oC)

Rise in global mean temperature (oC)
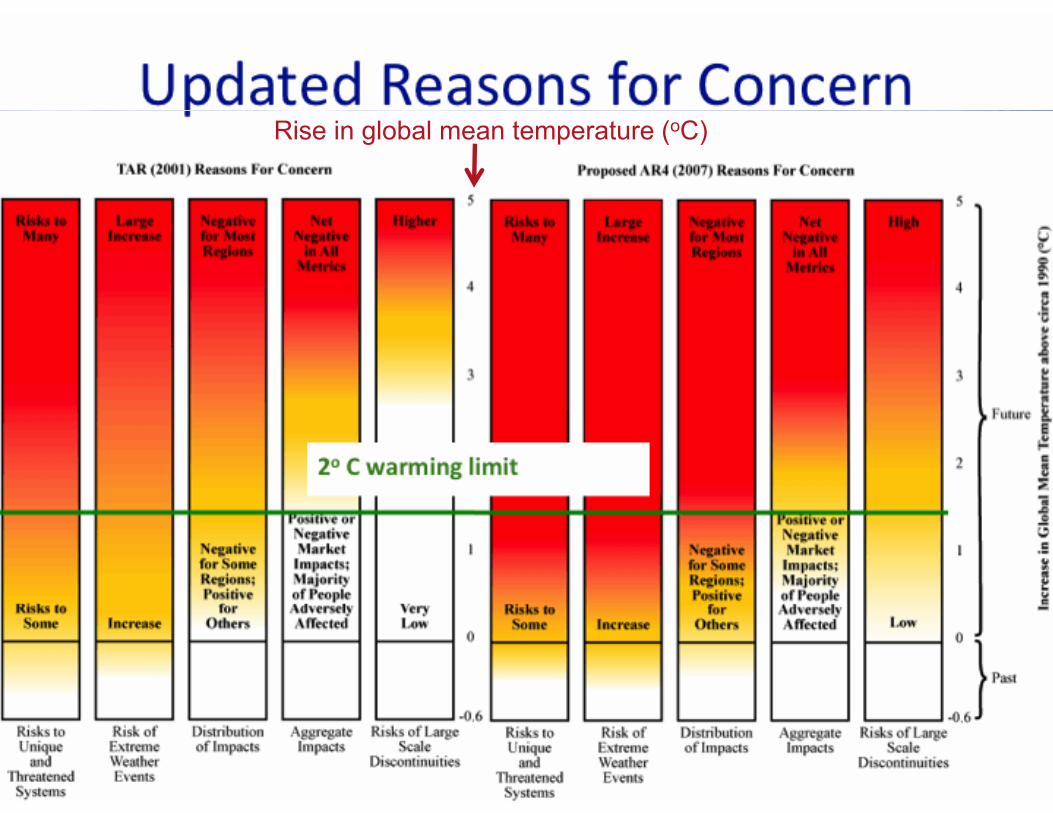
Rise in global mean temperature (oC)
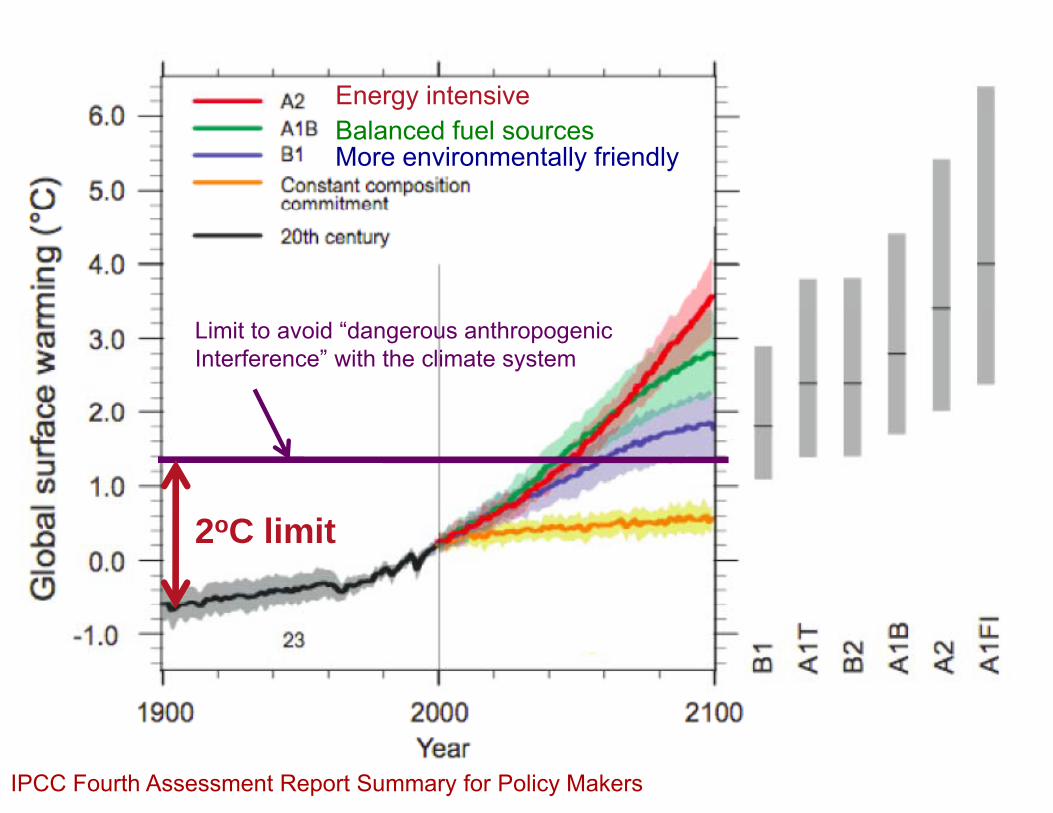
Energy intensiveBalanced fuel sourcesMore environmentally friendly
Limit to avoid “dangerous anthropogenic Interference” with the climate system
2oC limit
IPCC Fourth Assessment Report Summary for Policy Makers

Energy intensiveBalanced fuel sourcesMore environmentally friendly
If current emission trends continue global temperature risecontinue, global temperature rise likely will exceed worst case scenarios projected in 2007
2oC “Guardrail”
2oC limit to avoid “dangerous anthropogenic interference” with the climate system
IPCC Fourth Assessment Report Summary for Policy Makers
FI =fossil intensive
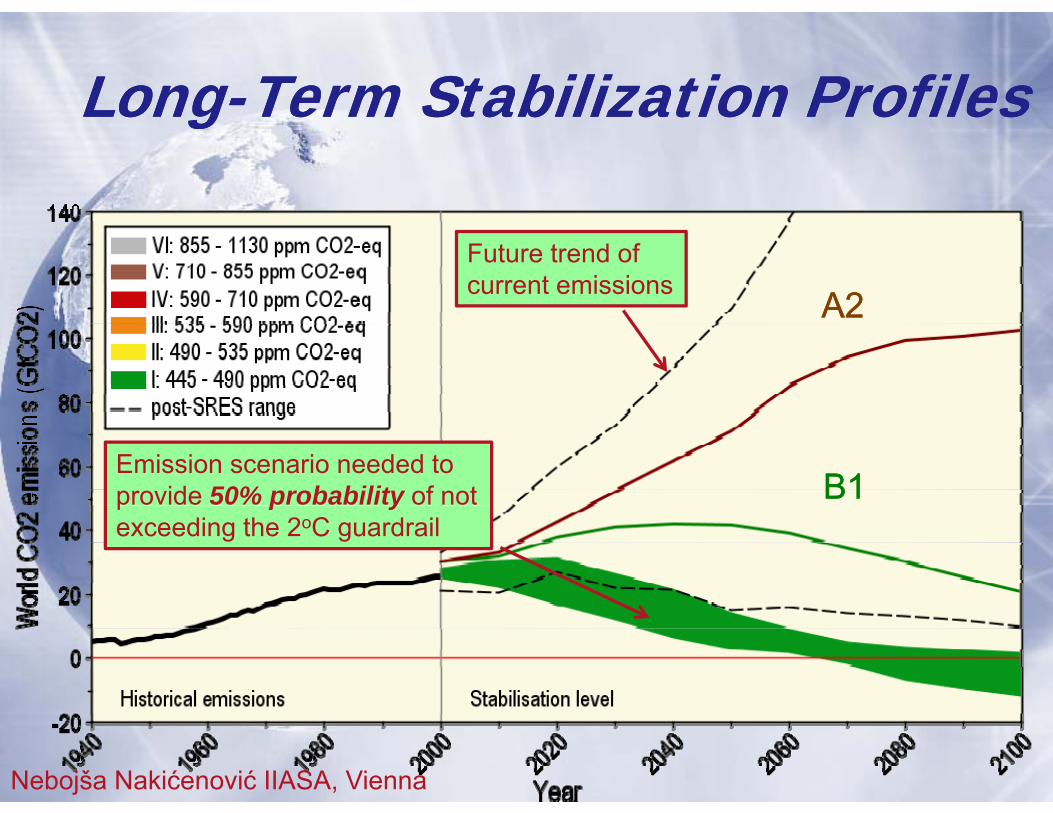
Long-Term Stabilization ProfilesLong-Term Stabilization ProfilesLong Term Stabilization ProfilesLong Term Stabilization Profiles
A2A2Future trend of current emissions
A2A2
B1B1Emission scenario needed to provide 50% probability of not p p yexceeding the 2oC guardrail
Nebojša Nakićenović IIASA, Vienna

Options for Climate Stabilization

Options for Climate Stabilization

Source: IPCC, 2001: Climate Change 2001: The Scientific Basis
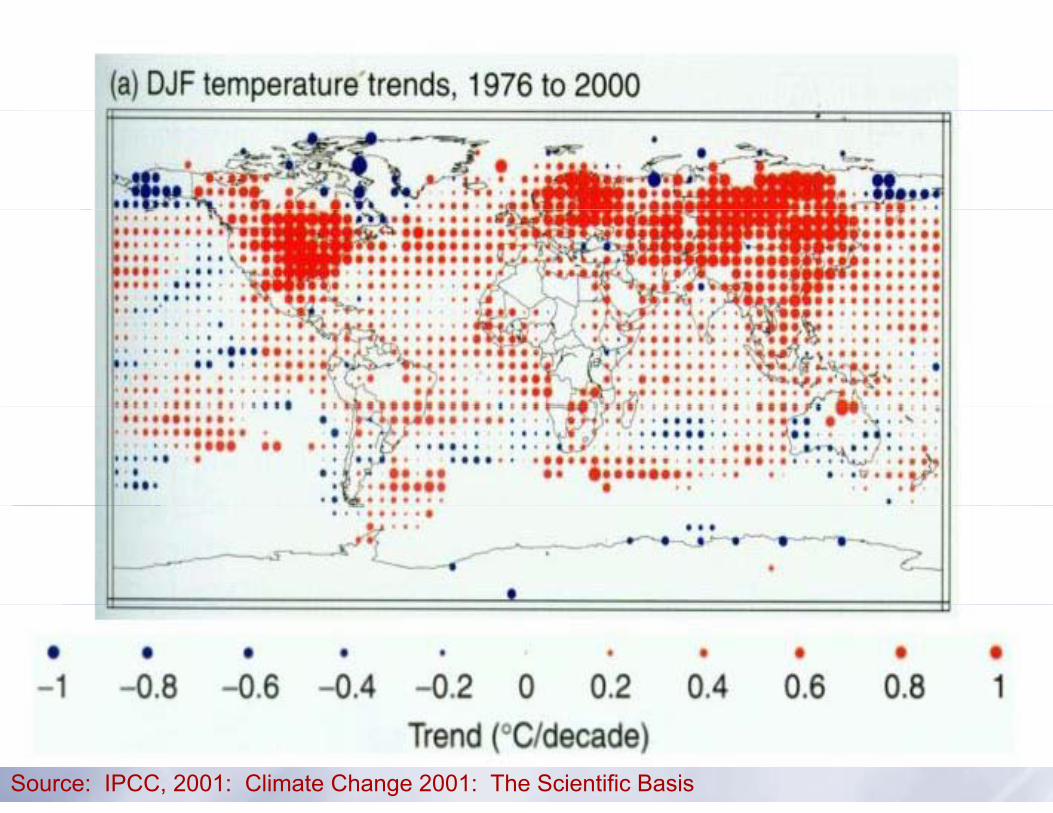
Source: IPCC, 2001: Climate Change 2001: The Scientific Basis
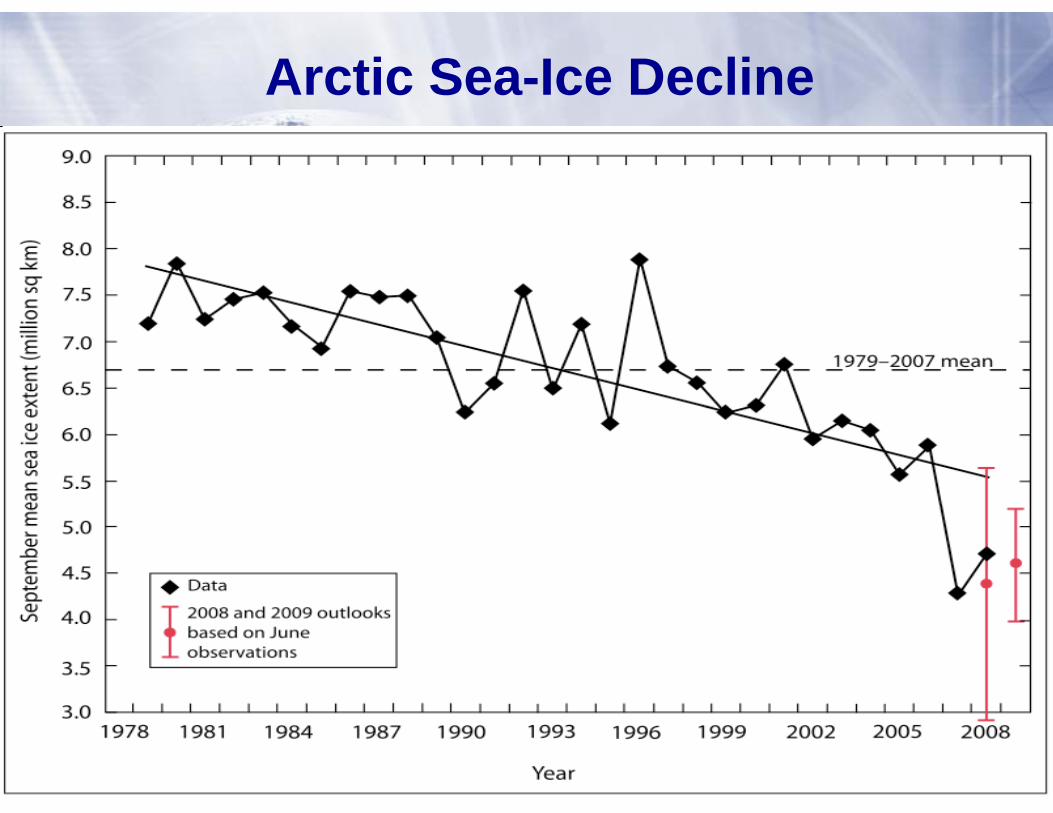
Arctic Sea-Ice Decline

Decline in Greenland Ice Mass

Increase in Hurricane Intensityy

Energy intensiveBalanced fuel sourcesMore environmentally friendly
The planet is committed to acommitted to a warming over the next 50 years regardless ofregardless of political decisions
IPCC Fourth Assessment Report Summary for Policy Makers
Energy intensive
Mitigation
Balanced fuel sourcesMore environmentally friendly
MitigationPossible
AdaptationCrucial
AdaptationNecessary
Crucial
IPCC Fourth Assessment Report Summary for Policy Makers

Observed Summer (JJA) Daily Maximum Temperature Changes (K) 1976-2000Changes (K), 1976-2000
Adapted from Folland et al. [2001]

“Warming“WarmingWarming Hole”:
Warming Hole”:
Simulations of changes in daily
Simulations of changes in dailychanges in daily
maximum summertime
temperatures
changes in daily maximum
summertime temperaturestemperatures
between 1990s and 2040s
temperatures between 1990s
and 2040s
ΔΔTTmaxmax (JJA)(JJA) ˚CPan, Z., R. W. Arritt, E. S. Takle, W. J. Gutowski, Jr., C. J. Anderson, and M. Segal,2004: Altered hydrologic feedback in a warmingclimate introduces a “warming hole”. Geophys. Res. Lett.31, L17109, doi:10.1029/2004GL020528.
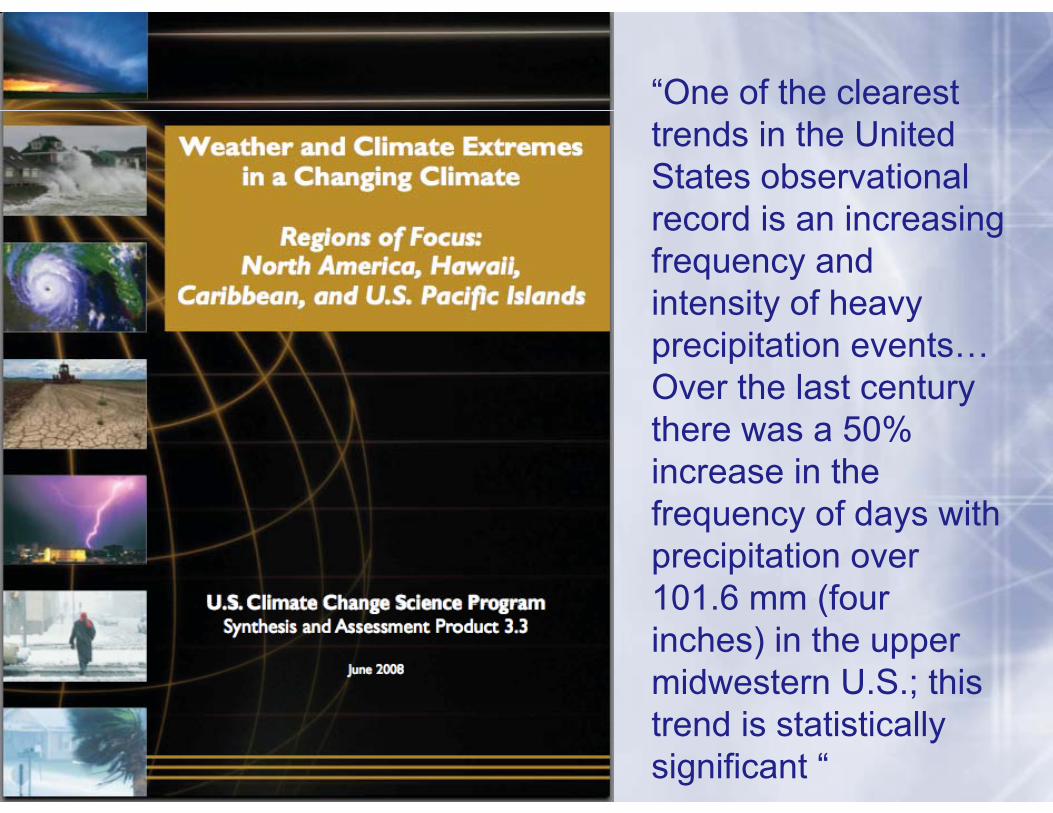
“One of the clearest trends in the United States observational
d i i irecord is an increasing frequency and intensity of heavyintensity of heavy precipitation events… Over the last century there was a 50% increase in the f f d ithfrequency of days with precipitation over 101 6 mm (four101.6 mm (four inches) in the upper midwestern U.S.; this trend is statistically significant “
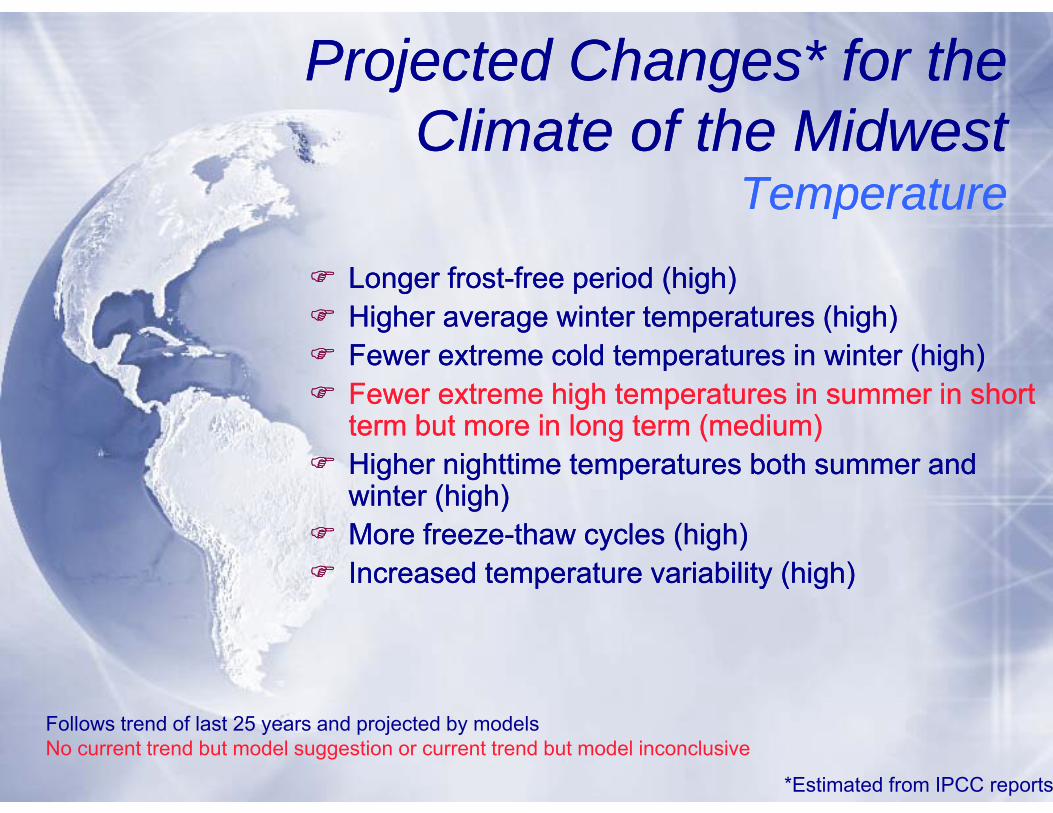
Projected Changes* for the Cli t f th Mid t
Projected Changes* for the Cli t f th Mid tClimate of the Midwest
TemperatureClimate of the Midwest
Temperaturee pe atu ee pe atu e
Longer frost-free period (high)Hi h i t t t (hi h)Longer frost-free period (high)Hi h i t t t (hi h)Higher average winter temperatures (high)Fewer extreme cold temperatures in winter (high)Fewer extreme high temperatures in summer in short
Higher average winter temperatures (high)Fewer extreme cold temperatures in winter (high)Fewer extreme high temperatures in summer in short g pterm but more in long term (medium) Higher nighttime temperatures both summer and winter (high)
g pterm but more in long term (medium) Higher nighttime temperatures both summer and winter (high)winter (high)More freeze-thaw cycles (high)Increased temperature variability (high)
winter (high)More freeze-thaw cycles (high)Increased temperature variability (high)
Follows trend of last 25 years and projected by modelsNo current trend but model suggestion or current trend but model inconclusive
*Estimated from IPCC reports

Projected Changes* for the Cli t f th Mid t
Projected Changes* for the Cli t f th Mid tClimate of the Midwest
PrecipitationClimate of the Midwest
PrecipitationMore (~10%) precipitation annually (medium)Change in “seasonality”: Most of the increase will come in the first half of the year (wetter springs drier summers) (high)
More (~10%) precipitation annually (medium)Change in “seasonality”: Most of the increase will come in the first half of the year (wetter springs drier summers) (high)
ec p tat oec p tat o
first half of the year (wetter springs, drier summers) (high)More water-logging of soils (medium)More variability of summer precipitation (high)
More intense rain events and hence more runoff (high)
first half of the year (wetter springs, drier summers) (high)More water-logging of soils (medium)More variability of summer precipitation (high)
More intense rain events and hence more runoff (high)More intense rain events and hence more runoff (high)Higher episodic streamflow (medium)Longer periods without rain (medium)
Hi h b l t h idit (hi h)
More intense rain events and hence more runoff (high)Higher episodic streamflow (medium)Longer periods without rain (medium)
Hi h b l t h idit (hi h)Higher absolute humidity (high)Stronger storm systems (medium)More winter soil moisture recharge (medium)
Higher absolute humidity (high)Stronger storm systems (medium)More winter soil moisture recharge (medium)Snowfall increases (late winter) in short term but decreases in the long run (medium)Snowfall increases (late winter) in short term but decreases in the long run (medium)
*Estimated from IPCC reports
Follows trend of last 25 years and projected by modelsNo current trend but model suggestion or current trend but model inconclusive
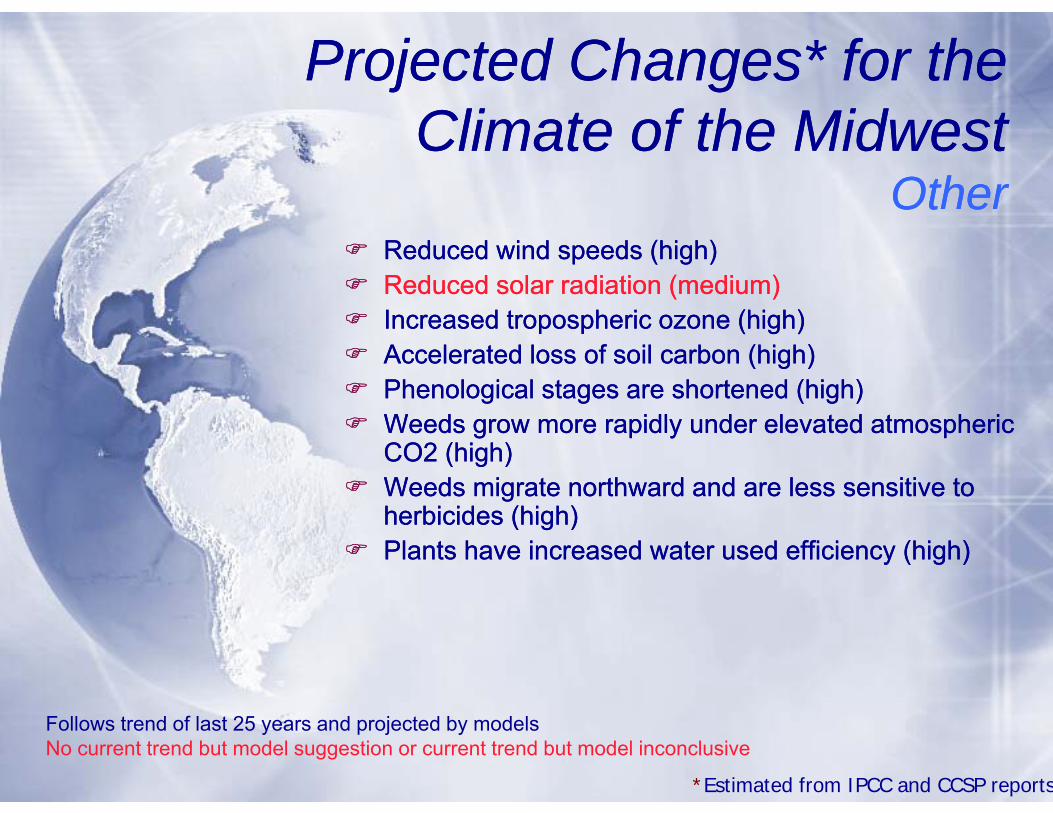
Projected Changes* for the Cli t f th Mid t
Projected Changes* for the Cli t f th Mid tClimate of the Midwest
OtherClimate of the Midwest
OtherReduced wind speeds (high)Reduced solar radiation (medium)Reduced wind speeds (high)Reduced solar radiation (medium)
Ot eOt e
Increased tropospheric ozone (high)Accelerated loss of soil carbon (high)Phenological stages are shortened (high)
Increased tropospheric ozone (high)Accelerated loss of soil carbon (high)Phenological stages are shortened (high)Weeds grow more rapidly under elevated atmospheric CO2 (high)Weeds migrate northward and are less sensitive to
( )
Weeds grow more rapidly under elevated atmospheric CO2 (high)Weeds migrate northward and are less sensitive to
( )herbicides (high)Plants have increased water used efficiency (high)herbicides (high)Plants have increased water used efficiency (high)
Follows trend of last 25 years and projected by modelsNo current trend but model suggestion or current trend but model inconclusive
*Estimated from IPCC and CCSP reports
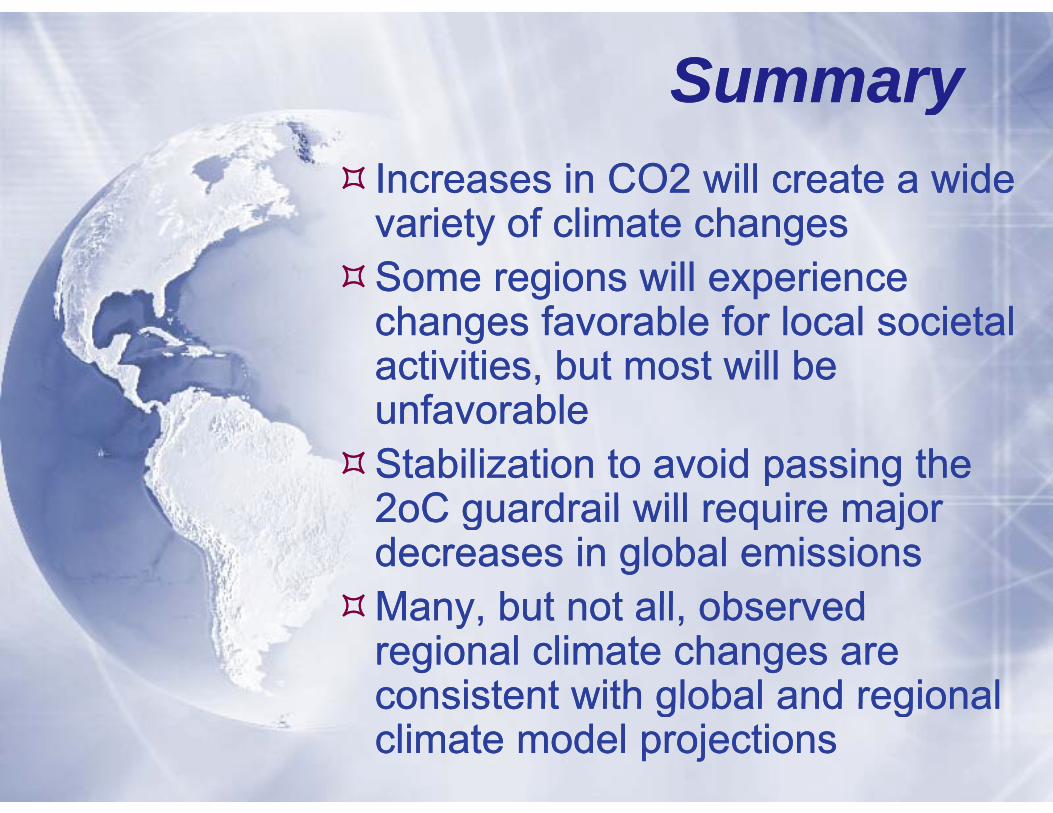
SummarySummaryyyIncreases in CO2 will create a wide
i t f li t hIncreases in CO2 will create a wide
i t f li t hvariety of climate changesSome regions will experience h f bl f l l i t l
variety of climate changesSome regions will experience h f bl f l l i t lchanges favorable for local societal
activities, but most will be unfavorable
changes favorable for local societal activities, but most will be unfavorableunfavorableStabilization to avoid passing the 2oC guardrail will require major
unfavorableStabilization to avoid passing the 2oC guardrail will require major2oC guardrail will require major decreases in global emissionsMany but not all observed
2oC guardrail will require major decreases in global emissionsMany but not all observedMany, but not all, observed regional climate changes are consistent with global and regional
Many, but not all, observed regional climate changes are consistent with global and regionalconsistent with global and regional climate model projectionsconsistent with global and regional climate model projections