ieee journal of oceanic engineering, vol. 29,...
TRANSCRIPT

IEEE JOURNAL OF OCEANIC ENGINEERING, VOL. 29, NO. 4, OCTOBER 2004 1087
A High-Resolution Numerical Modeling Study of theSubtidal Circulation in the Northern South China Sea
David C. Chapman, Dong-Shan Ko, and Ruth H. Preller
Abstract—A high-resolution, regional, numerical-model-based,real-time ocean prediction system for the northern South ChinaSea, called the Northern South China Sea Nowcast/ForecastSystem (NSCSNFS), has been used to investigate subtidalmesoscale flows during the time period of the Asian Seas Inter-national Acoustic Experiment (ASIAEX) field programs. Thedynamics are dominated by three influences; 1) surface windstress, 2) intrusions of the Kuroshio through Luzon Strait, and3) the large-scale cyclonic gyre that occupies much of the northernSouth China Sea. Each component primarily drives currents inthe upper ocean, so deep currents are rather weak. Wind stressis especially effective at forcing currents over the shallow Chinashelf. The Kuroshio intrusion tends to flow westward until it meetsthe northern edge of the large-scale cyclonic gyre. Together, thesecurrents produce an intense, narrow jet directed northwest to-ward the continental slope, often in the region of the ASIAEX fieldprograms. Upon reaching the slope, the current splits with partflowing northeastward along the slope and part flowing southwest-ward, producing large horizontal and vertical shears and makingthis region dynamically very complicated and difficult to simulate.The Kuroshio intrusion tends to be stronger (weaker) when thenortheasterly winds are strong (weak) and the large-scale gyre isfarther south (north), consistent with conclusions from previousmodel studies. At the northern boundary, the model produces apersistent northward flow through Taiwan Strait into the EastChina Sea. Data assimilation in the NSCSNFS model is shownto dampen the system, extracting energy and causing the entiresystem to spin down.
Index Terms—Asian Seas International Acoustic Experiment(ASIAEX), numerical modeling, ocean dynamics, South ChinaSea.
I. INTRODUCTION
THE South China Sea (SCS) is a large and deep semi-en-closed marginal sea, located in the western tropical Pa-
cific Ocean; bounded by Asia to the west, the Philippines tothe east, Borneo to the south, and Taiwan to the north. Theonly deep connection between the SCS and the Pacific Ocean isLuzon Strait, located in the northern SCS between the islands ofLuzon and Taiwan (see Fig. 1). Taiwan Strait provides a shallow
The work of D. C. Chapman was supported by the Office of Naval Researchunder Grant N00014-00-1-0210. The work of D. S. Ko and R. H. Preller’swas supported through the Office of Naval Research’s Ocean Modeling andPrediction Program (Program Element 0602435N). This paper is WoodsHole Oceanographic Institution contribution 11214 and NRL contributionNRL/JA/7320/03/117, which is approved for public release, distributionunlimited.
D. C. Chapman, deceased, was with the Physical Oceanography Department,Woods Hole Oceanographic Institution, Woods Hole, MA 02543 USA.
D.-S. Ko and R. H. Preller are with the Naval Research Laboratory, StennisSpace Center, MS 39529 USA (e-mail: [email protected]).
Digital Object Identifier 10.1109/JOE.2004.838334
connection between the northern SCS and the East China Sea.The large-scale circulation in the SCS is primarily driven bythe monsoonal winds, which are typically from the northeastfrom October through March and reverse to be from the south-west from June through August. In winter, the winds drive abasin-scale cyclonic gyre, while in summer the winds drive ananticyclonic gyre in the southern SCS and a cyclonic gyre inthe Northern SCS [21]. In the northern SCS, the wind-drivencirculation is altered by large intrusions of relatively warm andsalty Kuroshio water through Luzon Strait. The occurrence andstructure of Kuroshio intrusions (i.e., penetration distance, eddyshedding, etc.) are irregular and poorly understood; yet the in-trusions have major effects on the circulation in the northernSCS (e.g., [14]).
Numerous investigators have studied various aspects of thedynamics of the circulation within the SCS, often relying onnumerical models. For example, Chao et al. [5] studied up-welling and downwelling of deep water. Metzger and Hurlburt[18] modeled the upper ocean circulation, showing that the windcurl is important in driving the mean cyclonic flow over mostof the SCS. They also showed that the wind plays a signifi-cant role in determining the transport through Luzon Strait (i.e.,Kuroshio intrusions). More recently, Metzger and Hurlburt [19]studied the driving of Kuroshio intrusions and found that theyare largely unpredictable, although the wind curl appears to berelated to the intensity of the intrusions. Liu et al. [17] con-cluded that the wind curl basically sets the seasonal variabilityin the SCS, while Kuroshio intrusions are important only inthe northern SCS. The latter result was also obtained by Caiet al. [2]. Chern and Wang [7] have recently suggested thatKuroshio intrusions may be regulated by the position of thelarge-scale wind-driven cyclonic gyre within the SCS. That is,during winter, the gyre is displaced toward the southern SCS,allowing more persistent Kuroshio intrusions. With the reversalof the monsoonal winds during summer, the gyre extends north-ward and tends to inhibit Kuroshio intrusions.
Taken together, these studies indicate that the northern SCSis a dynamically complex region where at least two highlyenergetic flows (the large-scale wind-driven cyclonic gyre andKuroshio intrusions) interact. It is also a region of complexbathymetry, with a broad shallow shelf along the China coast, asteep and irregular continental slope that extends from southwestto northeast nearly to the Taiwan coast, and a deep offshorebasin (see Fig. 1). The details of the circulation here, and inparticular within the domain of the Asian Seas InternationalAcoustic Experiment (ASIAEX) field programs (small dottedbox in Fig. 1), are beyond the resolution of the models mentioned
0364-9059/04$20.00 © 2004 IEEE

1088 IEEE JOURNAL OF OCEANIC ENGINEERING, VOL. 29, NO. 4, OCTOBER 2004
Fig. 1. Map of the northern South China Sea. The large dashed box denotes the area of analysis for the present paper. The small dotted box indicates the regionof the ASIAEX field programs. Solid circles show locations of representative wind records presented in Fig. 2.
above, all of which consider the entire SCS (or more). Therefore,the Naval Research Laboratory has undertaken the developmentof a high-resolution, regional, numerical-model-based, real-timeocean prediction system for the northern SCS called the NorthernSouth China Sea Nowcast/Forecast System (NSCSNFS) thatencompasses the domain shown in Fig. 1. This domain waschosen to include the entire area of interest to the ASIAEX fieldprograms at high resolution with open boundaries located alongthe key straits and far enough away from the area of interest tominimize any influence from the open boundary conditions.(The results of this forecast system were made available to theinvestigators of the ASIAEX field programs via a website.)The principal advantage of this model is that some dynamicalprocesses can be resolved and modeled more realistically andat smaller scales. The primary disadvantage is that most of thedomain boundaries are open, so currents and water propertiesfrom outside the model domain must be prescribed in someway. Thus, the model is limited to some extent by the adequacyof these prescriptions.
Given that the model domain includes the area of theASIAEX field efforts, we have used the NSCSNFS model withthree goals in mind; 1) to describe the important mesoscaleflows and dynamics that might be observed during the ASIAEXfield programs, 2) to examine the sensitivity of the model to var-ious parameters and imposed forcing fields, and 3) to identifymodel weaknesses that could point to possible improvements.We do not attempt a direct comparison between the NSC-SNFS model results and ASIAEX field measurements. Suchan undertaking is presently being pursued by other ASIAEX
investigators. One important caveat is that the NSCSNFS modelconsiders only subtidal motions, so there are no astronomicaltides or tidally generated internal solitary waves that oftendominate the higher frequency motions (see other articles inthis issue). Such high-frequency flows can greatly complicatethe interpretation of large-scale surveys (e.g., Gawarkiewicz etal., this issue).
The NSCSNFS model and its application are described inSection II. The forcing fields used in the model are discussed inSection III. The full-model response is described in Section IV.The results from a number of diagnostic model runs are thenused in Section V to better understand the model response. Somediscussion and a summary follow in Section VI.
II. NSCSNFS MODEL DESCRIPTION
The NSCSNFS model is based on the Princeton Ocean Model[1] with 1/24 horizontal resolution and 30 vertical grid pointswithin the model domain shown in Fig. 1. The vertical gridpoints are concentrated near the surface and bottom in orderto resolve the boundary layers. For example, at 200-m totaldepth there are seven grid points within 12 m of the bottom.At 500-m total depth there are five grid points within 20 mof the bottom. The bottom topography is interpolated to themodel grid from the NRL DBDB2, two-minute global topog-raphy database. The Navy Operational Global Atmospheric Pre-diction System (NOGAPS; [20]) provides surface forcing fieldsto drive the model: wind stress, total heat flux, solar radiationand sea level air pressure. Real-time data, the sea surface height

CHAPMAN et al.: HIGH-RESOLUTION NUMERICAL MODELING STUDY OF SUBTIDAL CIRCULATION IN THE NORTH SCS 1089
Fig. 2. Wind stress magnitudes (a, b) and directions (c, d) for the two locations marked by solid circles in Fig. 1 during year 2001.
anomalies from altimeters and the MCSST from AVHRR, areassimilated as described in the Appendix. A North Pacific OceanNowcast/ Forecast System, similar to the NSCNFS, but encom-passing a much larger domain with horizontal resolution of 1/4[15], provides sea surface height, currents, temperatures andsalinities at the open boundaries.
The NSCSNFS model runs continuously, but we are primarilyinterested in the behavior during the times of the ASIAEX fieldprograms. Therefore, we have limited this study to the periodof February 1 to May 15 during both years 2000 and 2001,which captures the transition between winter and summer mon-soons, includes the period when the Kuroshio is strong andthen weakens, and encompasses the ASIAEX field programs.For convenience, we consider the region within the dashed boxin Fig. 1, which encompasses both the large- and small-scalesurvey areas of ASIAEX. The model behavior was qualitativelyquite similar during both years, so most of the results presentedare from 2001. Results from 2000 are included when useful.
III. FORCING FIELDS
The NSCSNFS model responds most readily to the windstress and flows imposed at the open boundaries, so it is helpfulto characterize these forcing fields before proceeding. The windstress is highly variable in both space and time, but nonethelessfairly easy to describe. Fig. 2 shows the wind stress magni-tude and direction at two locations within the model domain(solid dots in Fig. 1), one over the shelf near the northernboundary and one in the center of the study domain. Strongwind events occur fairly regularly at the northlocation until mid-March, when the transition to the summermonsoon begins, after which there are fewer strong storms [seeFig. 2(a)]. The wind at the north location is nearly always fromthe northeast [see Fig. 2(c)]. The central wind stress is highlyvisually correlated with the north wind stress, but its magnitudeis considerably reduced [see Fig. 2(b)], and its direction ismuch more variable [see Fig. 2(d)]. These features are typicalof the strong wind-stress curl that occurs southwest of Taiwan,

1090 IEEE JOURNAL OF OCEANIC ENGINEERING, VOL. 29, NO. 4, OCTOBER 2004
Fig. 3. Vertical sections of velocity normal to (a) the western open boundary and (b) the southern open boundary on March 15 of the 2001 full-model calculation.Velocity scales are shown at the right in ms . Positive velocities are out of the page. The white contour is zero velocity.
presumably the result of the island partially blocking the north-east wind. Plots of wind stress at these locations for this periodin 2000 are qualitatively identical to Fig. 2. Thus, the windstress is virtually always from the northeast with a substantialcyclonic curl during strong wind events, and changes directiononly during periods of very weak winds.
The flows through the open boundaries are more difficult togeneralize, but several features are typical. Transport throughthe northern boundary (Taiwan Strait) is small (despite strongcurrents) because of the shallow depths, and is almost alwaysnorthward, carrying relatively warm, salty water. Flow throughthe eastern, western and southern boundaries is highly vari-able in both magnitude and direction, and all three boundariescontribute substantially to cross-boundary exchange. Close ex-amination of nonshelf flows through the western and southernboundaries shows that they tend to be related; i.e., northwardinflow at the southern boundary usually occurs with westwardoutflow through the western boundary. Fig. 3 shows a typicalexample; at the southern boundary [see Fig. 3(b)] the near-sur-face flow is almost entirely northward (yellow and red, into themodel domain), while at the western boundary [see Fig. 3(a)]the near-surface flow in the deeper regions is westward (blue,out of the model domain). This flow is to be expected when thelarge-scale, wind-driven cyclonic SCS gyre (described in the in-troduction) moves into the model domain. It will tend to carryrelatively cold, fresh water in through the southern boundaryand out through the western boundary. Notice that the shelf flowthrough the western boundary [see Fig. 3(a)] is eastward (red,
into the model domain), consistent with the northward outflowthrough Taiwan Strait.
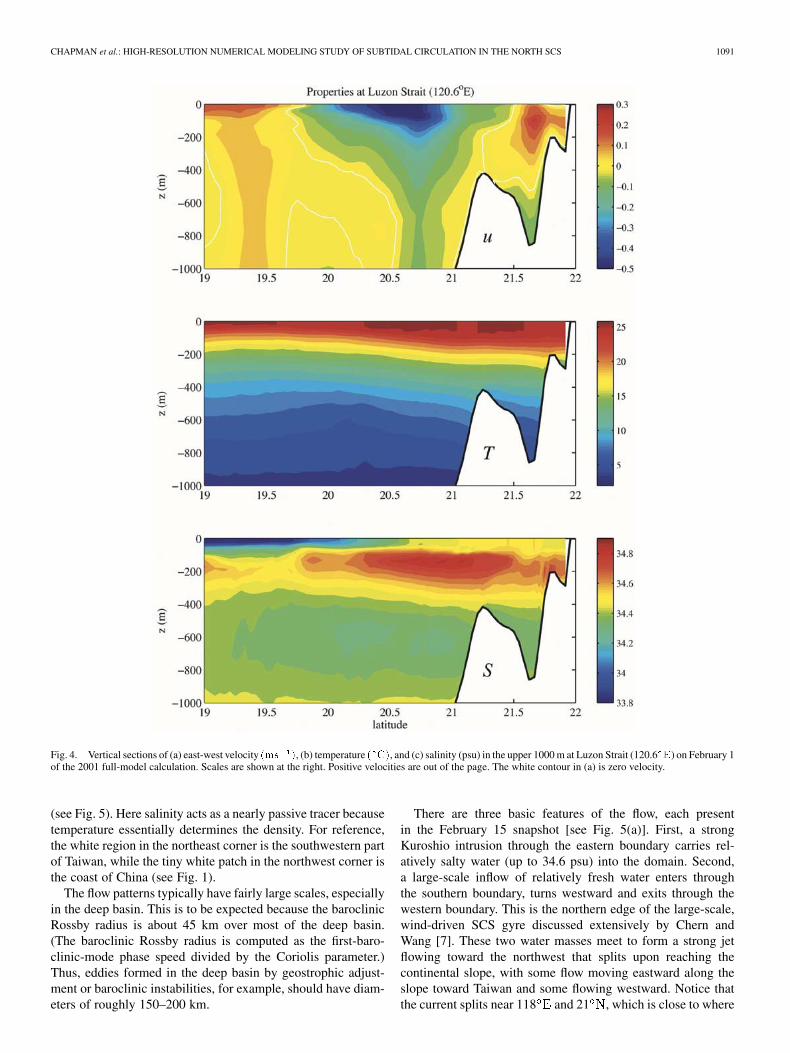
Flow through the eastern boundary is dominated by Kuroshiointrusions, which typically provide a net influx of relativelywarm, salty Kuroshio water to the model domain. Fig. 4 showsa typical example; a strong inflow (blue) occurs between 20and 21 in Fig. 4(a), extending to about 400 m depth. Themaximum inflow velocity of about 0.5 occurs at slightlyless than 100 m depth. A somewhat weaker outflow (maximumof about 0.2 ) is found just south of Taiwan, centered atabout 21.7 .
At all of the open boundaries, most of the flow is limited torelatively shallow depths ( 400 m). That is, as in Figs. 3 and 4,the most energetic flows occur in the upper ocean, providing thebulk of the mass and momentum flux into and out of the domain.Flows at greater depths are very weak. The model response toother forcing fields (e.g. surface heat flux, atmospheric pressure)is extremely weak during the time period considered here, sothese fields are not summarized.
IV. FULL-MODEL RESPONSE
The NSCSNFS model response with full forcing is describedin this section. The model calculation begins on February1,using the full-model operational forecast for that day as theinitial condition. An overview of the dominant flow patterns isprovided by several snapshots of surface salinity and horizontalvelocities, each separated by one month during the 2001 period
CHAPMAN et al.: HIGH-RESOLUTION NUMERICAL MODELING STUDY OF SUBTIDAL CIRCULATION IN THE NORTH SCS 1091
Fig. 4. Vertical sections of (a) east-west velocity (ms ), (b) temperature ( C), and (c) salinity (psu) in the upper 1000 m at Luzon Strait (120.6 E) on February 1of the 2001 full-model calculation. Scales are shown at the right. Positive velocities are out of the page. The white contour in (a) is zero velocity.
(see Fig. 5). Here salinity acts as a nearly passive tracer becausetemperature essentially determines the density. For reference,the white region in the northeast corner is the southwestern partof Taiwan, while the tiny white patch in the northwest corner isthe coast of China (see Fig. 1).
The flow patterns typically have fairly large scales, especiallyin the deep basin. This is to be expected because the baroclinicRossby radius is about 45 km over most of the deep basin.(The baroclinic Rossby radius is computed as the first-baro-clinic-mode phase speed divided by the Coriolis parameter.)Thus, eddies formed in the deep basin by geostrophic adjust-ment or baroclinic instabilities, for example, should have diam-eters of roughly 150–200 km.
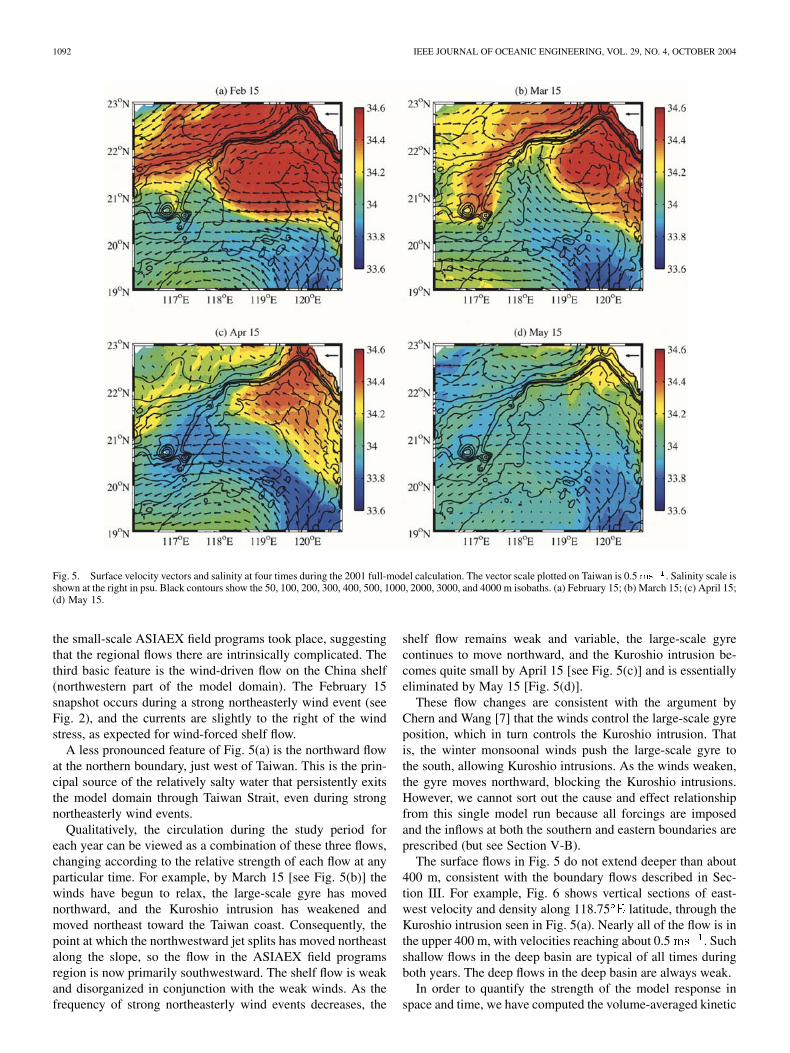
There are three basic features of the flow, each presentin the February 15 snapshot [see Fig. 5(a)]. First, a strongKuroshio intrusion through the eastern boundary carries rel-atively salty water (up to 34.6 psu) into the domain. Second,a large-scale inflow of relatively fresh water enters throughthe southern boundary, turns westward and exits through thewestern boundary. This is the northern edge of the large-scale,wind-driven SCS gyre discussed extensively by Chern andWang [7]. These two water masses meet to form a strong jetflowing toward the northwest that splits upon reaching thecontinental slope, with some flow moving eastward along theslope toward Taiwan and some flowing westward. Notice thatthe current splits near 118 and 21 , which is close to where
1092 IEEE JOURNAL OF OCEANIC ENGINEERING, VOL. 29, NO. 4, OCTOBER 2004
Fig. 5. Surface velocity vectors and salinity at four times during the 2001 full-model calculation. The vector scale plotted on Taiwan is 0.5ms . Salinity scale isshown at the right in psu. Black contours show the 50, 100, 200, 300, 400, 500, 1000, 2000, 3000, and 4000 m isobaths. (a) February 15; (b) March 15; (c) April 15;(d) May 15.
the small-scale ASIAEX field programs took place, suggestingthat the regional flows there are intrinsically complicated. Thethird basic feature is the wind-driven flow on the China shelf(northwestern part of the model domain). The February 15snapshot occurs during a strong northeasterly wind event (seeFig. 2), and the currents are slightly to the right of the windstress, as expected for wind-forced shelf flow.
A less pronounced feature of Fig. 5(a) is the northward flowat the northern boundary, just west of Taiwan. This is the prin-cipal source of the relatively salty water that persistently exitsthe model domain through Taiwan Strait, even during strongnortheasterly wind events.
Qualitatively, the circulation during the study period foreach year can be viewed as a combination of these three flows,changing according to the relative strength of each flow at anyparticular time. For example, by March 15 [see Fig. 5(b)] thewinds have begun to relax, the large-scale gyre has movednorthward, and the Kuroshio intrusion has weakened andmoved northeast toward the Taiwan coast. Consequently, thepoint at which the northwestward jet splits has moved northeastalong the slope, so the flow in the ASIAEX field programsregion is now primarily southwestward. The shelf flow is weakand disorganized in conjunction with the weak winds. As thefrequency of strong northeasterly wind events decreases, the
shelf flow remains weak and variable, the large-scale gyrecontinues to move northward, and the Kuroshio intrusion be-comes quite small by April 15 [see Fig. 5(c)] and is essentiallyeliminated by May 15 [Fig. 5(d)].
These flow changes are consistent with the argument byChern and Wang [7] that the winds control the large-scale gyreposition, which in turn controls the Kuroshio intrusion. Thatis, the winter monsoonal winds push the large-scale gyre tothe south, allowing Kuroshio intrusions. As the winds weaken,the gyre moves northward, blocking the Kuroshio intrusions.However, we cannot sort out the cause and effect relationshipfrom this single model run because all forcings are imposedand the inflows at both the southern and eastern boundaries areprescribed (but see Section V-B).
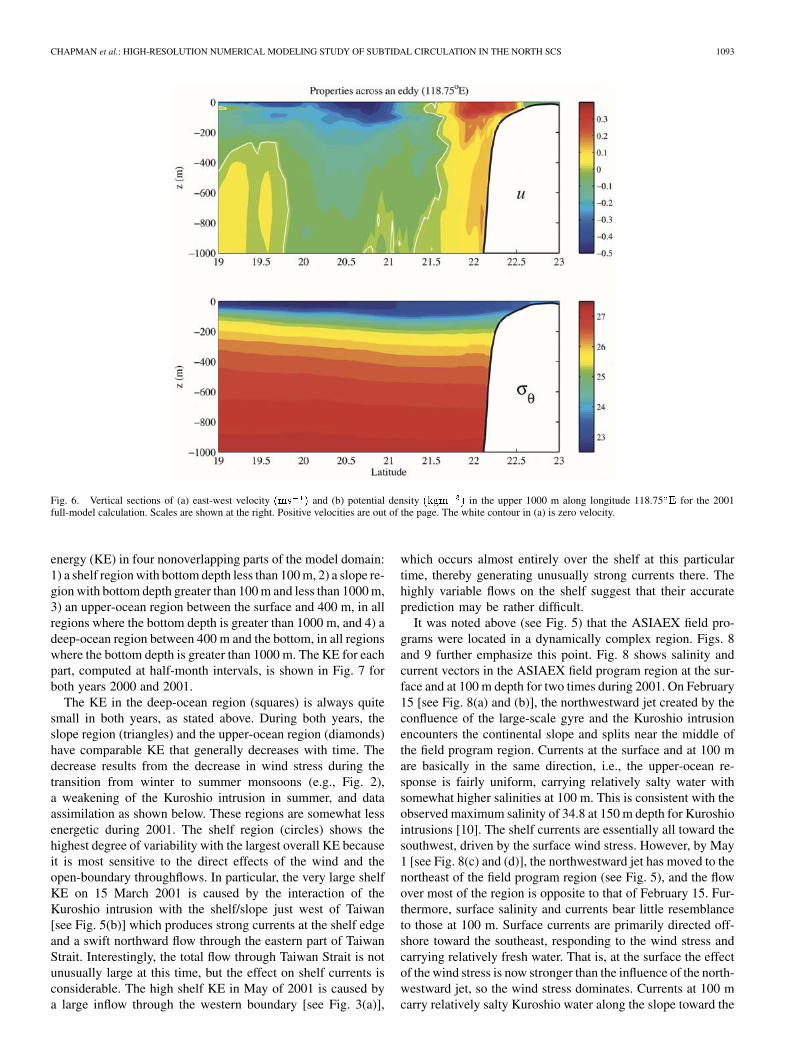
The surface flows in Fig. 5 do not extend deeper than about400 m, consistent with the boundary flows described in Sec-tion III. For example, Fig. 6 shows vertical sections of east-west velocity and density along 118.75 latitude, through theKuroshio intrusion seen in Fig. 5(a). Nearly all of the flow is inthe upper 400 m, with velocities reaching about 0.5 . Suchshallow flows in the deep basin are typical of all times duringboth years. The deep flows in the deep basin are always weak.
In order to quantify the strength of the model response inspace and time, we have computed the volume-averaged kinetic
CHAPMAN et al.: HIGH-RESOLUTION NUMERICAL MODELING STUDY OF SUBTIDAL CIRCULATION IN THE NORTH SCS 1093
Fig. 6. Vertical sections of (a) east-west velocity (ms ) and (b) potential density (kgm ) in the upper 1000 m along longitude 118.75 E for the 2001full-model calculation. Scales are shown at the right. Positive velocities are out of the page. The white contour in (a) is zero velocity.
energy (KE) in four nonoverlapping parts of the model domain:1) a shelf region with bottom depth less than 100 m, 2) a slope re-gion with bottom depth greater than 100 m and less than 1000 m,3) an upper-ocean region between the surface and 400 m, in allregions where the bottom depth is greater than 1000 m, and 4) adeep-ocean region between 400 m and the bottom, in all regionswhere the bottom depth is greater than 1000 m. The KE for eachpart, computed at half-month intervals, is shown in Fig. 7 forboth years 2000 and 2001.
The KE in the deep-ocean region (squares) is always quitesmall in both years, as stated above. During both years, theslope region (triangles) and the upper-ocean region (diamonds)have comparable KE that generally decreases with time. Thedecrease results from the decrease in wind stress during thetransition from winter to summer monsoons (e.g., Fig. 2),a weakening of the Kuroshio intrusion in summer, and dataassimilation as shown below. These regions are somewhat lessenergetic during 2001. The shelf region (circles) shows thehighest degree of variability with the largest overall KE becauseit is most sensitive to the direct effects of the wind and theopen-boundary throughflows. In particular, the very large shelfKE on 15 March 2001 is caused by the interaction of theKuroshio intrusion with the shelf/slope just west of Taiwan[see Fig. 5(b)] which produces strong currents at the shelf edgeand a swift northward flow through the eastern part of TaiwanStrait. Interestingly, the total flow through Taiwan Strait is notunusually large at this time, but the effect on shelf currents isconsiderable. The high shelf KE in May of 2001 is caused bya large inflow through the western boundary [see Fig. 3(a)],
which occurs almost entirely over the shelf at this particulartime, thereby generating unusually strong currents there. Thehighly variable flows on the shelf suggest that their accurateprediction may be rather difficult.
It was noted above (see Fig. 5) that the ASIAEX field pro-grams were located in a dynamically complex region. Figs. 8and 9 further emphasize this point. Fig. 8 shows salinity andcurrent vectors in the ASIAEX field program region at the sur-face and at 100 m depth for two times during 2001. On February15 [see Fig. 8(a) and (b)], the northwestward jet created by theconfluence of the large-scale gyre and the Kuroshio intrusionencounters the continental slope and splits near the middle ofthe field program region. Currents at the surface and at 100 mare basically in the same direction, i.e., the upper-ocean re-sponse is fairly uniform, carrying relatively salty water withsomewhat higher salinities at 100 m. This is consistent with theobserved maximum salinity of 34.8 at 150 m depth for Kuroshiointrusions [10]. The shelf currents are essentially all toward thesouthwest, driven by the surface wind stress. However, by May1 [see Fig. 8(c) and (d)], the northwestward jet has moved to thenortheast of the field program region (see Fig. 5), and the flowover most of the region is opposite to that of February 15. Fur-thermore, surface salinity and currents bear little resemblanceto those at 100 m. Surface currents are primarily directed off-shore toward the southeast, responding to the wind stress andcarrying relatively fresh water. That is, at the surface the effectof the wind stress is now stronger than the influence of the north-westward jet, so the wind stress dominates. Currents at 100 mcarry relatively salty Kuroshio water along the slope toward the

1094 IEEE JOURNAL OF OCEANIC ENGINEERING, VOL. 29, NO. 4, OCTOBER 2004
Fig. 7. Time history of the volume-averaged kinetic energy within each of the four nonoverlapping regions (defined in the text) for the full-model calculationsin years (a) 2000 and (b) 2001.
southwest, still driven by the northwestward jet, which is noweast of this region.
Fig. 9 shows the change in vertical structure of the alongslopecurrents [normal to the black line in Fig. 8(a)] accompanying thechange in location of the northwestward jet. On February 15 [seeFig. 9(a)], the flow is nearly entirely toward the northeast (red).On May 1 [see Fig. 9(b)], the near-surface flow and the flowover the shelf have a northeast component, but the flow overmost of the slope (shallower than 800 m) is reversed toward thesouthwest (blue). These results show that the flow in this region,especially over the shelf and slope, can be highly variable in bothspace and time, depending on the interaction of the deep basinflows and the wind stress.
A small-scale process that is nicely captured by the NSC-SNFS model is the tendency for buoyancy shutdown of thebottom boundary layer in regions of strong stratification oversloping topography (see [9], for an excellent review). That is,alongslope currents produce Ekman transport at the bottomeither up or down the slope, carrying buoyancy and tiltingisopycnals within the bottom boundary layer. The thermal-windshear introduced by the horizontal density gradients reducesthe velocity at the bottom, thereby decreasing bottom stress.In this way, the flow adjusts to reduce the stress felt by theoverlying flow, allowing stratified flow over a sloping bottomto persist much longer than would be anticipated based onstandard drag-law estimates of spindown times.
Fig. 10 shows two vertical sections that illustrate buoyancyshutdown for both downwelling and upwelling flows. Down-
welling currents [into the page, blue in Fig. 10(a)] generateEkman transport down the slope. Light water is carried underheavy water, which mixes rapidly to produce a thick bottomboundary layer. The density gradient in the boundary layer issuch that the alongslope velocity becomes small near the bottom(white is zero) and even reverses under part of the flow. No-tice that the tilting of the isopycnals at the bottom increases asthe stratification weakens with depth (say, below 200 m depth)because the thermal-wind shear is less with weaker stratifica-tion, so the bottom mixed layer grows thicker before shutdownoccurs. In contrast, upwelling currents [out of the page, redin Fig. 10(b)] generate Ekman transport up the slope, carryingdenser water under lighter water. The boundary layer thins, butthermal-wind shear still reduces the velocity toward zero at thebottom. In this case, the flow is actually slightly reversed at thebottom over most of the section. Again, the upward tilting ofisopycnals is greater at depth where the stratification is weaker,as required to achieve shutdown. Thus, in both sections, buoy-ancy shutdown has reduced the bottom stress, and consequentlythe interior flows can maintain for longer times and/or distances.
V. DIAGNOSTIC MODEL RUNS
In order to investigate the complex behavior of the operationalmodel, we have rerun the model numerous times for each yearin somewhat simpler scenarios. First, a calculation was startedfrom the same initial state as the full model described above (thefull NSCSNFS forecast for February 1) but with no forcing at all

CHAPMAN et al.: HIGH-RESOLUTION NUMERICAL MODELING STUDY OF SUBTIDAL CIRCULATION IN THE NORTH SCS 1095
Fig. 8. Velocity vectors and salinity within the small dotted box in Fig. 1, at the surface and at 100 m depth on both February 15 and May 1 of the 2001 full-modelcalculation. The vector scale plotted in the white region of (d) is 0.3 ms . Salinity scale is shown at the right in psu. Black contours show the 50, 100, 200, 300,400, 500, 1000, 2000, 3000, and 4000 m isobaths. Black line in (a) is the location of the sections in Fig. 9. (a) z = 0, February 15; (b) z = �100m, February 15;(c) z = 0, May 1; (d) z = �100 m, May 1.
(i.e., spindown). Then, we repeated this calculation, each timestarting from the same initial condition but using an individualforcing field as the sole driving mechanism. Finally, we madeseveral calculations starting with a resting ocean, and applyingan individual forcing field as the sole driving mechanism. Theseresults are summarized next.
A. Spindown
First, all of the external forcing fields described in Section IIare set to zero, data assimilation is turned off and all bound-aries are closed. In this calculation, the circulation within themodel domain on February 1 simply spins down through fric-tional processes, revealing the “natural” time and space scalesfor the system.
Fig. 11 shows a sequence of snapshots of surface salinityand velocities, at times corresponding to those in Fig. 5. Thelack of inflows through the boundaries is obvious almost im-mediately; the Kuroshio intrusion stops and the northern edgeof the large-scale cyclonic gyre disappears. The shelf flow de-cays rapidly in the absence of wind forcing. The pool of salty
Kuroshio water southwest of Taiwan on February 15 beginsto evolve into a freely propagating baroclinic eddy, which hasmoved about 100 km southwestward by March 15. Its horizontalscale is several Rossby radii, consistent with geostrophic adjust-ment processes. Its vertical scale (not shown) is small, much likethe eddy in Fig. 6. The eddy is steered by the shelf/slope topog-raphy, but it experiences little decay in strength because buoy-ancy shutdown prevents bottom friction from extracting muchenergy. Note also that the eddy drags narrow bands (streamers)of alternately fresh and salty water around its perimeter, pro-ducing quite small horizontal scales in the salinity field. By May15, a second weaker eddy has formed off the Taiwan coast in thewake of the primary eddy. Thus, the response time scale for shelfflows is quite short (a few days), while that for the deep basin isvery long (many months).
B. Individual Forcings
Next, model calculations were made with individual forcingsto examine their influence on the circulation. The surface ve-locities and salinity are shown in Fig. 12 for the three most im-

1096 IEEE JOURNAL OF OCEANIC ENGINEERING, VOL. 29, NO. 4, OCTOBER 2004
Fig. 9. Vertical sections along the black line in Fig. 8(a), showing velocity normal to the section on (a) February 15 and (b) May 1 of the 2001 full-modelcalculation. Scales are shown at the right in ms . Red (blue) is out of (into) the page. White is zero velocity.
portant cases; wind forcing, open-boundary forcing and data as-similation. Each panel is a snapshot from the end of the run, onMay 15, and should be compared with the full-model responsein Fig. 5(d).
Wind forcing alone [see Fig. 12(a)] produces nearly uniformsouthwestward flow over the shelf, following the wind. The flowessentially never reverses because the wind is always from thenortheast [see Fig. 2(c)], but merely weakens and becomes dis-organized when the wind weakens. In the deep region, the closedboundaries prevent the large-scale cyclonic gyre from pushing
the Kuroshio intrusion water toward Taiwan, so the wind is freeto force the remnants of this anticyclonic eddy southwestwardalong the continental slope. As the anticyclonic eddy movessouthwestward, a cyclonic eddy forms off the coast of Taiwanin response to both the wind stress curl described in Section IIIand upwelling at the closed model boundaries. Eventually, theentire deep region is filled with baroclinic eddies. The absenceof the large-scale gyre eliminates the inflow of relatively freshwater, so the surface salinity remains fairly high, merely beingredistributed by the wind-forced eddies.

CHAPMAN et al.: HIGH-RESOLUTION NUMERICAL MODELING STUDY OF SUBTIDAL CIRCULATION IN THE NORTH SCS 1097
Fig. 10. Vertical sections of potential density and normal velocity along the line shown in the inset map, both on February 15 of the 2001 full-model calculation.Velocity scales are shown at the right in ms . Red (blue) is out of (into) the page. White is zero velocity. Density contours are 23 to 27 by 0.2 kgm .
Open-boundary forcing produces a rather different response[see Fig. 12(b)]. In this case, the circulation is dominated bythe large-scale gyre at the southern boundary. The relativelyfresh water penetrates farther north than in the full-modelresponse, flowing along the shelf edge and eventually outthe northern boundary. The shelf flow is strong and towardthe northeast, opposite to the wind-forced shelf flow. ByMay 15, the remnants of the Kuroshio intrusion have been
pinched between the large-scale gyre, the shelf and the Taiwancoast. This supports the conclusion of previous studies (al-ready mentioned) that wind forcing influences the strengthof the Kuroshio intrusions. That is, despite the same easternboundary flows as in the full-model response, the absenceof wind forcing allows the large-scale gyre to dominate thecirculation, greatly reducing the penetration of the Kuroshiointrusion into the SCS.

1098 IEEE JOURNAL OF OCEANIC ENGINEERING, VOL. 29, NO. 4, OCTOBER 2004
Fig. 11. Surface velocity vectors and salinity at four times during the 2001spindown calculation. The vector scale plotted on Taiwan is 0.5 ms . Salinityscale is shown at the right in psu. Black contours show the 50, 100, 200, 300,400, 500, 1000, 2000, 3000, and 4000 m isobaths. (a) February 15; (b) March 15;(c) April 15; (d) May 15.
Perhaps most surprising is the model response to data assim-ilation alone [see Fig. 12(c)]. In this case, the flow is very weakeverywhere, with only a hint of an anticyclonic eddy where theKuroshio intrusion began. Currents are, in fact, considerablyweaker than those in the spindown calculation, indicating thatdata assimilation has had the net effect of extracting energy fromthe system. Thus, data assimilation seems to be damping thesystem, rather than driving it. This will be discussed further inSection VI.
Additional calculations were made using surface heat fluxalone and air pressure alone, but these forcings had little impacton the dynamics. The surface heat flux warmed the surface, butthere was no way to mix the heat downwards. Basically, the re-sults were nearly identical to the spindown calculation describedin Section V-A.
To quantify the energy input for each of the model calcula-tions, the volume-averaged kinetic energy has been computedin the four regions (shelf, slope, upper-ocean, deep-ocean) foreach model run, as done for Fig. 7. Results for each regionare shown in Fig. 13. The thick solid line in each panel isthe full-model response (same as in Fig. 7), while the other
Fig. 12. Surface velocity vectors and salinity on May 15 of the 2001 calcula-tions forced only by (a) wind stress, (b) open-boundary flows, and (c) dataassimilation. The vector scale plotted on Taiwan is 0.5 ms . Salinity scaleis shown at the right in psu. Black contours show the 50, 100, 200, 300, 400,500, 1000, 2000, 3000, and 4000 m isobaths.
runs are denoted by the legend in panel (c). Over the shelf[see Fig. 13(a)], the KE decreases nearly to zero within 0.5months for both spindown and data assimilation forcing.Wind and open-boundary forcing provide most of the KE,with the response to open-boundary forcing actually beingsomewhat more energetic because of the persistent northwardflow at the northern boundary. Interestingly, the full-modelresponse is more energetic than the simple sum of the wind and

CHAPMAN et al.: HIGH-RESOLUTION NUMERICAL MODELING STUDY OF SUBTIDAL CIRCULATION IN THE NORTH SCS 1099
Fig. 13. Time history of the volume-averaged kinetic energy within the (a) shelf, (b) slope, (c) upper-ocean, and (d) deep-ocean regions (defined in the text) forvarious 2001 model calculations denoted by the legend in (c). Thick black curve in each panel shows the full-model response.
open-boundary forced responses, suggesting a strong nonlinearcoupling between the two forcings, at least over the shelf.What happens is that some of the energetic slope currents aredriven slightly onto the shelf in the full-model response, andthis dominates the shelf KE. So, in some sense, this feature ismerely an artifact of the definition of regions over which wecompute KE. Over the slope [see Fig. 13(b)], the spindownresponse is only slightly less energetic than the full-modelresponse. Open-boundary forcing provides energy early on, butis surpassed by the wind-forced response by mid-April. Dataassimilation clearly extracts KE from the system, producingrapid decay through the entire period. In the upper-ocean re-
gion [see Fig. 13(c)], the spindown and open-boundary forcingresponses are quite similar, both being slightly more energeticthan the full-model response. Wind forcing is very effectiveat driving the upper-ocean circulation, while data assimilationagain produces persistent decay. The deep-ocean region [seeFig. 13(d)] is much less energetic, with open-boundary forcingproviding most of the KE. Both spindown and wind forcinglead to a general decline in KE, although not nearly as rapidlyas data assimilation.
The single most obvious generalization from these calcu-lations is that wind and open-boundary forcings provide en-ergy to the system, while data assimilation acts to damp the

1100 IEEE JOURNAL OF OCEANIC ENGINEERING, VOL. 29, NO. 4, OCTOBER 2004
Fig. 14. Time history of the volume-averaged kinetic energy within the entire domain for various model calculations in years (a) 2000 and (b) 2001.
system. This point is further emphasized in Fig. 14, whichshows the volume-averaged KE over the entire model domainfor various runs in both 2000 and 2001. In both years, thefull-model response is substantially weaker than that of windforcing or open-boundary forcing. Data assimilation producesthe weakest response by far. In 2000, even spindown is moreenergetic than the full-model response. The response to forcingby surface heat flux alone in 2001 (asterisks in panel b) isnearly identical to spindown, showing that surface heat flux isineffective at driving currents during this time period. Finally,the response to all forcings together but no data assimilationin 2001 (pluses in panel b) is considerably more energetic thanthe full-model response, again showing the damping effect ofdata assimilation.
C. Starting From Rest
Additional model runs were made with the ocean startingfrom rest, driven by wind forcing and open-boundary forcingalone. These show how readily each forcing can spin up thecirculation, as well as the means by which it is accomplished.
In addition, a wind-forced case was run in which the curlof the wind stress was removed, and the resulting wind fieldwas scaled so as to provide the same total energy input asthe full wind field. So, the “curl-less” wind stress is spatiallyuniform, but it can change direction and magnitude. Herethe wind-stress curl was simply computed directly from thewind-stress field.
Fig. 15 shows snapshots of surface salinity and veloci-ties at the end of each calculation. Clearly the responses towind forcing and to open-boundary forcing are more ener-getic than the response to the “curl-less” wind stress (panelb). Both wind and open-boundary forcing generate eddies,while the “curl-less” wind stress does not. However, the ed-dies are formed in very different ways. Open-boundary forcingimposes the Kuroshio intrusion inflow through Luzon Straitand the large-scale gyre inflow at the southern boundary thatexits through the western boundary. These two flows combine,as described in Section IV, to generate the large eddy south-west of Taiwan. This circulation is similar to that shown inFig. 12(b), but surface salinities remain relatively low because

CHAPMAN et al.: HIGH-RESOLUTION NUMERICAL MODELING STUDY OF SUBTIDAL CIRCULATION IN THE NORTH SCS 1101
Fig. 15. Surface velocity vectors and salinity on May 15 of the 2001 calcula-tions starting from rest and forced only by (a) full wind stress, (b) “curl-less”wind stress, and (c) and open-boundary flows. The vector scale plotted onTaiwan is 0.5 ms . Salinity scale is shown at the right in psu. Black contoursshow the 50, 100, 200, 300, 400, 500, 1000, 2000, 3000, and 4000 m isobaths.
the subsurface salinity maximum (e.g., Fig. 4) remains belowthe surface. On the other hand, the closed boundaries in thewind-forced cases allow upwelling at these boundaries, whichgenerates strong boundary currents and brings saltier water tothe surface. (These are not readily seen in Fig. 15 because ofthe limited model domain shown.) Hence, the surface salinitiesare much higher in panels (a) and (b) than in (c). The full windfield is considerably stronger near the eastern boundary than
is the “curl-less” wind, so upwelling there is correspondinglystronger with the full wind. The resulting upwelling jets aredeflected westward near the southern boundary, thereby pro-ducing strong anticyclonic flow that generates the eddies inpanel (a). Therefore, the wind-stress curl is not as effective atproducing eddies directly as might be expected. Rather the ed-dies in this calculation are produced to some extent artificiallyby the closing of the open boundaries.
Fig. 16 shows the volume-averaged KE for each of the cal-culations starting from rest. The open-boundary forcing is mostefficient at generating the circulation, with the full wind forcingat about half the level. The “curl-less” wind does not producemuch KE. The response time scale appears to be about 0.5–1month, with the final KE level for open-boundary forcing atabout the same level as the final KE level of the full model inFig. 14(b).
VI. DISCUSSION AND SUMMARY
A high-resolution regional numerical model of the circu-lation in the northern South China Sea (see Fig. 1) reveals acomplicated interaction of ocean currents over complex bottomtopography. There are three primary influences on the currentsin this region; 1) surface wind stress, 2) intrusions of theKuroshio through Luzon Strait, and 3) the large-scale cyclonicgyre that occupies a large part of the northern South ChinaSea. Wind stress is imposed at the ocean surface, while theother two influences enter through the lateral open boundaries,based on a larger-scale North Pacific Ocean Nowcast/ForecastSystem. The most energetic open-boundary influences are fairlyshallow features, extending no more than about 400 m deep.Currents deeper than 400 m are also primarily driven by theopen-boundary flows, but they are very weak and dynamicallyunimportant in all of the model calculations.
Wind stress directly impacts only the upper ocean, so its ef-fects are dominant primarily over the continental shelf, wherethe currents tend to follow the strong northeasterly winds ofthe winter monsoon. The Kuroshio intrusion typically flowswestward toward the continental slope southwest of Taiwan,where it meets the large-scale cyclonic gyre that flows north-ward through the southern open boundary and turns westwardbefore exiting through the western open boundary. The com-bination of the Kuroshio intrusion and the large-scale gyreproduce an intense, narrow current directed northwest towardthe continental slope, often in the region of the ASIAEX fieldprograms. Upon reaching the slope, the current splits, withpart flowing northeastward along the slope and part flowingsouthwestward. The details of the interaction of this jet withthe sloping bottom topography are poorly understood, and havebeen the motivation for a recent theoretical study by Hsueh andZhong [11]. This work advances previous theories by includinga continental shelf, and suggests that most of the incoming jetshould turn toward the northeast, rather than the southwest. Itremains to be seen how viscous processes, including the ac-tion of the bottom boundary layer, and continuous stratificationwill modify these results. Unfortunately, the sensitivity of theposition of the jet makes the ASIAEX field program region

1102 IEEE JOURNAL OF OCEANIC ENGINEERING, VOL. 29, NO. 4, OCTOBER 2004
Fig. 16. Time history of the volume-averaged kinetic energy within the entire domain for three 2001 model calculations that started from rest.
particularly difficult for data-model comparisons. Slight vari-ations in the position of the jet produce major changes in thecurrent over the outer shelf and slope.
At the northern boundary, the model produces a persistentnorthward flow through Taiwan Strait into the East China Sea.This flow typically carries relatively warm, salty water fromKuroshio intrusions through the Penghu Channel just westof Taiwan, and it can dominate the shelf response, especiallyduring times of relatively weak winds. These results are con-sistent with several recent studies, which have focused on theflow through Taiwan Strait (e.g., [6], [12], [13], [16]).
The NSCSNFS model appears to represent some oceanprocesses reasonably well. For instance, the model naturallygenerates large-scale eddies in the deep basin, usually theresult of a Kuroshio intrusion, which adjust toward geostrophywhen unforced. They are confined to the upper 300–400 mand have horizontal scales of several baroclinic Rossby radii.They tend to drift westward, riding along the steep continentalslope, with little loss of energy because buoyancy advection inthe bottom boundary layer shuts down the Ekman transport,thereby reducing bottom stress. The eddies wrap different watermasses around them, producing narrow streamers, much likeGulf Stream warm-core rings.
The details of the flow in the northern SCS are quite sen-sitive to the relative strength of the three primary influences;slight variations in the strengths of the wind, Kuroshio intru-sion or large-scale gyre can dramatically alter the flow in thenorthern South China Sea. Furthermore, the confluence of theseflows at the continental slope can produce large vertical shearsin the horizontal velocities and variations in water propertieson short horizontal and vertical scales. Consequently, it is es-
pecially difficult to make successful forecasts. Any errors orinaccuracies in either the forcing fields or the data assimilationscheme are bound to be amplified with time, leading to themodel drifting away from reality. Therefore, it is crucial thatkey variables be measured and inserted into the model withdynamical consistency.
Model calculations driven by individual forcings support thedominance of the three influences named above. Flow on theshelf spins down rapidly without the wind stress to drive it.Most of the energy input comes from the open-boundariesand the wind stress. Other forcings, such as surface heat fluxand air pressure, have virtually no effect on the circulation,although the heat flux certainly changes the near-surface watertemperature.
Perhaps the most surprising result is that the data assimi-lation used in the NSCSNFS model acts as a strong damperon the system, extracting energy and causing the entire systemto spin down. This is caused by the low spatial and temporalresolution of the data, about 100 km and 15 days, respectively,that is assimilated compared to the model resolution (1/24 ),i.e., the assimilated data have no information at the model res-olution scale. Thus, the short wavelength and high frequencyvariations that the NSCSNFS model generates without data as-similation are filtered (i.e. damped) by the data assimilation.The same data assimilation scheme acts as an energy sourcefor the large-scale North Pacific Basin Model. So, to improvethe NSCSNFS model, emphasis should be placed on obtainingaccurate winds, producing the best estimates of flow throughthe open boundaries and obtaining observations to be used inthe data assimilation scheme that have resolution comparableto the model.

CHAPMAN et al.: HIGH-RESOLUTION NUMERICAL MODELING STUDY OF SUBTIDAL CIRCULATION IN THE NORTH SCS 1103
APPENDIX
DATA ASSIMILATION METHODOLOGY
The NSCSNFS assimilates three-dimensional fields ofocean temperature and salinity generated from observationsof sea surface height (SSH), derived from altimetry data, andsatellite derived sea surface temperature (SST). These surfaceobservations are used to generate a full three-dimensionalgridded field of ocean temperature and salinity using theModular Ocean Data Assimilation System (MODAS) [4], [8].A “synthetic” temperature profile is produced by projectingthe surface information downward using the correlationbetween the steric height, the surface temperature and thesubsurface temperature derived from historical profile data.Ocean salinity profiles are than derived from relationships tothese temperatures at depth.
The SSH used in the calculation of these synthetic profilesis the steric height that varies in the ocean due to changes inthe temperature. Altimetry data represents the total height rel-ative to prescribed means and is modified by filtering out thebarotropic signal using a relatively long mesoscale correlationtime (30 days) on along track altimetry measurements. Thesedata are processed using optimal interpolation into a two-dimen-sional field of SSH that is more representative of the baroclinicsignal.
MODAS provides the ocean climatology of temperatureand salinity that is modified by these two-dimensional fieldsof SSH and SST to generate the daily three-dimensional ana-lyzes of temperature and salinity assimilated into the models.Once these analyzes are generated, they are assimilated intothe model by a nudging technique defined in the followingmanner.
where and are the nudging coefficients.The nudging coefficients include a vertical weighting func-
tion. Weighting is generally weak at the surface where tem-perature and salinity may change rapidly due to mixing, sur-face fluxes and, in shallow water, bottom stress effects. Theweighting at the sea surface is zero and increases exponentiallywith depth over a 200 m vertical scale. The weighting is thanreduced from approximately 500–1000 m depth since below1000 m the synthetic profiles revert back to the monthly cli-matology or background field. At all locations, weighting is re-duced exponentially to zero at the bottom over a 20 m verticalscale to reduce the influence of the data assimilation on bottomboundary layer processes.
In addition to this vertical weighting, the data are nudgedinto the model with a temporal weighting ofwhere Dt is the nudging interval, is the nudging time scale(30-days to match the correlation time scale of the analysis)and is the model error variance/analysis error variance. Fortemperature, or the analysis is assumed to carry twicethe weight of the model and for salinity, as the salinitydata available to generate the salinity climatology and T-S cor-relation was sparse.
ACKNOWLEDGMENT
The authors would like to thank K. Shearman for his assis-tance with parts of the analysis and plotting of results.
REFERENCES
[1] A. Blumberg and G. Mellor, “A description of a three-dimensionalcoastal ocean circulation model,” in Three-Dimensional Coastal OceanModels, Coastal and Estuarine Sciences, N. Heaps, Ed. Washington,DC: AGU, 1987, vol. 4, p. 208.
[2] S. Cai, J. Su, Z. Gan, and Q. Liu, “The numerical study of the SouthChina Sea upper circulation characteristics and its dynamic mechanism,in winter,” Cont. Shelf Res., vol. 22, pp. 2247–2264, 2002.
[3] M. R. Carnes, D. N. Fox, R. C. Rhodes, and O. M. Smedstad, “Data as-similation in a North Pacific Ocean monitoring and prediction system,”in Modern Approaches to Data Assimilation in Ocean Modeling (Else-vier Oceanography Series 61), P. Malanotte-Rizzoli, Ed. New York:Elsevier , 1994, p. 455.
[4] M. R. Carnes, L. Mitchell, and P. W. deWitt, “Synthetic temperatureprofiles derived from Geosat altimetry: comparison with air-droppedexpendable bathythermograph profiles,” J. Geophys. Res., vol. 95, pp.17 979–17 992, 1990.
[5] S.-Y. Chao, P.-T. Shaw, and S. Y. Wu, “Deep water ventilation in theSouth China Sea,” Deep-Sea Res., vol. 43, pp. 445–466, 1996.
[6] C.-T. A. Chen, “Rare northward flow in the Taiwan Strait in winter: anote,” Cont. Shelf Res., vol. 23, pp. 387–391, 2003.
[7] C.-S. Chern and J. Wang, “Numerical study of the upper-layer cir-culation in the South China Sea,” J. Oceanogr., vol. 59, pp. 11–24,2003.
[8] D. N. Fox, W. J. Teague, C. N. Barron, and M. R. Carnes, “The ModularOcean Data Assimilation System (MODAS),” J. Atmos. Ocean. Tech.,vol. 19, pp. 240–252, 2002.
[9] C. Garrett, P. MacCready, and P. Rhines, “Boundary mixing and arrestedEkman layers: rotating stratified flow near a sloping boundary,” Ann. Rev.Fluid Mech., vol. 25, pp. 291–323, 1993.
[10] J. Hu, H. Liang, and X. Zhang, “Sectional distribution of salinity andits indiction of Kuroshio’s intrusion in the southern Taiwan Strait andnortheastern South China Sea late summer, 1994,” Acta OceanologicaSinica, vol. 18, no. 2, pp. 225–236, 1999.
[11] Y. Hsueh and L. Zhong, “A note on the deflection of a baroclinic cur-rent by a continental shelf,” Geophys. Astro. Fluid Dyn., vol. 97, pp.393–415, 2003.
[12] S. Jan and S.-Y. Chao, “Seasonal variation of volume transport in themajor inflow region of the Taiwan Strait: the Penghu channel,” Deep-SeaRes., vol. 50, pp. 1117–1126, 2003.
[13] S. Jan, J. Wang, C.-S. Chern, and S.-Y. Chao, “Seasonal variation ofthe circulation in the Taiwan Strait,” J. Mar. Syst., vol. 35, pp. 249–268,2002.
[14] S. Jilan, “Circulation dynamics of the China Seas north of 18 N,” in TheSea: The Global Coastal Ocean Regional Studies and Synthesis, A. R.Robinson and K. H. Brink, Eds. New York: Wiley, 1998, vol. 11, pp.483–505.
[15] D. S. Ko, R. H. Preller, G. A. Jacobs, T. Y. Tang, and S. F. Lin, “Trans-port reversals at Taiwan Strait during October and November 1999,” J.Geophys. Res., vol. 108, no. C11, p. 3370, 2003.
[16] W.-D. Liang, T. Y. Tang, Y. L. Yang, M. T. Ko, and W.-S. Chuang,“Upper-ocean currents around Taiwan,” Deep-Sea Res., vol. 50, pp.1085–1105, 2003.
[17] Z. Liu, H. Yang, and Q. Liu, “Regional dynamics of seasonal vari-ability in the South China Sea,” J. Phys. Oceanogr., vol. 31, pp.272–284, 2001.
[18] E. J. Metzger and H. E. Hurlburt, “Coupled dynamics of the South ChinaSea, the Sulu Sea, and the Pacific Ocean,” J. Geophys. Res., vol. 101, pp.12 331–12 352, 1996.
[19] , “The nondeterministic nature of Kuroshio penetration and eddyshedding in the South China Sea,” J. Phys. Oceanogr., vol. 31, pp.1712–1732, 2001.
[20] T. E. Rosmon, “The design and testing of the Navy Operational GlobalAtmospheric Prediction System,” Weather Forecasting, vol. 72, no. 2,pp. 262–272, 1992.
[21] K. Wyrtki, “Scientific Results of Marine Investigations of the SouthChina Sea and the Gulf of Thailand,” Scripps Institution of Oceanog-raphy, NAGA Report, vol. 2, 1961.

1104 IEEE JOURNAL OF OCEANIC ENGINEERING, VOL. 29, NO. 4, OCTOBER 2004
David C. Chapman received the B.S. and M.S. de-grees in agricultural engineering from Cornell Uni-versity, Ithaca, NY, in 1974 and 1976, respectively,and the Ph.D. degree in physical oceanography fromthe Scripps Institution of Oceanography, Universityof California, San Diego, in 1981.
He continued his oceanographic research at theWoods Hole Oceanographic Institute (WHOI),Woods Hole, MA, where he was appointed a post-doctoral investigator and moved on to the positionsof Assistant Scientist, Associate Scientist, and finally
to Senior Scientist in 1997. He was a world leader in coastal oceanographyand made many contributions to the understanding of physical processes inoceanography. His work was of fundamental importance in understanding howcoastal currents are driven by winds and river discharge. His initial work atWHOI focused on the theory of continental shelf waves. He also studied the“shelf-slope” front found along the east coast of North America by conductinga sequence of theoretical and numerical model studies that provided the firstdynamically sound understanding of the shelf-slope front, how it is formed,what controls its position and strength of the along-front flow, and how the frontis maintained over thousands of kilometers against dissipation. The impact ofthis body of work on coastal oceanography has been profound. His interestin the shelf-slope front led him to consider the behavior of freshwater plumescreated by river discharge into the coastal ocean. He discovered that there isa class of buoyant plumes in which much of the plume is in contact with thebottom, and consequently the dynamics are quite different from surface-trappedplumes. In the last decade, he became a leader in modeling processes overArctic continental shelves. His work focused on understanding the influence ofbottom topography and eddy processes on the formation and spread of watermade dense by surface cooling in large coastal polynyas.
Dong-Shan Ko received the B.S degree in marinescience and the M.S. degree in physical oceanog-raphy from the College of Chinese Culture, Taiwan,R.O.C., in 1974 and 1979, respectively, and the M.S.degree in ocean engineering and the Ph.D.degreein applied marine physics from the University ofMiami, FL, in 1981 and 1987, respectively.
He is a scientist in the Coastal and Semi-EnclosedSeas section of the Naval Research Laboratory(NRL) located at Stennis Space Center, MS. He hasworked for a number of years on the development
and design of the ocean nowcast/forecast systems. He has also worked withapplications of ocean models for the study of circulation in deep ocean basinsand in the coastal ocean. His efforts at NRL were originally focused on thedevelopment of forecast systems along the west coast of the United States andexpanded to include the entire the North Pacific Ocean. He is the developerof NRL’s real-time nowcast/forecast system in the Intra Americas Sea and theco-developer of the real-time nowcast/forecast system in the East Asian Seas.
Ruth H. Preller received the B.S. degree in physicsfrom Dickinson College, Carlisle, PA, in 1975 andthe M.S. and Ph.D degrees in meteorology from theFlorida State University, Tallahassee, in 1979 and1985, respectively.
She is the Superintendent of the OceanographyDivision of the Naval Research Laboratory locatedat Stennis Space Center, MS. She is responsible forthe development and design of the U.S. Navy’s seaice forecasting systems since the mid-1980s. She hasalso worked with applications of ocean models to the
circulation of both coastal and semi-enclosed seas. Her group has developedocean forecast systems for the western Pacific called the East Asian SeasNowcast/Forecast System and for the Gulf of Mexico and the Caribbean calledthe Intra Americas Sea (IAS) Nowcast/Forecast System. These forecast systemsare nested within the Navy’s Global NCOM forecast system. She and her teamare responsible for the development of the PCTides globally relocatable systemfor tidal height prediction. She served as an Associate Editor for High LatitudeOceanography publications in The Journal of Geophysical Research Oceansand then as the Editor for this topic area for over nine years.
Dr. Preller serves on several national scientific committee and has interactedwith the international science community having served as the session chairmanor organizer of various science conferences including the annual OperationalOceanography session of the European Geophysical Union conference.