noaa’s hurricane intensity forecasting...
TRANSCRIPT
AFFILIATIONS: RogeRs, AbeRson, blAck, cione, DoRst, gAmAche, golDenbeRg, gopAlAkRishnAn, kAplAn, mARks, muRillo, powell, ReAsoR, uhlhoRn, AnD VukiceVic—NOAA/AOML/Hurricane Research Division, Miami, Florida; Aksoy, AnnAne, Dunion, klotz, loRsolo, sellwooD, zhAng, AnD zhAng—Cooperative Institute for Marine and Atmospheric Studies, University of Miami, Miami, FloridaCORRESPONDING AUTHOR: Robert Rogers, NOAA/AOML/Hurricane Research Division, 4301 Rickenbacker Causeway, Miami, FL 33149E-mail: [email protected]
The abstract for this article can be found in this issue, following the table of contents.DOI:10.1175/BAMS-D-12-00089.1
In final form 3 October 2012©2013 American Meteorological Society
IFEX continues to collect data about all stages of the tropical cyclone lifecycle and is showing
promising results about improving understanding and prediction of storm intensity.
NOAA’S HURRICANE INTENSITY FORECASTING EXPERIMENT
A Progress Report
by RobeRt RogeRs, sim AbeRson, Altug Aksoy, bAchiR AnnAne, michAel blAck, Joseph cione, neAl DoRst, JAson Dunion, John gAmAche, stAn golDenbeRg, sunDARARAmAn gopAlAkRishnAn, John kAplAn,
bRADley klotz, sylVie loRsolo, FRAnk mARks, shiRley muRillo, mARk powell, pAul ReAsoR, kAthRyn sellwooD, eRic uhlhoRn, tomislAVA VukiceVic, Jun zhAng, AnD XueJin zhAng
T he challenge of improving tropical cyclone (TC) intensity forecasts is well documented (e.g., Rogers et al. 2006, hereafter R06; DeMaria
et al. 2005), and significant research efforts have been directed toward improving them. These efforts have included development of operational numerical models that are approaching cloud-permitting resolution (e.g., Gopalakrishnan et al. 2011a), new techniques for assimilating inner-core
observations into numerical models (Aksoy et al. 2012; F. Zhang et al. 2009, 2011), techniques for optimizing ensemble forecasts of TC intensity, and refinement of statistical/dynamical models for predicting TC intensity change and rapid intensifi-cation (RI; Kaplan and DeMaria 2003; Kaplan et al. 2010). Despite some progress, there remains room for improvement. For example, while the National Hurricane Center (NHC) official 48-h track fore-cast error has decreased about 50% between 2000 and 2010, the intensity forecast error over the same period has remained virtually unchanged (see, e.g., www.nhc.noaa.gov/verification/verify5.shtml).
In 2005, the National Oceanic and Atmospheric Administration (NOAA) began a multiyear experi-ment called the Intensity Forecasting Experiment (IFEX; R06). As the name states, the ultimate aim of IFEX is to improve the prediction of TC intensity. There are three primary goals proposed by IFEX to improve TC intensity predictions, as spelled out in R06: 1) collect observations that span the TC life cycle in a variety of environments for model initialization and evaluation; 2) develop and refine measurement strategies and technologies that provide improved real-time monitoring of TC intensity, structure, and environment; and 3) improve the understanding of
859june 2013AMeRICAn MeTeOROLOGICAL SOCIeTY |
physical processes important in intensity change for a TC at all stages of its life cycle.
NOAA, through a partnership among various agencies such as the Hurricane Research Division (HRD), Aircraft Operations Center (AOC), NHC, and Environmental Modeling Center (EMC), has flown IFEX aircraft missions every year since 2005. The purpose of this paper is to provide a brief summary of significant IFEX missions that have occurred since 2005 and an overview of the research and develop-ment efforts that have arisen from these missions that aim to improve TC intensity forecasts.
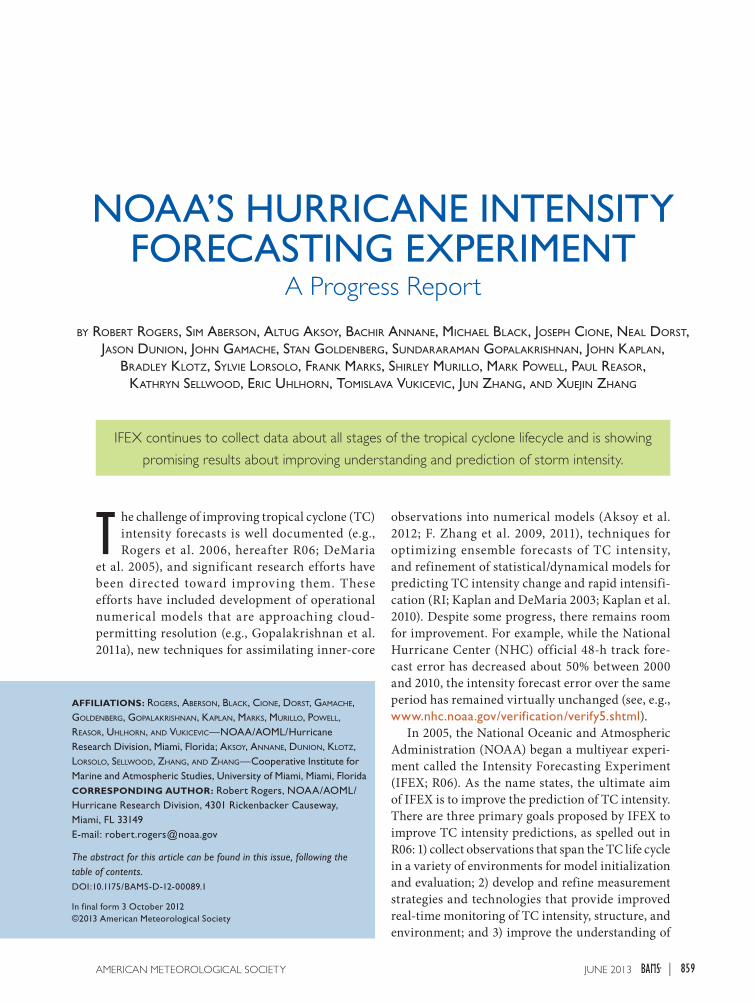
OVERVIEW OF IFEX MISSIONS. Since TC intensity change is a multiscale process (e.g., Marks and Shay 1998), the experiments flown during IFEX are designed to collect measurements of physical processes that span these scales both spatially and temporally, ranging from environmental scale (~100–10,000 km spatial; 1–3 days temporal) to microscale (~1 mm–1 cm spatial; 1 s temporal). An example of this multiscale approach to data collection is shown in Fig. 1, which lists the experiments proposed for the 2011 IFEX Field Program (for a description of IFEX experiments during 2011, see www.aoml.noaa.gov/hrd/HFP2011 /index.html) and shows where each experiment falls on
the spectrum of spatial and temporal scales. Figure 1 also shows which IFEX goals from R06 are covered by each experiment. Note that in sev-eral cases one experiment can address multiple spatial/temporal scales and IFEX goals. The measurements taken in the various experiments are col-lected primarily using two of NOAA’s heavy manned aircraft that are used in TC reconnaissance and surveillance: the NOAA Lockheed WP-3D Orion and the Gulfstream IV-SP (G-IV) aircrafts. We routinely sample the TC inner core with the P-3 aircraft over a 3-h period during flights separated every 12 h, providing information on the convective- and vortex-scale evolution. Flight-level measurements are collected at 1 Hz and for some pa-rameters at 40 Hz, providing informa-tion on the turbulent and microscale structure. The G-IV aircraft can sample across thousands of kilome-ters at 12-h intervals, which provides information on the multiday evolution of the environmental scale.
A similar distribution of experiments was pro-posed for previous years as a part of IFEX. Whether an experiment is flown in a given year is of course dependent on the availability of appropriate targets, proximity to bases, and other logistical consider-ations. However, with several years of IFEX flights, plus the addition of f lights from years prior to the beginning of IFEX, a significant proportion of these experiments have been f lown and are being analyzed. Table 1 provides a summary of signifi-cant IFEX missions from 2006 to 2011. A variety of missions were f lown during this time, including several missions covering the entire TC life cycle, rapid intensification, the response to vertical shear, Saharan air layer (SAL), and tropical cyclogenesis. Several milestones occurred during these flights as well, such as the first real-time transmission and use of airborne Doppler data in data assimilation (DA) from Tropical Storm (TS) Fay (2008). During 2006 and 2010, IFEX partnered with other ex-periments, including the National Aeronautics and Space Administration (NASA) African Monsoon Multidisciplinary Analysis (NAMMA; Zipser et al. 2009) in 2006 and the NASA Genesis and Rapid Intensification Processes (GRIP) experiment (Braun et al. 2013) and National Science Foundation (NSF)
Fig. 1. List of experiments proposed for the 2011 IFEX Hurricane Field Program, plotted as that portion of the spatial spectrum the experiments primarily addresses (here, DWL = Doppler wind lidar and SUAVE = special unmanned aerial vehicle experiments). Also noted are the primary IFEX goals addressed by each experiment.
860 june 2013|
Pre-Depression Investigation of Cloud-Systems in the Tropics (PREDICT; Montgomery et al. 2012) in 2010. These experiments provided additional resources and data collection platforms, which augmented the regu-lar IFEX data collection efforts. This was especially the case with Hurricanes Earl (2010) and Karl (2010).
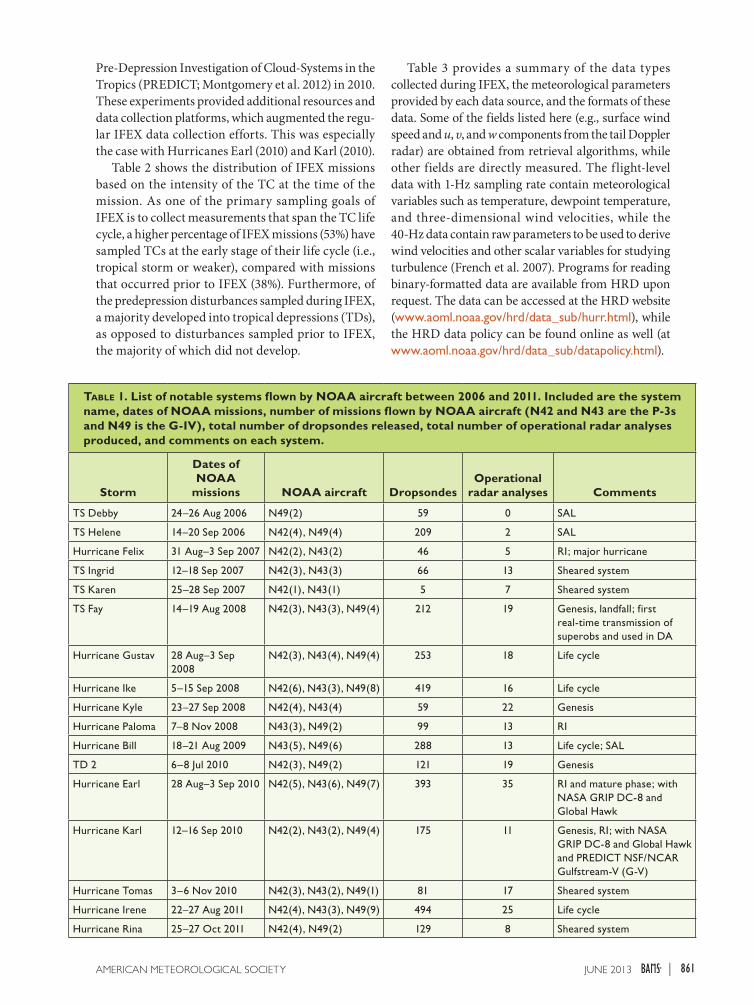
Table 2 shows the distribution of IFEX missions based on the intensity of the TC at the time of the mission. As one of the primary sampling goals of IFEX is to collect measurements that span the TC life cycle, a higher percentage of IFEX missions (53%) have sampled TCs at the early stage of their life cycle (i.e., tropical storm or weaker), compared with missions that occurred prior to IFEX (38%). Furthermore, of the predepression disturbances sampled during IFEX, a majority developed into tropical depressions (TDs), as opposed to disturbances sampled prior to IFEX, the majority of which did not develop.
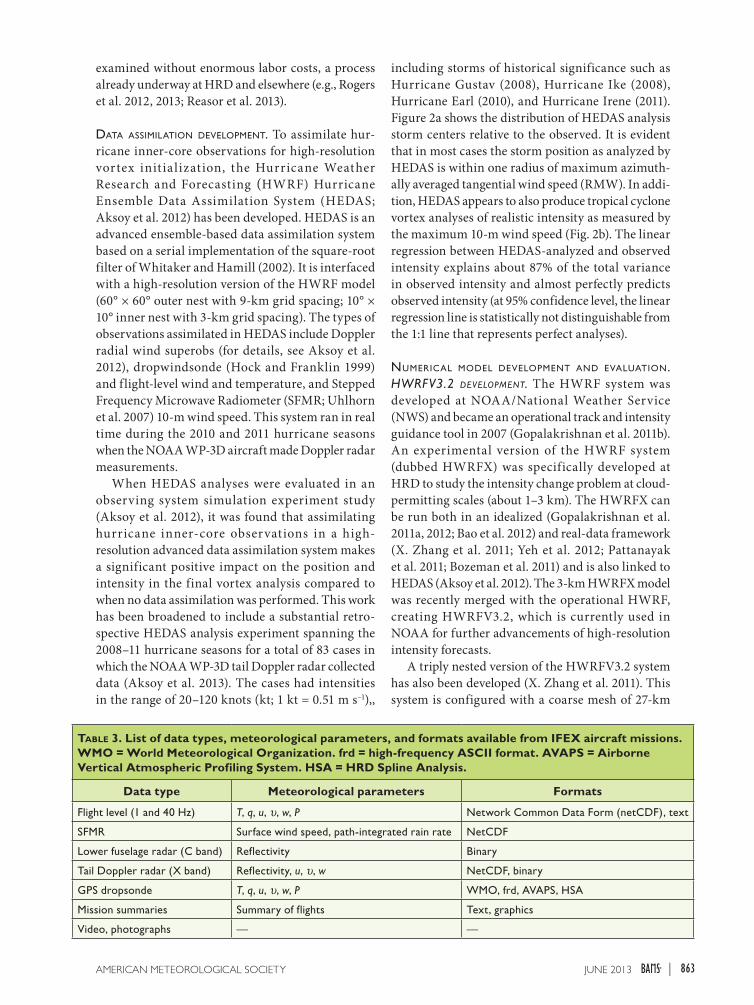
Table 3 provides a summary of the data types collected during IFEX, the meteorological parameters provided by each data source, and the formats of these data. Some of the fields listed here (e.g., surface wind speed and u, υ, and w components from the tail Doppler radar) are obtained from retrieval algorithms, while other fields are directly measured. The flight-level data with 1-Hz sampling rate contain meteorological variables such as temperature, dewpoint temperature, and three-dimensional wind velocities, while the 40-Hz data contain raw parameters to be used to derive wind velocities and other scalar variables for studying turbulence (French et al. 2007). Programs for reading binary-formatted data are available from HRD upon request. The data can be accessed at the HRD website (www.aoml.noaa.gov/hrd/data_sub/hurr.html), while the HRD data policy can be found online as well (at www.aoml.noaa.gov/hrd/data_sub/datapolicy.html).
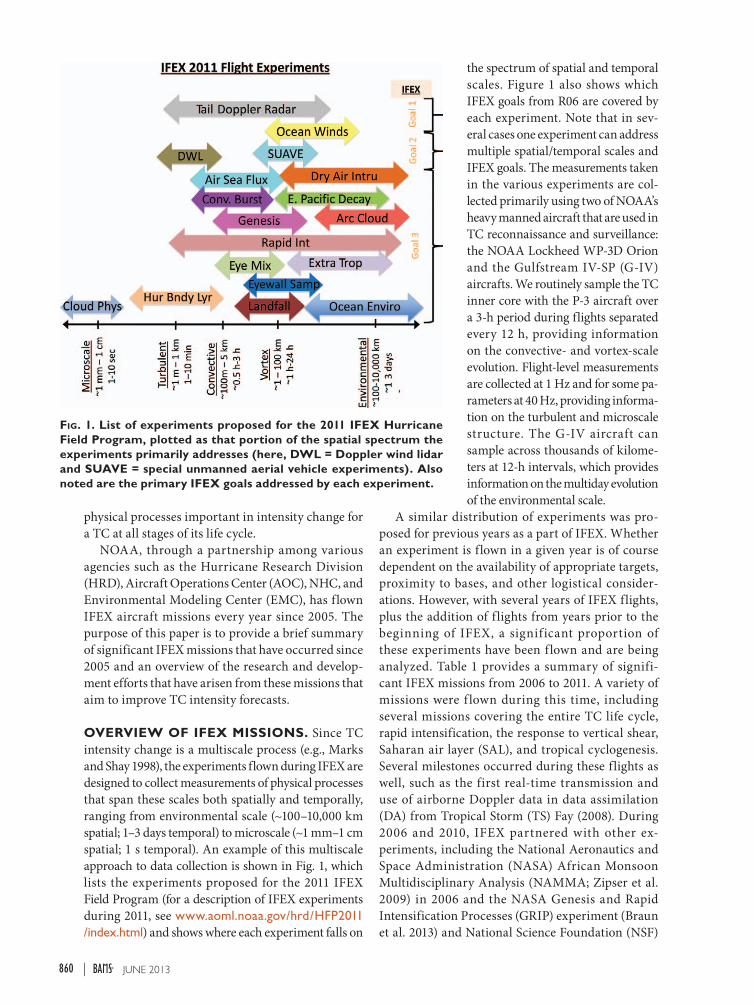
Table 1. List of notable systems flown by NOAA aircraft between 2006 and 2011. Included are the system name, dates of NOAA missions, number of missions flown by NOAA aircraft (N42 and N43 are the P-3s and N49 is the G-IV), total number of dropsondes released, total number of operational radar analyses produced, and comments on each system.
Storm
Dates of NOAA
missions NOAA aircraft DropsondesOperational
radar analyses Comments
TS Debby 24–26 Aug 2006 N49(2) 59 0 SAL
TS Helene 14–20 Sep 2006 N42(4), N49(4) 209 2 SAL
Hurricane Felix 31 Aug–3 Sep 2007 N42(2), N43(2) 46 5 RI; major hurricane
TS Ingrid 12–18 Sep 2007 N42(3), N43(3) 66 13 Sheared system
TS Karen 25–28 Sep 2007 N42(1), N43(1) 5 7 Sheared system
TS Fay 14–19 Aug 2008 N42(3), N43(3), N49(4) 212 19 Genesis, landfall; first real-time transmission of superobs and used in DA
Hurricane Gustav 28 Aug–3 Sep 2008
N42(3), N43(4), N49(4) 253 18 Life cycle
Hurricane Ike 5–15 Sep 2008 N42(6), N43(3), N49(8) 419 16 Life cycle
Hurricane Kyle 23–27 Sep 2008 N42(4), N43(4) 59 22 Genesis
Hurricane Paloma 7–8 Nov 2008 N43(3), N49(2) 99 13 RI
Hurricane Bill 18–21 Aug 2009 N43(5), N49(6) 288 13 Life cycle; SAL
TD 2 6–8 Jul 2010 N42(3), N49(2) 121 19 Genesis
Hurricane Earl 28 Aug–3 Sep 2010 N42(5), N43(6), N49(7) 393 35 RI and mature phase; with NASA GRIP DC-8 and Global Hawk
Hurricane Karl 12–16 Sep 2010 N42(2), N43(2), N49(4) 175 11 Genesis, RI; with NASA GRIP DC-8 and Global Hawk and PREDICT NSF/NCAR Gulfstream-V (G-V)
Hurricane Tomas 3–6 Nov 2010 N42(3), N43(2), N49(1) 81 17 Sheared system
Hurricane Irene 22–27 Aug 2011 N42(4), N43(3), N49(9) 494 25 Life cycle
Hurricane Rina 25–27 Oct 2011 N42(4), N49(2) 129 8 Sheared system
861june 2013AMeRICAn MeTeOROLOGICAL SOCIeTY |
ADDRESSING THE IFEX GOALS. While the primary IFEX activities focus on the collection and analysis of aircraft observations, they by necessity are closely linked with other research and development activities geared toward improving TC intensity fore-casts. Since a significant component of intensity fore-casting is dependent on numerical model guidance, much of the analysis of data collected during IFEX is used to improve numerical models by advancing data assimilation, model development, and model evalu-ation. An additional aspect of improving intensity forecasts is improving the real-time assessment of TC structure, intensity, and environment through enhanced observational capabilities and improved sampling strategies. Finally, an improved under-standing of the physical processes important for TC intensity change is an essential component of any efforts for improving intensity forecasting, as they provide the context for assessing the performance of numerical models and for modifying the model representation of physical processes. An overview of the analyses and advancements resulting from some of these missions is provided below.
IFEX goal 1: Collect observations that span the TC life cycle in a variety of environments for model initialization and evaluation. Prior to IFEX, the only aircraft data that were assimilated into NOAA models were dropwindsondes, and then only those that were outside the core (Aberson 2008). A primary goal of
IFEX is to increase the availability of data in real time that can be assimilated into the NOAA operational models.
ReAl-time DoppleR RADAR AnAlysis AnD tRAnsmission oF DAtA FRom AiRcRAFt. An automated quality-control and analysis package for airborne Doppler data was developed from 2003 to 2005 for the Joint Hurricane Testbed (a report describing this package can be found online at www.nhc.noaa.gov/jht/2003-2005reports /DOPLRgamache_JHTfinalreport.pdf) and has since been continually refined to provide more products and to improve the quality control. The automated package builds upon the software developed before 2003 that removed some of the noisy data and accounted for the motion and attitude of the aircraft. The package removes the reflection of the main lobe from the sea surface and much of the incorrect data obtained in the reflection of the sidelobes. It removes all data it considers to be noise. It uses the context of a coarse wind field to more accurately dealias the radial velocities that are then used in wind analyses, and in radial velocity "superobs" which are essentially data averaged for use in real-time data assimilation (Zhang et al. 2009). Superobs are used because the radar spatial resolution is greater than the model resolution, which can result in large amounts of potentially correlated data. The Doppler radial wind data are thus subsampled at 3-km resolution by this "superobbing" procedure. If the context still places an observation outside a range of estimated velocities provided by the initial coarse analysis, the observa-tion is eliminated. Since the package was designed to reduce the time required for quality control for a single storm penetration from weeks to less than one hour, it could be employed in real time. The first real-time transmission of analyses to NHC occurred in Hurricane Katrina (2005), while the first real-time transmission and use of superobs in data assimilation was in Tropical Storm Fay (2008; F. Zhang et al. 2011; cf. Table 1). This technique is also very useful for researchers who want to examine numerous cases. It works well enough that it is often used completely in lieu of manual editing of data. For example, a com-parison of error statistics of tangential, radial, and vertical wind from Hurricane Guillermo (1997) was performed for analyses using manual and automatic editing compared with flight-level statistics (Rogers et al. 2012). It was found that the automated editing produced analyses of comparable quality to the manual editing. The automated package will permit the entire large archive of airborne Doppler data collected in tropical cyclones to be analyzed and
Table 2. Percentage of on-station aircraft flight hours flown stratified by TC intensity, based on the North Atlantic Hurricane Best Track Data-base (HURDAT) value during the time of the mission. Shown are the distribution for pre-IFEX years (i.e., 1956–2004; 8,020 total hours flown) and IFEX years (i.e., 2005–11; 2,526 total hours flown). “Pre-TD non-dev” denotes systems prior to being declared a tropical depression that did not develop into a tropical depression, “pre-TD dev” denotes systems prior to being declared a tropical depression that did develop into a tropical depression, and the categories denote hurricanes of Saffir–Simpson categories.
Pre-IFEX IFEX
Pre-TD non-dev 3.1 2.0
Pre-TD dev 1.2 7.9
TD 7.2 5.5
TS 26.8 37.1
Categories 1–2 31.6 24.8
Categories 3–5 30.0 22.7
862 june 2013|
examined without enormous labor costs, a process already underway at HRD and elsewhere (e.g., Rogers et al. 2012, 2013; Reasor et al. 2013).
DAtA AssimilAtion DeVelopment. To assimilate hur-ricane inner-core observations for high-resolution vortex init ia lization, the Hurricane Weather Research and Forecasting (HWRF) Hurricane Ensemble Data Assimilation System (HEDAS; Aksoy et al. 2012) has been developed. HEDAS is an advanced ensemble-based data assimilation system based on a serial implementation of the square-root filter of Whitaker and Hamill (2002). It is interfaced with a high-resolution version of the HWRF model (60° × 60° outer nest with 9-km grid spacing; 10° × 10° inner nest with 3-km grid spacing). The types of observations assimilated in HEDAS include Doppler radial wind superobs (for details, see Aksoy et al. 2012), dropwindsonde (Hock and Franklin 1999) and flight-level wind and temperature, and Stepped Frequency Microwave Radiometer (SFMR; Uhlhorn et al. 2007) 10-m wind speed. This system ran in real time during the 2010 and 2011 hurricane seasons when the NOAA WP-3D aircraft made Doppler radar measurements.
When HEDAS analyses were evaluated in an observing system simulation experiment study (Aksoy et al. 2012), it was found that assimilating hurricane inner-core observations in a high-resolution advanced data assimilation system makes a significant positive impact on the position and intensity in the final vortex analysis compared to when no data assimilation was performed. This work has been broadened to include a substantial retro-spective HEDAS analysis experiment spanning the 2008–11 hurricane seasons for a total of 83 cases in which the NOAA WP-3D tail Doppler radar collected data (Aksoy et al. 2013). The cases had intensities in the range of 20–120 knots (kt; 1 kt = 0.51 m s–1),,
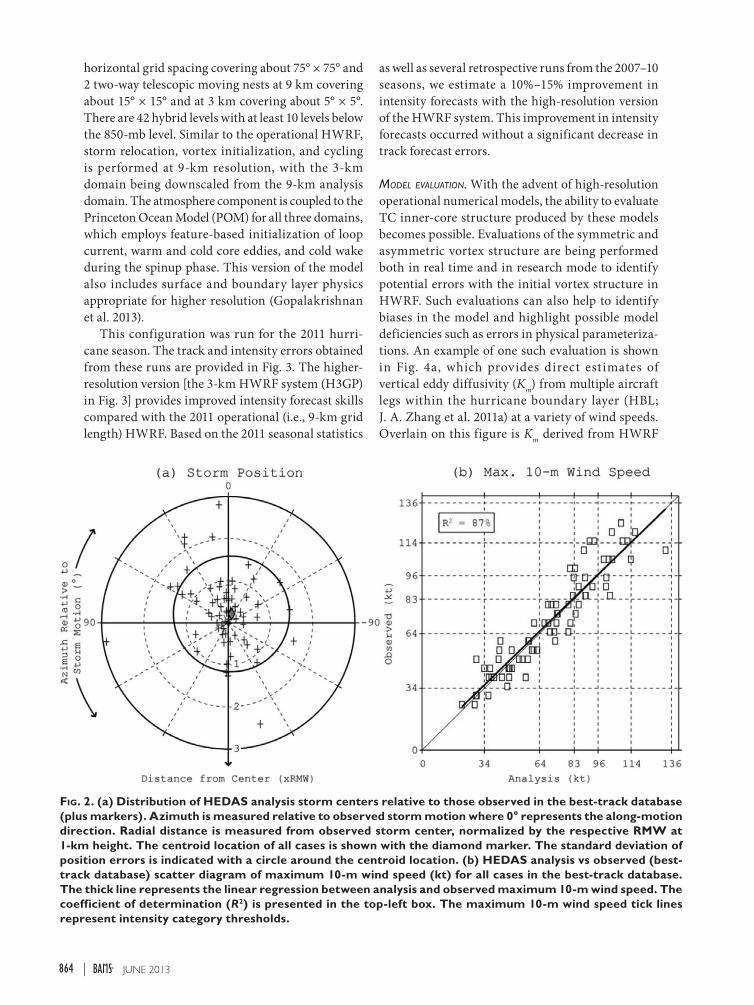
including storms of historical significance such as Hurricane Gustav (2008), Hurricane Ike (2008), Hurricane Earl (2010), and Hurricane Irene (2011). Figure 2a shows the distribution of HEDAS analysis storm centers relative to the observed. It is evident that in most cases the storm position as analyzed by HEDAS is within one radius of maximum azimuth-ally averaged tangential wind speed (RMW). In addi-tion, HEDAS appears to also produce tropical cyclone vortex analyses of realistic intensity as measured by the maximum 10-m wind speed (Fig. 2b). The linear regression between HEDAS-analyzed and observed intensity explains about 87% of the total variance in observed intensity and almost perfectly predicts observed intensity (at 95% confidence level, the linear regression line is statistically not distinguishable from the 1:1 line that represents perfect analyses).
numeRicAl moDel DeVelopment AnD eVAluAtion. HWRFV3.2 deVelopment. The HWRF system was developed at NOAA/National Weather Service (NWS) and became an operational track and intensity guidance tool in 2007 (Gopalakrishnan et al. 2011b). An experimental version of the HWRF system (dubbed HWRFX) was specifically developed at HRD to study the intensity change problem at cloud-permitting scales (about 1–3 km). The HWRFX can be run both in an idealized (Gopalakrishnan et al. 2011a, 2012; Bao et al. 2012) and real-data framework (X. Zhang et al. 2011; Yeh et al. 2012; Pattanayak et al. 2011; Bozeman et al. 2011) and is also linked to HEDAS (Aksoy et al. 2012). The 3-km HWRFX model was recently merged with the operational HWRF, creating HWRFV3.2, which is currently used in NOAA for further advancements of high-resolution intensity forecasts.
A triply nested version of the HWRFV3.2 system has also been developed (X. Zhang et al. 2011). This system is configured with a coarse mesh of 27-km
Table 3. List of data types, meteorological parameters, and formats available from IFEX aircraft missions. WMO = World Meteorological Organization. frd = high-frequency ASCII format. AVAPS = Airborne Vertical Atmospheric Profiling System. HSA = HRD Spline Analysis.
Data type Meteorological parameters Formats
Flight level (1 and 40 Hz) T, q, u, u, w, P Network Common Data Form (netCDF), text
SFMR Surface wind speed, path-integrated rain rate NetCDF
Lower fuselage radar (C band) Reflectivity Binary
Tail Doppler radar (X band) Reflectivity, u, u, w NetCDF, binary
GPS dropsonde T, q, u, u, w, P WMO, frd, AVAPS, HSA
Mission summaries Summary of flights Text, graphics
Video, photographs — —
863june 2013AMeRICAn MeTeOROLOGICAL SOCIeTY |
horizontal grid spacing covering about 75° × 75° and 2 two-way telescopic moving nests at 9 km covering about 15° × 15° and at 3 km covering about 5° × 5°. There are 42 hybrid levels with at least 10 levels below the 850-mb level. Similar to the operational HWRF, storm relocation, vortex initialization, and cycling is performed at 9-km resolution, with the 3-km domain being downscaled from the 9-km analysis domain. The atmosphere component is coupled to the Princeton Ocean Model (POM) for all three domains, which employs feature-based initialization of loop current, warm and cold core eddies, and cold wake during the spinup phase. This version of the model also includes surface and boundary layer physics appropriate for higher resolution (Gopalakrishnan et al. 2013).
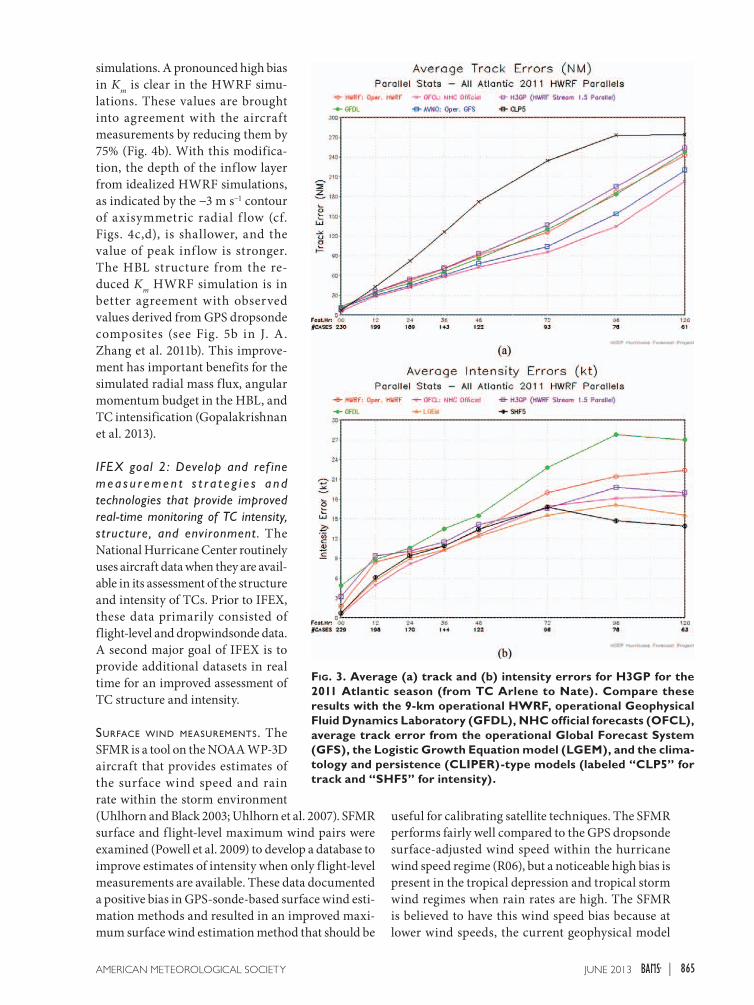
This configuration was run for the 2011 hurri-cane season. The track and intensity errors obtained from these runs are provided in Fig. 3. The higher-resolution version [the 3-km HWRF system (H3GP) in Fig. 3] provides improved intensity forecast skills compared with the 2011 operational (i.e., 9-km grid length) HWRF. Based on the 2011 seasonal statistics
as well as several retrospective runs from the 2007–10 seasons, we estimate a 10%–15% improvement in intensity forecasts with the high-resolution version of the HWRF system. This improvement in intensity forecasts occurred without a significant decrease in track forecast errors.
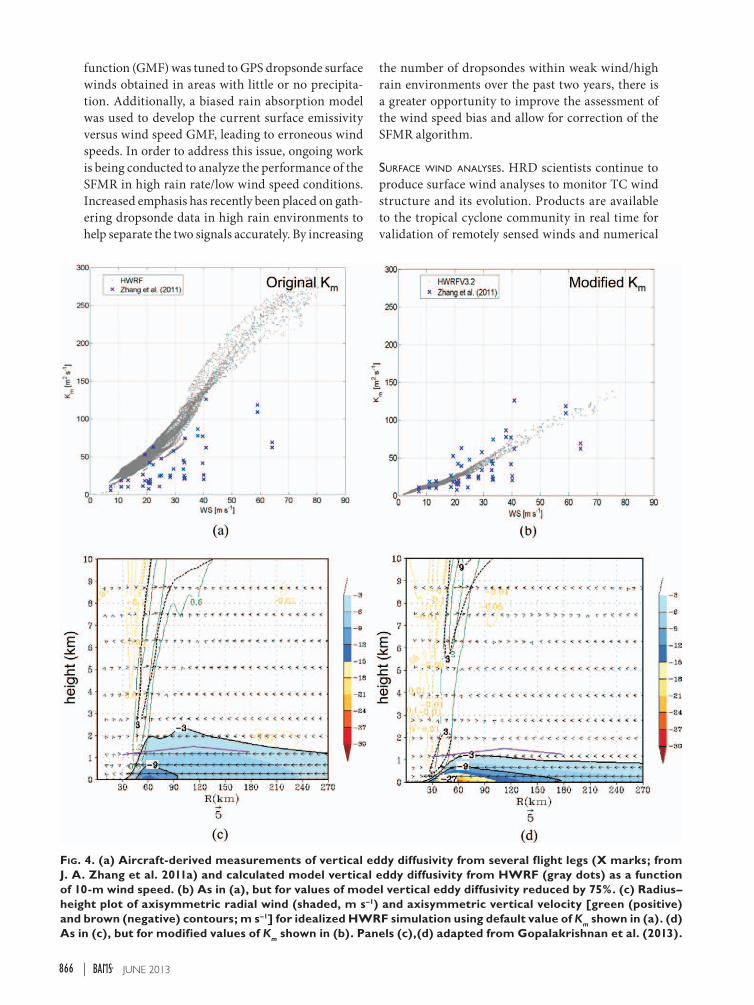
model eValuation. With the advent of high-resolution operational numerical models, the ability to evaluate TC inner-core structure produced by these models becomes possible. Evaluations of the symmetric and asymmetric vortex structure are being performed both in real time and in research mode to identify potential errors with the initial vortex structure in HWRF. Such evaluations can also help to identify biases in the model and highlight possible model deficiencies such as errors in physical parameteriza-tions. An example of one such evaluation is shown in Fig. 4a, which provides direct estimates of vertical eddy diffusivity (Km) from multiple aircraft legs within the hurricane boundary layer (HBL; J. A. Zhang et al. 2011a) at a variety of wind speeds. Overlain on this figure is Km derived from HWRF
Fig. 2. (a) Distribution of HEDAS analysis storm centers relative to those observed in the best-track database (plus markers). Azimuth is measured relative to observed storm motion where 0° represents the along-motion direction. Radial distance is measured from observed storm center, normalized by the respective RMW at 1-km height. The centroid location of all cases is shown with the diamond marker. The standard deviation of position errors is indicated with a circle around the centroid location. (b) HEDAS analysis vs observed (best-track database) scatter diagram of maximum 10-m wind speed (kt) for all cases in the best-track database. The thick line represents the linear regression between analysis and observed maximum 10-m wind speed. The coefficient of determination (R2) is presented in the top-left box. The maximum 10-m wind speed tick lines represent intensity category thresholds.
864 june 2013|
simulations. A pronounced high bias in Km is clear in the HWRF simu-lations. These values are brought into agreement with the aircraft measurements by reducing them by 75% (Fig. 4b). With this modifica-tion, the depth of the inflow layer from idealized HWRF simulations, as indicated by the −3 m s−1 contour of axisymmetric radial f low (cf. Figs. 4c,d), is shallower, and the value of peak inf low is stronger. The HBL structure from the re-duced Km HWRF simulation is in better agreement with observed values derived from GPS dropsonde composites (see Fig. 5b in J. A. Zhang et al. 2011b). This improve-ment has important benefits for the simulated radial mass flux, angular momentum budget in the HBL, and TC intensification (Gopalakrishnan et al. 2013).
IFEX goal 2: Develop and ref ine mea s u r e men t s t r a t e g i e s a nd technologies that provide improved real-time monitoring of TC intensity, structure, and environment . The National Hurricane Center routinely uses aircraft data when they are avail-able in its assessment of the structure and intensity of TCs. Prior to IFEX, these data primarily consisted of flight-level and dropwindsonde data. A second major goal of IFEX is to provide additional datasets in real time for an improved assessment of TC structure and intensity.
suRFAce winD meAsuRements. The SFMR is a tool on the NOAA WP-3D aircraft that provides estimates of the surface wind speed and rain rate within the storm environment (Uhlhorn and Black 2003; Uhlhorn et al. 2007). SFMR surface and flight-level maximum wind pairs were examined (Powell et al. 2009) to develop a database to improve estimates of intensity when only flight-level measurements are available. These data documented a positive bias in GPS-sonde-based surface wind esti-mation methods and resulted in an improved maxi-mum surface wind estimation method that should be
useful for calibrating satellite techniques. The SFMR performs fairly well compared to the GPS dropsonde surface-adjusted wind speed within the hurricane wind speed regime (R06), but a noticeable high bias is present in the tropical depression and tropical storm wind regimes when rain rates are high. The SFMR is believed to have this wind speed bias because at lower wind speeds, the current geophysical model
Fig. 3. Average (a) track and (b) intensity errors for H3GP for the 2011 Atlantic season (from TC Arlene to Nate). Compare these results with the 9-km operational HWRF, operational Geophysical Fluid Dynamics Laboratory (GFDL), NHC official forecasts (OFCL), average track error from the operational Global Forecast System (GFS), the Logistic Growth Equation model (LGEM), and the clima-tology and persistence (CLIPER)-type models (labeled “CLP5” for track and “SHF5” for intensity).
865june 2013AMeRICAn MeTeOROLOGICAL SOCIeTY |
function (GMF) was tuned to GPS dropsonde surface winds obtained in areas with little or no precipita-tion. Additionally, a biased rain absorption model was used to develop the current surface emissivity versus wind speed GMF, leading to erroneous wind speeds. In order to address this issue, ongoing work is being conducted to analyze the performance of the SFMR in high rain rate/low wind speed conditions. Increased emphasis has recently been placed on gath-ering dropsonde data in high rain environments to help separate the two signals accurately. By increasing
the number of dropsondes within weak wind/high rain environments over the past two years, there is a greater opportunity to improve the assessment of the wind speed bias and allow for correction of the SFMR algorithm.
suRFAce winD AnAlyses. HRD scientists continue to produce surface wind analyses to monitor TC wind structure and its evolution. Products are available to the tropical cyclone community in real time for validation of remotely sensed winds and numerical
Fig. 4. (a) Aircraft-derived measurements of vertical eddy diffusivity from several flight legs (X marks; from J. A. Zhang et al. 2011a) and calculated model vertical eddy diffusivity from HWRF (gray dots) as a function of 10-m wind speed. (b) As in (a), but for values of model vertical eddy diffusivity reduced by 75%. (c) Radius–height plot of axisymmetric radial wind (shaded, m s–1) and axisymmetric vertical velocity [green (positive) and brown (negative) contours; m s–1] for idealized HWRF simulation using default value of Km shown in (a). (d) As in (c), but for modified values of Km shown in (b). Panels (c),(d) adapted from Gopalakrishnan et al. (2013).
866 june 2013|
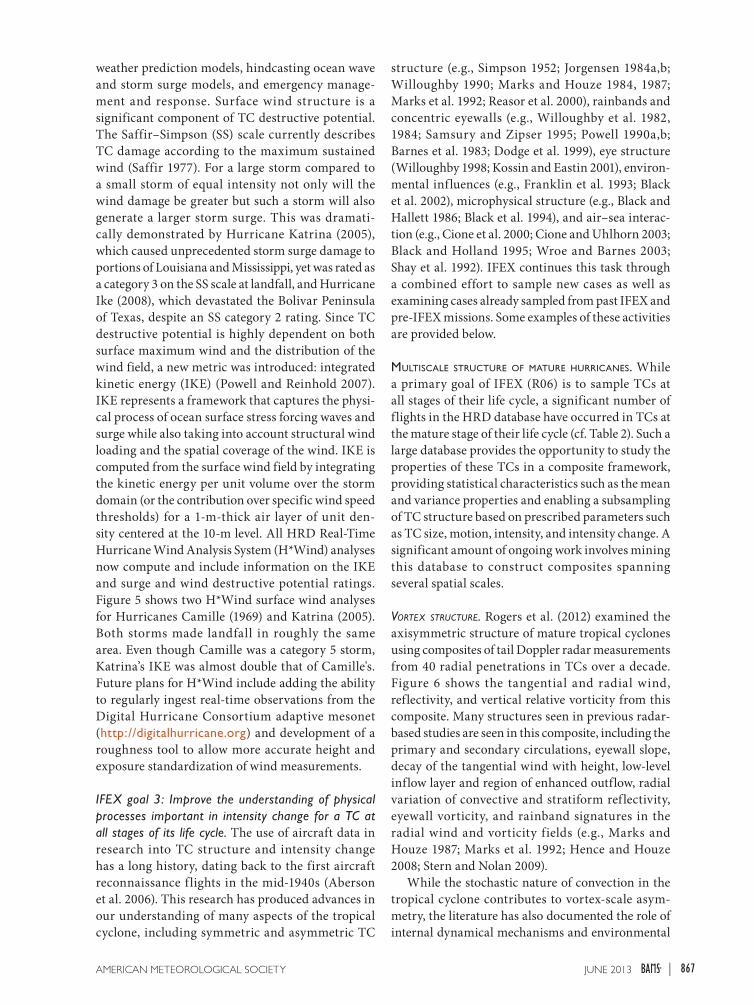
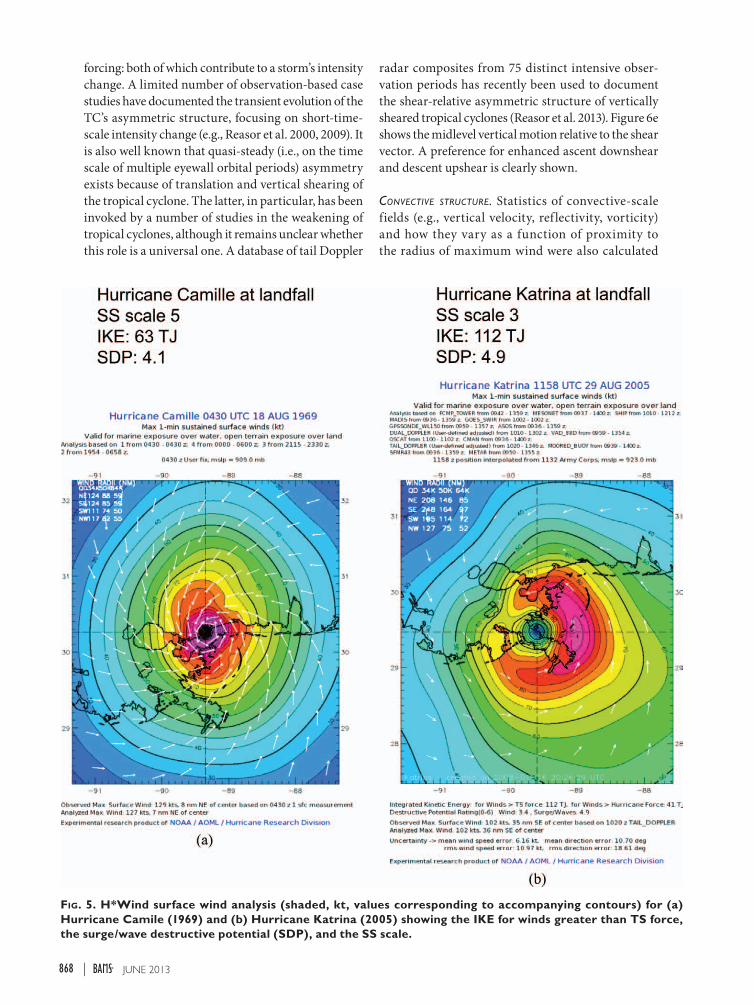
weather prediction models, hindcasting ocean wave and storm surge models, and emergency manage-ment and response. Surface wind structure is a significant component of TC destructive potential. The Saffir–Simpson (SS) scale currently describes TC damage according to the maximum sustained wind (Saffir 1977). For a large storm compared to a small storm of equal intensity not only will the wind damage be greater but such a storm will also generate a larger storm surge. This was dramati-cally demonstrated by Hurricane Katrina (2005), which caused unprecedented storm surge damage to portions of Louisiana and Mississippi, yet was rated as a category 3 on the SS scale at landfall, and Hurricane Ike (2008), which devastated the Bolivar Peninsula of Texas, despite an SS category 2 rating. Since TC destructive potential is highly dependent on both surface maximum wind and the distribution of the wind field, a new metric was introduced: integrated kinetic energy (IKE) (Powell and Reinhold 2007). IKE represents a framework that captures the physi-cal process of ocean surface stress forcing waves and surge while also taking into account structural wind loading and the spatial coverage of the wind. IKE is computed from the surface wind field by integrating the kinetic energy per unit volume over the storm domain (or the contribution over specific wind speed thresholds) for a 1-m-thick air layer of unit den-sity centered at the 10-m level. All HRD Real-Time Hurricane Wind Analysis System (H*Wind) analyses now compute and include information on the IKE and surge and wind destructive potential ratings. Figure 5 shows two H*Wind surface wind analyses for Hurricanes Camille (1969) and Katrina (2005). Both storms made landfall in roughly the same area. Even though Camille was a category 5 storm, Katrina’s IKE was almost double that of Camille's. Future plans for H*Wind include adding the ability to regularly ingest real-time observations from the Digital Hurricane Consortium adaptive mesonet (http://digitalhurricane.org) and development of a roughness tool to allow more accurate height and exposure standardization of wind measurements.
IFEX goal 3: Improve the understanding of physical processes important in intensity change for a TC at all stages of its life cycle. The use of aircraft data in research into TC structure and intensity change has a long history, dating back to the first aircraft reconnaissance f lights in the mid-1940s (Aberson et al. 2006). This research has produced advances in our understanding of many aspects of the tropical cyclone, including symmetric and asymmetric TC
structure (e.g., Simpson 1952; Jorgensen 1984a,b; Willoughby 1990; Marks and Houze 1984, 1987; Marks et al. 1992; Reasor et al. 2000), rainbands and concentric eyewalls (e.g., Willoughby et al. 1982, 1984; Samsury and Zipser 1995; Powell 1990a,b; Barnes et al. 1983; Dodge et al. 1999), eye structure (Willoughby 1998; Kossin and Eastin 2001), environ-mental influences (e.g., Franklin et al. 1993; Black et al. 2002), microphysical structure (e.g., Black and Hallett 1986; Black et al. 1994), and air–sea interac-tion (e.g., Cione et al. 2000; Cione and Uhlhorn 2003; Black and Holland 1995; Wroe and Barnes 2003; Shay et al. 1992). IFEX continues this task through a combined effort to sample new cases as well as examining cases already sampled from past IFEX and pre-IFEX missions. Some examples of these activities are provided below.
multiscAle stRuctuRe oF mAtuRe huRRicAnes. While a primary goal of IFEX (R06) is to sample TCs at all stages of their life cycle, a significant number of flights in the HRD database have occurred in TCs at the mature stage of their life cycle (cf. Table 2). Such a large database provides the opportunity to study the properties of these TCs in a composite framework, providing statistical characteristics such as the mean and variance properties and enabling a subsampling of TC structure based on prescribed parameters such as TC size, motion, intensity, and intensity change. A significant amount of ongoing work involves mining this database to construct composites spanning several spatial scales.
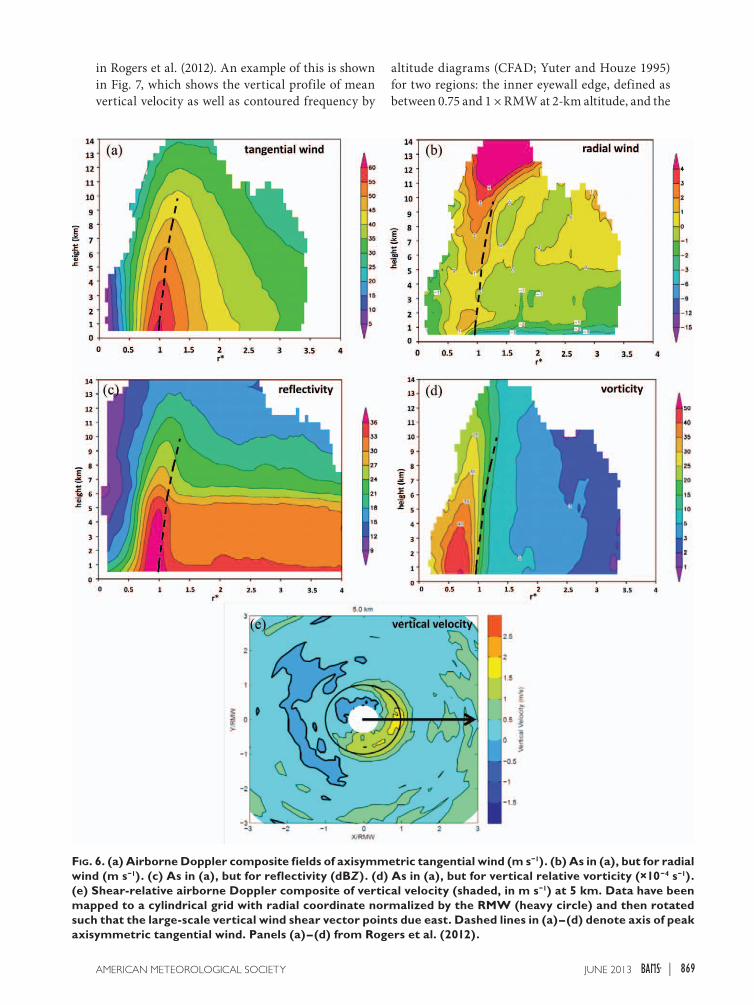
VoRtex stRuctuRe. Rogers et al. (2012) examined the axisymmetric structure of mature tropical cyclones using composites of tail Doppler radar measurements from 40 radial penetrations in TCs over a decade. Figure 6 shows the tangential and radial wind, reflectivity, and vertical relative vorticity from this composite. Many structures seen in previous radar-based studies are seen in this composite, including the primary and secondary circulations, eyewall slope, decay of the tangential wind with height, low-level inflow layer and region of enhanced outflow, radial variation of convective and stratiform reflectivity, eyewall vorticity, and rainband signatures in the radial wind and vorticity fields (e.g., Marks and Houze 1987; Marks et al. 1992; Hence and Houze 2008; Stern and Nolan 2009).
While the stochastic nature of convection in the tropical cyclone contributes to vortex-scale asym-metry, the literature has also documented the role of internal dynamical mechanisms and environmental
867june 2013AMeRICAn MeTeOROLOGICAL SOCIeTY |
forcing: both of which contribute to a storm’s intensity change. A limited number of observation-based case studies have documented the transient evolution of the TC’s asymmetric structure, focusing on short-time-scale intensity change (e.g., Reasor et al. 2000, 2009). It is also well known that quasi-steady (i.e., on the time scale of multiple eyewall orbital periods) asymmetry exists because of translation and vertical shearing of the tropical cyclone. The latter, in particular, has been invoked by a number of studies in the weakening of tropical cyclones, although it remains unclear whether this role is a universal one. A database of tail Doppler
radar composites from 75 distinct intensive obser-vation periods has recently been used to document the shear-relative asymmetric structure of vertically sheared tropical cyclones (Reasor et al. 2013). Figure 6e shows the midlevel vertical motion relative to the shear vector. A preference for enhanced ascent downshear and descent upshear is clearly shown.
conVectiVe stRuctuRe. Statistics of convective-scale fields (e.g., vertical velocity, ref lectivity, vorticity) and how they vary as a function of proximity to the radius of maximum wind were also calculated
Fig. 5. H*Wind surface wind analysis (shaded, kt, values corresponding to accompanying contours) for (a) Hurricane Camile (1969) and (b) Hurricane Katrina (2005) showing the IKE for winds greater than TS force, the surge/wave destructive potential (SDP), and the SS scale.
868 june 2013|
in Rogers et al. (2012). An example of this is shown in Fig. 7, which shows the vertical profile of mean vertical velocity as well as contoured frequency by
altitude diagrams (CFAD; Yuter and Houze 1995) for two regions: the inner eyewall edge, defined as between 0.75 and 1 × RMW at 2-km altitude, and the
Fig. 6. (a) Airborne Doppler composite fields of axisymmetric tangential wind (m s−1). (b) As in (a), but for radial wind (m s−1). (c) As in (a), but for reflectivity (dBZ). (d) As in (a), but for vertical relative vorticity (×10−4 s−1). (e) Shear-relative airborne Doppler composite of vertical velocity (shaded, in m s−1) at 5 km. Data have been mapped to a cylindrical grid with radial coordinate normalized by the RMW (heavy circle) and then rotated such that the large-scale vertical wind shear vector points due east. Dashed lines in (a)–(d) denote axis of peak axisymmetric tangential wind. Panels (a)–(d) from Rogers et al. (2012).
869june 2013AMeRICAn MeTeOROLOGICAL SOCIeTY |
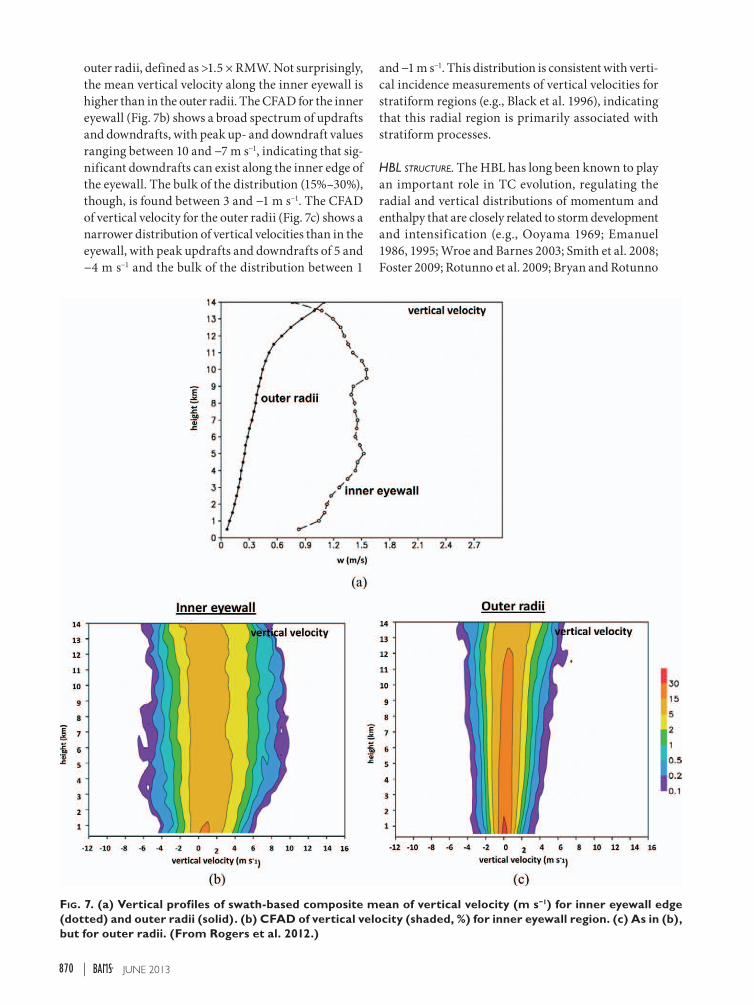
outer radii, defined as >1.5 × RMW. Not surprisingly, the mean vertical velocity along the inner eyewall is higher than in the outer radii. The CFAD for the inner eyewall (Fig. 7b) shows a broad spectrum of updrafts and downdrafts, with peak up- and downdraft values ranging between 10 and −7 m s−1, indicating that sig-nificant downdrafts can exist along the inner edge of the eyewall. The bulk of the distribution (15%–30%), though, is found between 3 and −1 m s−1. The CFAD of vertical velocity for the outer radii (Fig. 7c) shows a narrower distribution of vertical velocities than in the eyewall, with peak updrafts and downdrafts of 5 and −4 m s−1 and the bulk of the distribution between 1
and −1 m s−1. This distribution is consistent with verti-cal incidence measurements of vertical velocities for stratiform regions (e.g., Black et al. 1996), indicating that this radial region is primarily associated with stratiform processes.
HBl stRuctuRe. The HBL has long been known to play an important role in TC evolution, regulating the radial and vertical distributions of momentum and enthalpy that are closely related to storm development and intensification (e.g., Ooyama 1969; Emanuel 1986, 1995; Wroe and Barnes 2003; Smith et al. 2008; Foster 2009; Rotunno et al. 2009; Bryan and Rotunno
Fig. 7. (a) Vertical profiles of swath-based composite mean of vertical velocity (m s−1) for inner eyewall edge (dotted) and outer radii (solid). (b) CFAD of vertical velocity (shaded, %) for inner eyewall region. (c) As in (b), but for outer radii. (From Rogers et al. 2012.)
870 june 2013|
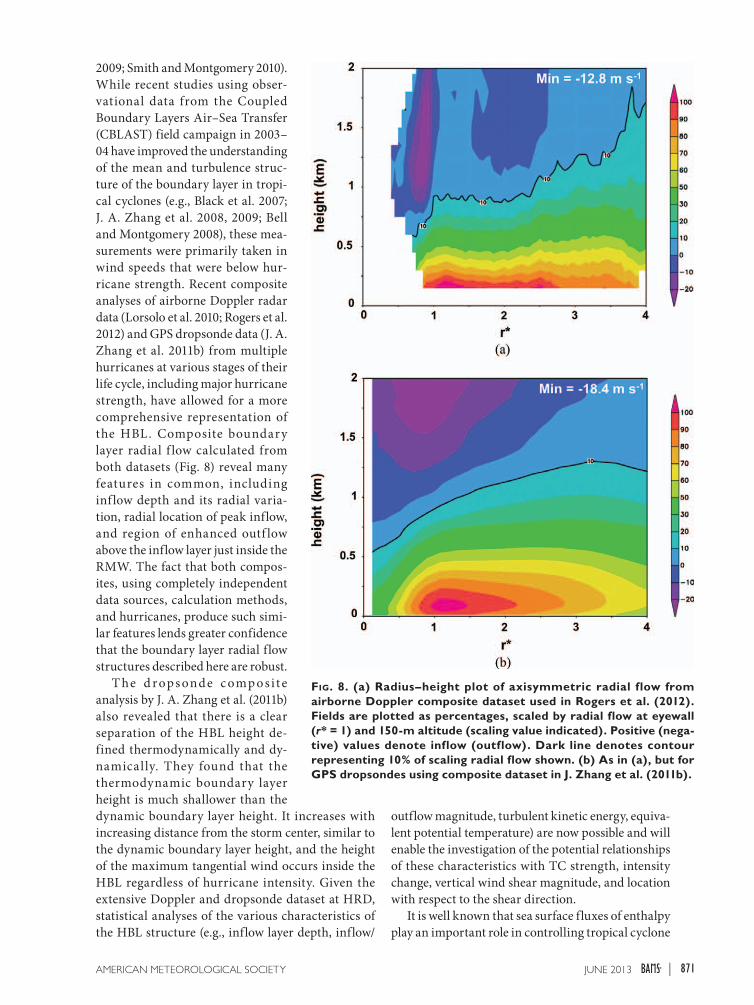
2009; Smith and Montgomery 2010). While recent studies using obser-vational data from the Coupled Boundary Layers Air–Sea Transfer (CBLAST) field campaign in 2003–04 have improved the understanding of the mean and turbulence struc-ture of the boundary layer in tropi-cal cyclones (e.g., Black et al. 2007; J. A. Zhang et al. 2008, 2009; Bell and Montgomery 2008), these mea-surements were primarily taken in wind speeds that were below hur-ricane strength. Recent composite analyses of airborne Doppler radar data (Lorsolo et al. 2010; Rogers et al. 2012) and GPS dropsonde data (J. A. Zhang et al. 2011b) from multiple hurricanes at various stages of their life cycle, including major hurricane strength, have allowed for a more comprehensive representation of the HBL. Composite boundary layer radial f low calculated from both datasets (Fig. 8) reveal many features in common, including inf low depth and its radial varia-tion, radial location of peak inflow, and region of enhanced outf low above the inflow layer just inside the RMW. The fact that both compos-ites, using completely independent data sources, calculation methods, and hurricanes, produce such simi-lar features lends greater confidence that the boundary layer radial flow structures described here are robust.
T he d rops onde c omp osi te analysis by J. A. Zhang et al. (2011b) also revealed that there is a clear separation of the HBL height de-fined thermodynamically and dy-namically. They found that the thermodynamic boundary layer height is much shallower than the dynamic boundary layer height. It increases with increasing distance from the storm center, similar to the dynamic boundary layer height, and the height of the maximum tangential wind occurs inside the HBL regardless of hurricane intensity. Given the extensive Doppler and dropsonde dataset at HRD, statistical analyses of the various characteristics of the HBL structure (e.g., inflow layer depth, inflow/
outflow magnitude, turbulent kinetic energy, equiva-lent potential temperature) are now possible and will enable the investigation of the potential relationships of these characteristics with TC strength, intensity change, vertical wind shear magnitude, and location with respect to the shear direction.
It is well known that sea surface fluxes of enthalpy play an important role in controlling tropical cyclone
Fig. 8. (a) Radius–height plot of axisymmetric radial flow from airborne Doppler composite dataset used in Rogers et al. (2012). Fields are plotted as percentages, scaled by radial flow at eyewall (r* = 1) and 150-m altitude (scaling value indicated). Positive (nega-tive) values denote inflow (outflow). Dark line denotes contour representing 10% of scaling radial flow shown. (b) As in (a), but for GPS dropsondes using composite dataset in J. Zhang et al. (2011b).
871june 2013AMeRICAn MeTeOROLOGICAL SOCIeTY |
intensity. The push to better estimate surface fluxes through accurate sea surface temperature (SST) specification and improved bulk exchange coef-ficient formulas, however, has left the near-surface atmosphere largely ignored. This focus on the ocean structure presents an incomplete picture of enthalpy fluxes, as recent analyses from buoys in the TC inner core and environment over many cases show that air temperature and moisture typically vary a good deal more than does the SST. Using an extensive database of buoy observations collected during hurricane conditions (first described in Cione et al. 2000), composite mean and asymmetric structure of 10-m surface air temperature (T10) and moisture (q10) were analyzed (Cione 2012; Cione et al. 2013). In addition, corresponding fields of ΔT (SST – T10) and Δq (qSST – q10) were constructed (Fig. 9). These fields highlight the relative impact near-surface atmospheric (T10; q10) and oceanic (SST; qSST) variables have on the two primary thermodynamic controls influencing surface fluxes of heat (ΔT) and moisture (Δq). The explained variance between q10 and Δq and T10 and ΔT ranges between 48% and 67%, respectively (not shown). In comparison, SST [and q(SST)] is much more weakly correlated with ΔT (4%) and Δq (33%) (not shown). These results show that the assessment of SST conditions alone (or the use of ocean-only diagnostics) is inadequate. In order to accurately assess thermodynamic conditions that control surface fluxes in hurricanes the highly variable, yet critically important atmospheric thermodynamic environment must be adequately and routinely sampled.
tuRBulence pRopeRties. Despite the recognition of the importance of adequately understanding turbulent transport processes in the HBL, there have been few direct measurements of turbulence in the boundary layer of hurricanes or tropical storms until recently. The fast-response (40 Hz) flight-level data collected by NOAA’s WP-3D aircraft in the hurricane boundary layer (60–400 m above the sea surface) during HRD’s annual field program in the 2002–04 hurricane seasons provide a unique opportunity for studying turbulence in the hurricane boundary layer. J. A. Zhang et al. (2009) showed the vertical structure of directly measured turbulent fluxes in the boundary layer of intense hurricanes. They also calculated the turbulent kinetic energy (TKE) budget and found that the major source, the shear production, is dissipated locally with the buoyancy and turbulent transport terms being relatively unimportant. Analyzing the turbulence data below 200 m, Zhang (2010) com-pared a theoretical method for estimating dissipative
heating commonly used in numerical models (e.g., Bister and Emanuel 1998; Zhang and Altshuler 1999; Wang 2001; Jin et al. 2007; Bryan and Rotunno 2009) with a direct integration of the dissipation rate from the turbulence data. J. A. Zhang (2010) found that this theoretical method significantly overestimates the magnitude of dissipative heating, suggesting that it is essential to understand the physical pro-cesses associated with dissipative heating when implementing it into hurricane models.
In numerical models, turbulent flux in the atmo-spheric boundary layer is generally parameterized through eddy diffusivity. Theoretical and numerical studies have shown that both vertical and horizontal eddy diffusivities are important for hurricane intensity and structure simulations (e.g., Foster 2009; Bryan and Rotunno 2009). However, observational estimates of eddy diffusivity are scarce, especially for high wind conditions (>15 m s−1). The NOAA WP-3D data again provided a unique tool for estimating eddy diffusivity. Using data from the periods of eyewall penetrations in the intense Hurricanes Hugo (1989) and Allen (1980), J. A. Zhang et al. (2011a) made the first estimate of vertical momentum f lux and the corresponding vertical eddy diffusivity in the inf low layer in intense hurricanes. These authors found that the vertical eddy diffusivity is on the order of 100 m2 s−1 at ~500 m in the intense eyewall with flight-level mean wind speed up to 65 m s−1. They also found that the vertical eddy diffusivity increases with increasing wind speed at a similar altitude. Zhang and Montgomery (2012) estimated the horizontal eddy diffusivity and mixing length by analyzing the data from Hurricane David (1979) in addition to the Allen and Hugo data. They found that the magnitude of horizontal momentum flux is comparable to that of the vertical momentum flux, indicating that hori-zontal mixing of turbulence becomes nonnegligible in the hurricane boundary layer, especially in the eyewall region. These results have been used to guide refinements to the planetary boundary layer param-eterization used in the HWRF model (see "Numerical model development and evaluation" section).
In addition to turbulence properties derived from flight-level data, the tail Doppler radar has been used to obtain information about the distribution of TKE in mature TCs (Lorsolo et al. 2010). The analysis is based on the fact that the Doppler measurement can be expressed as the sum of the mean radial velocity over a grid cell and a turbulent part. The TKE is represented by the variance of measurements of ~150-m spatial resolution about the mean Doppler radial velocity of a 10 km (across flight track) × 1.5 km (along flight
872 june 2013|
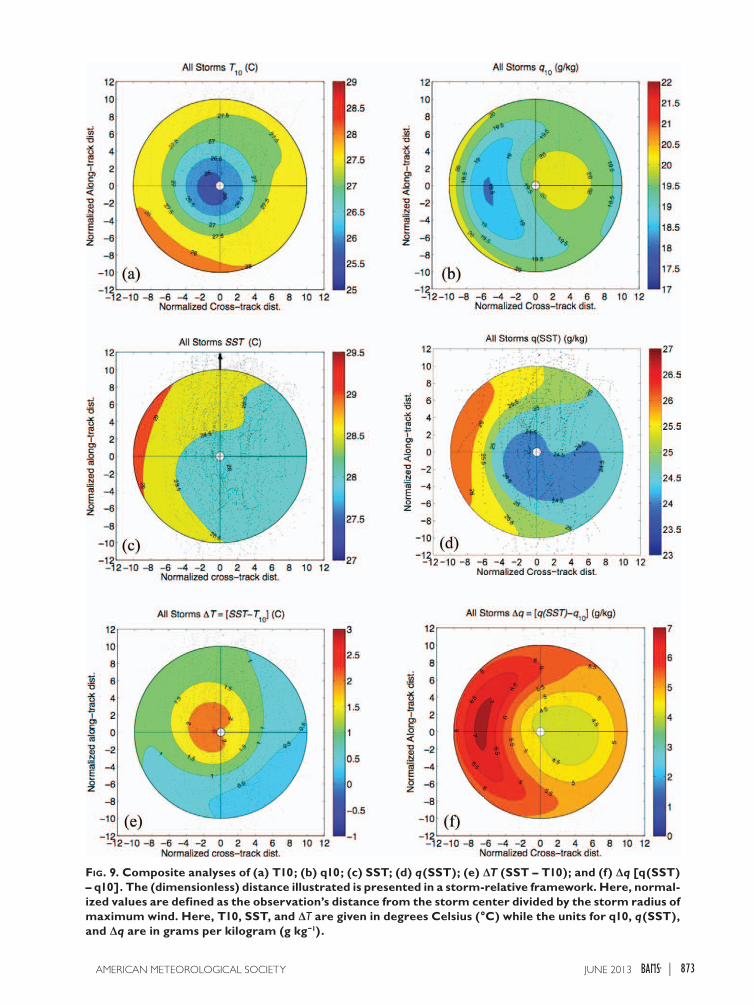
Fig. 9. Composite analyses of (a) T10; (b) q10; (c) SST; (d) q(SST); (e) ΔT (SST – T10); and (f) Δq [q(SST) – q10]. The (dimensionless) distance illustrated is presented in a storm-relative framework. Here, normal-ized values are defined as the observation’s distance from the storm center divided by the storm radius of maximum wind. Here, T10, SST, and ΔT are given in degrees Celsius (°C) while the units for q10, q(SST), and Δq are in grams per kilogram (g kg−1).
873june 2013AMeRICAn MeTeOROLOGICAL SOCIeTY |
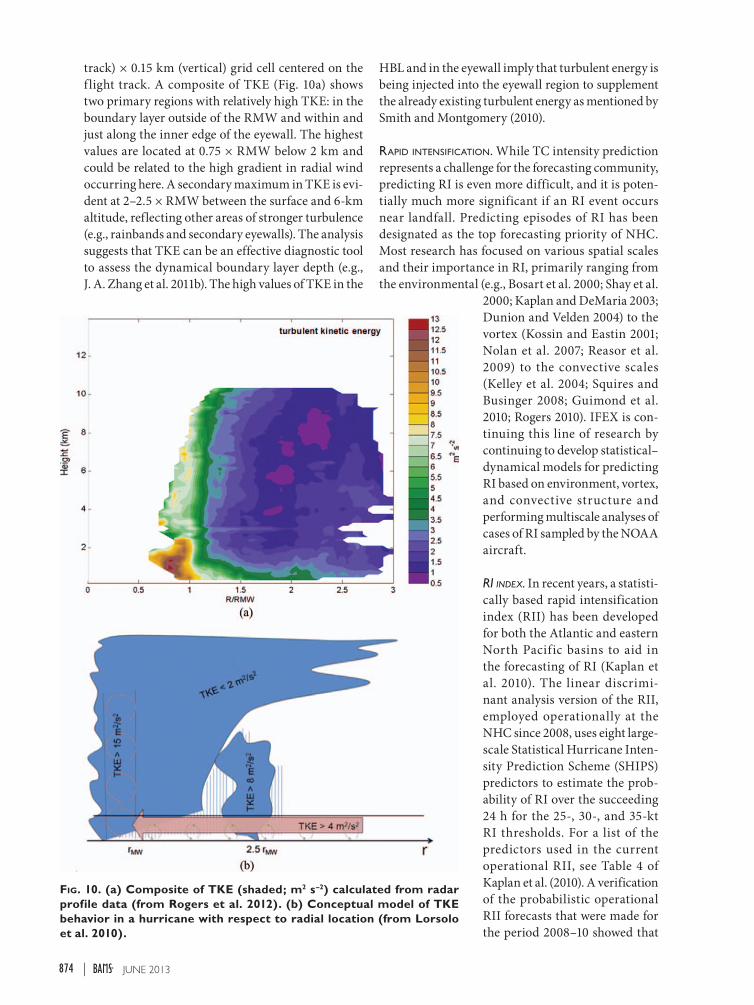
track) × 0.15 km (vertical) grid cell centered on the f light track. A composite of TKE (Fig. 10a) shows two primary regions with relatively high TKE: in the boundary layer outside of the RMW and within and just along the inner edge of the eyewall. The highest values are located at 0.75 × RMW below 2 km and could be related to the high gradient in radial wind occurring here. A secondary maximum in TKE is evi-dent at 2–2.5 × RMW between the surface and 6-km altitude, reflecting other areas of stronger turbulence (e.g., rainbands and secondary eyewalls). The analysis suggests that TKE can be an effective diagnostic tool to assess the dynamical boundary layer depth (e.g., J. A. Zhang et al. 2011b). The high values of TKE in the
HBL and in the eyewall imply that turbulent energy is being injected into the eyewall region to supplement the already existing turbulent energy as mentioned by Smith and Montgomery (2010).
RApiD intensiFicAtion. While TC intensity prediction represents a challenge for the forecasting community, predicting RI is even more difficult, and it is poten-tially much more significant if an RI event occurs near landfall. Predicting episodes of RI has been designated as the top forecasting priority of NHC. Most research has focused on various spatial scales and their importance in RI, primarily ranging from the environmental (e.g., Bosart et al. 2000; Shay et al.
2000; Kaplan and DeMaria 2003; Dunion and Velden 2004) to the vortex (Kossin and Eastin 2001; Nolan et al. 2007; Reasor et al. 2009) to the convective scales (Kelley et al. 2004; Squires and Businger 2008; Guimond et al. 2010; Rogers 2010). IFEX is con-tinuing this line of research by continuing to develop statistical–dynamical models for predicting RI based on environment, vortex, and convective structure and performing multiscale analyses of cases of RI sampled by the NOAA aircraft.
Ri index. In recent years, a statisti-cally based rapid intensification index (RII) has been developed for both the Atlantic and eastern North Pacific basins to aid in the forecasting of RI (Kaplan et al. 2010). The linear discrimi-nant analysis version of the RII, employed operationally at the NHC since 2008, uses eight large-scale Statistical Hurricane Inten-sity Prediction Scheme (SHIPS) predictors to estimate the prob-ability of RI over the succeeding 24 h for the 25-, 30-, and 35-kt RI thresholds. For a list of the predictors used in the current operational RII, see Table 4 of Kaplan et al. (2010). A verification of the probabilistic operational RII forecasts that were made for the period 2008–10 showed that
Fig. 10. (a) Composite of TKE (shaded; m2 s–2) calculated from radar profile data (from Rogers et al. 2012). (b) Conceptual model of TKE behavior in a hurricane with respect to radial location (from Lorsolo et al. 2010).
874 june 2013|
these forecasts were generally skillful for this 3-yr period in both basins when assessed relative to clima-tology, with skill as large as 13% for the eastern North Pacific. Recent results obtained by Kaplan et al. (2011) have shown that it is possible to achieve additional skill improvements of up to 8% in the Atlantic and 5% in the eastern North Pacific basin by replacing several existing operational RI predictors with new predictors derived using information obtained from the region surrounding the inner core.
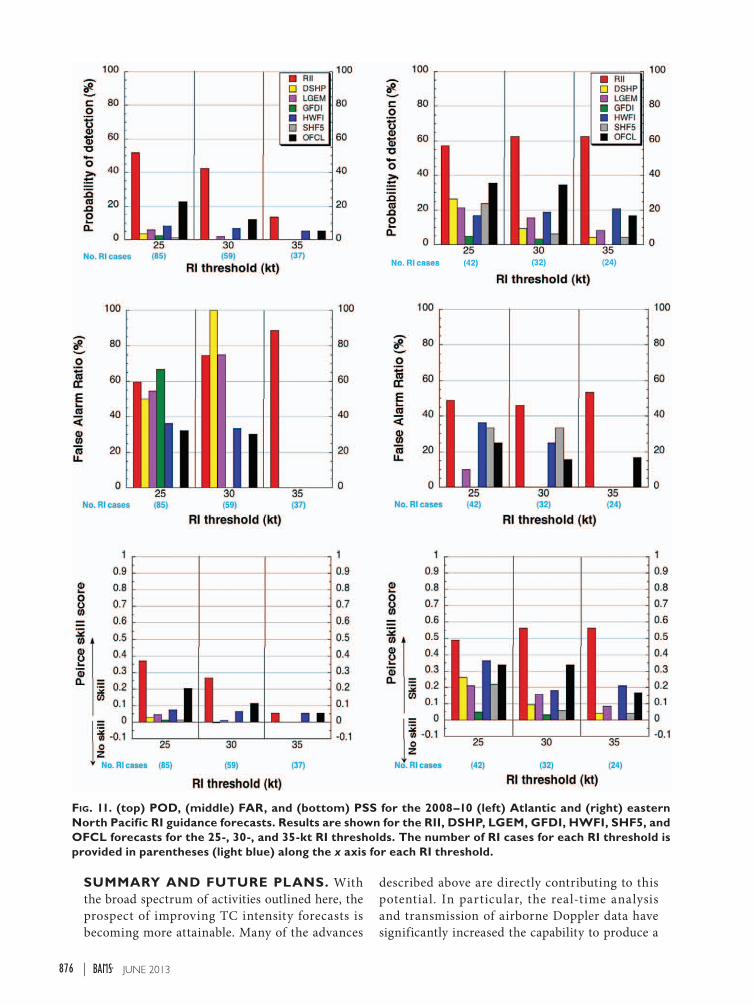
Although the RII was originally formulated to provide probabilistic information, Kaplan et al. (2010) developed a method where it could also be used in a more deterministic manner. To accomplish this, cutoff probability thresholds above which RI would be forecast to occur were determined. Figure 11 provides an evaluation of the ability of the operational early1 intensity guidance to predict RI for a homogeneous sample of the 2008–10 operational forecasts for three separate metrics. The figure shows the probability of detection (POD), false alarm ratio (FAR), and Peirce skill score (PSS; used to assess contingency type forecasts of rare events such as RI, with a PSS of 1 indicating a perfect score and negative scores not considered skillful). It is important to note that, since the RII cutoff probabilities were only first published in 2010, the OFCL NHC forecasts were made without knowledge of this particular information. The results indicate that the RII generally provides the highest POD, while its FAR is generally comparable to or slightly higher than the other intensity guidance. The OFCL forecasts generally exhibit the lowest FAR. The PSS of the RII is generally the highest of all intensity guidance, while the Interpolated HWRF (HWFI) forecasts are generally the most skillful of all of the conventional deterministic intensity models. Furthermore, since the RII had much higher skill in the eastern North Pacific than in the Atlantic, it is hypothesized that the large-scale environment plays a more important role in modulating RI in the eastern North Pacific because it either is gener-ally more favorable (Kaplan et al. 2010) or is simply easier to analyze and predict. Thus, a more detailed knowledge of a tropical cyclone’s inner-core struc-ture is likely required in the Atlantic to achieve skill comparable to that obtained for the eastern North Pacific. Additional research is currently underway
to improve the operational utility of the RII. For example, ensemble-based versions of the RII that employ various additional statistical techniques (Rozoff and Kossin 2011) and incorporate satellite-derived microwave imagery are being developed. A method for employing the probabilistic RII to make deterministic intensity forecasts is also being refined (Sampson et al. 2011), and the RII is being extended out to 48 h since the NHC has recently begun issuing watch and warnings out to these longer lead times.
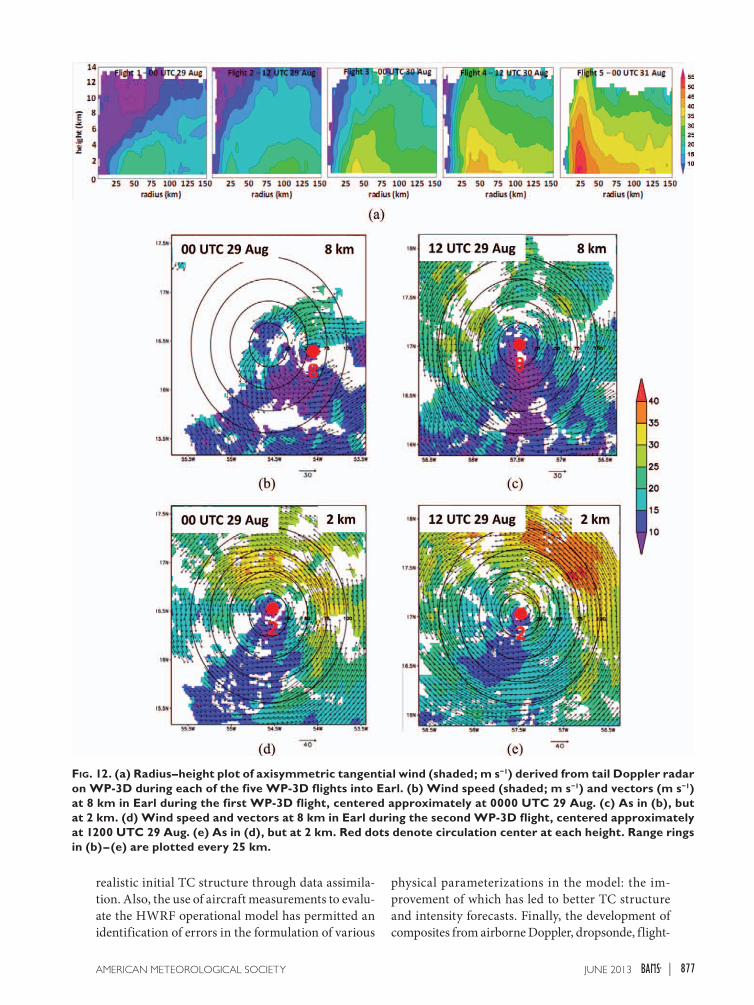
case study: HuRRicane eaRl (2010). One RI event that was particularly well sampled by NOAA aircraft occurred in Hurricane Earl in 2010. Beginning at 1800 UTC 28 August NOAA P-3 aircraft began sampling Earl when it was a moderate tropical storm with peak winds of 50 kt. Over the next 54 h, Earl underwent RI, increasing from a 55-kt tropical storm to a 115-kt major hurricane in the 36 h between 0900 UTC 29 August and 2100 UTC 30 August. Five NOAA WP-3D flights occurred during this window, including before, during, and at the end of RI. Additionally, three NOAA G-IV, two NASA DC-8, and four U.S. Air Force C-130 flights occurred, pro-viding excellent inner-core and environmental sam-pling during RI. The evolution of the axisymmetric tangential wind during RI, derived from the airborne Doppler radar on board the WP-3D, is shown in Fig. 12. The strengthening and deepening of the vor-tex and development of the eyewall are clearly seen here. Figures 12b–e show the wind field at 2 and 8 km during the WP-3D flight during the 12 h prior to the onset of RI and again during the subsequent WP-3D flight at the time of RI onset. Note that the circulation center at 8 km is significantly displaced to the east of the 2-km center prior to the onset of RI. By the time of RI onset, the 8-km center is nearly collocated with the 2-km center and the vortex deepens and strengthens (cf. Fig. 12a). This evolution highlights the potential importance of vortex alignment in RI, similar to what has been shown in previous case studies [e.g., Guillermo of 1997 in Reasor et al. (2009) and Reasor and Eastin (2012)]. Given the excellent inner-core and environmental coverage by the various aircraft sampling Earl, this case should provide new insight into the role of environmental, vortex, and convective structures in RI.
1 “Early” model guidance refers to guidance that has been obtained by adjusting [or in the case of the statistical–dynamical models such as Decay SHIPS (DSHP) and LGEM employing] the 6–126-h forecasts from the previous run of a given model like the GFS to obtain the forecasted positions and intensities out to the 120-h forecast lead time. The NHC makes use of such procedures since the “late” runs of the dynamical models are not available in time to be used by NHC forecasters when they issue their advisories for a given forecast cycle.
875june 2013AMeRICAn MeTeOROLOGICAL SOCIeTY |
SUMMARY AND FUTURE PLANS. With the broad spectrum of activities outlined here, the prospect of improving TC intensity forecasts is becoming more attainable. Many of the advances
described above are directly contributing to this potential. In particular, the real-time analysis and transmission of airborne Doppler data have significantly increased the capability to produce a
Fig. 11. (top) POD, (middle) FAR, and (bottom) PSS for the 2008–10 (left) Atlantic and (right) eastern North Pacific RI guidance forecasts. Results are shown for the RII, DSHP, LGEM, GFDI, HWFI, SHF5, and OFCL forecasts for the 25-, 30-, and 35-kt RI thresholds. The number of RI cases for each RI threshold is provided in parentheses (light blue) along the x axis for each RI threshold.
876 june 2013|
realistic initial TC structure through data assimila-tion. Also, the use of aircraft measurements to evalu-ate the HWRF operational model has permitted an identification of errors in the formulation of various
physical parameterizations in the model: the im-provement of which has led to better TC structure and intensity forecasts. Finally, the development of composites from airborne Doppler, dropsonde, flight-
Fig. 12. (a) Radius–height plot of axisymmetric tangential wind (shaded; m s−1) derived from tail Doppler radar on WP-3D during each of the five WP-3D flights into Earl. (b) Wind speed (shaded; m s−1) and vectors (m s−1) at 8 km in Earl during the first WP-3D flight, centered approximately at 0000 UTC 29 Aug. (c) As in (b), but at 2 km. (d) Wind speed and vectors at 8 km in Earl during the second WP-3D flight, centered approximately at 1200 UTC 29 Aug. (e) As in (d), but at 2 km. Red dots denote circulation center at each height. Range rings in (b)–(e) are plotted every 25 km.
877june 2013AMeRICAn MeTeOROLOGICAL SOCIeTY |
level, and ocean temperature probes has allowed for a robust depiction of TC structure in a variety of environments. These composites have yielded insight into structures that are important to TC intensity change, including the vortex- and convective-scale structure, boundary layer height, turbulent structure, and boundary layer and sea surface temperature and moisture variations.
In addition to the work outlined above, there are many other efforts underway that are supporting each of the three IFEX goals. For example, HRD has been developing the capability to use storm-specific micro-wave, infrared, and visible satellite observations. This work involves simulations of brightness temperatures equivalent to observed brightness temperatures, using model forecast data and a suite of radiative transfer models, and includes comparison of simulated to ob-served fields using imaging and a variety of diagnostic quantities. Another activity involves an optimization of data sampling methods and flight pattern design to maximize the impact of the data on model initializa-tion. This activity will involve the use of observing system simulation experiments (OSSEs), where NOAA P-3 f light tracks are designed, data are simulated from a nature run and then assimilated using the HRD HEDAS system, and the impact of a particular flight track is then assessed. Data collected from IFEX flights are being examined to better understand tropi-cal cyclogenesis; rapid intensification; vortex response in shear; extratropical transition;, and the impact of dry air, commonly seen during the tropical Atlantic hurricane season (Dunion 2011), on TC inner-core structure and intensity evolution.
Through the support of the NOAA Hurricane Forecast Improvement Program (HFIP), intensity forecast improvement is already being realized in high-resolution numerical model simulations that assimilate airborne observations of the TC inner core. A comparison of TC intensity forecasts using the HWRFV3.2 (Gopalakrishnan et al. 2011a) and the Advanced Research Weather Research and Fore-casting model (ARW-WRF; Davis et al. 2008) that assimilate inner-core airborne observations for all TCs from 2008 to 2010 shows that the intensity fore-cast at the 36-h lead time is improved by 5% (18%) for the HWRF (ARW-WRF) and that the 72-h lead time is improved by 33% (42%) for the HWRF (ARW-WRF) (Gall et al. 2012). A significant contributor to this improvement is the assimilation of inner-core data, but improvements to the representation of physical processes in the models also likely contribute to the improvement. This is a very encouraging result, but much work remains to be done. For example, there is a
distinct difference in the skill of TC intensity forecasts for TCs experiencing vertical shear and dry air and those that are not. Assimilating airborne radar is dif-ficult in these environments, since the distribution of precipitation (and scatterers) is typically highly asym-metric and limited. Also, there remain significant uncertainties in the parameterization of planetary boundary layer (e.g., vertical and horizontal turbu-lent mixing, boundary layer height formulation) and microphysical processes (e.g., graupel production and conversion, hydrometeor fallout). Additional datasets, in a variety of environments (e.g., high shear, dry air) and at specific locations within the storm (e.g., near and within the boundary layer, intensively sampling convective and stratiform precipitation) are needed to improve the understanding of these physical processes and provide a larger sample size for data assimilation and numerical modeling experiments.
Future plans include collecting new datasets and continuing to analyze the data already collected for these purposes. Additionally, new instruments and platforms will be incorporated into IFEX. A new Doppler radar has been installed on the NOAA G-IV aircraft, and it will be tested during the upcoming hurricane season. This has the potential to provide an additional platform for measuring the three-dimensional kinematic structure of the TC in the environment and near the inner core, and these data will eventually be assimilated into operational numerical models, supplementing the P-3 data. The use of unmanned aerial systems (UASs) will likely assume a more prominent role in IFEX activities. In particular, the development of the capability to release GPS dropsondes from the Global Hawk aircraft, a platform that can remain airborne for tens of thousands of kilometers and >24 h, holds the potential to provide long-duration measurements of the environmental and inner-core structure and evolution within TCs. Additionally, work continues toward developing and implementing low-level UASs capable of taking measurements of the kinematic and thermodynamic fields within the TC inner core and environment at very low altitudes, where it is unsafe for manned aircraft to fly. These measurements will provide valuable information about the boundary layer and surface layer variables that are important in determining the transfer of enthalpy and momentum from the ocean to the atmosphere (and vice versa).
Data from these new platforms and instruments, along with the existing platforms and instruments, will be analyzed both to improve numerical models and to advance our understanding of the physical processes important in TC intensity change, which
878 june 2013|
can eventually be translated into improved models and better forecasts. Through a concerted effort both within NOAA and through collaborations with partners in other government agencies, academic institutions, and the private sector, the goal of sub-stantially improving TC intensity forecasts is closer to becoming a reality.
ACKNOWLEDGMENTS. The IFEX field portion could not have been accomplished without the dedication and tireless efforts of Jim McFadden, P-3 program manager, and all of the pilots, flight directors, navigators, engineers, and technicians at NOAA/Aircraft Operations Center (AOC). Interactions with Vijay Tallapragada and his col-leagues at NOAA/NCEP Environmental Modeling Center, James Franklin and his colleagues at NOAA/National Hurricane Center, and Jian-Wen Bao and his colleagues at NOAA/Earth System Research Laboratory have provided crucial assistance in the development and application of the work shown here. Much of the work shown here was supported by the NOAA Hurricane Forecast Improvement Program (HFIP), NOAA Joint Hurricane Testbed (JHT), and NOAA base funds.
REFERENCESAberson, S. D., 2008: Large forecast degradations due
to synoptic surveillance during the 2004 and 2005 hurricane seasons. Mon. Wea. Rev., 136, 3138–3150.
—, M. L. Black, R. A. Black, J. J. Cione, C. W. Landsea, F. D. Marks, and R. W. Burpee, 2006: Thirty years of tropical cyclone research with the NOAA P-3 air-craft. Bull. Amer. Meteor. Soc., 87, 1039–1055.
Aksoy, A., S. Lorsolo, T. Vukicevic, K. J. Sellwood, S. D. Aberson, and F. Zhang, 2012: The HWRF Hurricane Ensemble Data Assimilation System (HEDAS) for high-resolution data: The impact of airborne Doppler radar observations in an OSSE. Mon. Wea. Rev., 140, 1843–1862.
—, S. D. Aberson, T. Vukicevic, K. J. Sellwood, S. Lorsolo, and X. Zhang, 2013: Assimilation of high-resolution tropical cyclone observations with an ensemble Kalman filter using NOAA/AOML/HRD’s HEDAS: Evaluation of the 2008–11 vortex-scale analyses. Mon. Wea. Rev., in press.
Bao, J.-W., S. G. Gopalakrishnan, S. A. Michelson, F. D. Marks Jr., and M. T. Montgomery, 2012: Impact of physics representations in the HWRFX model on simulated hurricane structure and wind–pressure relationships. Mon. Wea. Rev., 140, 3278–3299.
Barnes, G. M., E. J. Zipser, D. Jorgensen, and F. D. Marks, 1983: Mesoscale and convective structure of a hurricane rainband. J. Atmos. Sci., 40, 2125–2137.
Bell, M. M., and M. T. Montgomery, 2008: Observed structure, evolution, and potential intensity of category 5 Hurricane Isabel (2003) from 12 to 14 September. Mon. Wea. Rev., 136, 2023–2046.
Bister, M., and K. A. Emanuel, 1998: Dissipative heating and hurricane intensity. Meteor. Atmos. Phys., 65, 233–240.
Black, M. L., R. W. Burpee, and F. D. Marks Jr., 1996: Vertical motion characteristics of tropical cyclones determined with airborne Doppler radial velocities. J. Atmos. Sci., 53, 1887–1909.
—, J. F. Gamache, F. D. Marks, C. E. Samsury, and H. E. Willoughby, 2002: Eastern Pacific Hurricanes Jimena of 1991 and Olivia of 1994: The effect of verti-cal shear on structure and intensity. Mon. Wea. Rev., 130, 2291–2312.
Black, P. G., and Coauthors, 2007: Air–sea exchange in hurricanes: Synthesis of observations from the Coupled Boundary Layer Air–Sea Transfer Experi-ment. Bull. Amer. Meteor. Soc., 88, 357–374.
Black, R. A., and J. Hallett, 1986: Observations of the distribution of ice in hurricanes. J. Atmos. Sci., 43, 802–822.
—, and G. J. Holland, 1995: The boundary layer of Tropical Cyclone Kerry (1979). Mon. Wea. Rev., 123, 2007–2028.
—, H. B. Bluestein, and M. L. Black, 1994: Unusually strong vertical motions in a Caribbean hurricane. Mon. Wea. Rev., 122, 2722–2739.
Bosart, L. F., C. S. Velden, W. E. Bracken, J. Molinari, and P. G. Black, 2000: Environmental influences on the rapid intensification of Hurricane Opal (1995) over the Gulf of Mexico. Mon. Wea. Rev., 128, 322–352.
Bozeman, M. L., D. Niyogi, S. Gopalakrishnan, F. D. Marks Jr., X. Zhang, and V. Tallapragada, 2011: An HWRF-based ensemble assessment of the land surface feedback on the post-landfall intensifica-tion of Tropical Storm Fay (2008). Nat. Hazards, 63, 1543–1571, doi:10.1007/s11069-011-9841-5.
Braun, S. A., and Coauthors, 2013: NASA’s Genesis and Rapid Intensification Processes (GRIP) field experi-ment. Bull. Amer. Meteor. Soc., 94, 345–363.
Bryan, G. H., and R. Rotunno, 2009: The maximum intensity of tropical cyclones in axisymmetry numerical model simulations. Mon. Wea. Rev., 137, 1770–1789.
Cione, J. J., 2012: Hurricane intensity change and inner-core SST: Warmer is not always better. Preprints, 30th Conf. on Hurricanes and Tropical Meteorology, Ponte Vedra Beach, FL, Amer. Meteor. Soc., 16D.3. [Available online at https://ams.confex .com/ams/30Hurricane/webprogram/Paper205611 .html.]
879june 2013AMeRICAn MeTeOROLOGICAL SOCIeTY |
—, and E. W. Uhlhorn, 2003: Sea surface temperature variability in hurricanes: Implications with respect to intensity change. Mon. Wea. Rev., 131, 1783–1796.
—, P. G. Black, and S. H. Houston, 2000: Surface observations in the hurricane environment. Mon. Wea. Rev., 128, 1550–1561.
—, E. A. Kalina, J. A. Zhang, and E. W. Uhlhorn, 2013: Observations of air–sea interaction and intensity change in hurricanes. Mon. Wea. Rev., in press.
Davis, C., and Coauthors, 2008: Prediction of landfall-ing hurricanes with the Advanced Hurricane WRF model. Mon. Wea. Rev., 136, 1990–2005.
DeMaria, M., M. Mainelli, L. K. Shay, J. A. Knaff, and J. Kaplan, 2005: Further improvements to the Statisti-cal Hurricane Intensity Prediction Scheme (SHIPS). Wea. Forecasting, 20, 531–543.
Dodge, P. P., R. W. Burpee, and F. D. Marks, 1999: The kinematic structure of a hurricane with sea level pressure less than 900 mb. Mon. Wea. Rev., 127, 987–1004.
Dunion, J. P., 2011: Rewriting the climatology of the tropical North Atlantic and Caribbean Sea atmo-sphere. J. Climate, 24, 893–908.
—, and C. S. Velden, 2004: The impact of the Saharan air layer on Atlantic tropical cyclone activity. Bull. Amer. Meteor. Soc., 85, 353–365.
Emanuel, K. A., 1986: An air–sea interaction theory for tropical cyclones. Part I: Steady-state maintenance. J. Atmos. Sci., 43, 585–605.
—, 1995: Sensitivity of tropical cyclones to surface exchange coefficients and a revised steady-state model incorporating eye dynamics. J. Atmos. Sci., 52, 3969–3976.
Foster, R. C., 2009: Boundary-layer similarity under an axisymmetric, gradient wind vortex. Bound.-Layer Meteor., 131, 321–344.
Franklin, J. L., S. J. Lord, S. E. Feuer, and F. D. Marks, 1993: The kinematic structure of Hurricane Gloria (1985) determined from nested analyses of drop-windsonde and Doppler wind data. Mon. Wea. Rev., 121, 2433–2451.
French, J. R., W. M. Drennan, J. A. Zhang, and P. G. Black, 2007: Turbulent f luxes in the hurricane boundary layer. Part I: Momentum flux. J. Atmos. Sci., 64, 1089–1102.
Gall, R., and Coauthors, 2012: 2011 HFIP R & D activities summary: Accomplishments, lessons learned, and challenges. HFIP Rep., 51 pp. [Available online at www.hfip.org/documents/03262012_2011_annual_report.pdf.]
Gopalakrishnan, S. G., F. D. Marks, X. Zhang, J.-W. Bao, K.-S. Yeh, and R. Atlas, 2011a: The experi-mental HWRF system: A study on the influence of
horizontal resolution on the structure and inten-sity changes in tropical cyclones using an idealized framework. Mon. Wea. Rev., 139, 1762–1784.
—, and Coauthors, 2011b: Hurricane Weather and Research and Forecasting (HWRF) model: Scientific documentation. NOAA/Development Tech Center Rep., 81 pp. [Available online at www.dtcenter .org/HurrWRF/users/docs/scientific_documents /HWRFScientificDocumentation_August2011.pdf.]
—, S. Goldenberg, T. Quirino, F. D. Marks Jr., X. Zhang, K.-S. Yeh, R. Atlas, and V. Tallapragada, 2012: Toward improving high-resolution numerical hurricane forecasting: Influence of model horizon-tal grid resolution, initialization, and physics. Wea. Forecasting, 27, 647–666.
—, F. D. Marks Jr., J. A. Zhang, X. Zhang, J.-W. Bao, and V. Tallapragada, 2013: A study of the impacts of vertical diffusion on the structure and intensity of the tropical cyclones using the high-resolution HWRF system. J. Atmos. Sci., 70, 524–541.
Guimond, S. R., M. Gerald, F. Heymsfield, and J. Turk, 2010: Multiscale observations of Hurricane Dennis (2005): The effects of hot towers on rapid intensifica-tion. J. Atmos. Sci., 67, 633–654.
Hence, D. A., and R. A. Houze Jr., 2008: Kinematic struc-ture of convective-scale elements in the rainbands of Hurricanes Katrina and Rita (2005). J. Geophys. Res., 113, D15108, doi:10.1029/2007JD009429.
Hock, T. F., and J. L. Franklin, 1999: The NCAR GPS dropwindsonde. Bull. Amer. Meteor. Soc., 80, 407–420.
Jorgensen, D. P., 1984a: Mesoscale and convective-scale characteristics of mature hurricanes. Part I: General observations by research aircraft. J. Atmos. Sci., 41, 1267–1285.
—, 1984b: Mesoscale and convective-scale charac-teristics of mature hurricanes. Part II: Inner core structure of Hurricane Allen (1980). J. Atmos. Sci., 41, 1287–1311.
Jin, Y., W. T. Thompson, S. Wang, and C.-S. Liou, 2007: A numerical study of the effect of dissipative heating on tropical cyclone intensity. Wea. Forecasting, 22, 950–966.
Kaplan, J., and M. DeMaria, 2003: Large-scale char-acteristics of rapidly intensifying tropical cyclones in the North Atlantic basin. Wea. Forecasting, 18, 1093–1108.
—, —, and J. A. Knaff, 2010: A revised tropical cyclone rapid intensification index for the Atlantic and eastern North Pacific basins. Wea. Forecasting, 25, 220–241.
—, and Coauthors, 2011: Improvement in the rapid intensity index by incorporation of inner-core infor-mation. JHT Final Rep., 13 pp. [Available online at
880 june 2013|
www.nhc.noaa.gov/jht/09-11reports/final_Kaplan_JHT11.pdf.]
Kelley, O. A., J. Stout, and J. B. Halverson, 2004: Tall pre-cipitation cells in tropical cyclone eyewalls are associ-ated with tropical cyclone intensification. Geophys. Res. Lett., 31, L24112, doi:10.1029/2004GL021616.
Kossin, J. P., and M. D. Eastin, 2001: Two distinct regimes in the kinematic and thermodynamic struc-ture of the hurricane eye and eyewall. J. Atmos. Sci., 58, 1079–1090.
Lorsolo, S., J. A. Zhang, F. D. Marks, and J. Gamache, 2010: Estimation and mapping of hurricane turbulent energy using airborne Doppler measurements. Mon. Wea. Rev., 138, 3656–3670.
Marks, F. D., Jr., and R. A. Houze Jr., 1984: Airborne Doppler radar observations in Hurricane Debby. Bull. Amer. Meteor. Soc., 65, 569–582.
—, and —, 1987: Inner core structure of Hurricane Alicia from airborne Doppler radar observations. J. Atmos. Sci., 44, 1296–1317.
—, and L. K. Shay, 1998: Landfalling tropical cyclones: Forecast problems and associated research opportu-nities. Bull. Amer. Meteor. Soc., 79, 305–323.
—, R. A. Houze Jr., and J. F. Gamache, 1992: Dual-aircraft investigation of the inner core of Hurricane Norbert. Part I: Kinematic structure. J. Atmos. Sci., 49, 919–942.
Montgomery, M. T., and Coauthors, 2012: The Pre-Depression Investigation of Cloud-Systems in the Tropics (PREDICT) experiment: Scientific basis, new analysis tools, and some first results. Bull. Amer. Meteor. Soc., 93, 153–172.
Nolan, D. S., Y. Moon, and D. P. Stern, 2007: Tropical cyclone intensification from asymmetric convec-tion: Energetics and efficiency. J. Atmos. Sci., 64, 3377–3405.
Ooyama, K., 1969: Numerical simulation of the life cycle of tropical cyclones. J. Atmos. Sci., 26, 3–40.
Pattanayak, S., U. C. Mohanty, and S. G. Gopalakrishnan, 2011: Simulation of very severe cyclone Mala over Bay of Bengal with HWRF modeling system. Nat. Hazards, 63, 1413–1437, doi:10.1007/s11069-011-9863-z.
Powell, M. D., 1990a: Boundary layer structure and dynamics in outer hurricane rainbands. Part I: Mesoscale rainfall and kinematic structure. Mon. Wea. Rev., 118, 891–917.
—, 1990b: Boundary layer structure and dynamics in outer hurricane rainbands. Part II: Downdraft modification and mixed layer recovery. Mon. Wea. Rev., 118, 918–938.
—, and T. A. Reinhold, 2007: Tropical cyclone de-structive potential by integrated kinetic energy. Bull. Amer. Meteor. Soc., 88, 513–526.
—, E. Uhlhorn, and J. Kepert, 2009: Estimating maxi-mum surface winds from hurricane reconnaissance aircraft. Wea. Forecasting, 24, 868–883.
Reasor, P. D., and M. D. Eastin, 2012: Rapidly intensify-ing Hurricane Guillermo (1997). Part II: Resilience in shear. Mon. Wea. Rev., 140, 425–444.
—, M. T. Montgomery, F. D. Marks Jr., and J. F. Gamache, 2000: Low-wavenumber structure and evolution of the hurricane inner core observed by airborne dual-Doppler radar. Mon. Wea. Rev., 128, 1653–1680.
—, M. Eastin, and J. F. Gamache, 2009: Rapidly in-tensifying Hurricane Guillermo (1997). Part I: Low-wavenumber structure and evolution. Mon. Wea. Rev., 137, 603–631.
—, R. F. Rogers, and S. Lorsolo, 2013: Environmental flow impacts on tropical cyclone structure diagnosed from airborne Doppler radar composites. Mon. Wea. Rev, in press.
Rogers, R. F., 2010: Convective-scale structure and evo-lution during a high-resolution simulation of tropical cyclone rapid intensification. J. Atmos. Sci., 67, 44–70.
—, and Coauthors, 2006: The Intensity Forecasting Experiment: A NOAA multiyear field program for improving tropical cyclone intensity forecasts. Bull. Amer. Meteor. Soc., 87, 1523–1537.
—, S. Lorsolo, P. Reasor, J. Gamache, and F. D. Marks Jr., 2012: Multiscale analysis of tropical cyclone kinematic structure from airborne Doppler radar composites. Mon. Wea. Rev., 140, 77–99.
—, P. Reasor, and S. Lorsolo, 2013: Airborne Doppler observations of the inner-core structural differ-ences between intensifying and steady-state tropi-cal cyclones. Mon. Wea. Rev., in press, doi:10.1175/MWR-D-12-00357.1.
Rotunno, R., Y. Chen, W. Wang, C. Davis, J. Dudhia, and G. J. Holland, 2009: Large-eddy simulation of an idealized tropical cyclone. Bull. Amer. Meteor. Soc., 90, 1783–1788.
Rozoff, C. M., and J. P. Kossin, 2011: New probabilistic forecast models for the prediction of tropical cyclone rapid intensification. Wea. Forecasting, 26, 677–689.
Saffir, H. S., 1977: Design and Construction Require-ments for Hurricane-Resistant Construction. Ameri-can Society of Civil Engineers, 20 pp.
Sampson, C. R., J. Kaplan, J. A. Knaff, M. DeMaria, and C. A. Sisko, 2011: A deterministic rapid intensifica-tion aid. Wea. Forecasting, 26, 579–585.
Samsury, C. E., and E. J. Zipser, 1995: Secondary wind maxima in hurricanes: Airflow and relationship to rainbands. Mon. Wea. Rev., 123, 3502–3517.
Shay, L. K., P. G. Black, A. J. Mariano, J. D. Hawkins, and R. L. Elsberry, 1992: Upper-ocean response
881june 2013AMeRICAn MeTeOROLOGICAL SOCIeTY |
to Hurricane Gilbert. J. Geophys. Res., 97 (C12), 20 227–20 248.
—, G. J. Goni, and P. G. Black, 2000: Effects of a warm oceanic feature on Hurricane Opal. Mon. Wea. Rev., 128, 1366–1383.
Simpson, R. H., 1952: Exploring the eye of Typhoon “Marge,” 1951. Bull. Amer. Meteor. Soc., 33, 286–298.
Smith, R. K., and M. T. Montgomery, 2010: Hurricane boundary-layer theory. Quart. J. Roy. Meteor. Soc., 136, 1665–1670.
—, —, and S. Vogl, 2008: A critique of Emanuel’s hurricane model and potential intensity theory. Quart. J. Roy. Meteor. Soc., 134, 551–561.
Squires, K., and S. Businger, 2008: The morphology of eyewall lightning outbreaks in two category 5 hurricanes. Mon. Wea. Rev., 136, 1706–1726.
Stern, D. P., and D. S. Nolan, 2009: Reexamining the vertical structure of tangential winds in tropical cyclones: Observations and theory. J. Atmos. Sci., 66, 3579–3600.
Uhlhorn, E. W., and P. G. Black, 2003: Verification of remotely sensed sea surface winds in hurricanes. J. Atmos. Oceanic Technol., 20, 99–116.
—, —, J. L. Franklin, M. Goodberlet, J. Carswell, and A. S. Goldstein, 2007: Hurricane surface wind mea-surements from an operational stepped frequency mi-crowave radiometer. Mon. Wea. Rev., 135, 3070–3085.
Wang, Y., 2001: An explicit simulation of tropical cyclones with a triply nested movable mesh primitive equation model: TCM3. Part I: Model description and control experiment. Mon. Wea. Rev., 129, 1370–1394.
Whitaker, J. S., and T. M. Hamill, 2002: Ensemble data assimilation without perturbed observations. Mon. Wea. Rev., 130, 1913–1924.
Willoughby, H. E., 1990: Temporal changes in the pri-mary circulation in tropical cyclones. J. Atmos. Sci., 47, 242–264.
—, 1998: Tropical cyclone eye thermodynamics. Mon. Wea. Rev., 126, 3053–3067.
—, J. A. Clos, and M. G. Shoreibah, 1982: Concentric eye walls, secondary wind maxima, and the evolution of the hurricane vortex. J. Atmos. Sci., 39, 395–411.
—, F. D. Marks, and R. J. Feinberg, 1984: Station-ary and moving convective bands in hurricanes. J. Atmos. Sci., 41, 3189–3211.
Wroe, D. R., and G. M. Barnes, 2003: Inflow layer ener-getics of Hurricane Bonnie (1998) near landfall. Mon. Wea. Rev., 131, 1600–1612.
Yeh, K.-S., X. Zhang, S. Gopalakrishnan, S. Aberson, R. Rogers, F. Marks, and R. Atlas, 2012: The AOML/ESRL hurricane research system: Performance in the 2008 hurricane season. Nat. Hazards, 63, 1439–1449, doi:10.1007/s11069-011-9787-7.
Yuter, S. E., and R. A. Houze Jr., 1995: Three-dimensional kinematic and microphysical evolution of Florida cumulonimbus. Part II: Frequency distributions of vertical velocity, reflectivity, and differential reflec-tivity. Mon. Wea. Rev., 123, 1941–1963.
Zhang, D.-L., and E. Altshuler, 1999: The effects of dissipative heating on hurricane intensity. Mon. Wea. Rev., 127, 3032–3038.
Zhang, F., Y. Weng, J. A. Sippel, Z. Meng, and C. Bishop, 2009: Cloud-resolving hurricane initialization and prediction through assimilation of Doppler radar observations with an ensemble Kalman filter. Mon. Wea. Rev., 137, 2105–2125.
—, —, J. F. Gamache, and F. D. Marks, 2011: Performance of convection-permitting hurricane initialization and prediction during 2008–2010 with ensemble data assimilation of inner-core airborne Doppler radar observations. Geophys. Res. Lett., 38, L15810, doi:10.1029/2011GL048469.
Zhang, J. A., 2010: Estimation of dissipative heating using low-level in situ aircraft observations in the hurricane boundary layer. J. Atmos. Sci., 67, 1853–1862.
—, and M. T. Montgomery, 2012: Observational esti-mates of the horizontal eddy diffusivity and mixing length in the low-level region of intense hurricanes. J. Atmos. Sci., 69, 1306–1316.
—, K. B. Katsaros, P. G. Black, S. Lehner, J. R. French, and W. M. Drennan, 2008: Effects of roll vortices on turbulent f luxes in the hurricane boundary layer. Bound.-Layer Meteor., 128, 173–189.
—, W. M. Drennan, P. G. Black, and J. R. French, 2009: Turbulence structure of the hurricane boundary layer between the outer rain bands. J. Atmos. Sci., 66, 2455–2467.
—, F. D. Marks, M. T. Montgomery, and S. Lorsolo, 2011a: An estimation of turbulent characteristics in the low-level region of intense hurricanes Allen (1980) and Hugo (1989). Mon. Wea. Rev., 139, 1447–1462.
—, R. F. Rogers, D. S. Nolan, and F. D. Marks, 2011b: On the characteristic height scales of the hurricane boundary layer. Mon. Wea. Rev., 139, 2523–2535.
Zhang, X., T. S. Quirino, K.-S. Yeh, S. G. Gopalakrishnan, F. D. Marks Jr., S. B. Goldenberg, and S. Aberson, 2011: HWRFx: Improving hurricane forecast with high-resolution modeling. Comput. Sci. Eng., 13, 13–21.
Zipser, E. J., and Coauthors, 2009: The Saharan air layer and the fate of African easterly waves—NASA’s AMMA field study of tropical cyclogenesis. Bull. Amer. Meteor. Soc., 90, 1137–1156.
882 june 2013|