identifying and prioritizing ehs · pdf file(bangladesh) - improved processing ... magnitude...
TRANSCRIPT
Identifying and Prioritizing EHS Risks
Rodney Canada
Vice-President, EHS&S
2
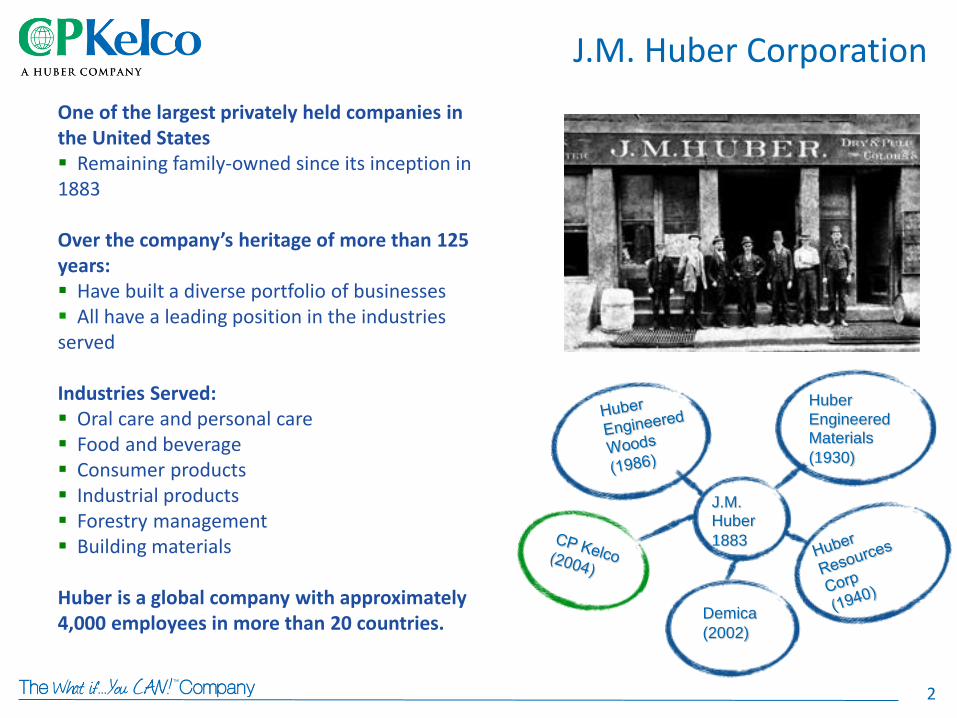
One of the largest privately held companies in the United States Remaining family-owned since its inception in 1883 Over the company’s heritage of more than 125 years: Have built a diverse portfolio of businesses All have a leading position in the industries served Industries Served: Oral care and personal care Food and beverage Consumer products Industrial products Forestry management Building materials Huber is a global company with approximately 4,000 employees in more than 20 countries.
J.M. Huber Corporation
J.M. Huber 1883
Huber
Engineered Materials (1930)
Demica (2002)

3
CP Kelco - Global Reach
20 Sales Offices, 9 Manufacturing Sites, 10 Technical Support Centers 12 Customer Support Centers, 5 Centers of Excellence
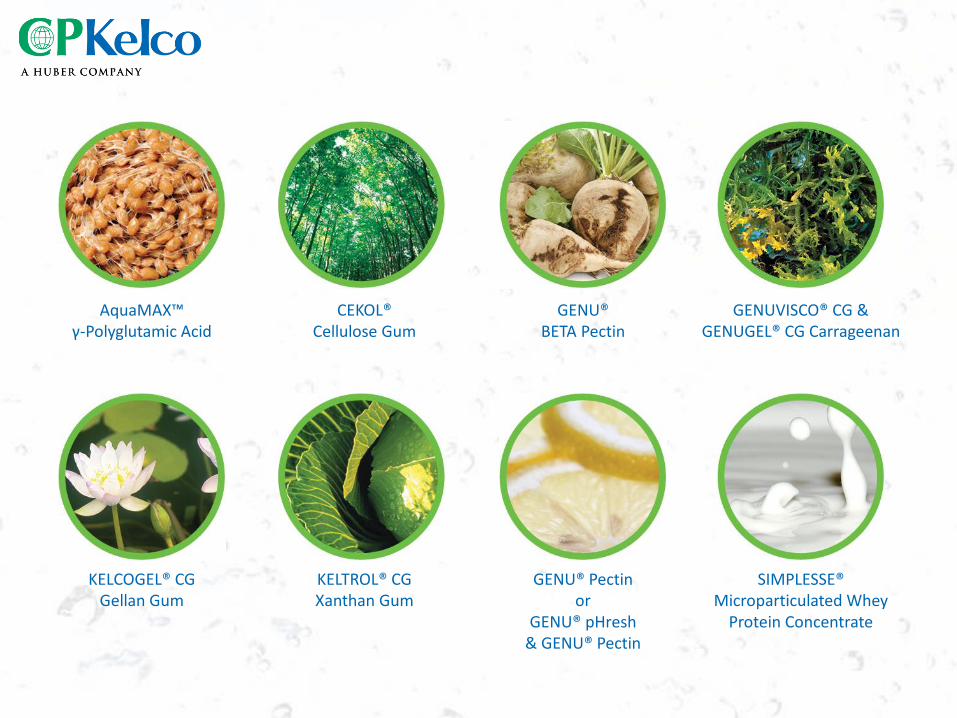
AquaMAX™ γ-Polyglutamic Acid
CEKOL® Cellulose Gum
GENU® BETA Pectin
GENUVISCO® CG & GENUGEL® CG Carrageenan
KELCOGEL® CG Gellan Gum
KELTROL® CG Xanthan Gum
GENU® Pectin or
GENU® pHresh & GENU® Pectin
SIMPLESSE® Microparticulated Whey
Protein Concentrate
5
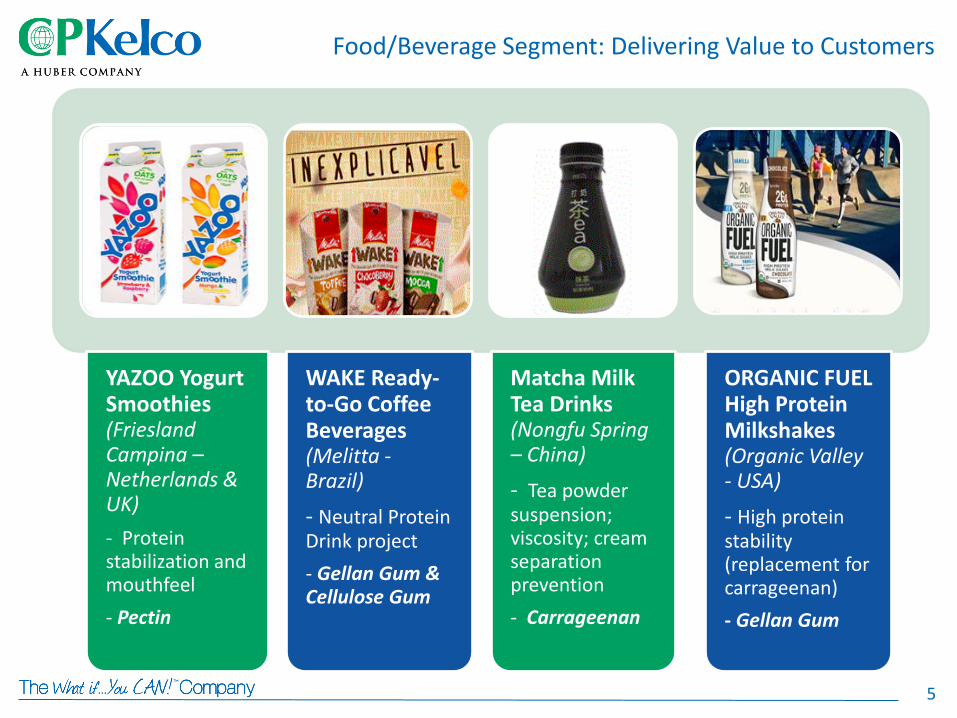
YAZOO Yogurt Smoothies (Friesland Campina –Netherlands & UK)
- Protein stabilization and mouthfeel
- Pectin
WAKE Ready-to-Go Coffee Beverages (Melitta - Brazil)
- Neutral Protein Drink project
- Gellan Gum & Cellulose Gum
Matcha Milk Tea Drinks (Nongfu Spring – China)
- Tea powder suspension; viscosity; cream separation prevention
- Carrageenan
ORGANIC FUEL High Protein Milkshakes (Organic Valley - USA)
- High protein stability (replacement for carrageenan)
- Gellan Gum
Food/Beverage Segment: Delivering Value to Customers
6
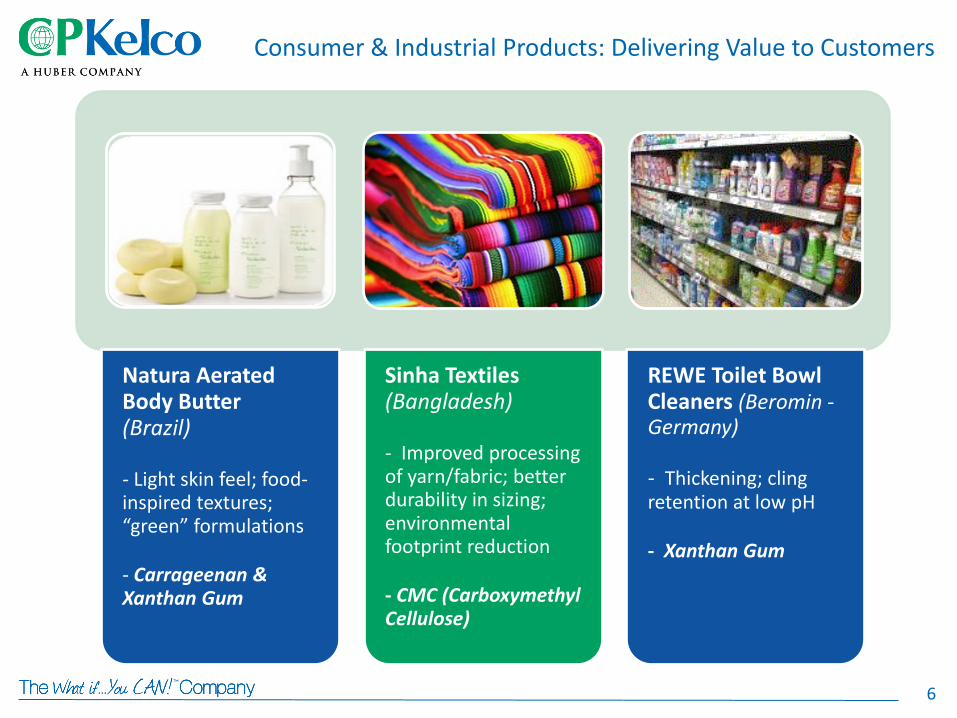
Natura Aerated Body Butter (Brazil)
- Light skin feel; food-inspired textures; “green” formulations
- Carrageenan & Xanthan Gum
Sinha Textiles (Bangladesh)
- Improved processing of yarn/fabric; better durability in sizing; environmental footprint reduction
- CMC (Carboxymethyl Cellulose)
REWE Toilet Bowl Cleaners (Beromin -Germany)
- Thickening; cling retention at low pH
- Xanthan Gum
Consumer & Industrial Products: Delivering Value to Customers

7
Huber Principles

8
• Are all EHS risks the same?
• How can you identify and prioritize EHS risks
• How can you establish a level playing field to discuss EHS Risks compared to financial risks, business growth opportunities, quality issues and all the other issues that come before CEO’s, CFO’s etc.
Objectives of Presentation
9
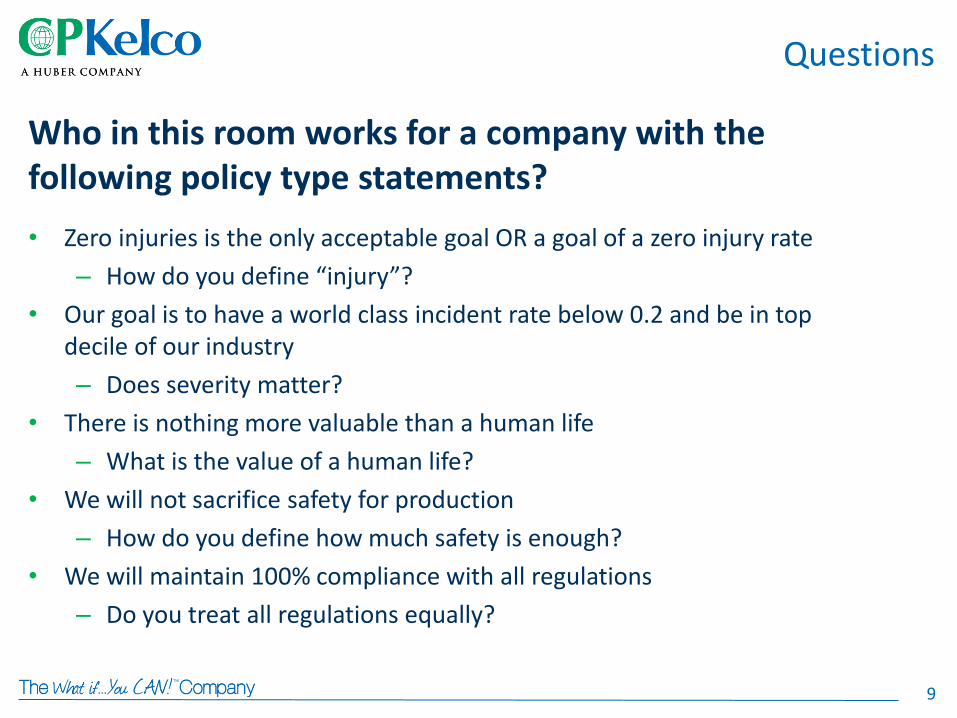
Who in this room works for a company with the following policy type statements?
• Zero injuries is the only acceptable goal OR a goal of a zero injury rate
– How do you define “injury”?
• Our goal is to have a world class incident rate below 0.2 and be in top decile of our industry
– Does severity matter?
• There is nothing more valuable than a human life
– What is the value of a human life?
• We will not sacrifice safety for production
– How do you define how much safety is enough?
• We will maintain 100% compliance with all regulations
– Do you treat all regulations equally?
Questions
10
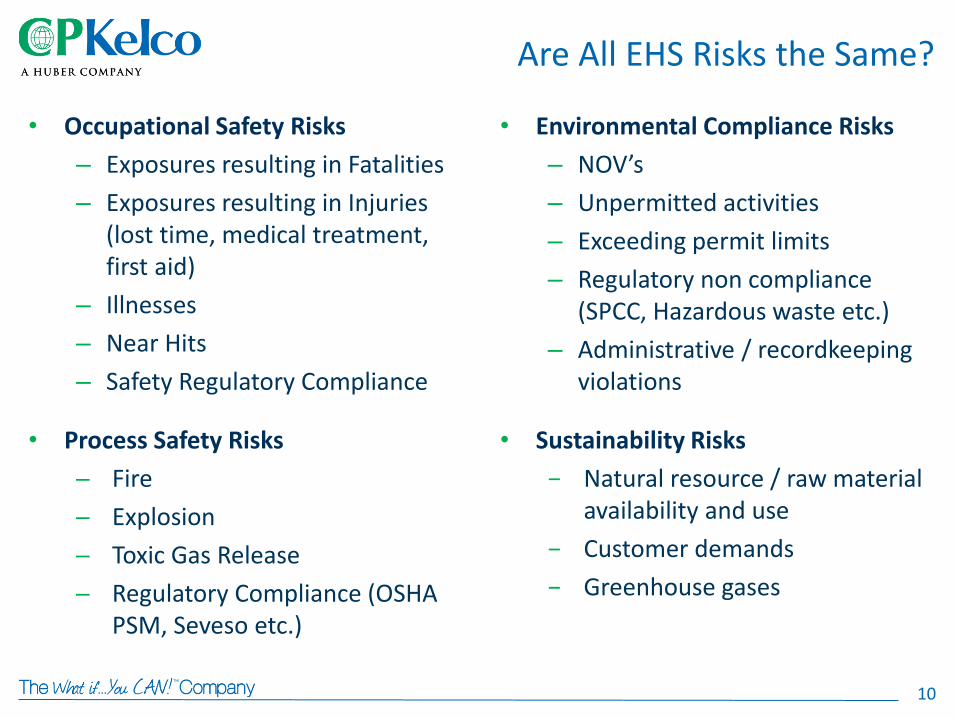
• Occupational Safety Risks
– Exposures resulting in Fatalities
– Exposures resulting in Injuries (lost time, medical treatment, first aid)
– Illnesses
– Near Hits
– Safety Regulatory Compliance
• Environmental Compliance Risks
– NOV’s
– Unpermitted activities
– Exceeding permit limits
– Regulatory non compliance (SPCC, Hazardous waste etc.)
– Administrative / recordkeeping violations
Are All EHS Risks the Same?
• Process Safety Risks
─ Fire
─ Explosion
─ Toxic Gas Release
─ Regulatory Compliance (OSHA PSM, Seveso etc.)
• Sustainability Risks
− Natural resource / raw material availability and use
− Customer demands
− Greenhouse gases
11
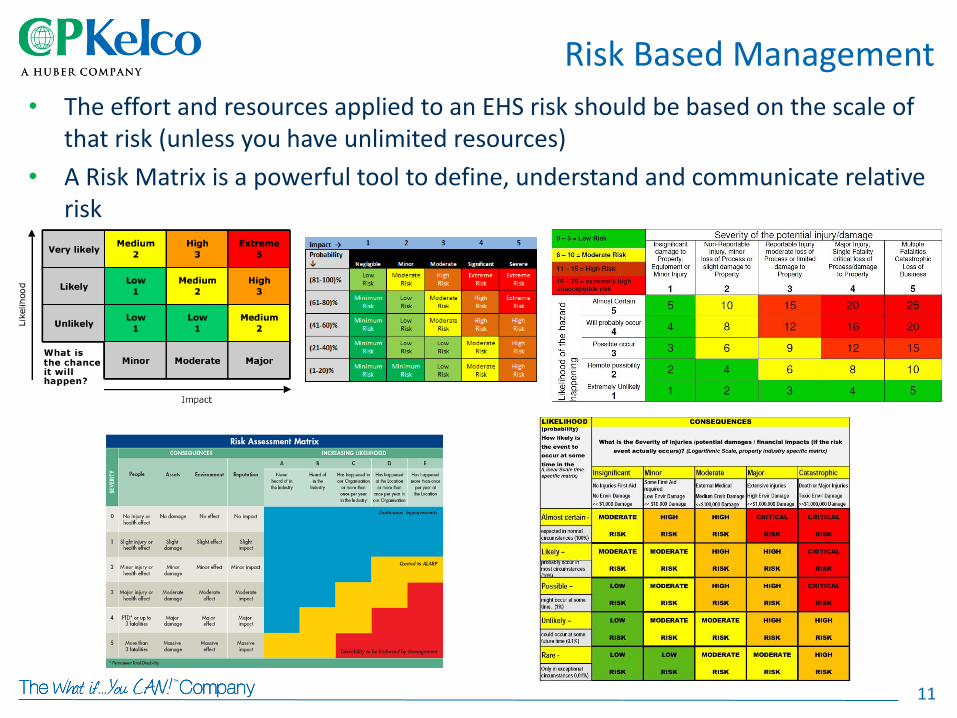
• The effort and resources applied to an EHS risk should be based on the scale of that risk (unless you have unlimited resources)
• A Risk Matrix is a powerful tool to define, understand and communicate relative risk
Risk Based Management
12
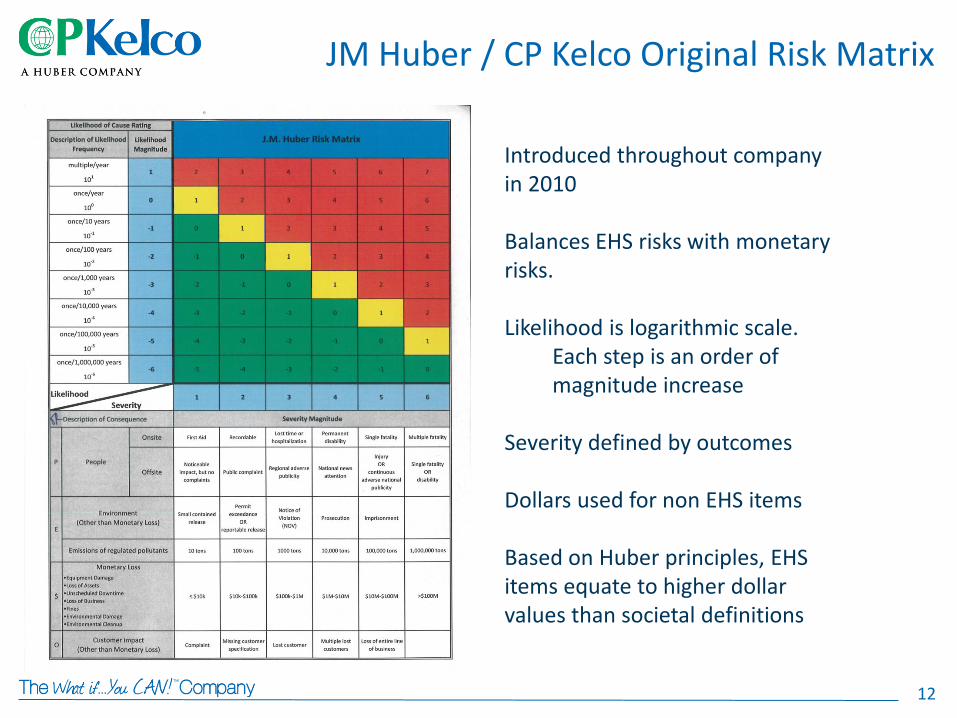
JM Huber / CP Kelco Original Risk Matrix
Introduced throughout company in 2010 Balances EHS risks with monetary risks. Likelihood is logarithmic scale.
Each step is an order of magnitude increase
Severity defined by outcomes Dollars used for non EHS items Based on Huber principles, EHS items equate to higher dollar values than societal definitions
13
JM Huber / CP Kelco Original Risk Matrix
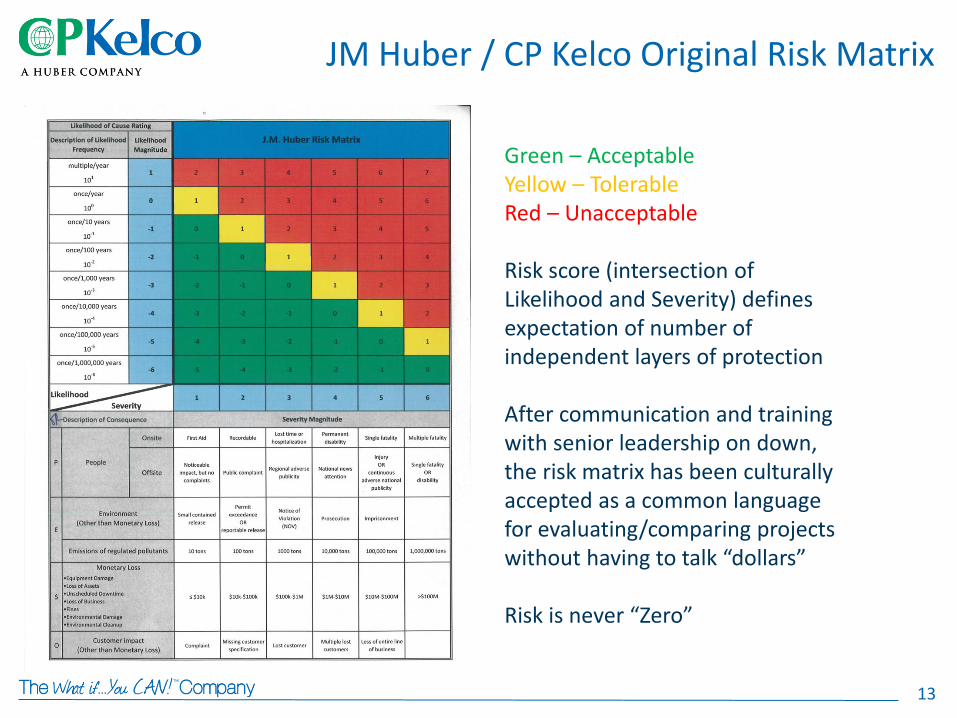
Green – Acceptable Yellow – Tolerable Red – Unacceptable Risk score (intersection of Likelihood and Severity) defines expectation of number of independent layers of protection After communication and training with senior leadership on down, the risk matrix has been culturally accepted as a common language for evaluating/comparing projects without having to talk “dollars” Risk is never “Zero”
14
JM Huber / CP Kelco Original Risk Matrix
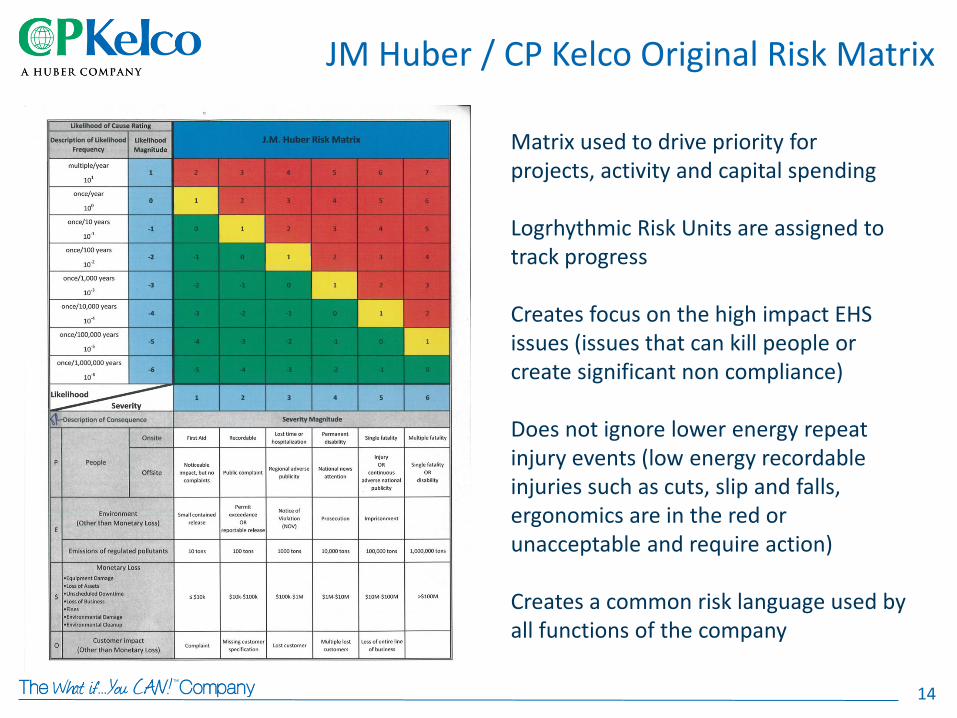
Matrix used to drive priority for projects, activity and capital spending Logrhythmic Risk Units are assigned to track progress Creates focus on the high impact EHS issues (issues that can kill people or create significant non compliance) Does not ignore lower energy repeat injury events (low energy recordable injuries such as cuts, slip and falls, ergonomics are in the red or unacceptable and require action) Creates a common risk language used by all functions of the company
15
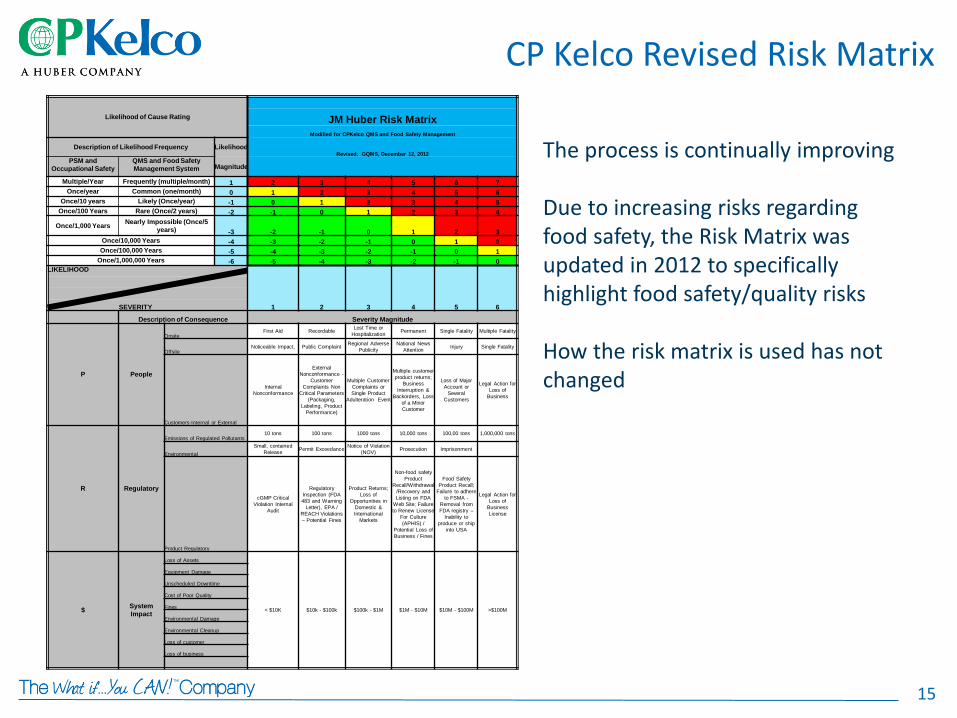
CP Kelco Revised Risk Matrix
The process is continually improving Due to increasing risks regarding food safety, the Risk Matrix was updated in 2012 to specifically highlight food safety/quality risks How the risk matrix is used has not changed
Likelihood of Cause Rating
JM Huber Risk Matrix
Modified for CPKelco QMS and Food Safety Management
Description of Likelihood Frequency Likelihood Revised: GQMS, December 12, 2012
PSM and
Occupational Safety
QMS and Food Safety
Management System Magnitude
Multiple/Year Frequently (multiple/month) 1 2 3 4 5 6 7
Once/year Common (one/month) 0 1 2 3 4 5 6
Once/10 years Likely (Once/year) -1 0 1 2 3 4 5
Once/100 Years Rare (Once/2 years) -2 -1 0 1 2 3 4
Once/1,000 Years Nearly Impossible (Once/5
years) -3 -2 -1 0 1 2 3
Once/10,000 Years -4 -3 -2 -1 0 1 2
Once/100,000 Years -5 -4 -3 -2 -1 0 1
Once/1,000,000 Years -6 -5 -4 -3 -2 -1 0
LIKELIHOOD
1 2 3 4 5 6
SEVERITY
Description of Consequence Severity Magnitude
P People
Onsite First Aid Recordable
Lost Time or
Hospitalization Permanent Single Fatality Multiple Fatality
Offsite Noticeable Impact, Public Complaint
Regional Adverse
Publicity
National News
Attention Injury Single Fatality
Customers-Internal or External
Internal
Nonconformance
External
Nonconformance -
Customer
Complaints Non
Critical Parameters
(Packaging,
Labeling, Product
Performance)
Multiple Customer
Complaints or
Single Product
Adulteration Event
Multiple customer
product returns;
Business
Interruption &
Backorders, Loss
of a Minor
Customer
Loss of Major
Account or
Several
Customers
Legal Action for
Loss of
Business
R Regulatory
Emissions of Regulated Pollutants 10 tons 100 tons 1000 tons 10,000 tons 100,00 tons 1,000,000 tons
Environmental
Small, contained
Release Permit Exceedance
Notice of Violation
(NOV) Prosecution Imprisonment
Product Regulatory
cGMP Critical
Violation Internal
Audit
Regulatory
Inspection (FDA
483 and Warning
Letter), EPA /
REACH Violations
– Potential Fines
Product Returns;
Loss of
Opportunities in
Domestic &
International
Markets
Non-food safety
Product
Recall/Withdrawal
/Recovery and
Listing on FDA
Web Site; Failure
to Renew License
For Culture
(APHIS) /
Potential Loss of
Business / Fines
Food Safety
Product Recall;
Failure to adhere
to FSMA -
Removal from
FDA registry –
Inability to
produce or ship
into USA
Legal Action for
Loss of
Business
License
$ System
Impact
Loss of Assets
< $10K $10k - $100k $100k - $1M $1M - $10M $10M - $100M >$100M
Equipment Damage
Unscheduled Downtime
Cost of Poor Quality
Fines
Environmental Damage
Environmental Cleanup
Loss of customer
Loss of business

16
Illustration of level of process safety risk that is acceptable to CP Kelco
• Lifetime risk of being killed in a car accident is 1 in 108 (0.92%). *
– Assume average lifetime = 75 years.
– Therefore, expect one auto fatality once every 8,152 life years (i.e. 75/0.0092).
• CP Kelco has approximately 2000 employees = 2000 life years every year.
• Statistics would predict that one employee will likely be killed in a car accident approximately every four years.
• CP Kelco’s tolerable process safety risk level (Risk Level 1) in our plants is one fatality / 10,000 years OR one process safety related loss of greater than $10 million per 10,000 years.
For comparison, other Risk Level expected outcomes:
Risk Level 2 – statistical expectation of one fatality (or >$10 million loss) every 1000 years.
Risk level 3 – statistical expectation of one fatality (or >$10 million loss) every 100 years.
What Level of Risk is Acceptable?
* Source: National Safety Council, 2013 Injury Facts
17
With a tool to quantify risks, you now need a systematic process to identify EHS risks
• The JM Huber / CP Kelco EHS management system defines a systematic six (6) step process
– Step 1: Document site background to identify features that may increase or decrease risk or severity (past disposal practices, nearby receptors (i.e. waterways, schools etc.), highways/railroads etc.
– Step 2 : Evaluate the chemical inventory of the site focusing on large volume or highly toxic chemicals. Evaluate/Define any chemical incompatibilities
– Step 3: Evaluate the products and wastes transported to/from the site (transportation and loading/unloading risks)
– Step 4: Hazard Identification – checklist of common energy and chemical risks
– Step 5: Evaluation of other potential EHS risk categories (19 categories)
– Step 6: Pull it all together. Compilation of all identified risks, supported by risk ranked scenarios (unmitigated risk) and identification of layers of protection or controls implemented (mitigated risks).
• Risk Units are assigned to provide a mechanism of tracking progress.
• Risk Units are also order of magnitude (i.e. Risk 5 = 1,000,000 risk units, Risk 4 = 100,000, Risk 3 = 1,000 etc.) so reducing a high risk item has more benefit in metrics than a lower risk. Drives priority setting
• From this risk identification and scenario development process, any identified risk with a mitigated risk of “2” (first level of unacceptable) or higher must have an action plan developed to lower risk
• Output of this process is called “Table 6”
Identifying Risks
18
In capital plan, we have $5 Million available. Three (3) projects are being considered:
– Process Safety – a PHA revealed a previously unrecognized risk at a plant. In a power outage, alcohol could back flow into a tank causing an overflow if high level alarm did not function. Tank is in a classified area so low risk of ignition sources being present. Cost to correct, $5 Million. Potential severity – single fatality, likelihood once/100 years – Risk Rank “3”
– Quality – have discovered metal particles in food product. Need to add magnets and metal detection devices. Cost to correct, $5 Million. Risk of product contamination/recall, average cost of $18 Million, likelihood once/year – Risk Rank “4”
– Productivity Improvement – Engineering has developed a project to improve productivity. Cost of $5 Million, will generate annual EBITDA of $900,000. Magnitude of $900,000, likelihood, once per year – Risk Rank (based on value) – “3”
• If down to the last $5 Million in our capital plan, we would choose the quality project due to the higher risk rank
• If another $5 Million became available, we would choose the Process Safety project over the productivity project. Although the same risk rank, the process safety project has a higher severity/magnitude.
Using Risk Matrix-Competing Priorities Example–Capital Spending
19
• Capital Planning
– Existing equipment/facilities must have plans to get any existing level “2” or higher risk to at least a “1” – tolerable
– Any new project must document in the capital request/approval process how the project will be implemented with a risk level of “0” – acceptable (must define the basis of safety and compliance in the capital request)
• Defines “Independent Layers of Protection” Required
– Safety devices, systems and people fail or make mistakes. For higher risks, want more independent layers of protection to lower probability of the incident
• Incident Investigation
– Safety Incidents or near hits that have have a high energy component (high actual or potential severity) or significant permit/regulatory exceedances or failures require a more detailed/robust investigation than lower energy or severity incidents
• EHS Programs / Initiatives
– Repeat occupational safety incidents raise risk scores of that exposure, driving/demanding action
• Used to compare/communicate EHS risks alongside other types of business risk to senior management / board of directors (foreign exchange risk, intellectual property risk, raw material availability risk etc.)
Other Ways Risk Rank is Used
20
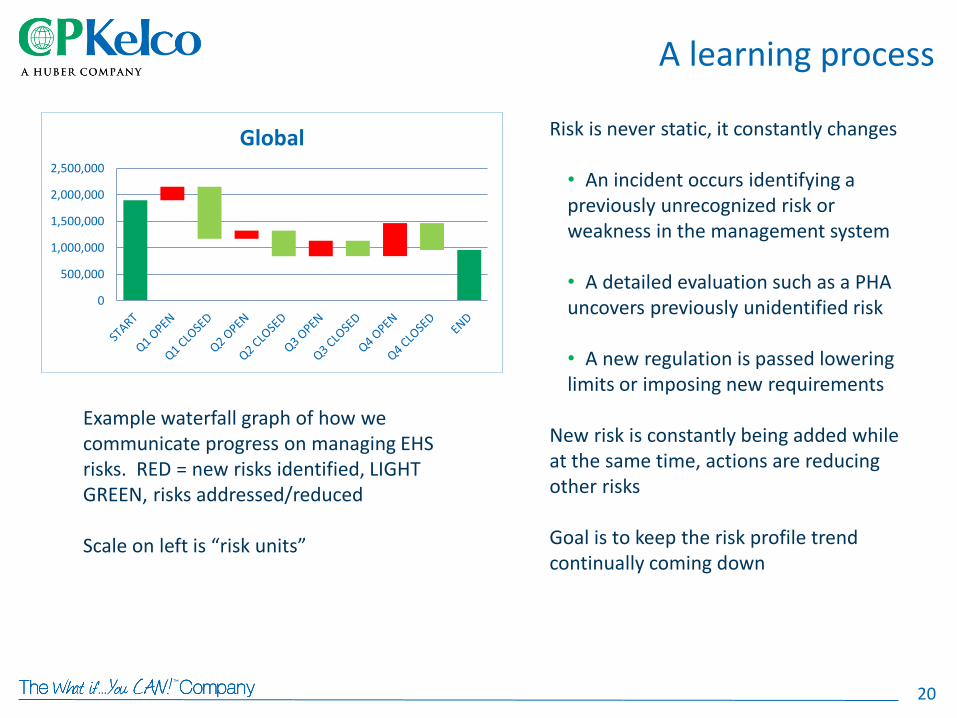
A learning process
0
500,000
1,000,000
1,500,000
2,000,000
2,500,000
Global Risk is never static, it constantly changes • An incident occurs identifying a previously unrecognized risk or weakness in the management system
• A detailed evaluation such as a PHA uncovers previously unidentified risk
• A new regulation is passed lowering limits or imposing new requirements
New risk is constantly being added while at the same time, actions are reducing other risks Goal is to keep the risk profile trend continually coming down
Example waterfall graph of how we communicate progress on managing EHS risks. RED = new risks identified, LIGHT GREEN, risks addressed/reduced Scale on left is “risk units”
21
Un
acce
pta
ble
Ris
k U
nit
s
Actual Risks Quantified/Addressed Risks
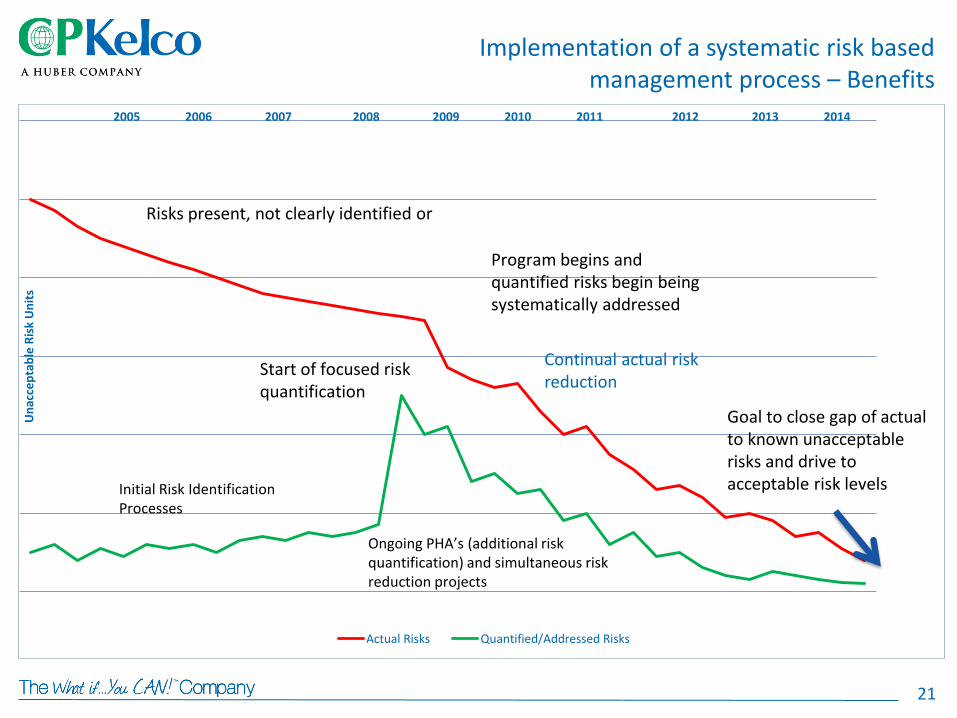
Risks present, not clearly identified or
Start of focused risk quantification
Program begins and quantified risks begin being systematically addressed
Ongoing PHA’s (additional risk quantification) and simultaneous risk reduction projects
Goal to close gap of actual to known unacceptable risks and drive to acceptable risk levels Initial Risk Identification
Processes
Implementation of a systematic risk based management process – Benefits
2008 2009 2010 2011 2012 2013 2014
Continual actual risk reduction
2006 2007 2005
22
• While “Zero” is the ultimate goal, risk will never be zero
• Implementing a process that identifies, prioritizes and requires action based on risk reduces the opportunities (likelihood) for injuries and non compliance
• Focusing action using a risk based approach puts resources on the most important issues
• The Risk Matrix approach (for JM Huber / CP Kelco) has created a culture/language where EHS risks can be discussed/evaluated with Senior Management without the focus always being on dollars or “we have to do it”
• All functions of a company can (and should) use the risk matrix
Conclusions
23
Thank You!
Questions