icra online ltd - mutual fundmutualfundindia.com/images/research/pdfpaths... · icra online ltd a...
TRANSCRIPT

ICRA Online LtdA group ICRA company
April, 2015
Mutual Fund Screeners
MUTUAL FUND INDUSTRY OVERVIEW
Section I
ICRA Online Limited22/05/2015 2

Industry AUM expands again in Apr’15
ICRA Online Limited22/05/2015 3
1. Second consecutive month of correction in
equity markets during April ‘15 couldn’t deter
the MF players from buying as the industry
AUM breached Rs. 11 lakh crore mark for the
fourth time since Nov ‘14.
2. Selling by the Foreign Institutional Investors
(FIIs) amid uncertainties on tax issues hurt
market sentiment.
3. Industry corpus grew 10% during Apr’15, after
witnessing a steep fall in the previous month.
4. The top-10 AMCs contributed close to 80% of
the industry corpus.
5. While the AUM of top-10 rose by 8.6%
during the month, the next-10 (corpus range
7K-25K Crore) surpassed the bigger AMCs
with a growth rate of 13.2%.
-5%
9%
2%
-10%
10%
-15%
-10%
-5%
0%
5%
10%
15%
1,000,000
1,050,000
1,100,000
1,150,000
1,200,000
1,250,000
Dec-14 Jan-15 Feb-15 Mar-15 Apr-15
Ch
an
ge i
n c
orp
us
(M-o
-M)
Ind
ust
ry
Co
rp
us
(In
Rs.
Cro
re)
MF Industry Corpus
Industry Corpus % Change (M-o-M)
Source: MFI Explorer
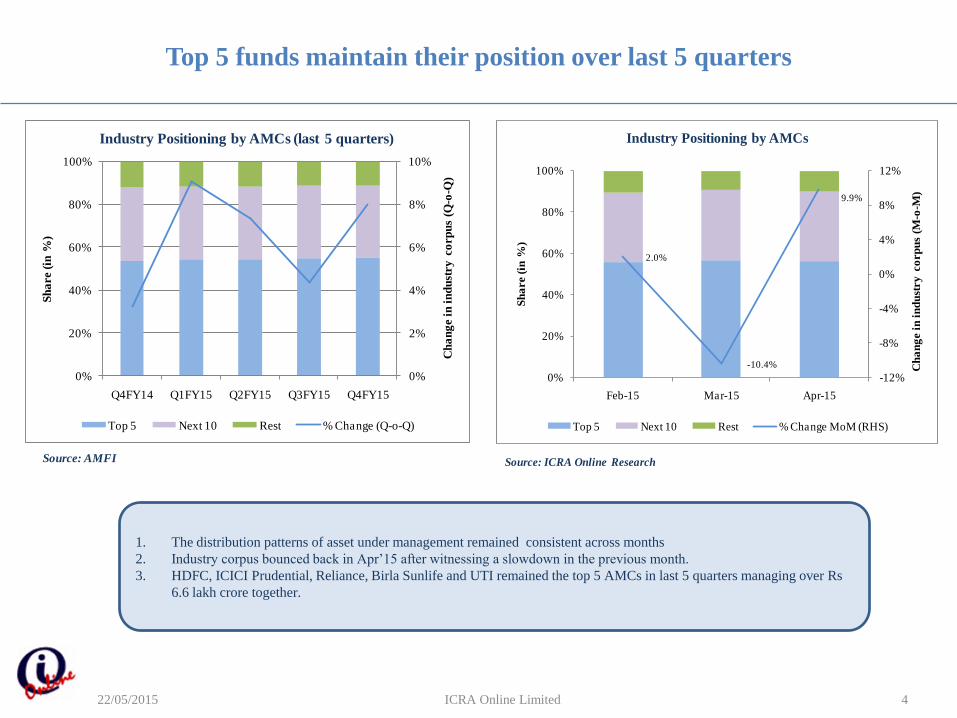
Top 5 funds maintain their position over last 5 quarters
ICRA Online Limited22/05/2015 4
1. The distribution patterns of asset under management remained consistent across months
2. Industry corpus bounced back in Apr’15 after witnessing a slowdown in the previous month.
3. HDFC, ICICI Prudential, Reliance, Birla Sunlife and UTI remained the top 5 AMCs in last 5 quarters managing over Rs
6.6 lakh crore together.
0%
2%
4%
6%
8%
10%
0%
20%
40%
60%
80%
100%
Q4FY14 Q1FY15 Q2FY15 Q3FY15 Q4FY15
Ch
an
ge i
n i
nd
ust
ry
co
rp
us
(Q-o
-Q)
Sh
are (
in %
)
Industry Positioning by AMCs (last 5 quarters)
Top 5 Next 10 Rest % Change (Q-o-Q)
Source: AMFI
2.0%
-10.4%
9.9%
-12%
-8%
-4%
0%
4%
8%
12%
0%
20%
40%
60%
80%
100%
Feb-15 Mar-15 Apr-15
Ch
an
ge i
n i
nd
ust
ry
co
rp
us
(M-o
-M)
Sh
are (
in %
)
Industry Positioning by AMCs
Top 5 Next 10 Rest % Change MoM (RHS)
Source: ICRA Online Research

Equities witness record inflows in April ‘15
ICRA Online Limited22/05/2015 5
1. Income fund category witnessed a fall in market share from
46.26% in Mar’15 to 45.83% in Apr ‘15.
2. However, equity fund category managed to increase its market
share from 23.86% in Mar ‘15 to 24.50% in Apr ‘15.
1. Equity category continued to attract healthy inflows for past 12
months. The category witnessing record inflow of Rs 10.4K
crore in Apr ’15, second highest since Jul ‘14.
2. Liquid/Money market witnessed an inflow of Rs. 1 lakh crore,
reversing previous month’s 1.1 lakh crore outflow.
45.83%
22.01%
24.50%
3.23%
2.00%
0.68%
0.81%0.26%
0.57%
0.11%
7.66%
Category wide distribution of industry corpus for TTM
Income
Liquid/Money Market
Equity
ELSS - Equity
Balanced
Gold ETF
Gilt
FoFs Investing Overseas
Other ETFs
Infrastructure Debt Fund
Source: AMFI, ICRA Online Research, Data is as on Apr-2015, TTM-Trailing twelve months
Bottom 7 categories
-20,000 0 20,000 40,000 60,000 80,000 100,000
Income
Infrastructure Debt Fund
Equity
Balanced
Liquid/Money Market
Gilt
Elss - Equity
Gold Etf
Other Etfs
FoFs Investing Overseas
In Rs. Crore
Net Inflow/Outflow pattern for TTM
Source: AMFI, Data is as on Apr-2015, TTM-Trailing twelve months

350,000
400,000
450,000
500,000
550,000
Income
50,000
100,000
150,000
200,000
250,000
300,000
Liquid/Money Market
50,000
100,000
150,000
200,000
250,000
300,000
350,000
Equity
0
5,000
10,000
15,000
20,000
25,000
30,000
35,000
40,000
45,000
ELSS - Equity
0
5,000
10,000
15,000
20,000
25,000
30,000
Balanced
0
3,000
6,000
9,000
12,000
Gold ETF
0
2,000
4,000
6,000
8,000
10,000
12,000
14,000
16,000
Gilt
0
1,000
2,000
3,000
4,000
FoFs Investing Overseas
0
1,000
2,000
3,000
4,000
5,000
6,000
7,000
8,000
9,000
Other ETFs
0
200
400
600
800
1,000
1,200
1,400
1,600
Infrastructure Debt Fund
Category Movement Monitor for Trailing Twelve Months
ICRA Online Limited22/05/2015 6
Source: AMFI
1. Equity and Balanced fund category see a steady rise in AUM.

Category Specific Deep Dive : Equity & Income
ICRA Online Limited22/05/2015 7
1. Sensex took a hit of 3.4% in Apr’15, posting losses for
second consecutive month.
2. However, the equity fund category managed to see record
inflow of Rs. 10,406 in Apr ‘15.
1. Income fund corpus witnessed a marginal fall of 0.2% M-
o-M in Apr’15 (at Rs. 5.14 lakh crore).
2. Income fund category managed to limit the outflow (at Rs
2,510 crore in Apr’15) after witnessing significant outflow
in the previous month.
-10
-5
0
5
10
-
2,000
4,000
6,000
8,000
10,000
12,000
Ap
r-1
4
Ma
y-1
4
Jun
-14
Jul-
14
Au
g-1
4
Sep
-14
Oct-
14
No
v-1
4
Dec-1
4
Jan
-15
Feb
-15
Ma
r-1
5
Ap
r-1
5
Sen
sex
Mo
nth
ly r
etu
rn
(in
%)
Net
flo
w (
in R
s. c
ro
re)
Equity category flow vis-a-vis Sensex
Net Inflow/Outflow Sensex Returns M-o-M (RHS)
Source: AMFI, BSE
-15,000
-10,000
-5,000
0
5,000
10,000
15,000
20,000
25,000
Ap
r-1
4
Ma
y-1
4
Jun
-14
Jul-
14
Au
g-1
4
Sep
-14
Oct-
14
No
v-1
4
Dec-1
4
Jan
-15
Feb
-15
Ma
r-1
5
Ap
r-1
5
420,000
440,000
460,000
480,000
500,000
520,000
540,000
Net
flo
w (
In R
s. c
ro
re)
Co
rp
us
(In
Rs.
cro
re)
Income AUM vis-a-vis net flows
Corpus (RHS) Net Inflow/Outflow
Source: AMFI

SAMPLE ANALYSIS OF SOME SELECT AMC’S/REGION
Section II
ICRA Online Limited22/05/2015 8

Mutual Fund AUM Monitor for BIG-5
ICRA Online Limited22/05/2015 9
1. All the top-5 AMCs witnessed net inflows
during Apr’15, compared to the large
outflows seen in the preceding month.
2. Second consecutive month of correction in
domestic equity market couldn’t deter the
top-5 AMCs from buying equities as
evidenced by the net positive inflows
3. Birla Sun Life MF witnessed the highest
inflow followed up by ICICI and UTI MF.
4. The Big-5 together have close to 56% of the
market share
5. As on Apr’15 there were 10 mutual funds
with AUM below Rs 2,000 crore.
Source: ICRA Online research
6.4
8.27.0
11.7
13.2
0
2
4
6
8
10
12
14
0
30,000
60,000
90,000
120,000
150,000
180,000
HDFC MF ICICI Pru Reliance
MF
Birla MF UTI MF
% G
ro
wth
in
AU
M (
M-o
-M)
AU
M (
In R
s. C
ro
re)
Apr-15 Growth in AUM (M-o-M) RHS
AMC
Net Inflow -
Apr'15
Net Inflow -
Mar'15
AUM -
Apr'15
Net Inflow -
Apr'14
Net Inflow -
Mar'14
AUM -
Apr'14
Net Inflow -
CM/LM
Net Inflow -
CM TY/LY
AUM
TY/LY
HDFC Mutual Fund 9,699 -13,496 161,133 15,748 -8,062 125,613 - -38% 28%
ICICI Prudential Mutual Fund 11,435 -10,499 151,417 12,657 -6,180 111,621 - -10% 36%
Reliance Mutual Fund 8,991 -11,398 138,082 10,723 -9,918 105,243 - -16% 31%
Birla Sun Life Mutual Fund 13,107 -8,240 125,050 12,050 -7,037 93,252 - 9% 34%
UTI Mutual Fund 10,396 -15,905 89,405 12,207 -11,126 76,552 - -15% 17%
*CM= Current month, LM = last month, TY = this year, LY = last year
THIS YEAR LAST YEAR GROWTH *
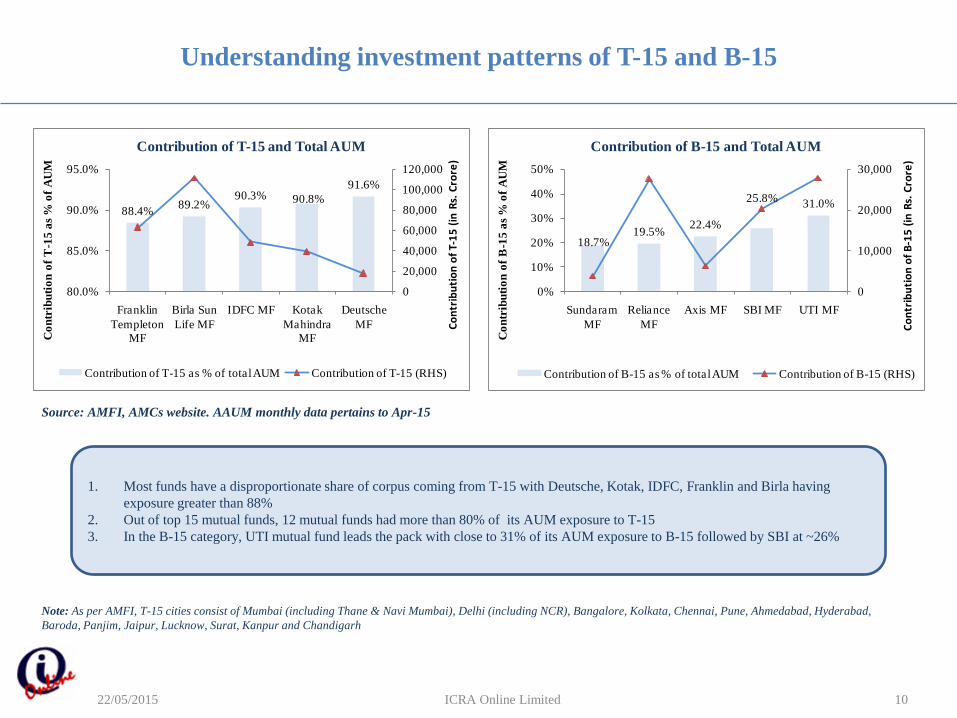
Understanding investment patterns of T-15 and B-15
ICRA Online Limited22/05/2015 10
Source: AMFI, AMCs website. AAUM monthly data pertains to Apr-15
1. Most funds have a disproportionate share of corpus coming from T-15 with Deutsche, Kotak, IDFC, Franklin and Birla having
exposure greater than 88%
2. Out of top 15 mutual funds, 12 mutual funds had more than 80% of its AUM exposure to T-15
3. In the B-15 category, UTI mutual fund leads the pack with close to 31% of its AUM exposure to B-15 followed by SBI at ~26%
Note: As per AMFI, T-15 cities consist of Mumbai (including Thane & Navi Mumbai), Delhi (including NCR), Bangalore, Kolkata, Chennai, Pune, Ahmedabad, Hyderabad,
Baroda, Panjim, Jaipur, Lucknow, Surat, Kanpur and Chandigarh
88.4%89.2%
90.3% 90.8%
91.6%
0
20,000
40,000
60,000
80,000
100,000
120,000
80.0%
85.0%
90.0%
95.0%
Franklin
Templeton
MF
Birla Sun
Life MF
IDFC MF Kotak
Mahindra
MF
Deutsche
MF Co
ntr
ibu
tio
n o
f T-
15
(in
Rs.
Cro
re)
Co
ntr
ibu
tio
n o
f T
-15
as
% o
f A
UM
Contribution of T-15 and Total AUM
Contribution of T-15 as % of total AUM Contribution of T-15 (RHS)
18.7%19.5%
22.4%
25.8%31.0%
0
10,000
20,000
30,000
0%
10%
20%
30%
40%
50%
Sundaram
MF
Reliance
MF
Axis MF SBI MF UTI MF
Co
ntr
ibu
tio
n o
f B
-15
(in
Rs.
Cro
re)
Co
ntr
ibu
tio
n o
f B
-15
as
% o
f A
UM
Contribution of B-15 and Total AUM
Contribution of B-15 as % of total AUM Contribution of B-15 (RHS)

Asset Accumulation Pattern – Top 15
ICRA Online Limited22/05/2015 11
Source: AMFI, AMCs website. AAUM monthly data pertains to Apr-15
0%
20%
40%
60%
80%
100%A
xis
MF
Bir
la S
un
Lif
e M
F
DS
P B
lack
Ro
ck
MF
Fra
nk
lin
Tem
ple
ton
MF
HD
FC
MF
ICIC
I P
rud
en
tia
l MF
IDF
C M
F
Deu
tsch
e M
F
Ko
tak
Ma
hin
dra
MF
L&
T M
F
Relia
nce M
F
SB
I M
F
Su
nd
ara
m M
F
Ta
ta M
F
UT
I M
F
Asset Accumulation Pattern as a % of AUM for Top-15 AMCs
Associate Distributor as % of AUM Non-Associate Distributor as % of AUM Direct Plan as % of AUM

Retail Business Share - Industry Level
ICRA Online Limited22/05/2015 12
Source: AMFI. Category AUM data pertains to Apr-15. Retail is inclusive of HNI
1. Balanced and Equity Categories command the highest retail participation at the industry level, whereas
Liquid/Money Market category is dominated by corporate.
2. Investors in Gilt Fund Category lead the pack in the Direct Channel
2.4%
11.0%
6.0% 5.7%
7.2% 6.9%
0%
2%
4%
6%
8%
10%
12%
0%
10%
20%
30%
40%
50%
60%
70%
80%
90%
100%
Liquid/ Money Market
Gilt FMP Other Debt Schemes
Equity (inc ELSS)
Balanced
AU
M
sha
re (
in %
)
AU
M
sha
re (
in %
)
Retail Participation
Retail AUM share (%) - All channels Retail AUM share (%) - Direct Channel (RHS)
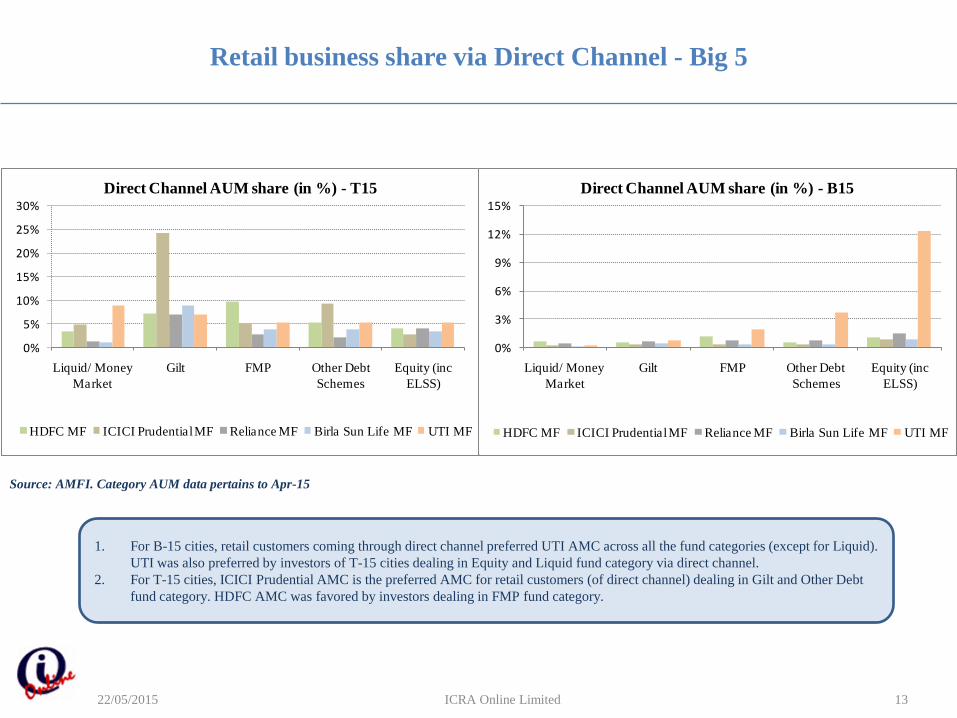
Retail business share via Direct Channel - Big 5
ICRA Online Limited22/05/2015 13
Source: AMFI. Category AUM data pertains to Apr-15
1. For B-15 cities, retail customers coming through direct channel preferred UTI AMC across all the fund categories (except for Liquid).
UTI was also preferred by investors of T-15 cities dealing in Equity and Liquid fund category via direct channel.
2. For T-15 cities, ICICI Prudential AMC is the preferred AMC for retail customers (of direct channel) dealing in Gilt and Other Debt
fund category. HDFC AMC was favored by investors dealing in FMP fund category.
0%
5%
10%
15%
20%
25%
30%
Liquid/ Money
Market
Gilt FMP Other Debt
Schemes
Equity (inc
ELSS)
Direct Channel AUM share (in %) - T15
HDFC MF ICICI Prudential MF Reliance MF Birla Sun Life MF UTI MF
0%
3%
6%
9%
12%
15%
Liquid/ Money
Market
Gilt FMP Other Debt
Schemes
Equity (inc
ELSS)
Direct Channel AUM share (in %) - B15
HDFC MF ICICI Prudential MF Reliance MF Birla Sun Life MF UTI MF

Category Wise Change in Market Share - Big 5
ICRA Online Limited22/05/2015 14
Source: AMFI. Category AUM monthly data pertains to Apr-15
1. Among the top-5 players, ICICI and Birla Sun Life MF registered marginal increase in market share in equities, while in Liquid fund
category, Reliance and Birla Sun Life MF managed to raise their market share by 60.5 and 121 basis points, respectively.
2. Except for ICICI Prudential MF, other 4 AMCs managed to register a marginal rise in their market share in Other Debt fund category.
HDFC
MF
ICICI Pru.
MF
Reliance
MF
Birla Sun
Life MFUTI MF
Liquid -58.65 -93.48 60.52 121.04 -108.32
Equity -25.76 27.49 -4.31 9.72 -7.60
-125
-75
-25
25
75
125
Ch
an
ge i
n B
PS
Market share chg (m-o-m)
HDFC
MF
ICICI
Pru. MF
Reliance
MF
Birla Sun
Life MFUTI MF
FMP 88.38 79.11 62.66 -41.04 48.30
Other Debt 8.14 -5.86 19.94 16.59 1.66
-50
-30
-10
10
30
50
70
90
110
Ch
an
ge i
n B
PS
Market share chg (m-o-m)

Geography wise Analysis
ICRA Online Limited22/05/2015 15
1. Maharashtra alone accounts for more than 42% of the market share
2. Seven states have corpus between Rs 50,000 and Rs 1,10,000 crore
3. The top 15 AMCs hold more than 87% of the market share in Maharashtra with the top 5 alone accounting for over
57% of that
4. The entire distribution is skewed towards one state leaving ample scope for AMCs to increase market share from other
States and Union Territories
5.7%
4.8% 7.1%8.6%
41.9%
0%
5%
10%
15%
20%
25%
30%
35%
40%
45%
0
100,000
200,000
300,000
400,000
500,000
600,000
Gujarat Others Karnataka New Delhi Maharashtra
Shar
e (%
)
AU
M (I
n R
s. c
rore
)
AUM share of top-5 regions
AUM % share (RHS)
Source: AMFI, ICRA Online Research. Data as on Apr-15.
6.2
11.5 11.813.2
14.2
0
2
4
6
8
10
12
14
16
UTI MF Reliance
MF
Birla Sun
Life MF
ICICI
Prudential
MF
HDFC MF
% s
ha
re
% share of top 5 AMCs in Maharashtra
Analytics Group
ICRA Online Limited
Amol Wakekar ([email protected] / 9920665037)
Suman Roy ([email protected] / 9830274008)
ICRA Online Limited22/05/2015 16