ice particles cool-season precipitation types
TRANSCRIPT

4/1/19
1
Winter Storm FundamentalsCool-Season Precipitation:
Fundamentals and Applications
Jim SteenburghFulbright Visiting Professor of Natural Sciences
University of InnsbruckDepartment of Atmospheric Sciences
University of [email protected]
Myoko Kogen, Japan (Photo: Jim Steenburgh)
Learning Objectives• After this class you should– Understand the processes that affect the depth and
height of the transition zone, the height of the snow level, and the development of snow, ice pellets, freezing rain, or freezing drizzle
– Be able to apply top-down forecast approaches for predicting precipitation type
– Understand and apply key meteorological variables affecting the snow-to-liquid ratio during snowstorms
Cool-Season Precipitation Types
Ice Particles• Ice crystal – any one of the number of forms in
which ice appears
• Ice pellet – Transparent or translucent ice pellet less than 5 mm in diameter (sleet in the US)
• Ice pellet aggregate – Individual ice particles linked or fused together
Stewart et al. (2015)
Ice Particles• Refrozen wet snow – partially melted snow that refroze
• Sleet – In the US, this term refers to ice pellets
• Snow – White or translucent ice crystals, chiefly in complex branch hexagonal form and often agglomerated into snowflakes
• Snow pellet – White, opaque, approximately round (sometimes conical) ice particles having a snowlikestructure, about 2-5 mm in diameter (a.k.a. graupel)
Stewart et al. (2015)
h ttp ://p h o to .a ccu w e a th e r.co m /p h o to ga lle ry/d e ta ils/p h o to /121228/Sle e t+ M a cro Ste e n b u rgh (2014) Ste e n b u rgh (2014)
Ice Pellets (sleet) Snow Snow Pellet (Graupel)
Ice Particle Examples

4/1/19
2
Type, Size, and Fall Speed
Courtesy Dr. Masaaki Ishizaka
Example: Sea Effect of Japan
Courtesy Dr. Masaaki Ishizaka
Example: Sea Effect of Japan
Courtesy Dr. Masaaki Ishizaka
Example: Sea Effect of Japan
Courtesy Dr. Masaaki Ishizaka
Mixed-Phase Particles• Wet snow – Snow that contains a great deal of liquid water
• Semimelted snow pellet – Snow pellet that has undergone some melting
• Liquid core pellet – Partially refrozen particle with ice shell and liquid water core
• Almost melted particle – Precipitation composed mainly of liquid water, but with some ice and the shape not discernible
• Typically fall speeds increase as particles melt
Stewart et al. (2015)
Liquid Particles• Drizzle – Very small, numerous, and uniformly distributed water drops with
diameters < 0.5 mm
• Freezing drizzle – Drizzle that falls in liquid form but freezes on impact to form a coating of glaze
• Freezing rain – Rain that falls in liquid for, but freezes on impact to form a coating of glaze
• Rain – Precipitation in the form of liquid water with diameters > 0.5 mm or, if widely scattered, drops may be smaller
• Supercooled rain – Liquid precipitation at temperatures below freezing
• Typical fall speeds for drizzle ~2m/s; freezing rain, rain, or supercooled rain ~7–9 m/s
Stewart et al. (2015)
4/1/19
3
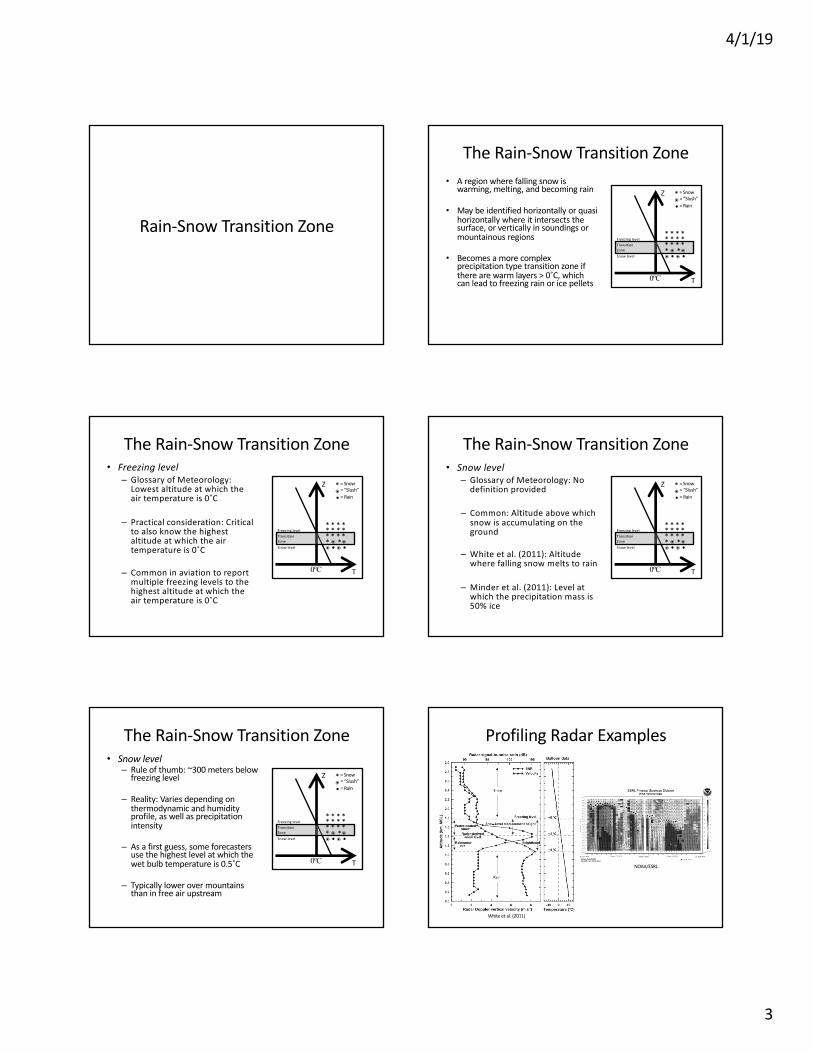
Rain-Snow Transition Zone
The Rain-Snow Transition Zone• A region where falling snow is
warming, melting, and becoming rain
• May be identified horizontally or quasi horizontally where it intersects the surface, or vertically in soundings or mountainous regions
• Becomes a more complex precipitation type transition zone if there are warm layers > 0˚C, which can lead to freezing rain or ice pellets 0ºC
Z
T
Freezing level
Snow level
TransitionZone
* * * ** * * ** * * *
* * ⦿ ⦿● ●⦿ ⦿
*⦿●
= Snow= “Slush”= Rain
The Rain-Snow Transition Zone• Freezing level
– Glossary of Meteorology: Lowest altitude at which the air temperature is 0˚C
– Practical consideration: Critical to also know the highest altitude at which the air temperature is 0˚C
– Common in aviation to report multiple freezing levels to the highest altitude at which the air temperature is 0˚C
0ºC
Z
T
Freezing level
Snow level
TransitionZone
* * * ** * * *
* * * *
* * ⦿ ⦿● ●⦿ ⦿
*⦿●
= Snow= “Slush”
= Rain
The Rain-Snow Transition Zone• Snow level
– Glossary of Meteorology: No definition provided
– Common: Altitude above which snow is accumulating on the ground
– White et al. (2011): Altitude where falling snow melts to rain
– Minder et al. (2011): Level at which the precipitation mass is 50% ice
0ºC
Z
T
Freezing level
Snow level
TransitionZone
* * * ** * * ** * * *
* * ⦿ ⦿● ●⦿ ⦿
*⦿●
= Snow= “Slush”= Rain
The Rain-Snow Transition Zone• Snow level
– Rule of thumb: ~300 meters below freezing level
– Reality: Varies depending on thermodynamic and humidity profile, as well as precipitation intensity
– As a first guess, some forecasters use the highest level at which the wet bulb temperature is 0.5˚C
– Typically lower over mountains than in free air upstream
0ºC
Z
T
Freezing level
Snow level
TransitionZone
* * * ** * * ** * * *
* * ⦿ ⦿● ●⦿ ⦿
*⦿●
= Snow= “Slush”= Rain
Profiling Radar Examples
White et al. (2011)
NOAA/ESRL

4/1/19
4
Diabatic Effects
0ºC
Z
T
Melting creates an isothermal layer
Increased precipitation rates deepen meltinglayer and lower snow level
Evaporation results in temperaturesconverging to wet bulb and lower freezingand snow levels than indicated by solely
by temperature
0ºC
Z
T
Rain/Snow Transition Regions
Dr. Ronald StewartUniversity of Manitoba
2008 AMS/COMET/MSC MountainWeather Workshop
Whistler, British Columbia, Canada
Question
Isothermal layers at 0ºC are normally __________ over topography than over nearby flat regions
a) the same depthb) shallowerc) deeper
Question
An increase in precipitation rate could _______ the height of the base of the transition region
a) raiseb) maintainc) lower
Question
As one ascends the Seegrubenbahn through the transition region, which sequence best describes the change in precipitation particles with increasing altitude
a) snow, wet snow, slush, rainb) rain, slush, wet snow, snowc) slush, rain, snow, wet snowd) rain, wet snow, slush, snow

4/1/19
5
Pathways to Freezing Drizzle (FZDZ), Freezing Rain (FZRA) and
Ice Pellets (IP)
Pathways to FZDZ, FZRA, & IP
• FZDZ: Warm-phase processes (no significant ice nucleation)– Shallow cloud decks forming over arctic airmasses (eastern 2/3 of US)– Cloud top temperatures > -10ºC– Poor ice nucleation– Common in central US
• FZRA: Deep moist layer and midlevel warm (>0ºC) layer– Cold-air damming with overrunning in eastern US– Warm-frontal overrunning in central US– Cold pools, cold-air damming, and terrain-forced flows a factor in western US
• IP: See FZRA, but add deeper/colder surface-based layer enabling refreeze before rain reaches ground
Rauber et al. (2000)
FRZA Climatology: Europe• Discussion: Where and
why are freezing rain events most common in Europe
• In plot– Orange triangles = number
of observed FZRA reports– Circles = stations > 2000 m
(omitted) or < 10 FZRA observations
– Contours – distance from coast
Kämäräinen et al. (2017)
FZRA Climatology
http://mcc.sws.uiuc.edu/living_wx/icestorms/index.html, https://www.reddit.com/r/MapPorn/
• Discussion: In the continental US, why are freezing rain events most common:– In the Columbia Basin
– In the north-central and northeast states?
– East of the southern Appalachian Mountains?
Example Temperature Profiles
0ºC
Z
T 0ºC
Z
T
Freezing Drizzle
Poor ice nucleation+ warm-phase processes
Sleet
Snow melts in >0˚C layer;Rain refreezes before
reaching ground
Cloud top
0ºC
Z
T
Freezing Rain
Snow melts in >0˚C layer; Rain doesn’t refreeze until
contacting ground or other objects
Transition Zone with Melting Layer Aloft
NOAA/NWS

4/1/19
6
You Decide: FZDZ or FZRA?
Rauber et al. (2000)
95.4% Freezing Drizzle4.6% Freezing Rain
Warm rain processes dominate
You Decide: FZDZ or FZRA?
Rauber et al. (2000)
83.8% Freezing Drizzle16.2% Freezing Rain
Warm rain processes dominate
You Decide: FZDZ or FZRA?
Rauber et al. (2000)
72.3% Freezing Drizzle27.7% Freezing Rain
Warm rain processes dominate
You Decide: FZDZ or FZRA?
Rauber et al. (2000)
62.4% Freezing Drizzle37.6% Freezing Rain
Warm rain processes likely important
You Decide: FZDZ or FZRA?
Rauber et al. (2000)
53.1% Freezing Drizzle46.8% Freezing Rain
Warm rain processes likely important in some cases, ice particles falling into cloud from aloft possible
You Decide: FZDZ or FZRA?
Rauber et al. (2000)
21.5% Freezing Drizzle78.5% Freezing Rain
Melting of snow from aloft likely dominates

4/1/19
7
Top Down Forecasting• A way to assess what hydrometeors will form and
their evolution as they fall to the surface
• Frequently based on model or observed soundings
• Start at cloud top– Mixed phase or warm phase processes?
• CTT ~ -4˚C: Little or no ice• CTT ~ -10˚C: Commonly used cutoff temp for warm phase
– Beware of seeder-feeder from higher clouds
NWSFO, Louisville, KY
Top Down Forecasting
• Diagnose potential for melting and freezing during fallout–Melting in warm layer?– Freezing in near-surface sub-freezing layer?– Consider diabatic effects (melting, evaporation)
• What precipitation will occur at the surface– Snow, FZRA, FZDZ, IP?
NWSFO, Louisville, KY
You Decide: SN, FZDZ, FZRA, or IP?
NWSFO, Louisville, KY
You Decide: SN, FZDZ, FZRA, or IP?
NWSFO, Louisville, KY
You Decide: SN, FZDZ, FZRA, or IP?
What if elevated convection develops?NWSFO, Louisville, KY
You Decide: SN, FZDZ, FZRA, or IP?
NWSFO, Louisville, KY

4/1/19
8
Snow Levels in Mountainous Terrain
Questions
Compared to the free atmospheric upstream, the snow level over the mountains is usually
a) the same heightb) lowerc) higher
Why?
The Mountainside Snow Level
• Compared to free air upstream, usually near mountains the– Freezing level is lower– Bright-band is deeper– Snow level is lower
Marwitz (1983), Minder et al. (2011)
The Mountainside Snow Level• Compared to free air
upstream, usually near mountains the– Freezing level is lower– Bright-band is deeper– Snow level is lower
Medina et al. (2005), Minder et al. (2011)
Mechanisms
Minder et al. (2011)
• Latent cooling from melting precipitation– More effective over mountains where ground limits
depth of convective overturning – Precipitation rates frequently higher over mountains
• Microphysical melting distance– Ice crystals over mountains comprised in a way that
they take longer to melt (e.g., denser, more rimed)
• Adiabatic cooling from forced ascent
Idealized Modeling
Each of these mechanisms makes important contributions(δ)Qad = Change in snow level from adiabatic cooling
(δ)Qmelt = Change in snow level from latent cooling of precipitation(δ)Dmelt = Change in snow level from microphysical melting distance
Snow level from control
Snow level from simulation without latent coolingFreezing level from control
Freezing level from simulation without latent cooling
Minder et al. (2011)

4/1/19
9
Additional Details from Modeling• Magnitude of snow level decrease depends on
characteristics of incident flow and terrain geometry
• Depression of snow level increases with increasing temperature– Might act as a modest buffer for mountain hydroclimates
against global warming
• Results dependent on cloud microphysics parameterization– An important source of uncertainty
Minder et al. (2011)
Snow-to-Liquid Ratio (SLR)
Definition• Snow-to-liquid ratio (SLR) = New snow depth /
New snow water equivalent (SWE)
• Related measures include snow density, water content, and specific gravity– snow density = ρwater / SLR– water content (%) = 100/SLR– specific gravity = 1/SLR (rarely used)
SLR vs. Related MeasuresHeavy Average Light
SLR 7:1 14:1 25:1
Snow density 143 kg m-3 71 kg m-3 40 kg m-3
Water content 14.3% 7.1% 4.0%
Snow character
“Sierra cement”
Utah average
“Champagne powder”
Low SLRHigh Density
High SLRLow Density
Why Is SLR Important?• Contemporary winter precipitation forecasting
typically involves three steps:– Quantitative precipitation forecast (QPF)– Determination of precipitation type– Application of SLR when precipitation type is snow
• Snowfall amount = QPF x SLR
Why Is SLR Important?• Snow clearing operations often based on specific
amount thresholds, where perfect QPF is of limited value if a poor SLR is applied
• In avalanche forecasting, SLR is related to snow shear strength (Casson 2008)
• Accurate SLR and snowfall amount forecasts are critical for mountain communities

4/1/19
10
The Problem with SLR
• Daily SLR varies considerably in both space and time within storms
• Forecast snowfall amount strongly dependent on SLR
• How much snow from a QPF of 25 mm?
3:1 10:1 30:1
Discussion: What Controls SLR?
• Crystal type and size
• Riming
• Aggregation
• Wind
• Melting or sublimation (in atmosphere or at
surface)
• Vapor pressure gradient-driven metamorphosism
and/or external compaction (i.e., settlement on
the ground)
Crystal Type and SLR
25:1-100:1
12:1
12:1
15:1
10:110:1
20:1
10:1
Image: snowcrystals.com; SLR based on Power et. al. 1964, Dubé 2003, Cobb 2006
Riming and SLR50:1 20:1 5:1
snowcrystals.com
• Riming can decrease SLR by up to 90%.• Most important for temperatures above −10ºC; supercooled
water more likely to be present• Tends to increase with vertical velocity
Surface Winds and SLR• Strong winds cause snow crystals to be
dislodged and roll along the surface, removing outer features and decreasing SLR.
• Snow transport begins at speeds of 8-10 m s-1.
15:1 4:1
Forecasting – The 10:1 Rule• “Convenient” but innaccurate approach of multiplying
QPF by 10
• Inaccuracy known in the 19th century!– “…assuming 10 inches of snow to 1 of water or some other
factor, is subject to a large range of error because of the wide variability of this ratio for different kinds of snow.”
– Report of the Chief Signal Officer, 1888

4/1/19
11
SLR Climatology
Baxter et al. (2005)
10:1 not even a good estimate of mean in many areas!Discussion: Why is the SLR lowest along the coasts and in the southand highest over the western interior and near the Great Lakes?
Improving on the 10:1 Rule
• Empirical techniques have been developed, relying on surface or in-cloud temperature
• However, many of these techniques have not been verified and challenges remain
• Temperature is one of the strongest predictors, but still only explains about 25-40% of the variance
SLR Temperature Relationship
5:1
5:1
10:1
6.7:1
20:1
SLR vs. 700-mb temperature @ Central Sierra Snow Lab (Diamond and Lowry 1954)
R=.64
SLR Temperature Relationship
5:110:1
6.7:1
20:1
5:1
SLR vs. Surface temperature @ Weissfluhjoch, Davos (Bossolasco 1954)
Group Discussion
Why is the SLR largest at about -12˚C?
(Values increase downward)
SLR @ Alta, UT
Strongest RelationshipWith T
Correlation nearlyconstant with
height (unusual?)
Alcott and Steenburgh (2010)
SLR @ Alta, UT
Salt Lake City
Great Salt Lake

4/1/19
12
SLR @ Alta, UT
Alcott and Steenburgh (2010)
> 25:1 = “Wild Snow”
Prediction @ Alta
• Stepwise Multiple Linear Regression to observed data, then apply to NWP output
• Key variables: Temperature, wind speed, RH, wind direction at multiple levels, plus SWE
Improvement over other methods, but still scatterAlcott and Steenburgh (2010)
Other Methods• Look up tables
• Neural network approaches (Roebberet al. 2003)– Arguably a “smarter”
version of SMLR approach
• Flowcharts (Dubé2003)
SLR Summary• Poor data poses a challenge
• Many methods are ad hoc
• Best methods are probably point specific and based on a long training dataset
• Methods that can be applied broadly geographically are elusive
• Good luck!
References• Abbe, C., 1888: Appendix 46. 1887 Annual report of the Chief Signal Officer of the Army under the direction of Brigadier-General A. W. Greely, U.S.
Govt. Printing Office, Washington, DC, 385-386.• Alcott, T. I., and W. J. Steenburgh, 2010: Snow-to-liquid ratio variability and prediction at a high-elevation site in Utah’s Wasatch Mountains. Wea.
Forecasting, 25, 323-337.• Baxter, M. A., C. E. Graves, and J. T. Moore, 2005: A climatology of snow-to-liquid ratio for the contiguous United States. Wea. Forecasting, 20, 729-
744.• Bossolasco, M., 1954: Newly fallen snow and air temperature. Nature, 174, 362-363.• Cobb, D. K., and J. S. Waldstreicher, 2005: A simple physically based snowfall algorithm. Preprints, 21st Conf. on Weather Analysis and Forecasting
and 17th Conf. on Numerical Weather Prediction, Washington, DC, Amer. Meteor. Soc., 2A.2. Available at https://ams.confex.com/ams/WAFNWP34BC/techprogram/paper_94815.htm.
• Diamond, M., and W. P. Lowry, 1954: Correlation of density of new snow with 700-millibar temperature. J. Meteor., 11, 512-513.• Dubé, I., cited 2008: From mm to cm…: Study of snow/liquid water ratios in Quebec. Meteorological Service of Canada, Quebec, QC, Canada.
[Available online at http://www.meted.ucar.edu/norlat/snowdensity/from_mm_to_cm.pdf.]• Kämäräinen, M., O. Hyvärinen, K. Jylhä, A. Vajda, S. Neiglick, J. Nuottokari, and H. Gregow, 2017: A method to estimate freezing rain climatology from
ERA-Interim reanalysis over Europe. Nat. Hazards Earth Syst. Sci., 17, 243-259.• Minder, J. R., D. R. Durran, and G. H. Roe, 2011: Mesoscale controls on the mountainside snow line. J. Atmos. Sci., 68, 2107-2127.• NWSFO, Lousville, KY, Unknown: Precipitation type forecasting. Available at http://www.crh.noaa.gov/Image/lmk/Precip-Type-Fcstg_Top-Down.pdf.• Rauber, R. M., L. S. Olthoff, M. K. Ramamurthy, and K. E. Kunkel, 2000: The relative importance of warm rain and melting processes in freezing
precipitation events. J. Appl. Meteor., 39, 1185-1195.• Roebber, P.J., S.L. Bruening, D.M. Schultz, and J.V. Cortinas, 2003: Improving snowfall forecasting by diagnosing snow density. Wea. Forecasting, 18,
264–287. • Stewart, R., 2008: Rain/Snow Transition Regions. Oral Presentation, AMS/COMET/MSC Mountain Weather Workshop, Whistler, British Columbia,
Canada. Available at http://www.meted.ucar.edu/norlat/mtnwxworkshop/lectures.htm.• Stewart, R. E., J. M. Theriault, and W. Henson: On the characteristics of and processes producing winter precipitation types near 0˚C. Bull. Amer.
Meteor. Soc., 96, 623-639.