cool-season regime transition and its impact on northeast precipitation heather archambault heather...
Post on 21-Dec-2015
220 views
TRANSCRIPT
Cool-Season Regime Transition and its Cool-Season Regime Transition and its Impact on Northeast PrecipitationImpact on Northeast Precipitation
Heather ArchambaultHeather ArchambaultLance Bosart, Daniel Keyser, Anantha Aiyyer Lance Bosart, Daniel Keyser, Anantha Aiyyer
NWS Focal Point: Rich GrummNWS Focal Point: Rich Grumm
3 November 20043 November 2004
Department of Earth and Atmospheric Sciences, Department of Earth and Atmospheric Sciences,
University at Albany, State University of New YorkUniversity at Albany, State University of New York
Research MotivationResearch Motivation
• Meteorological wisdom: increased threat of a Meteorological wisdom: increased threat of a major storm during largemajor storm during large––scale regime scale regime transitiontransition
• Past research points to a connection between Past research points to a connection between synoptic-scale cyclogenesis and synoptic-scale cyclogenesis and reconfiguration of the planetary-scale flow reconfiguration of the planetary-scale flow (e.g. Colucci 1985)(e.g. Colucci 1985)
• Dave Groenert (CSTAR, 2002) documented Dave Groenert (CSTAR, 2002) documented an apparent tendency for increased an apparent tendency for increased precipitation in the Northeast during phase precipitation in the Northeast during phase transitions of the North Atlantic Oscillationtransitions of the North Atlantic Oscillation
Presentation OverviewPresentation Overview
• Research methodologyResearch methodology
• Statistical look at cool-season (Nov Statistical look at cool-season (Nov –– Apr) Apr) weather regime transitions and Northeast weather regime transitions and Northeast precipitation anomaliesprecipitation anomalies
• Composite analyses of one kind of regime Composite analyses of one kind of regime transitiontransition
• 4 weather regimes were defined using 4 weather regimes were defined using teleconnection indices:teleconnection indices:
+ NAO+ NAO – – NAONAO
+ PNA + PNA –– PNA PNA
• Only extreme events were used Only extreme events were used (Index anomaly (Index anomaly ≥ ≥ |1 standard deviation|)|1 standard deviation|)
Objectively Defining a “Weather Regime”Objectively Defining a “Weather Regime”
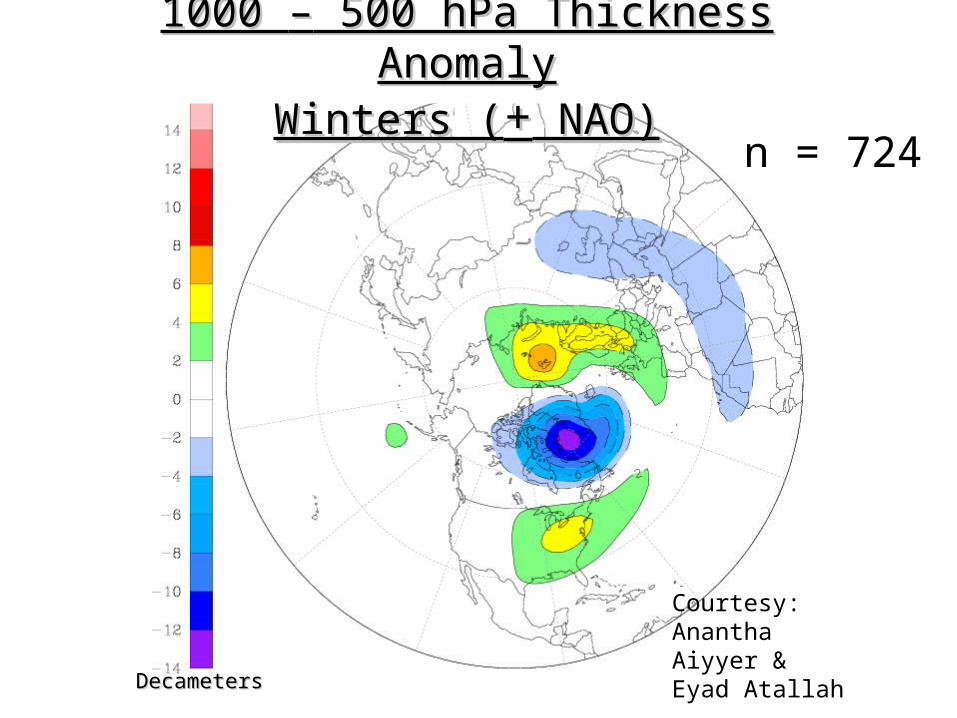
Courtesy: Anantha Aiyyer & Eyad Atallah
DecametersDecameters
1000 1000 –– 500 hPa Thickness Anomaly 500 hPa Thickness AnomalyWinters (Winters (++ NAO) NAO)
n = 724
Courtesy: Anantha Aiyyer & Eyad Atallah
DecametersDecameters
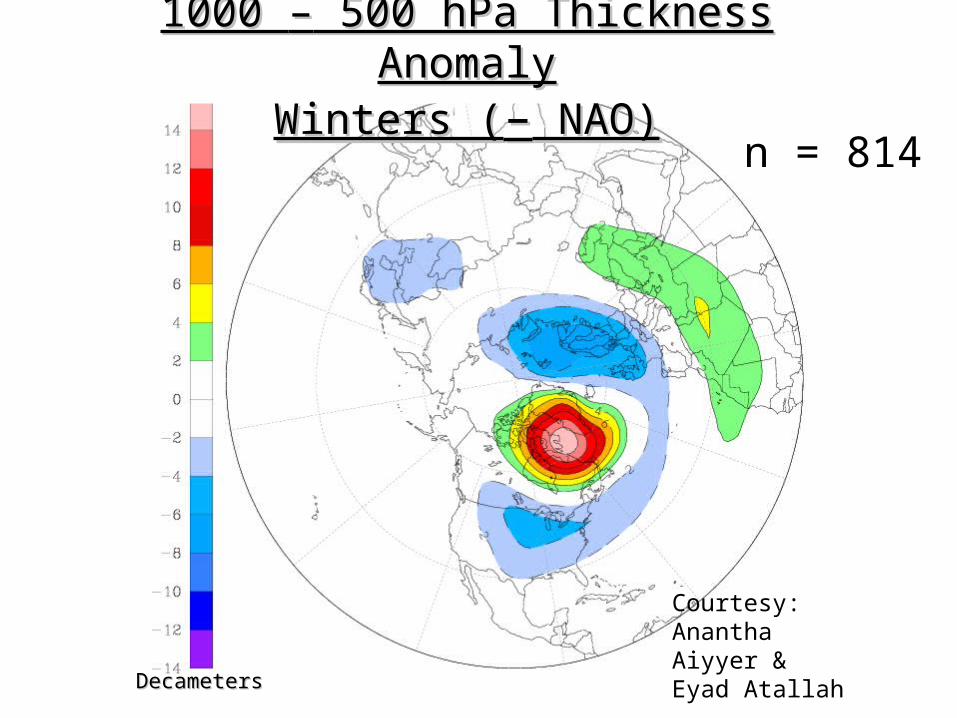
1000 1000 –– 500 hPa Thickness Anomaly 500 hPa Thickness AnomalyWinters (Winters (–– NAO) NAO)
n = 814
Courtesy: Anantha Aiyyer & Eyad Atallah
DecametersDecameters
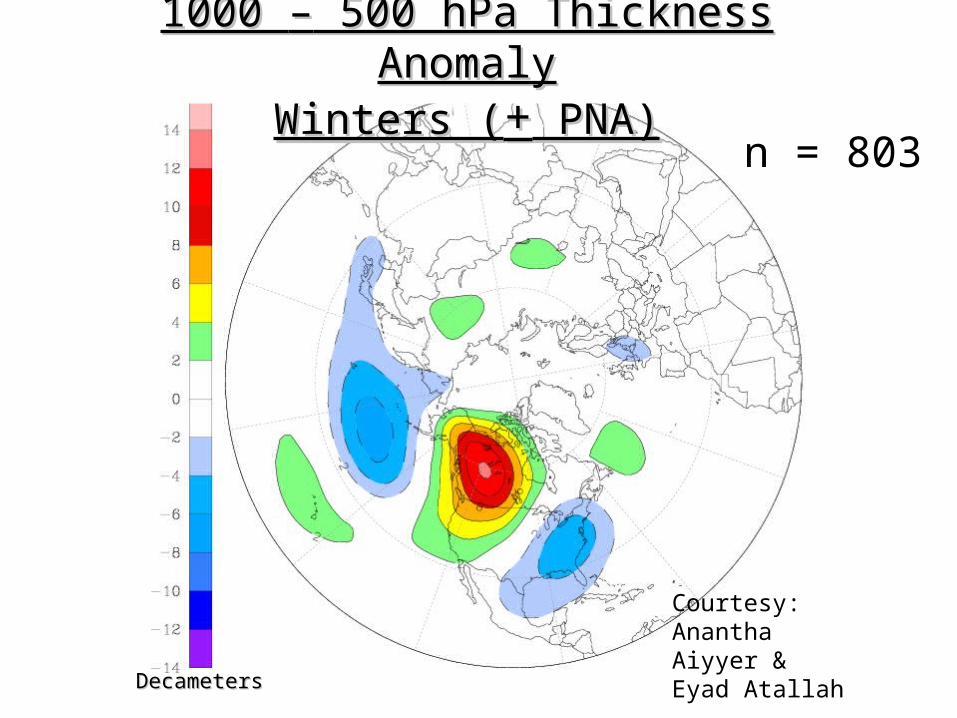
1000 1000 –– 500 hPa Thickness Anomaly 500 hPa Thickness AnomalyWinters (Winters (++ PNA) PNA)
n = 803
Courtesy: Anantha Aiyyer & Eyad Atallah
DecametersDecameters
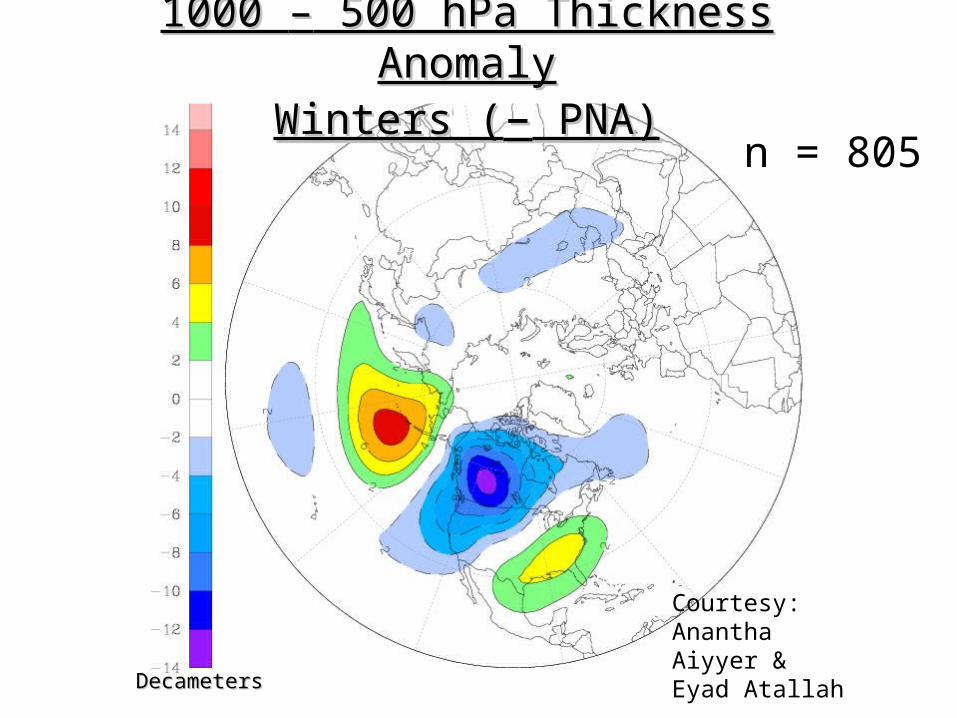
1000 1000 –– 500 hPa Thickness Anomaly 500 hPa Thickness AnomalyWinters (Winters (–– PNA) PNA)
n = 805
Defining a Weather Regime ChangeDefining a Weather Regime Change
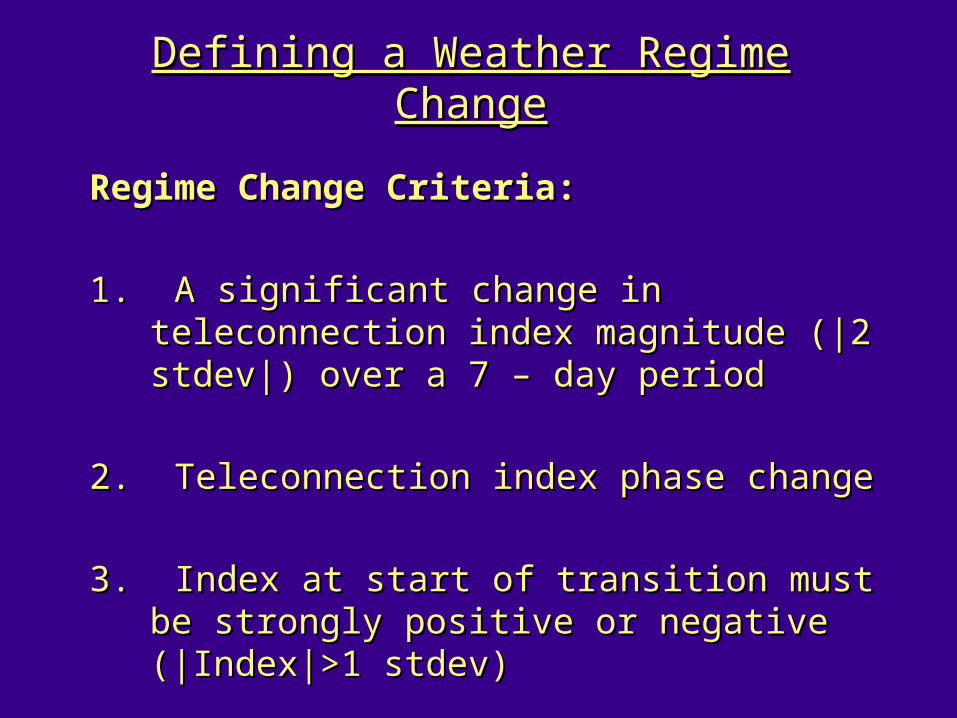
Regime Change Criteria:Regime Change Criteria:
1. A significant change in teleconnection index 1. A significant change in teleconnection index magnitude (|2 stdev|) over a 7 magnitude (|2 stdev|) over a 7 –– day period day period
2. Teleconnection index phase change 2. Teleconnection index phase change
3. Index at start of transition must be strongly 3. Index at start of transition must be strongly positive or negative (|Index|>1 stdev)positive or negative (|Index|>1 stdev)
Creating a Teleconnection Index DatabaseCreating a Teleconnection Index Database
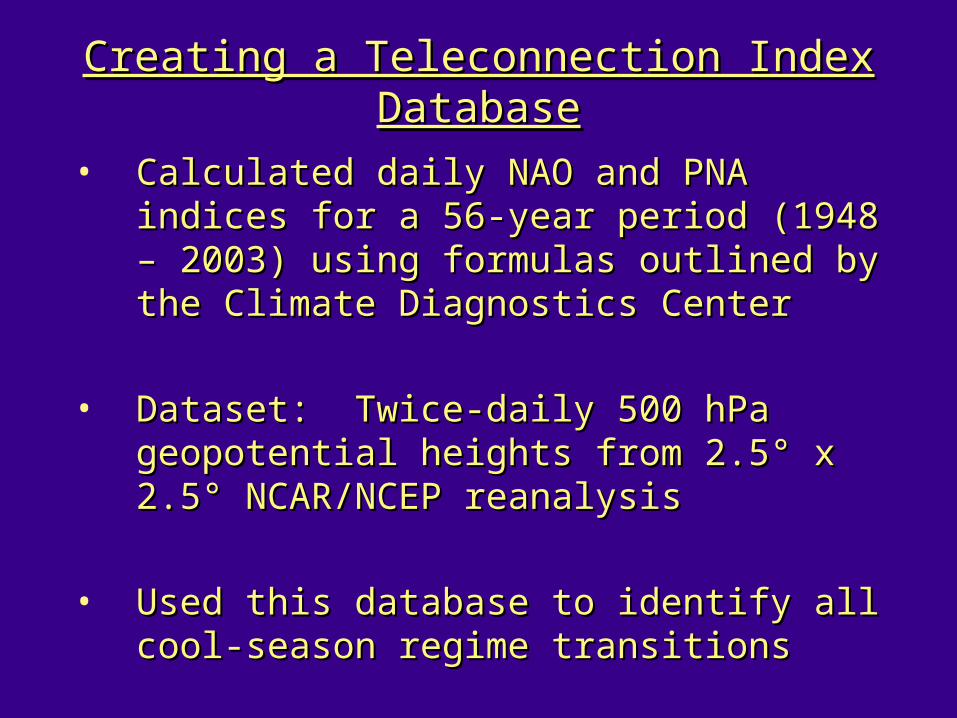
• Calculated daily NAO and PNA indices for a Calculated daily NAO and PNA indices for a 56-year period (1948 56-year period (1948 –– 2003) using formulas 2003) using formulas outlined by the Climate Diagnostics Centeroutlined by the Climate Diagnostics Center
• Dataset: Twice-daily 500 hPa geopotential Dataset: Twice-daily 500 hPa geopotential heights from 2.5heights from 2.5°° x 2.5 x 2.5°° NCAR/NCEP NCAR/NCEP reanalysisreanalysis
• Used this database to identify all cool-Used this database to identify all cool-season regime transitionsseason regime transitions
Creating a Northeast Precipitation IndexCreating a Northeast Precipitation Index
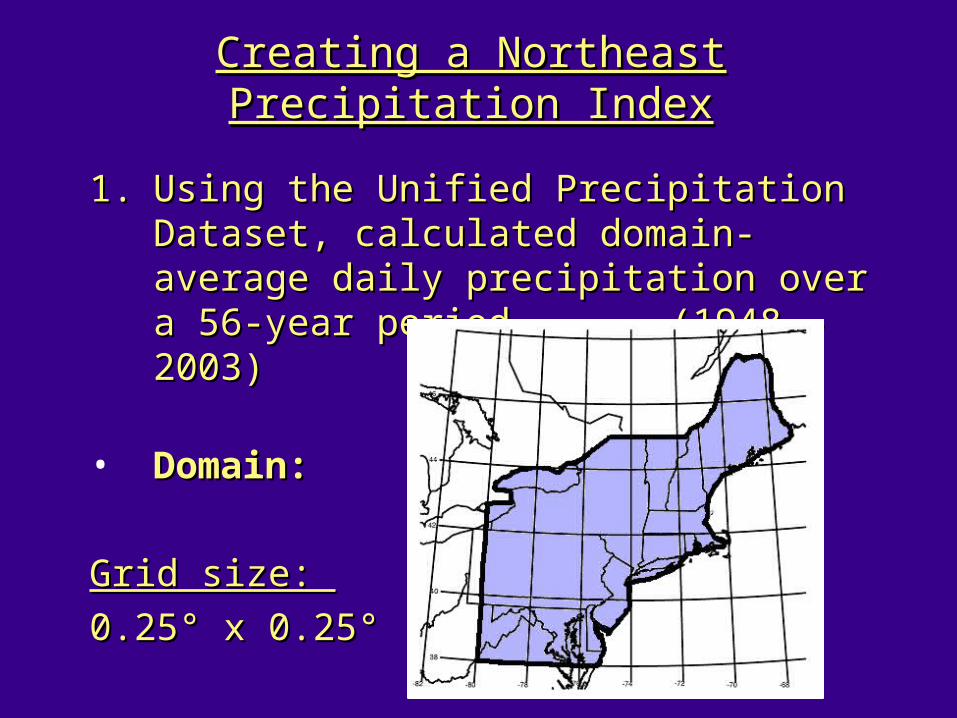
1.1. Using the Unified Precipitation Dataset, Using the Unified Precipitation Dataset, calculated domain-average daily precipitation calculated domain-average daily precipitation over a 56-year period over a 56-year period (1948 (1948 ––2003) 2003)
• Domain:Domain:
Grid size: Grid size:
0.250.25° x 0.25°° x 0.25°
Creating a Northeast Precipitation IndexCreating a Northeast Precipitation Index
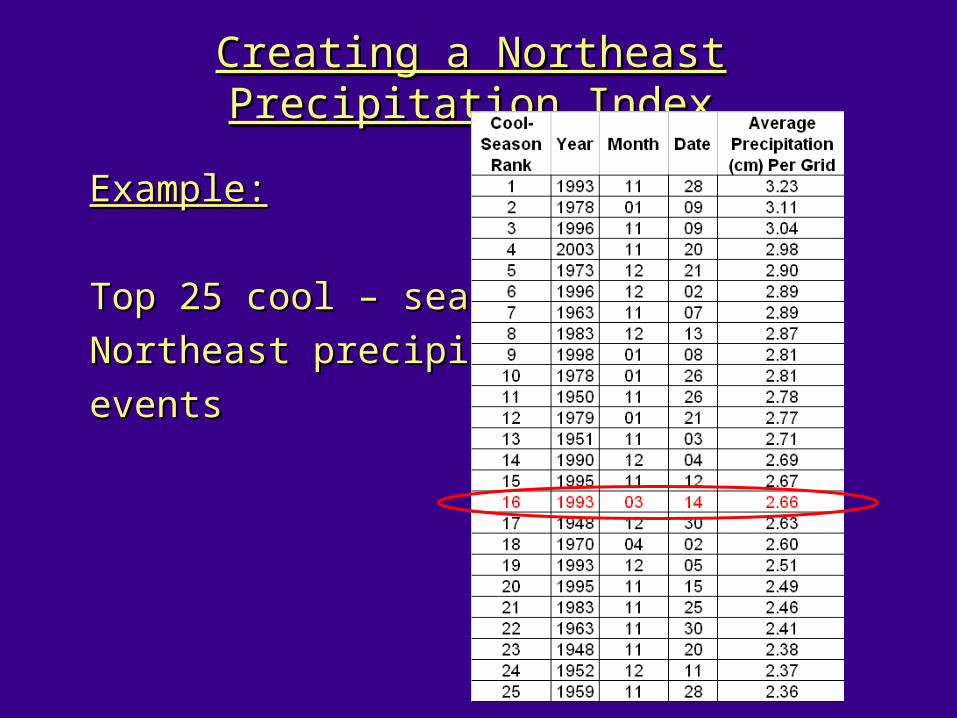
Example:Example:
Top 25 cool Top 25 cool –– season season
Northeast precipitation Northeast precipitation
eventsevents
Creating a Northeast Precipitation IndexCreating a Northeast Precipitation Index
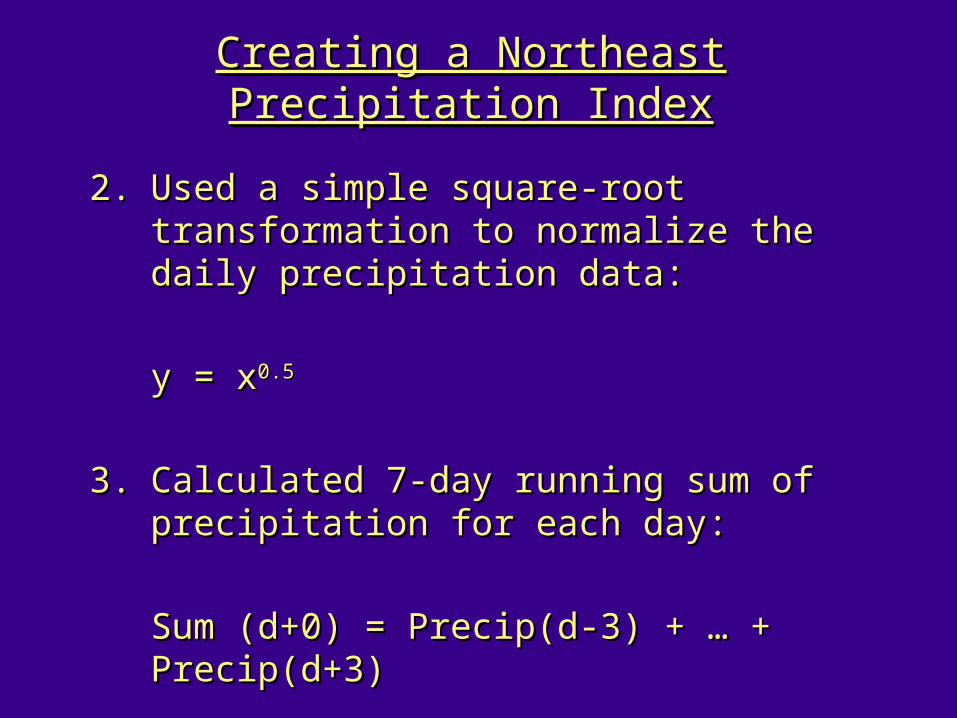
2.2. Used a simple square-root transformation to Used a simple square-root transformation to normalize the daily precipitation data:normalize the daily precipitation data:
y = y = xx0.50.5
3.3. Calculated 7-day running sum of Calculated 7-day running sum of precipitation for each day: precipitation for each day:
Sum (d+0) = Precip(d-3) + … + Precip(d+3) Sum (d+0) = Precip(d-3) + … + Precip(d+3)
Creating a Northeast Precipitation IndexCreating a Northeast Precipitation Index
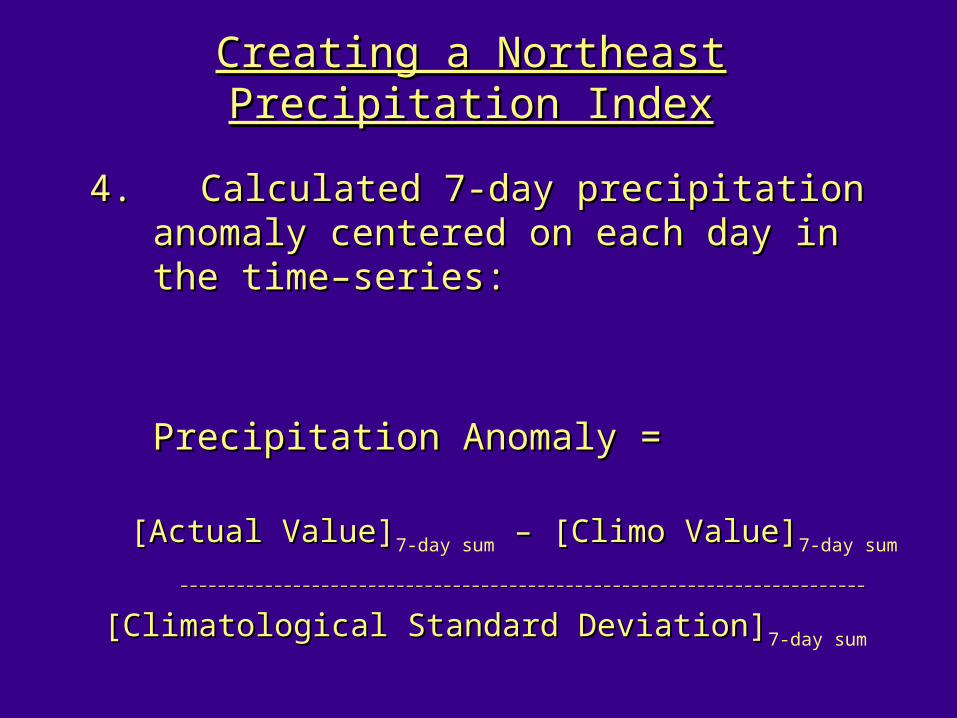
4. Calculated 7-day precipitation anomaly 4. Calculated 7-day precipitation anomaly centered on each day in the timecentered on each day in the time––series:series:
Precipitation Anomaly = Precipitation Anomaly =
[Actual Value][Actual Value]7-day sum – [Climo Value] – [Climo Value]7-day sum
––––––––––––––––––––––––––––––––––––––––––––––––––––––––––––––––––––––––––––––––––––––––––––––––––––––––––––––––––––––––––––––––––––––––––––––––––
[Climatological Standard Deviation][Climatological Standard Deviation]7-day sum
The NAO and Northeast PrecipitationThe NAO and Northeast Precipitation

The NAO and Northeast PrecipitationThe NAO and Northeast Precipitation
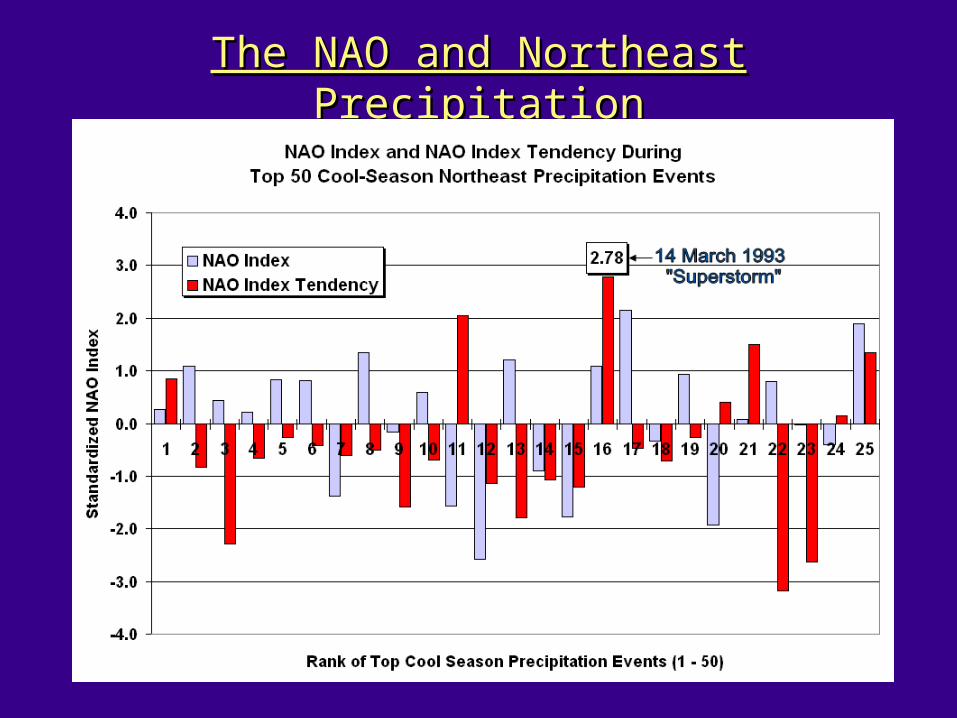
• The phase of the NAO does not appear to be The phase of the NAO does not appear to be correlated with Northeast precipitationcorrelated with Northeast precipitation
• The The tendencytendency of the NAO may be correlated of the NAO may be correlated with Northeast precipitationwith Northeast precipitation18 of 25 top Northeast precipitation events: 18 of 25 top Northeast precipitation events:
negative NAO tendenciesnegative NAO tendencies
average NAO tendency: -0.45 over 7 daysaverage NAO tendency: -0.45 over 7 days
• Illustrates the motivation behind this researchIllustrates the motivation behind this research
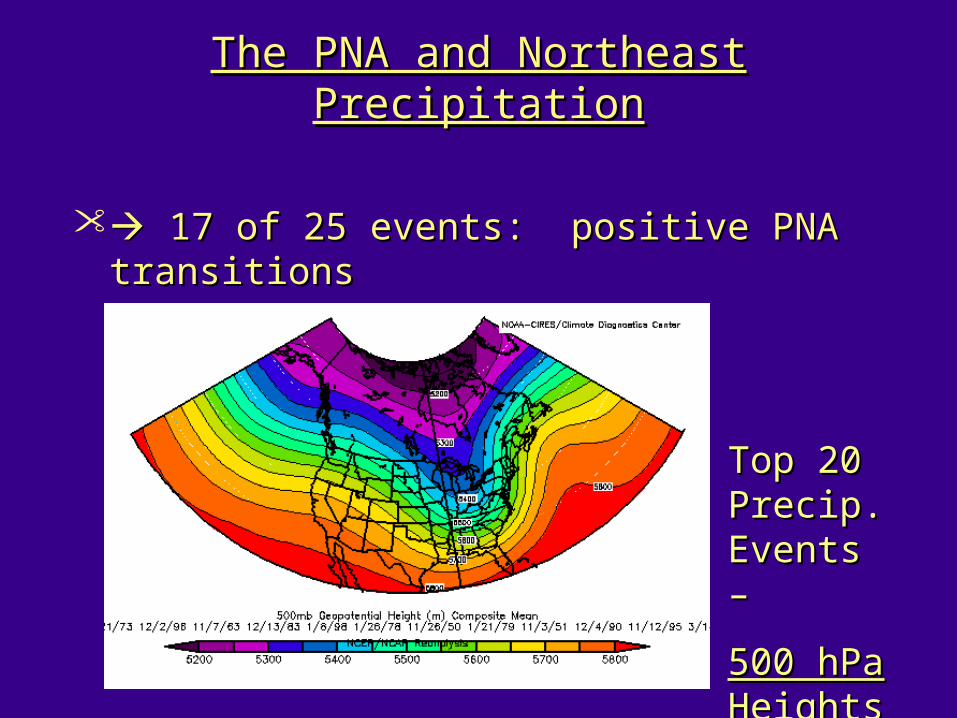
The PNA and Northeast PrecipitationThe PNA and Northeast Precipitation
The PNA and Northeast PrecipitationThe PNA and Northeast Precipitation
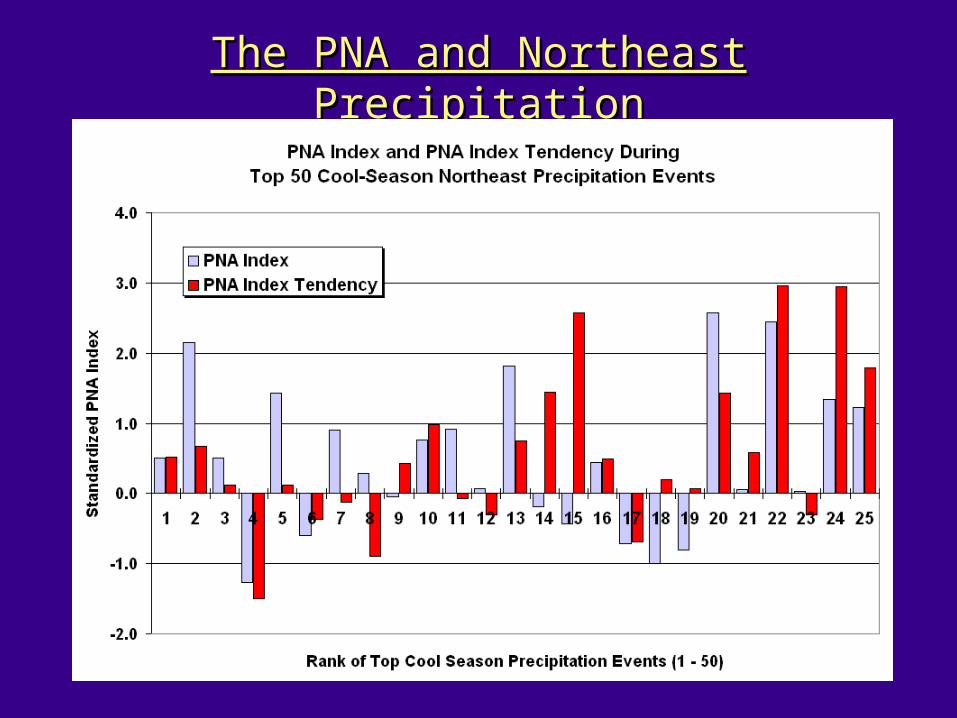
17 of 25 events: positive PNA transitions17 of 25 events: positive PNA transitions
Top 20 Top 20 Precip. Precip. Events –Events –
500 hPa 500 hPa HeightsHeights
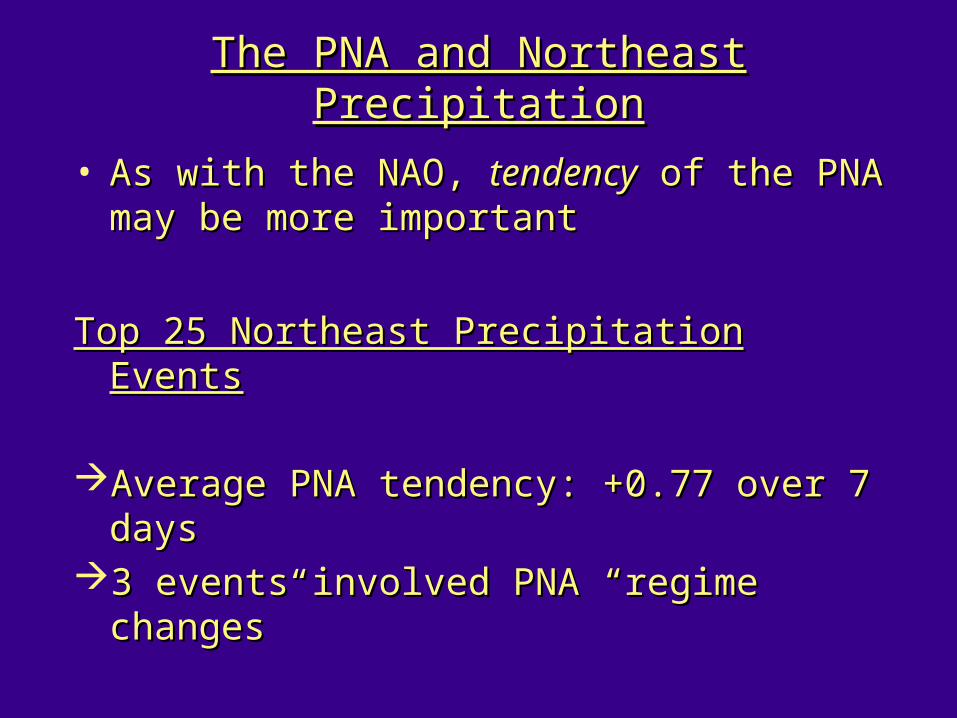
The PNA and Northeast PrecipitationThe PNA and Northeast Precipitation
• As with the NAO, As with the NAO, tendencytendency of the PNA may be of the PNA may be more importantmore important
Top 25 Northeast Precipitation EventsTop 25 Northeast Precipitation Events
Average PNA tendency: +0.77 over 7 daysAverage PNA tendency: +0.77 over 7 days3 events involved PNA “regime changes” 3 events involved PNA “regime changes”
Regime Change and Northeast PrecipitationRegime Change and Northeast Precipitation
• Looked at teleconnection indices during major Looked at teleconnection indices during major Northeast precipitation eventsNortheast precipitation events
• Now, another perspective:Now, another perspective:
• What is climatological Northeast precipitation What is climatological Northeast precipitation anomaly during cool-season regime change?anomaly during cool-season regime change?
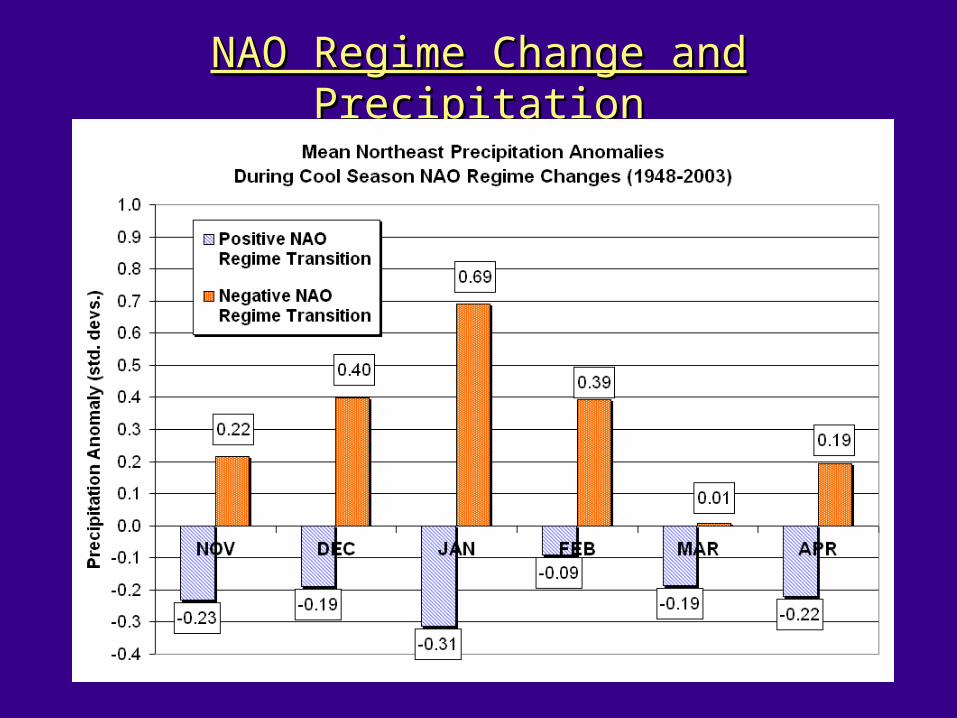
NAO Regime Change and PrecipitationNAO Regime Change and Precipitation
NAO Regime Change and PrecipitationNAO Regime Change and Precipitation
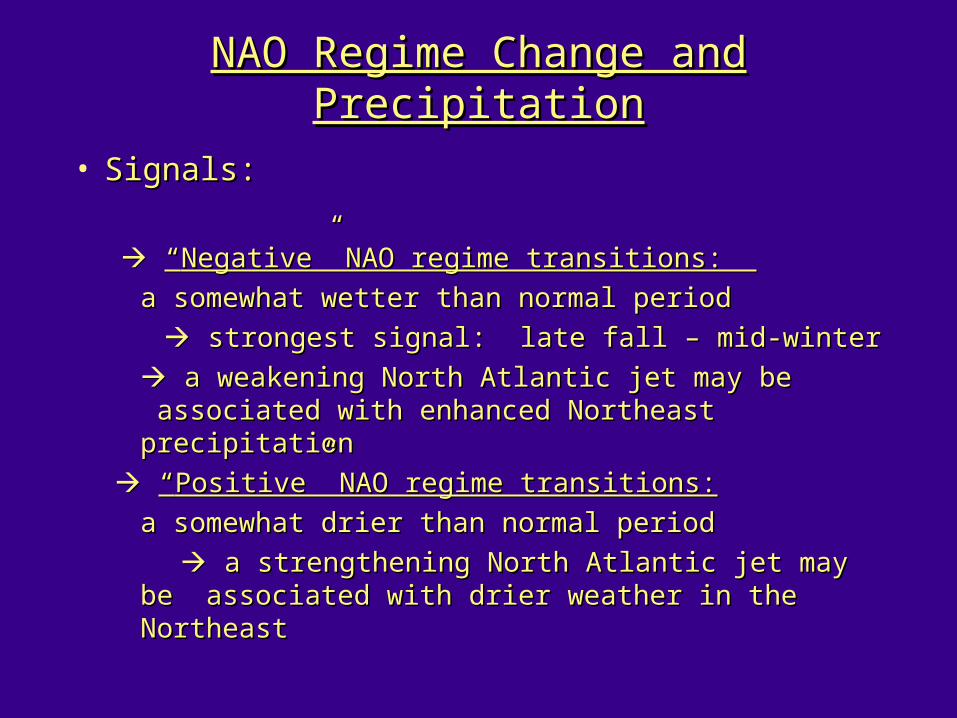
• Signals: Signals:
““Negative” NAO regime transitions: Negative” NAO regime transitions:
a somewhat wetter than normal perioda somewhat wetter than normal period
strongest signal: late fall – mid-winterstrongest signal: late fall – mid-winter
a weakening North Atlantic jet may be a weakening North Atlantic jet may be associated with enhanced Northeast precipitationassociated with enhanced Northeast precipitation
““Positive” NAO regime transitions:Positive” NAO regime transitions:
a somewhat drier than normal perioda somewhat drier than normal period
a strengthening North Atlantic jet may be a strengthening North Atlantic jet may be associated with drier weather in the Northeastassociated with drier weather in the Northeast
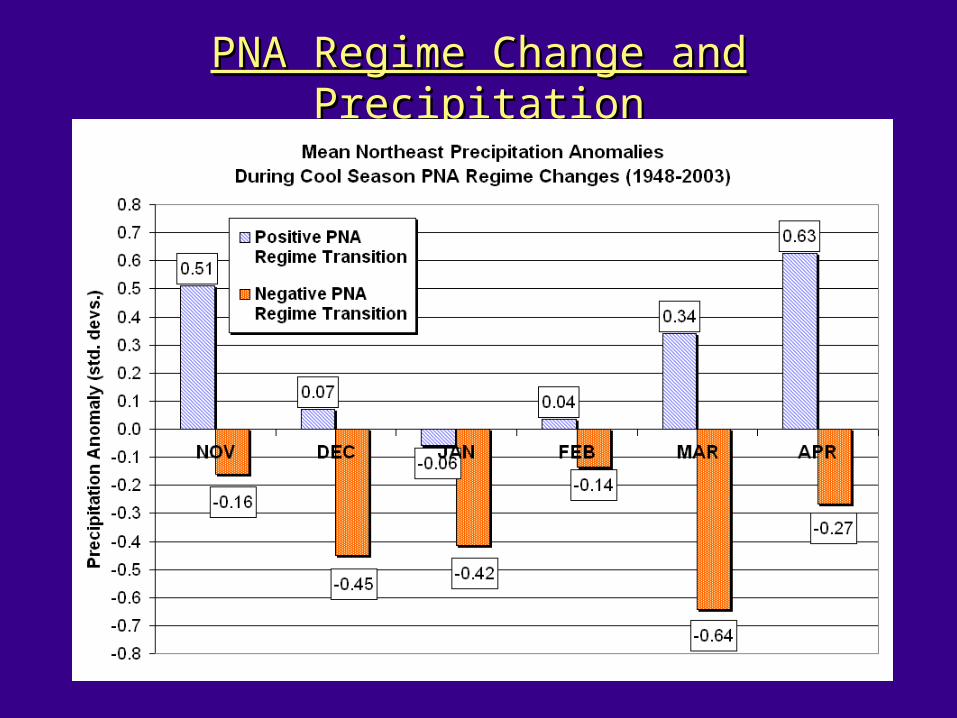
PNA Regime Change and PrecipitationPNA Regime Change and Precipitation

PNA Regime Change and PrecipitationPNA Regime Change and Precipitation
Signals:Signals:
““Positive” PNA regime transitions: Positive” PNA regime transitions:
in Fall and Spring, tend to have enhanced in Fall and Spring, tend to have enhanced precipprecip
Neither + nor – PNA transitions are associated with Neither + nor – PNA transitions are associated with enhanced precipitation in Winterenhanced precipitation in Winter
““Negative” PNA regime transitions:Negative” PNA regime transitions:
a drier than normal perioda drier than normal period
associated with a building ridge in the Eastassociated with a building ridge in the East
Composite AnalysesComposite Analyses
• Goal: analyze forcing for ascent during Goal: analyze forcing for ascent during negative NAO regime transitions occurring in negative NAO regime transitions occurring in November, December, and January November, December, and January
• Only included regime transitions that were Only included regime transitions that were exactly 7 days long: 20 cases exactly 7 days long: 20 cases
Analyses don’t contain the most extreme Analyses don’t contain the most extreme regime transitionsregime transitions
Composite AnalysesComposite Analyses
• Sutcliffe approximation of omega:Sutcliffe approximation of omega:
advection of vorticity by the thermal wind advection of vorticity by the thermal wind (shown by 1000-500 hPa thickness)(shown by 1000-500 hPa thickness)
1.
2.
3.
4.
5.
6.
7.
8.
9.
10.
11.
12.
13.
14.
15.
16.
17.
18.
19.
20.
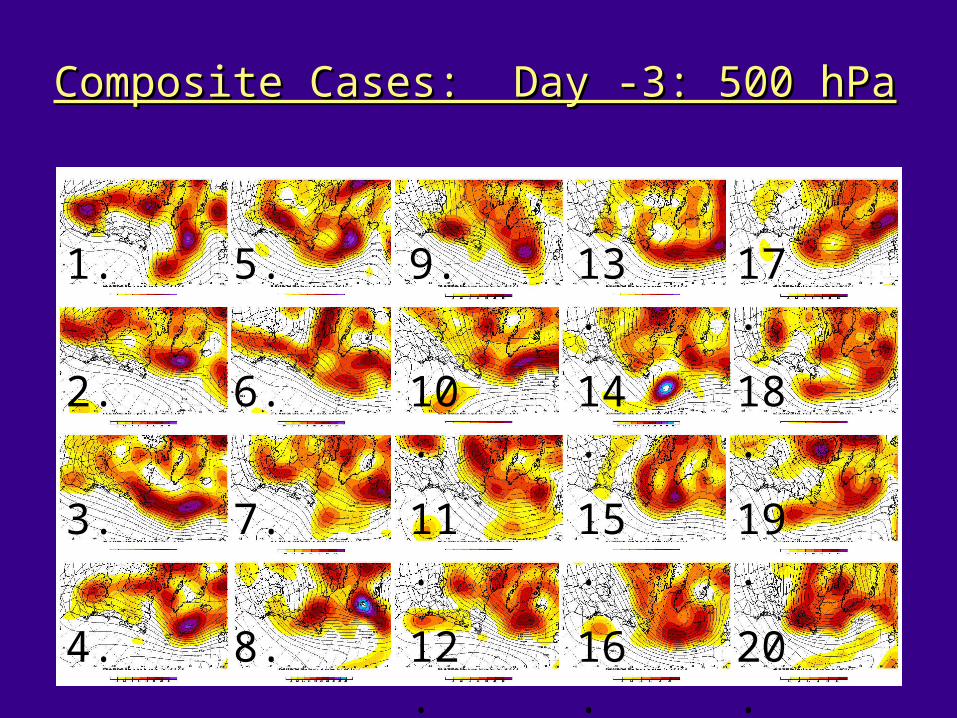
Composite Cases: Day -3: 500 hPaComposite Cases: Day -3: 500 hPa
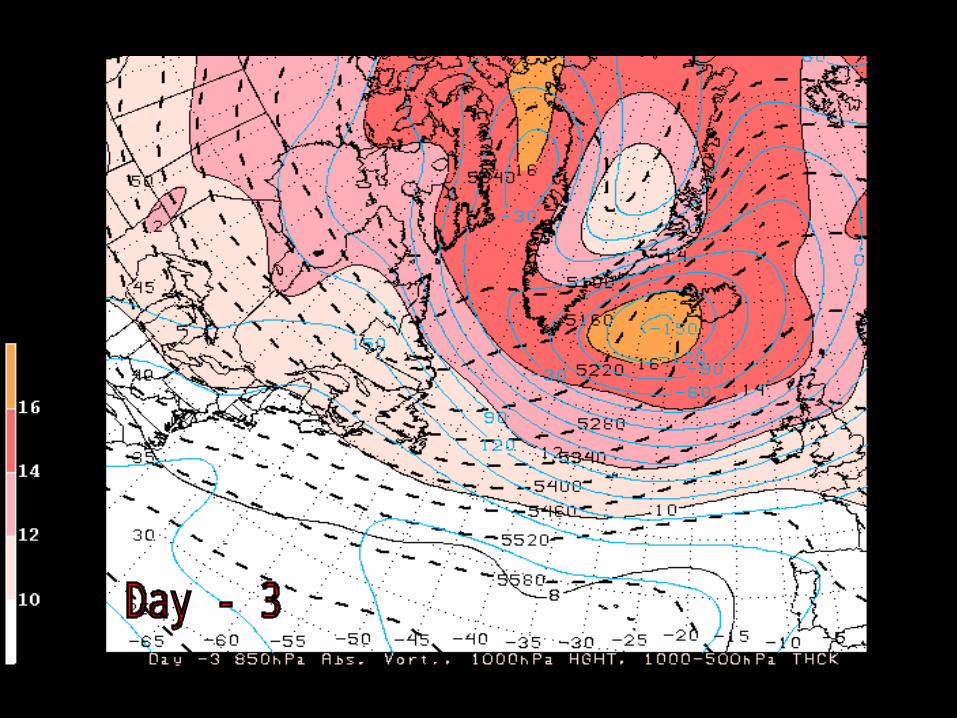

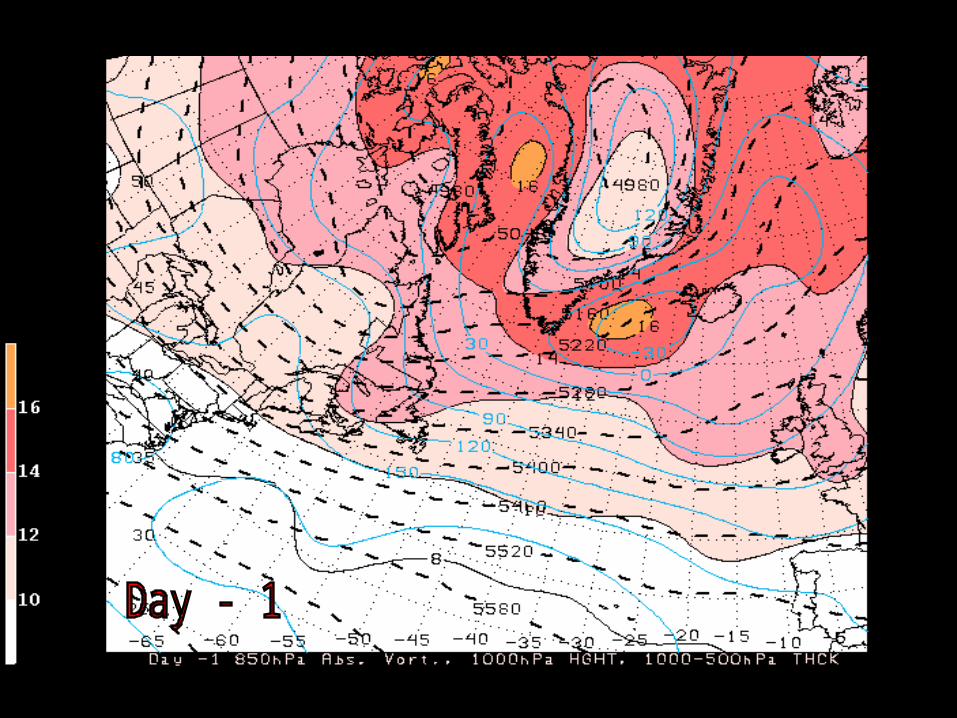
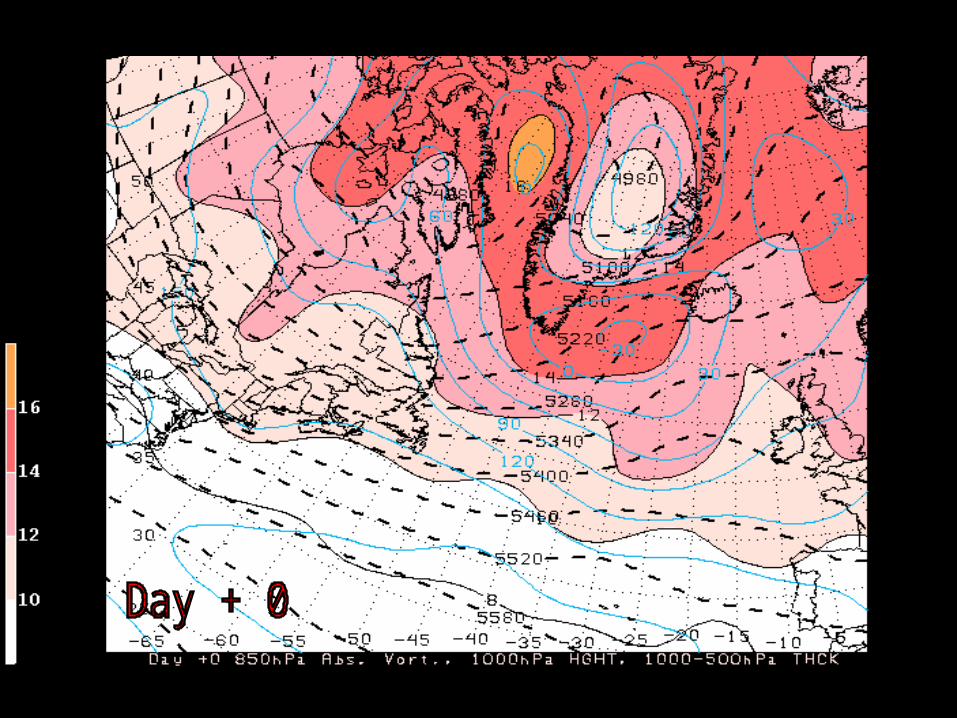
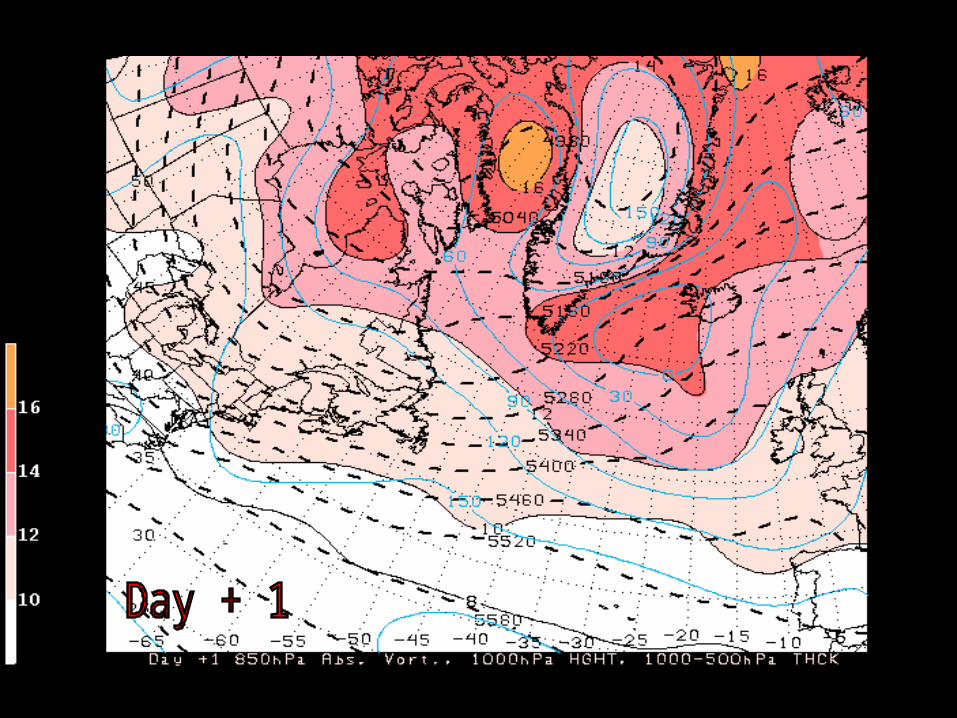
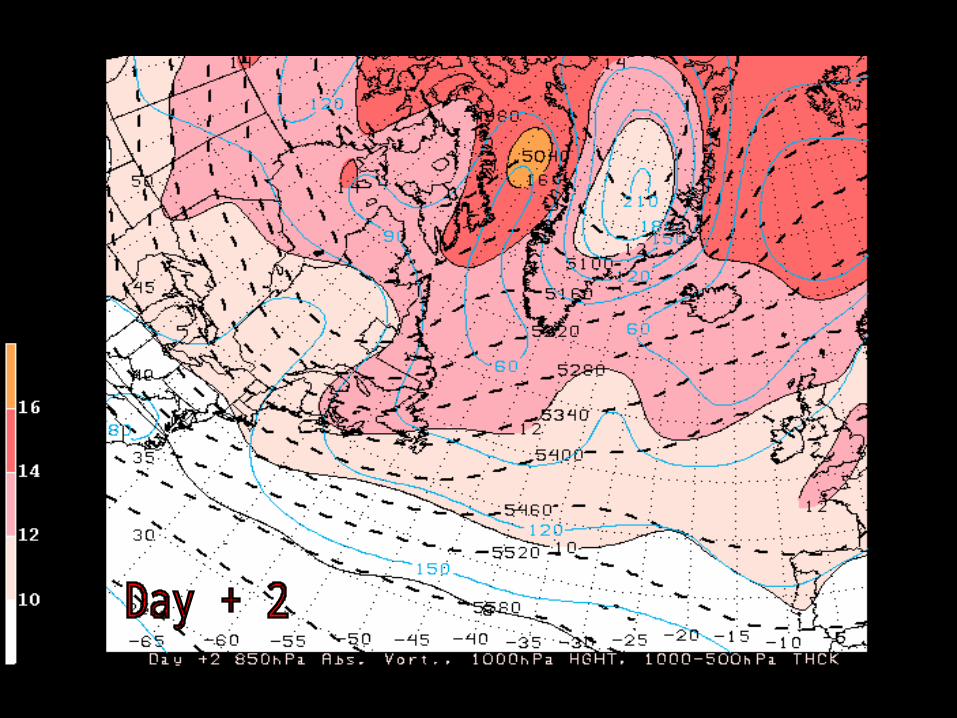

Negative NAO Regime Change CompositeNegative NAO Regime Change Composite
• Relatively weak mean offshore flowRelatively weak mean offshore flow• Weak surface trough over Northeast Weak surface trough over Northeast • Days +0 to +3: block develops in the eastern Days +0 to +3: block develops in the eastern
Atlantic and sharpens the northwesterly flow Atlantic and sharpens the northwesterly flow over the Northeast: over the Northeast:
offshore flow shuts off precipitationoffshore flow shuts off precipitation
• *No “smoking gun” storm affecting the *No “smoking gun” storm affecting the Northeast…in the meanNortheast…in the mean

ConclusionsConclusions
Statistical Results:Statistical Results:
• Negative NAO regime transition corresponds Negative NAO regime transition corresponds to enhanced precipitation in the Northeast to enhanced precipitation in the Northeast from fall to mid-winterfrom fall to mid-winter
• Positive PNA regime transition corresponds to Positive PNA regime transition corresponds to enhanced precipitation in the Northeast during enhanced precipitation in the Northeast during fall and springfall and spring
• d/dt |index| d/dt |index| more important than index more important than index
Conclusions (cont.)Conclusions (cont.)
Composite Analysis:Composite Analysis:
• Many different flavors to a negative NAOMany different flavors to a negative NAO
• No big storm over the Northeast in compositeNo big storm over the Northeast in composite
Caveats and ConclusionsCaveats and Conclusions
• • PNA and NAO used as first order PNA and NAO used as first order approximations of weather regimes: clear approximations of weather regimes: clear limitationslimitations
• Advantage: strong correlation between Advantage: strong correlation between observed NAO, PNA and 7 – 10 day MRF observed NAO, PNA and 7 – 10 day MRF ensemble forecasts ensemble forecasts
“ “Regime changes” are fairly well-predictedRegime changes” are fairly well-predicted
Models forecasting a negative NAO/positive Models forecasting a negative NAO/positive PNA transition should be a heads-up to PNA transition should be a heads-up to forecastersforecasters