recurving typhoons as precursors to an early season arctic outbreak over the continental u.s....
TRANSCRIPT
Recurving Typhoons as Precursors to an Early Season Arctic Outbreak over the Continental U.S.
Heather M. Archambault, Lance F. Bosart, and Daniel Keyser
Dept. of Earth and Atmospheric Sciences University at Albany, State University of New York
Super Typhoon Oscar, 15 Sep 1995
(Source: NCDC website)
NROW IXWednesday, 7 November 2007
NSF Grant ATM-0434189
Motivation for Arctic Outbreak Case Study
• Document mechanisms linking continental U.S. Arctic outbreak to recurving western North Pacific typhoons (TYs) more than 100° longitude upstream
• Relate surface anticyclone associated with Arctic outbreak to surface anticyclone climatological study (Doody 2007)
Overview
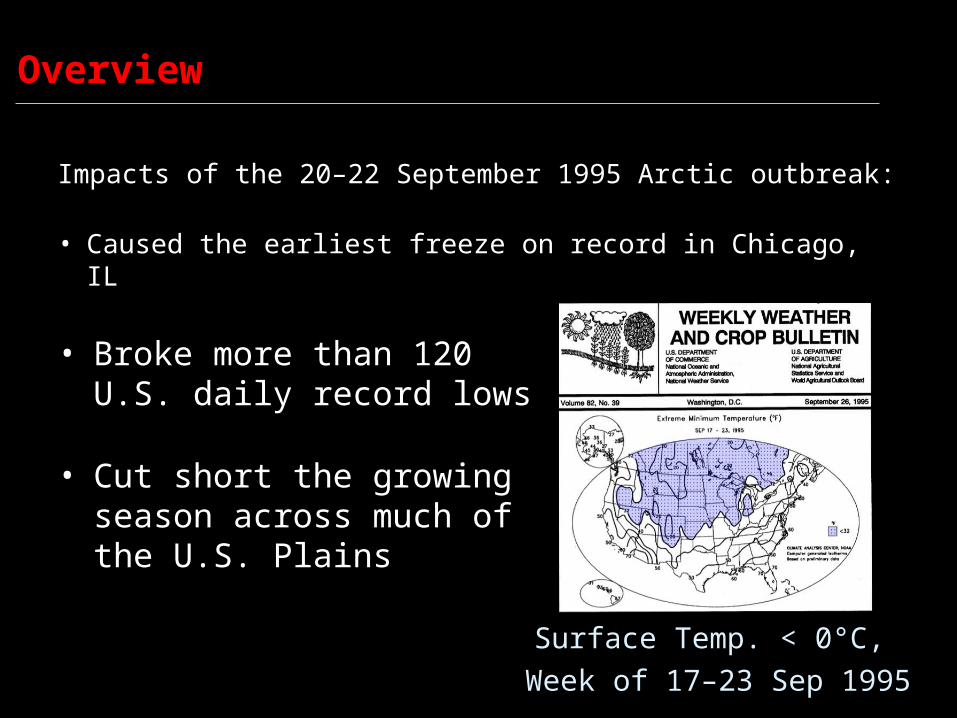
Impacts of the 20–22 September 1995 Arctic outbreak:
• Caused the earliest freeze on record in Chicago, IL
• Broke more than 120 U.S. daily record lows
• Cut short the growing season across much of the U.S. Plains
Surface Temp. < 0°C, Week of 17–23 Sep 1995
18–22 Sep 1995: Extreme Temperatures
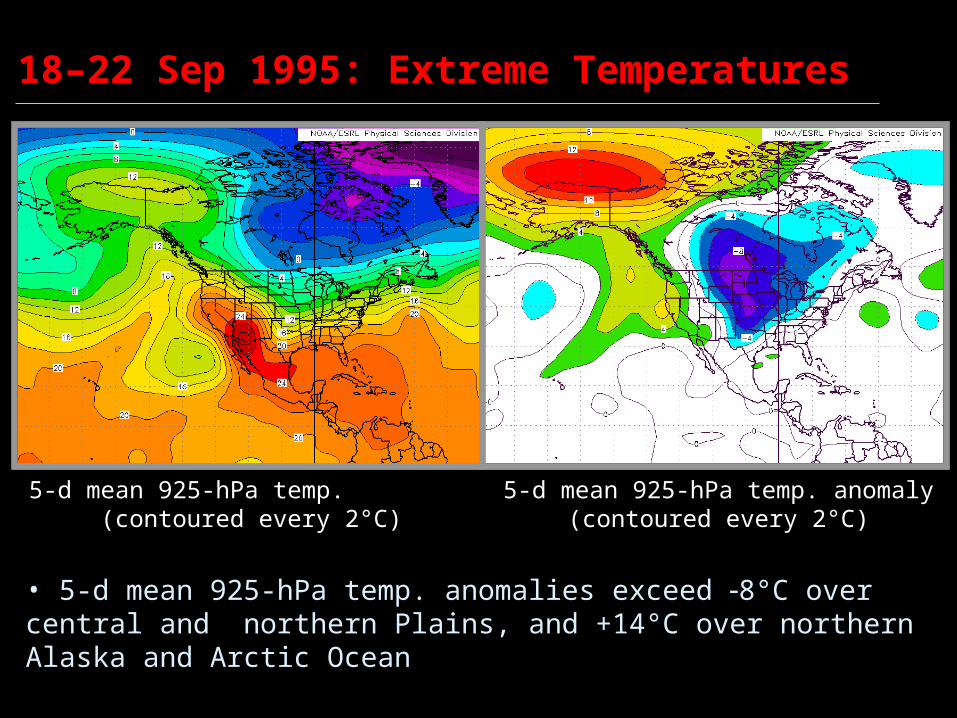
5-d mean 925-hPa temp. (contoured every 2°C)
5-d mean 925-hPa temp. anomaly (contoured every 2°C)
• 5-d mean 925-hPa temp. anomalies exceed 8°C over central and northern Plains, and +14°C over northern Alaska and Arctic Ocean
Presentation Outline
• Data sources
• Key Arctic outbreak mechanisms
1. W. Pacific TY recurvature and ridge amplification
2. Pacific–North American downstream development
3. Western North American blocking4. North American surface anticyclogenesis
• Summary and conclusions
Data Sources
• 2.5° ECMWF ERA-40 reanalysis (sea level pressure (SLP) fields only)
• 1.125° ECMWF ERA-40 reanalysis
• 2.5° NCEP–NCAR reanalysis 925-hPa temperature and temperature anomaly plots
– Constructed at NOAA Earth System Research Laboratory/Physical Science Division website (http://www.cdc.noaa.gov/Composites/Day/)
• Japan Meteorological Agency best track plots
– Obtained from Digital Typhoon website (http://agora.ex.nii.ac.jp/digital-typhoon/)
1: TY Recurvature and Ridge Amplification
• Three typhoons recurve in the West Pacific within a 7-d period (16–22 Sep 1995) (Klein et al. 2000):
– Super Typhoon (STY) Oscar (16 Sep)– TY Polly (19 Sep)– STY Ryan (22 Sep)
• Outflow from two of the three recurving TYs (STY Oscar and TY Polly) results in upper-level ridge amplification and jet intensification over the western Pacific (15–20 Sep)
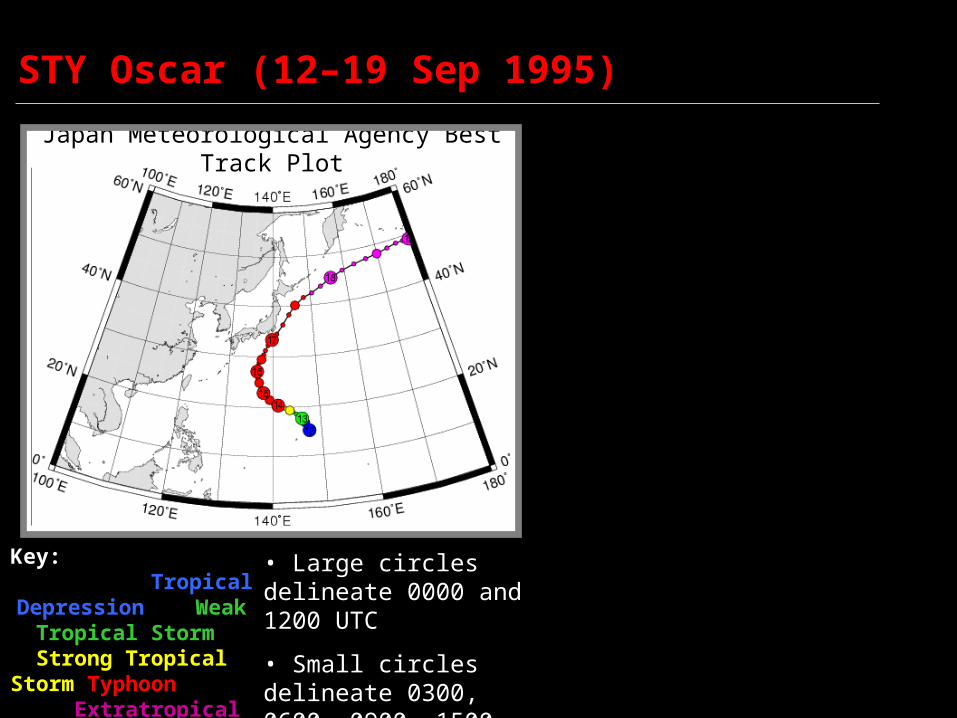
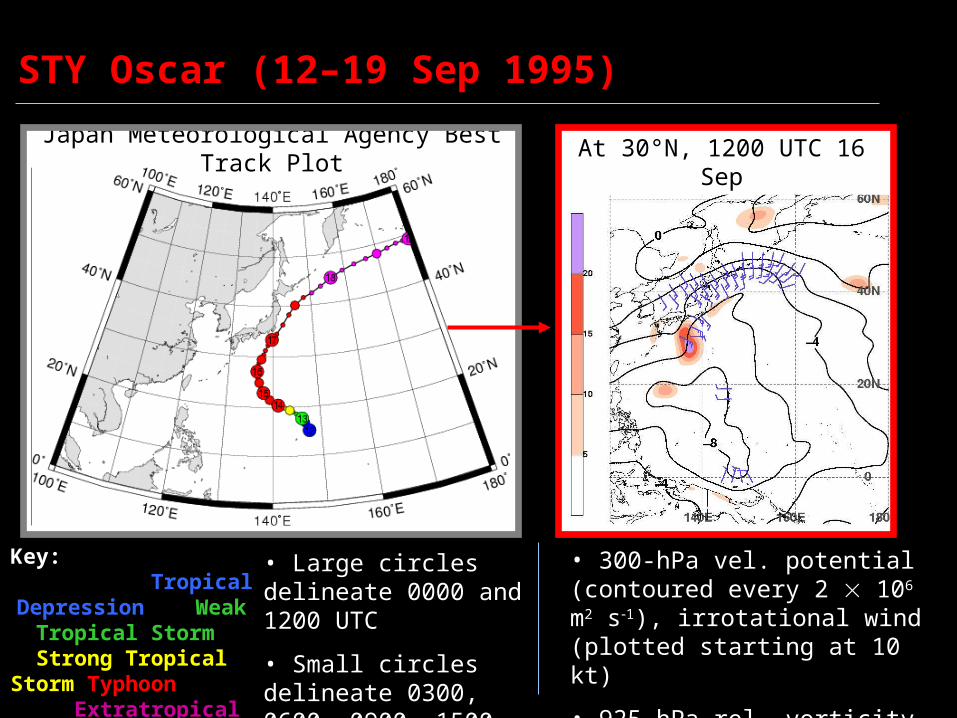
STY Oscar (12–19 Sep 1995)
Key: Tropical Depression Weak Tropical Storm Strong Tropical Storm
Typhoon Extratropical Cyclone
Japan Meteorological Agency Best Track Plot
• Large circles delineate 0000 and 1200 UTC
• Small circles delineate 0300, 0600, 0900, 1500, and 2100 UTC
STY Oscar (12–19 Sep 1995)
Key: Tropical Depression Weak Tropical Storm Strong Tropical Storm
Typhoon Extratropical Cyclone
At 30°N, 1200 UTC 16 SepJapan Meteorological Agency Best
Track Plot
• 300-hPa vel. potential (contoured every 2 106 m2 s1), irrotational wind (plotted starting at 10 kt)
• 925-hPa rel. vorticity (shaded starting at 5 105 s1)
• Large circles delineate 0000 and 1200 UTC
• Small circles delineate 0300, 0600, 0900, 1500, and 2100 UTC
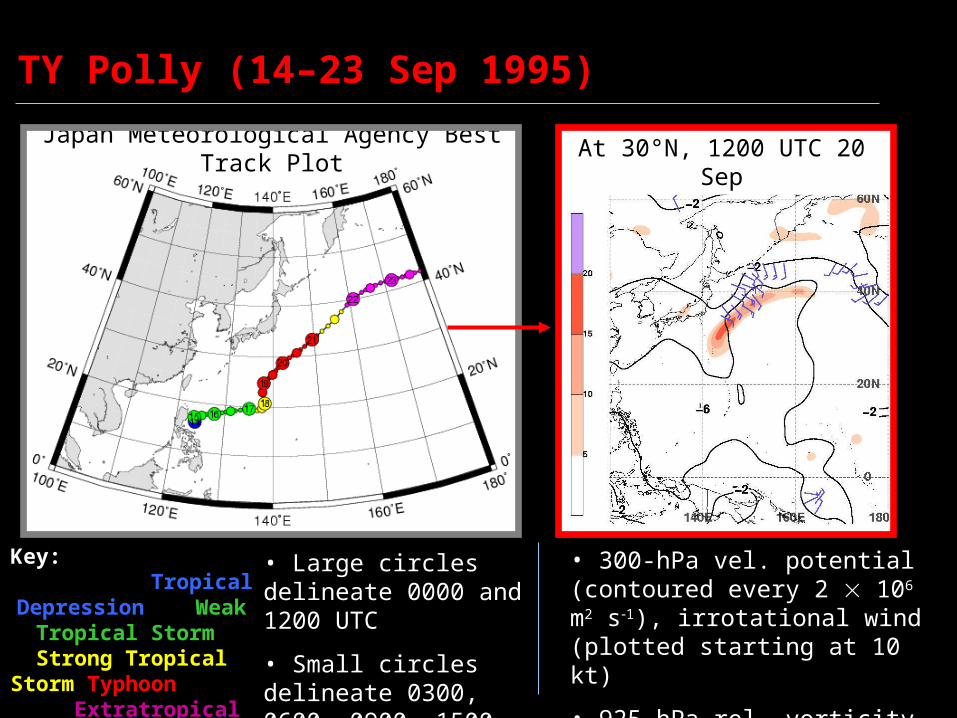
At 30°N, 1200 UTC 20 Sep
TY Polly (14–23 Sep 1995)
Key: Tropical Depression Weak Tropical Storm Strong Tropical Storm
Typhoon Extratropical Cyclone
Japan Meteorological Agency Best Track Plot
• 300-hPa vel. potential (contoured every 2 106 m2 s1), irrotational wind (plotted starting at 10 kt)
• 925-hPa rel. vorticity (shaded starting at 5 105 s1)
• Large circles delineate 0000 and 1200 UTC
• Small circles delineate 0300, 0600, 0900, 1500, and 2100 UTC
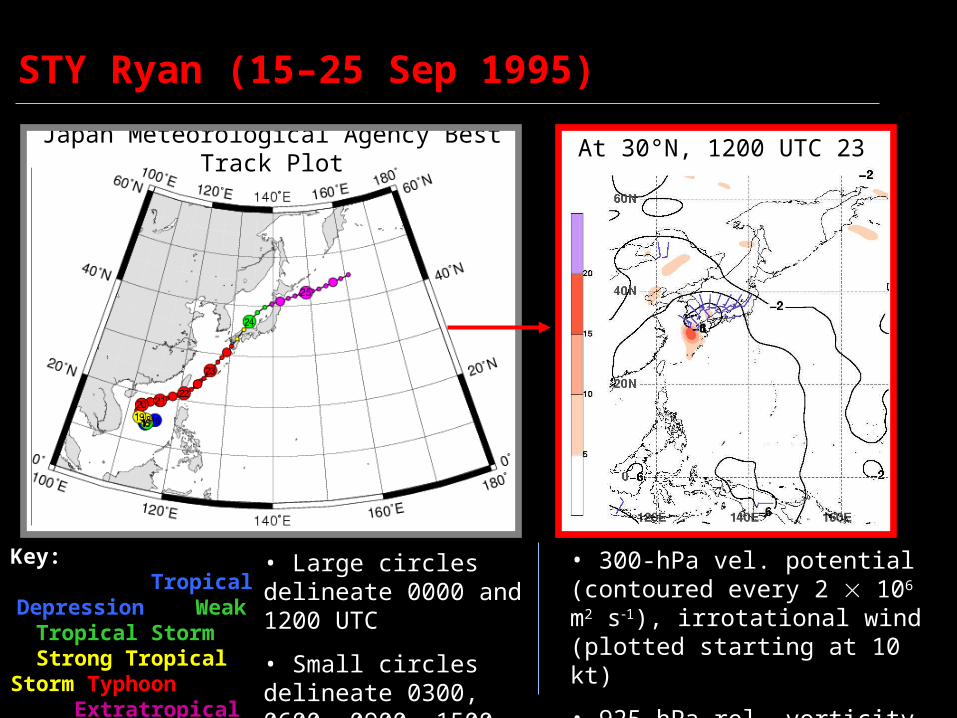
At 30°N, 1200 UTC 23 Sep
STY Ryan (15–25 Sep 1995)
Key: Tropical Depression Weak Tropical Storm Strong Tropical Storm
Typhoon Extratropical Cyclone
Japan Meteorological Agency Best Track Plot
• 300-hPa vel. potential (contoured every 2 106 m2 s1), irrotational wind (plotted starting at 10 kt)
• 925-hPa rel. vorticity (shaded starting at 5 105 s1)
• Large circles delineate 0000 and 1200 UTC
• Small circles delineate 0300, 0600, 0900, 1500, and 2100 UTC
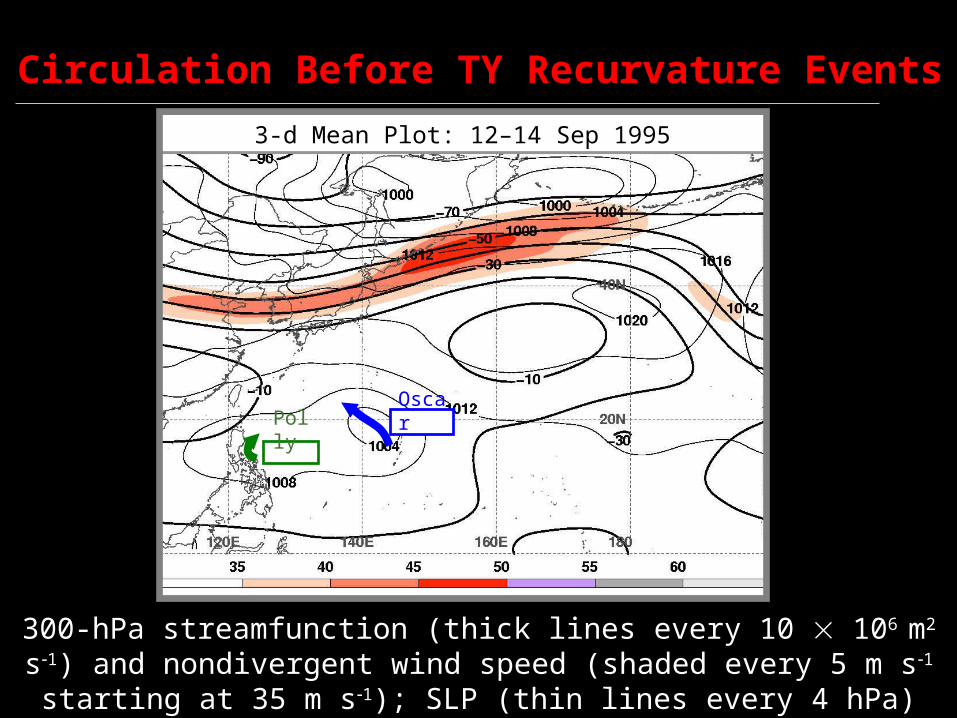
3-d Mean Plot: 12–14 Sep 1995
Circulation Before TY Recurvature Events
Oscar
Polly
300-hPa streamfunction (thick lines every 10 106 m2 s1) and nondivergent wind speed (shaded every 5 m s1 starting at 35
m s1); SLP (thin lines every 4 hPa)
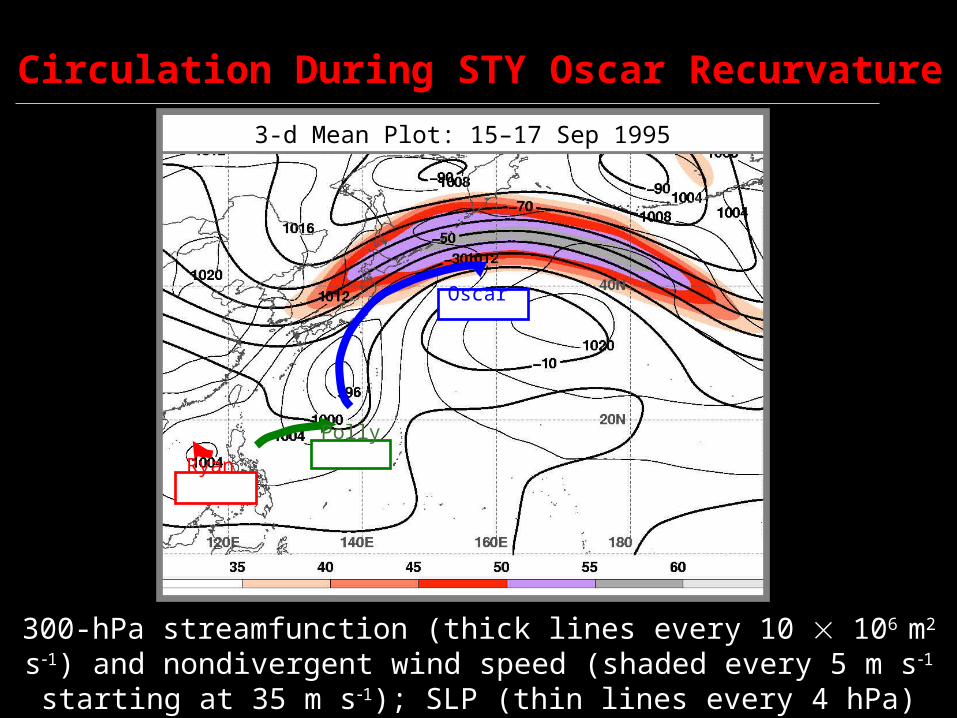
3-d Mean Plot: 15–17 Sep 1995
Circulation During STY Oscar Recurvature
Ryan
Oscar
Polly
300-hPa streamfunction (thick lines every 10 106 m2 s1) and nondivergent wind speed (shaded every 5 m s1 starting at 35
m s1); SLP (thin lines every 4 hPa)
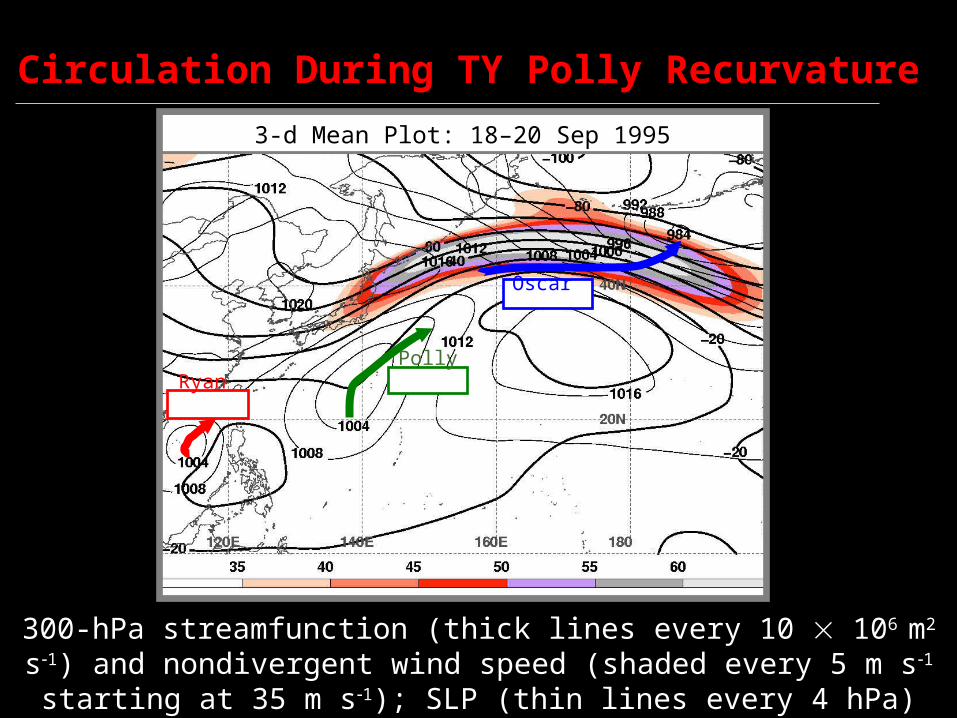
3-d Mean Plot: 18–20 Sep 1995
Circulation During TY Polly Recurvature
Ryan
Oscar
Polly
300-hPa streamfunction (thick lines every 10 106 m2 s1) and nondivergent wind speed (shaded every 5 m s1 starting at 35
m s1); SLP (thin lines every 4 hPa)
2: Downstream Development
• Upper-level ridge amplification results in downstream development across Pacific Ocean and North America (16–22 Sep)
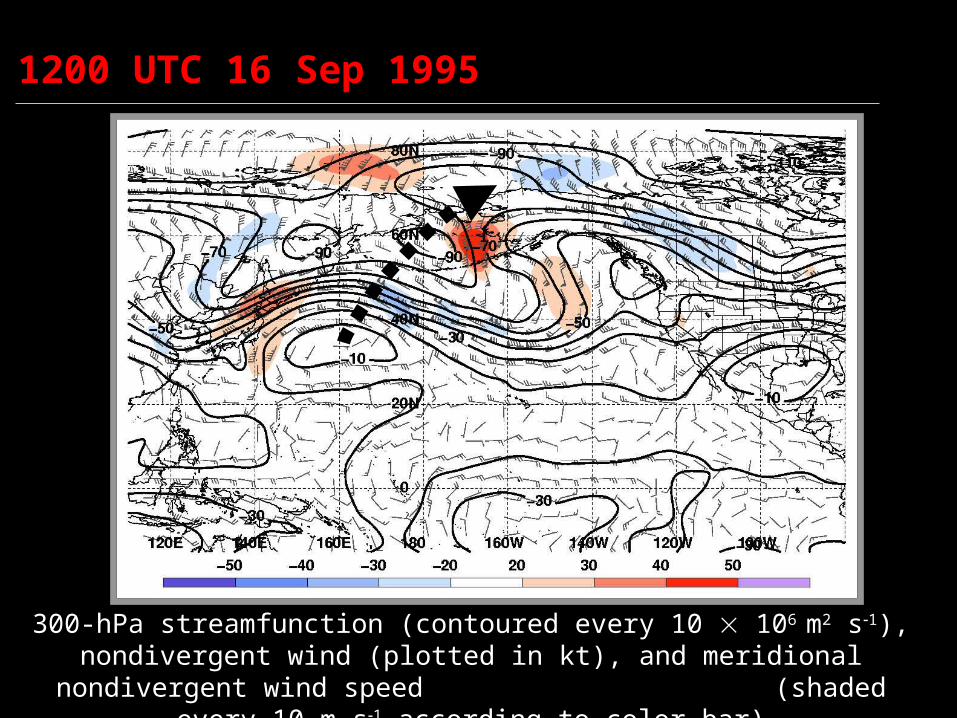
1200 UTC 16 Sep 1995
300-hPa streamfunction (contoured every 10 106 m2 s1), nondivergent wind (plotted in kt), and meridional nondivergent wind speed (shaded every 10 m s1 according to color bar)
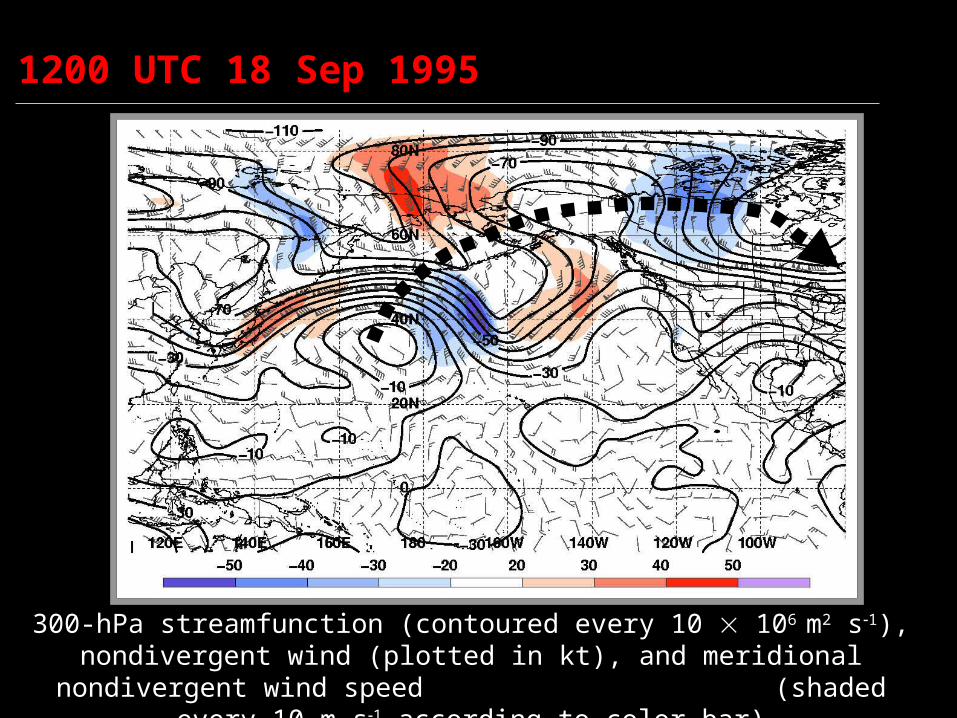
1200 UTC 18 Sep 1995
300-hPa streamfunction (contoured every 10 106 m2 s1), nondivergent wind (plotted in kt), and meridional nondivergent wind speed (shaded every 10 m s1 according to color bar)
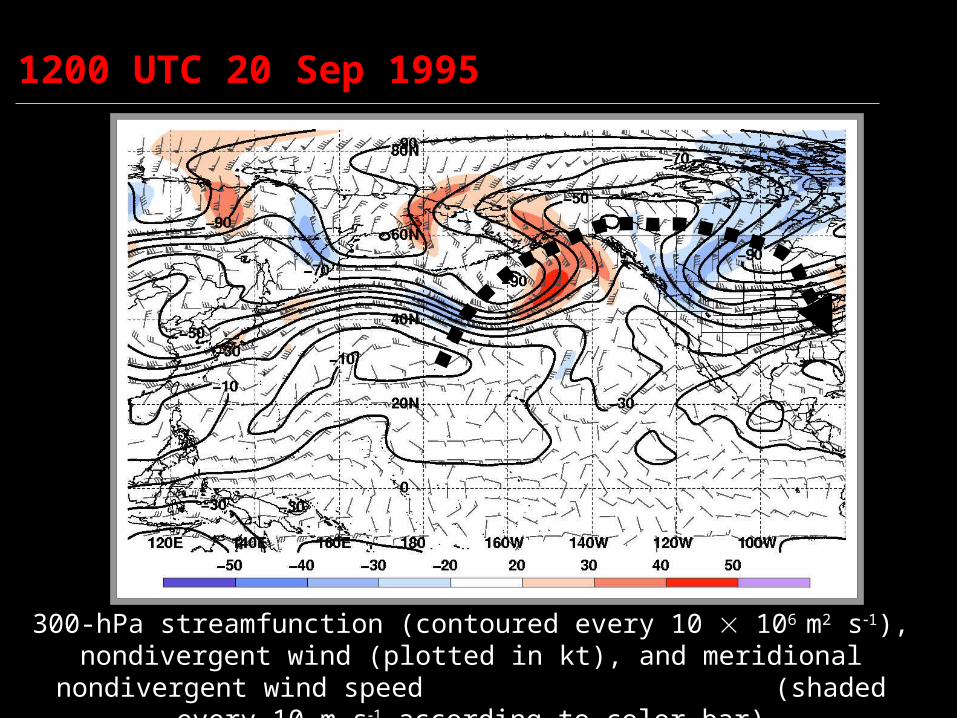
1200 UTC 20 Sep 1995
300-hPa streamfunction (contoured every 10 106 m2 s1), nondivergent wind (plotted in kt), and meridional nondivergent wind speed (shaded every 10 m s1 according to color bar)
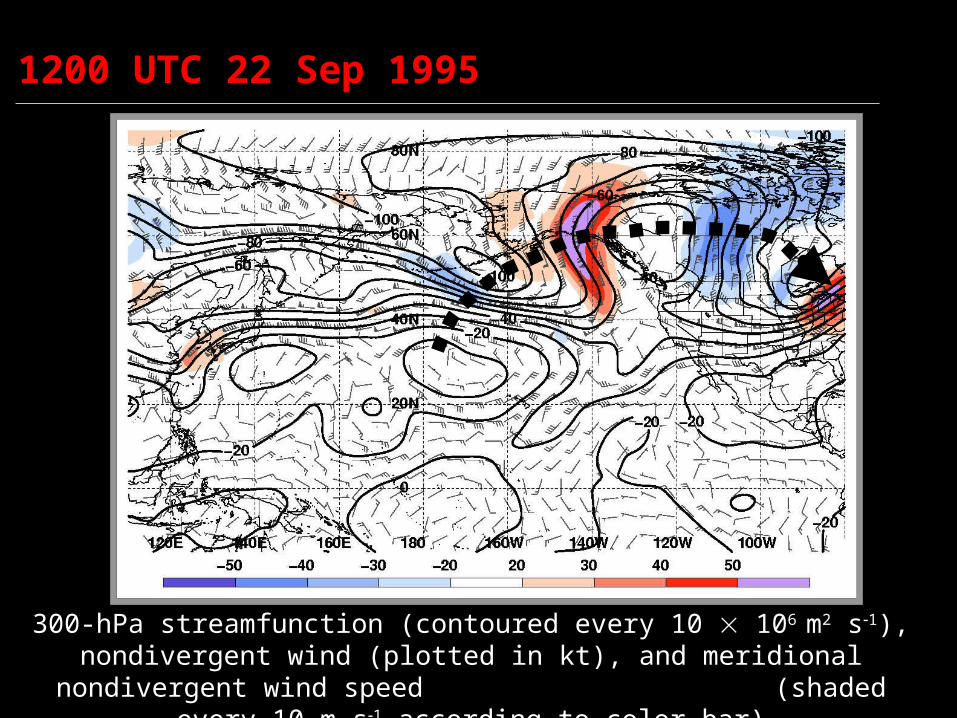
1200 UTC 22 Sep 1995
300-hPa streamfunction (contoured every 10 106 m2 s1), nondivergent wind (plotted in kt), and meridional nondivergent wind speed (shaded every 10 m s1 according to color bar)
3: Western North American Blocking
• Western North American omega blocking occurs in response to downstream development
• Cyclogenesis events in the Gulf of Alaska initiate block onset, maintenance, and “folding over” (anticyclonic wave breaking) (16–22 Sep)
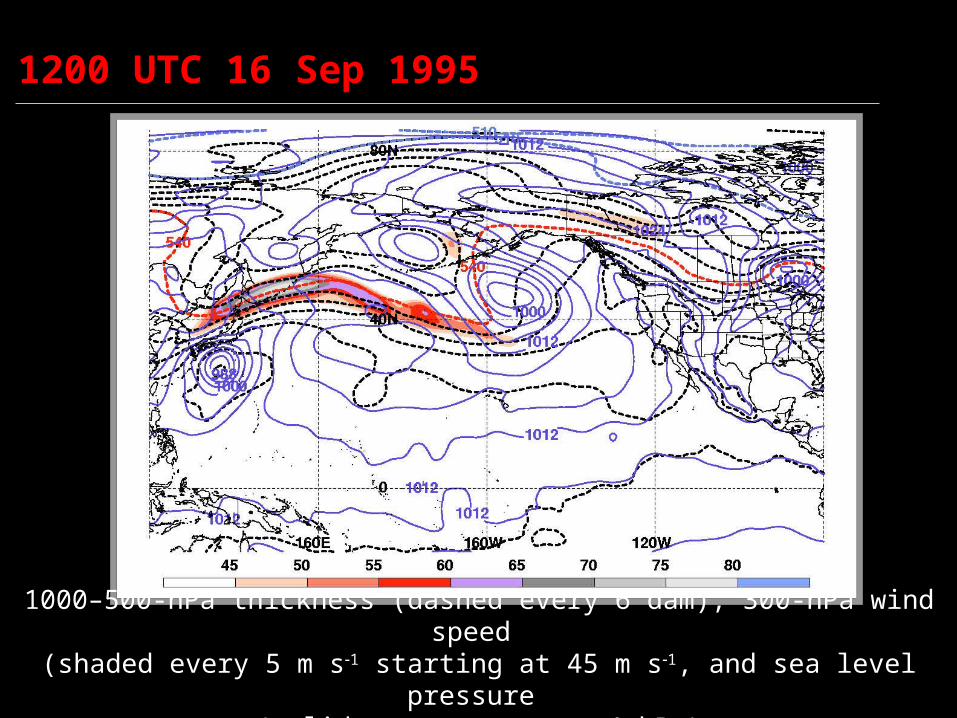
1200 UTC 16 Sep 1995
1000–500-hPa thickness (dashed every 6 dam), 300-hPa wind speed
(shaded every 5 m s1 starting at 45 m s1, and sea level pressure (solid contours every 4 hPa)
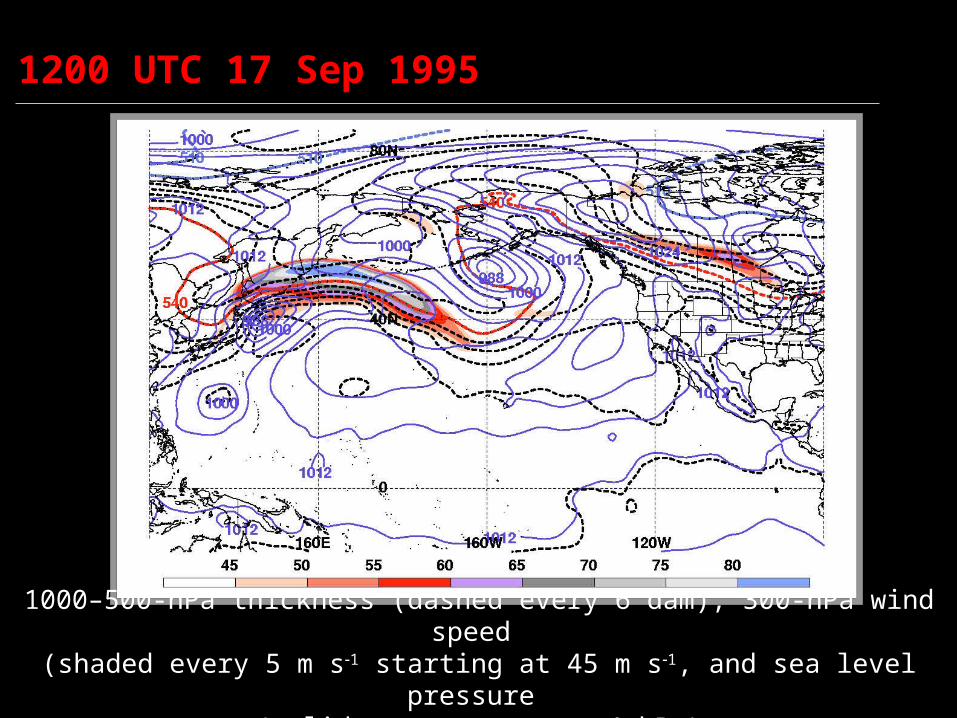
1200 UTC 17 Sep 1995
1000–500-hPa thickness (dashed every 6 dam), 300-hPa wind speed
(shaded every 5 m s1 starting at 45 m s1, and sea level pressure (solid contours every 4 hPa)
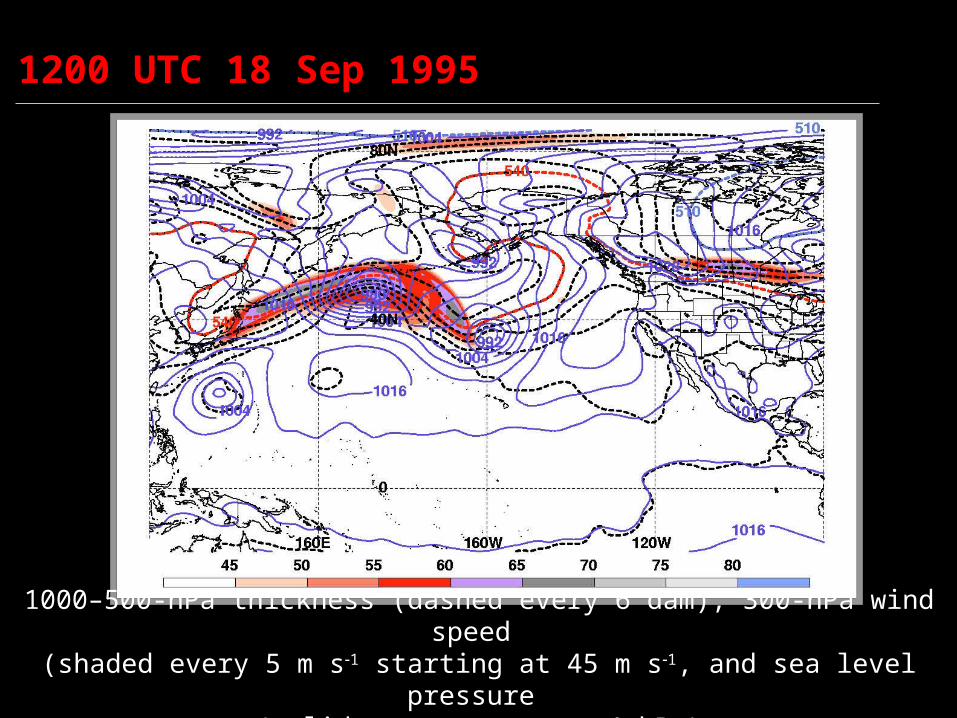
1200 UTC 18 Sep 1995
1000–500-hPa thickness (dashed every 6 dam), 300-hPa wind speed
(shaded every 5 m s1 starting at 45 m s1, and sea level pressure (solid contours every 4 hPa)
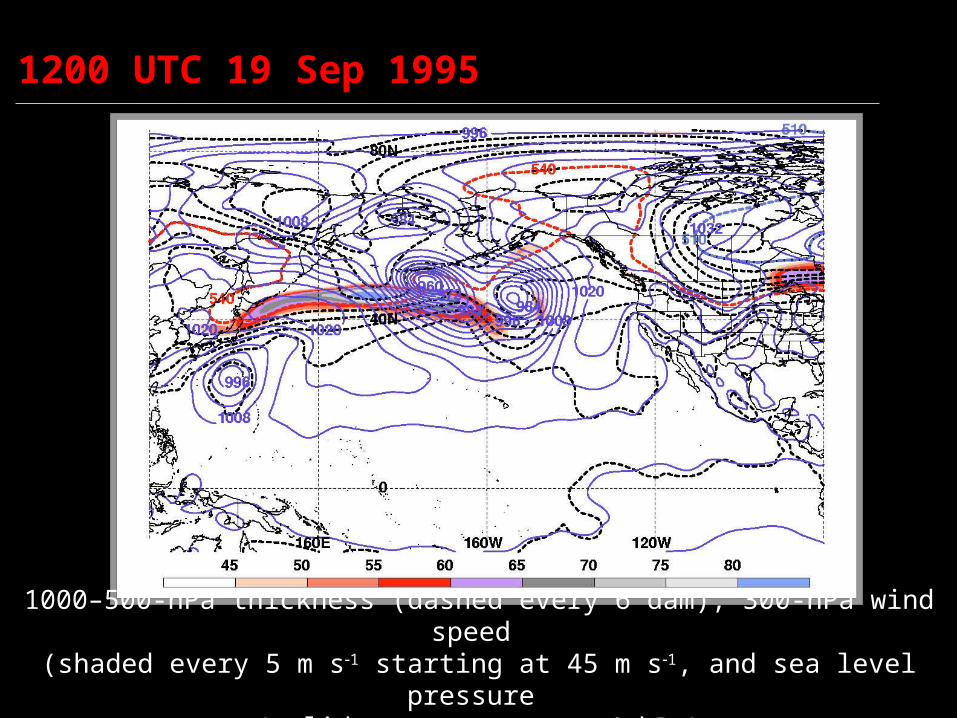
1200 UTC 19 Sep 1995
1000–500-hPa thickness (dashed every 6 dam), 300-hPa wind speed
(shaded every 5 m s1 starting at 45 m s1, and sea level pressure (solid contours every 4 hPa)
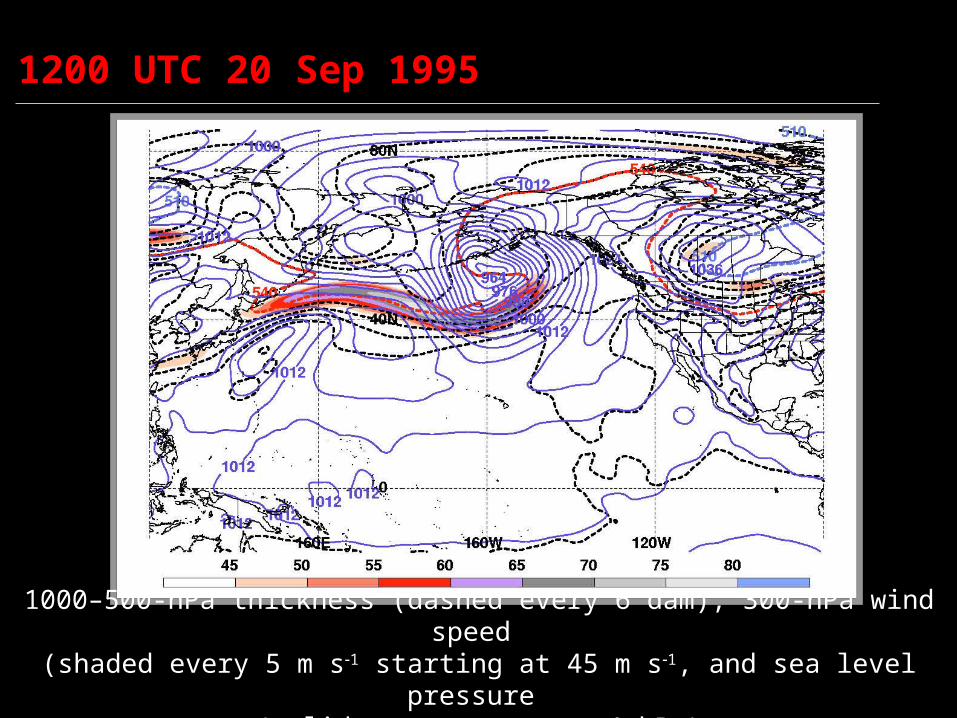
1200 UTC 20 Sep 1995
1000–500-hPa thickness (dashed every 6 dam), 300-hPa wind speed
(shaded every 5 m s1 starting at 45 m s1, and sea level pressure (solid contours every 4 hPa)
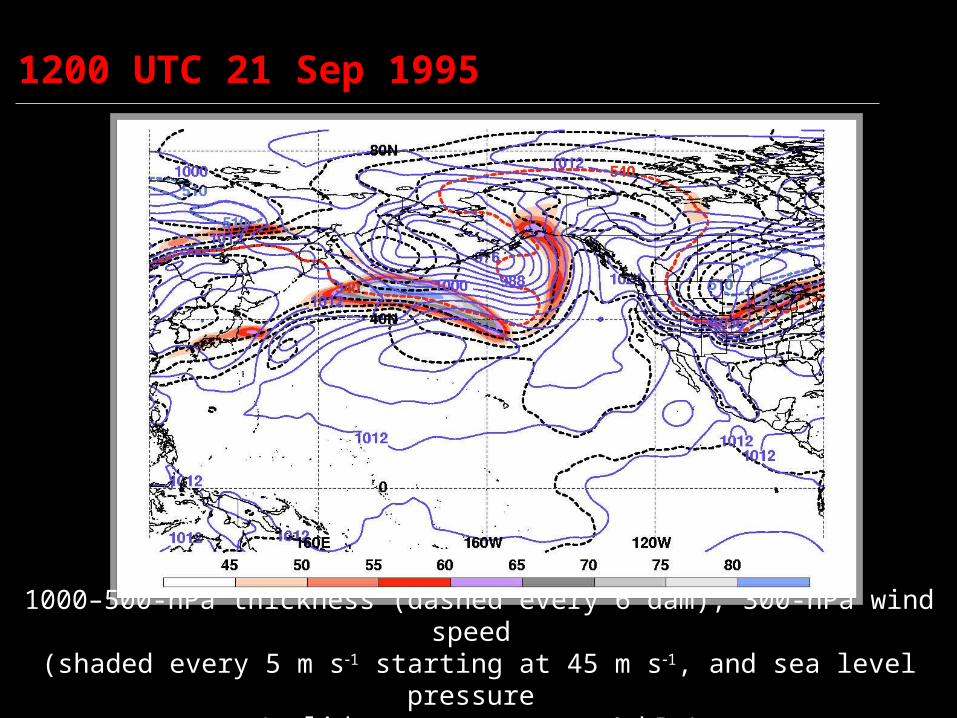
1200 UTC 21 Sep 1995
1000–500-hPa thickness (dashed every 6 dam), 300-hPa wind speed
(shaded every 5 m s1 starting at 45 m s1, and sea level pressure (solid contours every 4 hPa)
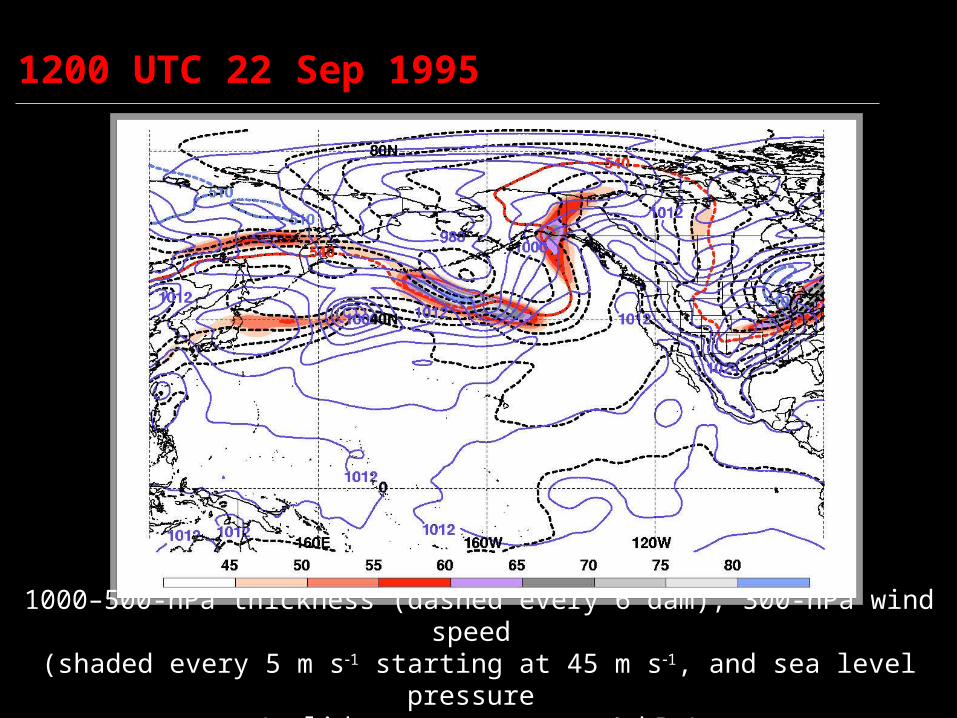
1200 UTC 22 Sep 1995
1000–500-hPa thickness (dashed every 6 dam), 300-hPa wind speed
(shaded every 5 m s1 starting at 45 m s1, and sea level pressure (solid contours every 4 hPa)
• Anticyclonic wave breaking results in surface anticyclogenesis over central Canada and initial equatorward movement along the Rockies (18–23 Sep)
• Strength and movement of surface anticyclone is associated with advection of anticyclonic geostrophic relative vorticity by the thermal wind (Sutcliffe–Trenberth approximation of quasigeostrophic forcing for vertical motion; Trenberth 1978)
4: North American Surface Anticyclogenesis
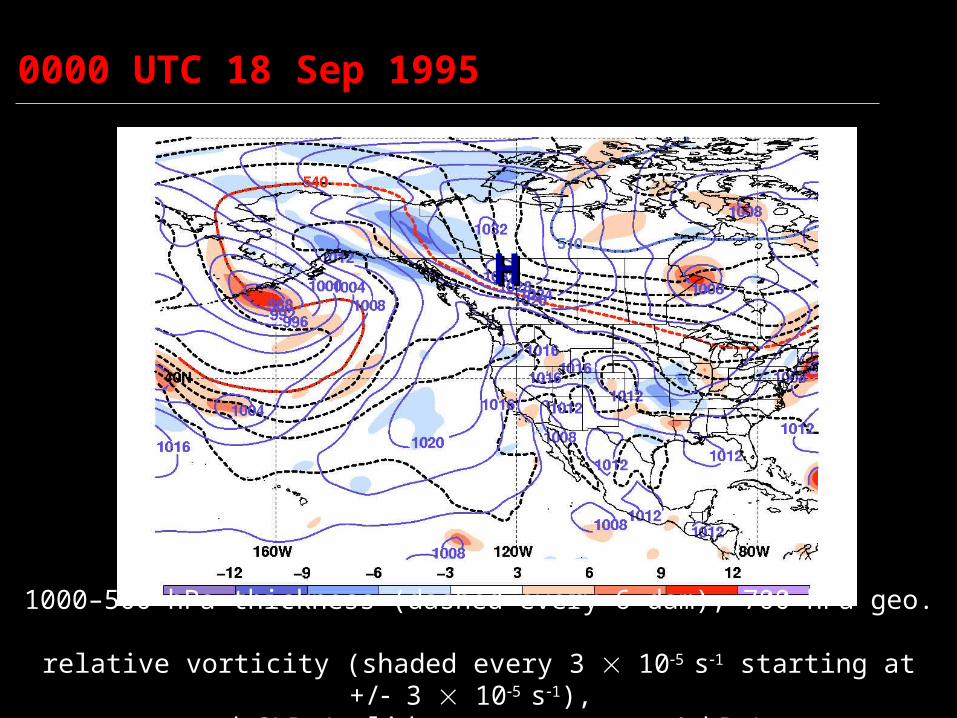
0000 UTC 18 Sep 1995
HH
1000–500-hPa thickness (dashed every 6 dam), 700-hPa geo. relative vorticity (shaded every 3 105 s1 starting at +/ 3 105
s1), and SLP (solid contours every 4 hPa)
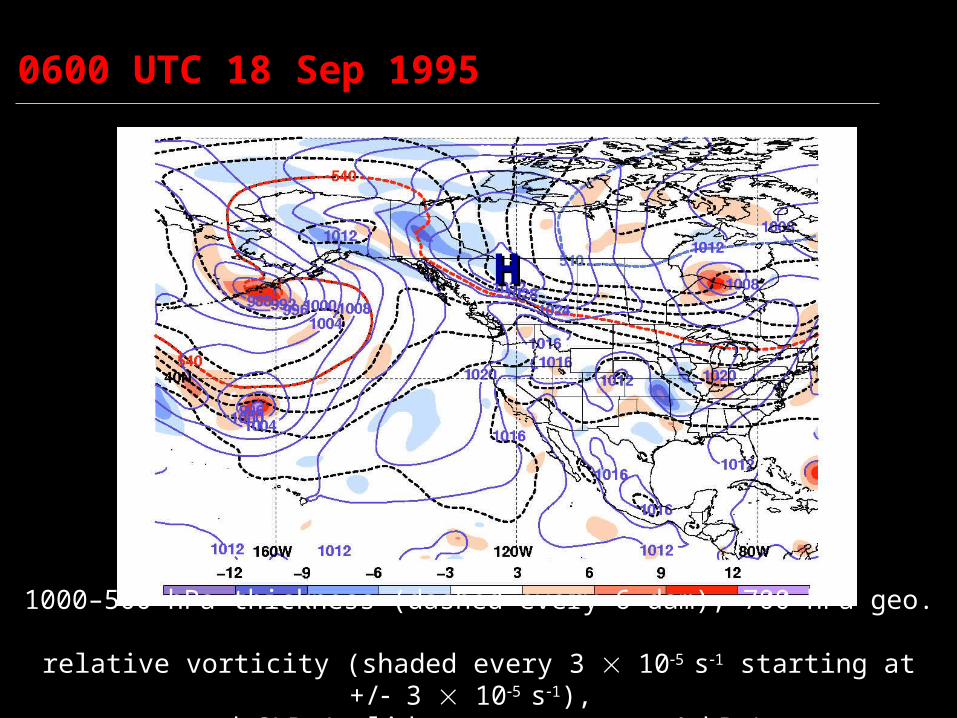
0600 UTC 18 Sep 1995
HH
1000–500-hPa thickness (dashed every 6 dam), 700-hPa geo. relative vorticity (shaded every 3 105 s1 starting at +/ 3 105
s1), and SLP (solid contours every 4 hPa)
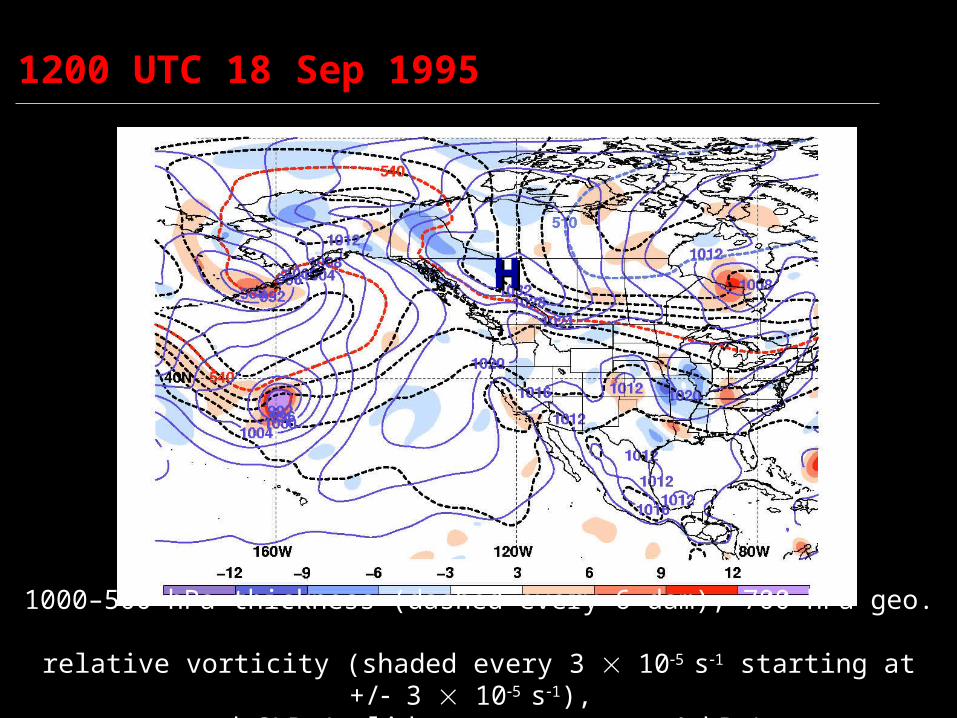
1200 UTC 18 Sep 1995
HH
1000–500-hPa thickness (dashed every 6 dam), 700-hPa geo. relative vorticity (shaded every 3 105 s1 starting at +/ 3 105
s1), and SLP (solid contours every 4 hPa)
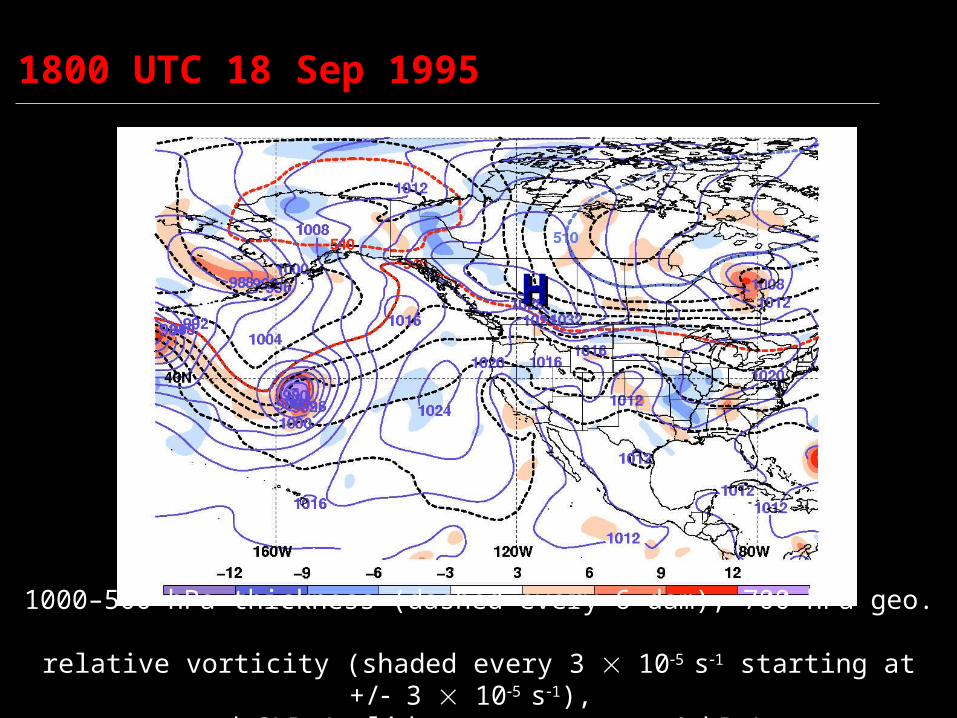
1800 UTC 18 Sep 1995
HH
1000–500-hPa thickness (dashed every 6 dam), 700-hPa geo. relative vorticity (shaded every 3 105 s1 starting at +/ 3 105
s1), and SLP (solid contours every 4 hPa)
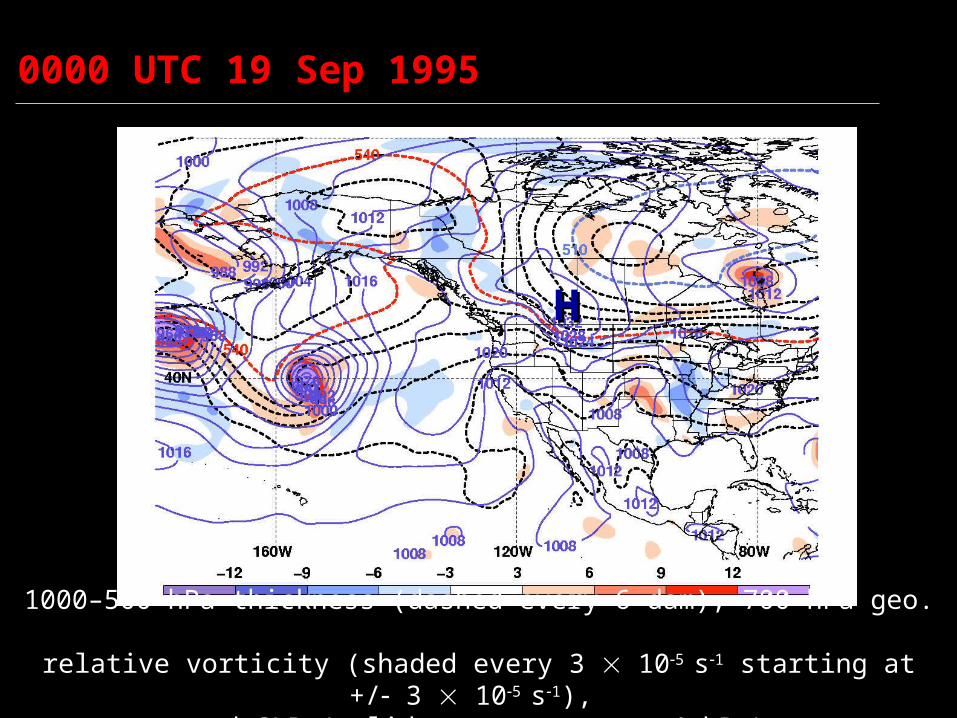
0000 UTC 19 Sep 1995
HH
1000–500-hPa thickness (dashed every 6 dam), 700-hPa geo. relative vorticity (shaded every 3 105 s1 starting at +/ 3 105
s1), and SLP (solid contours every 4 hPa)
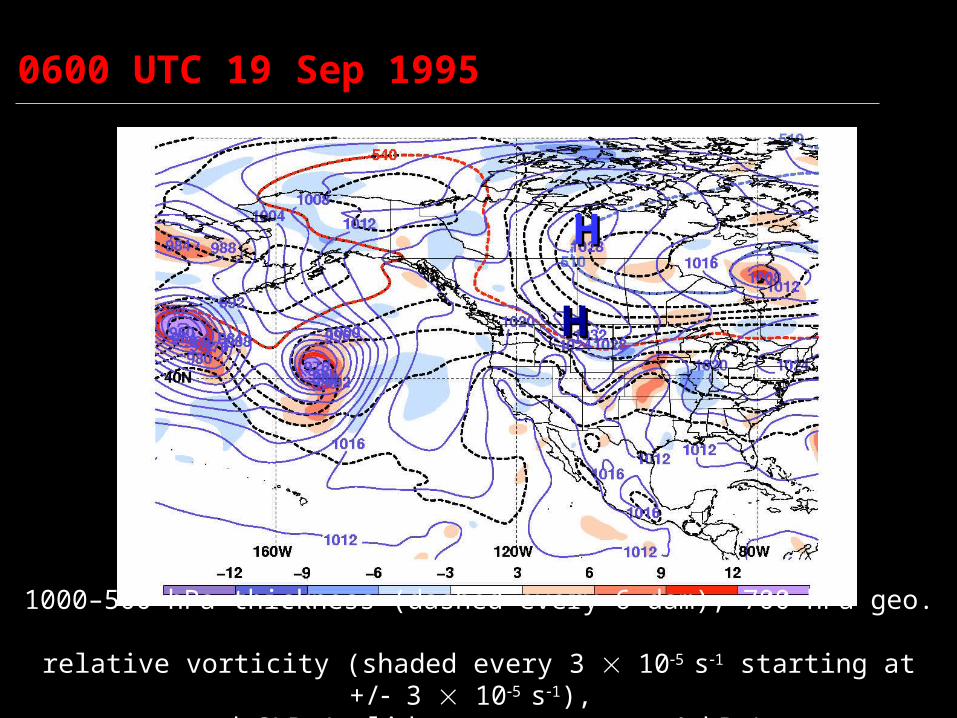
0600 UTC 19 Sep 1995
HH
HH
1000–500-hPa thickness (dashed every 6 dam), 700-hPa geo. relative vorticity (shaded every 3 105 s1 starting at +/ 3 105
s1), and SLP (solid contours every 4 hPa)
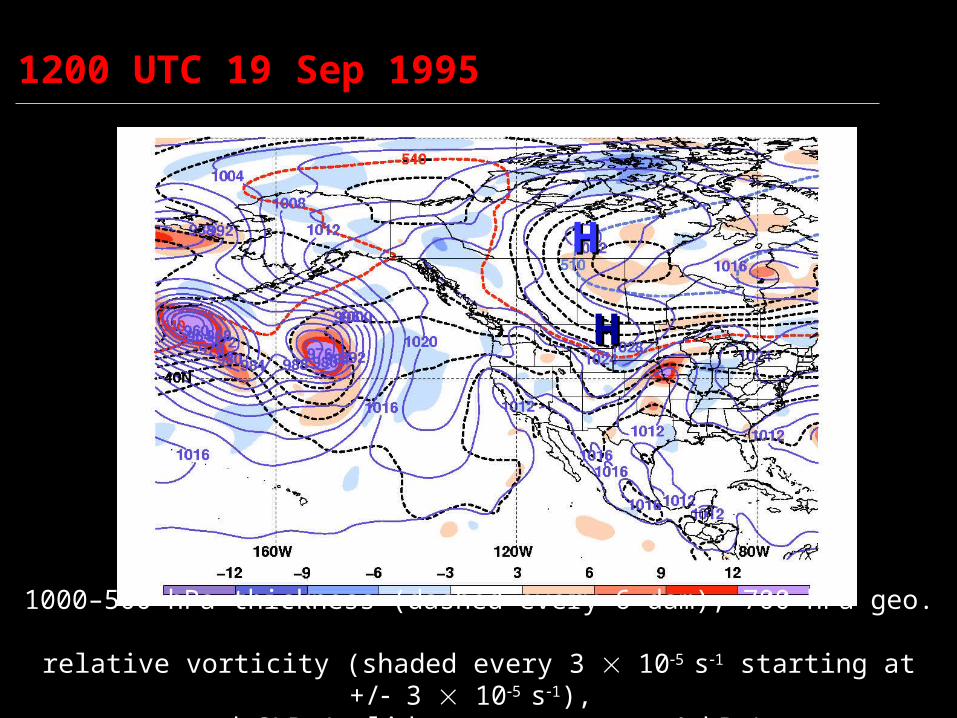
1200 UTC 19 Sep 1995
HH
HH
1000–500-hPa thickness (dashed every 6 dam), 700-hPa geo. relative vorticity (shaded every 3 105 s1 starting at +/ 3 105
s1), and SLP (solid contours every 4 hPa)
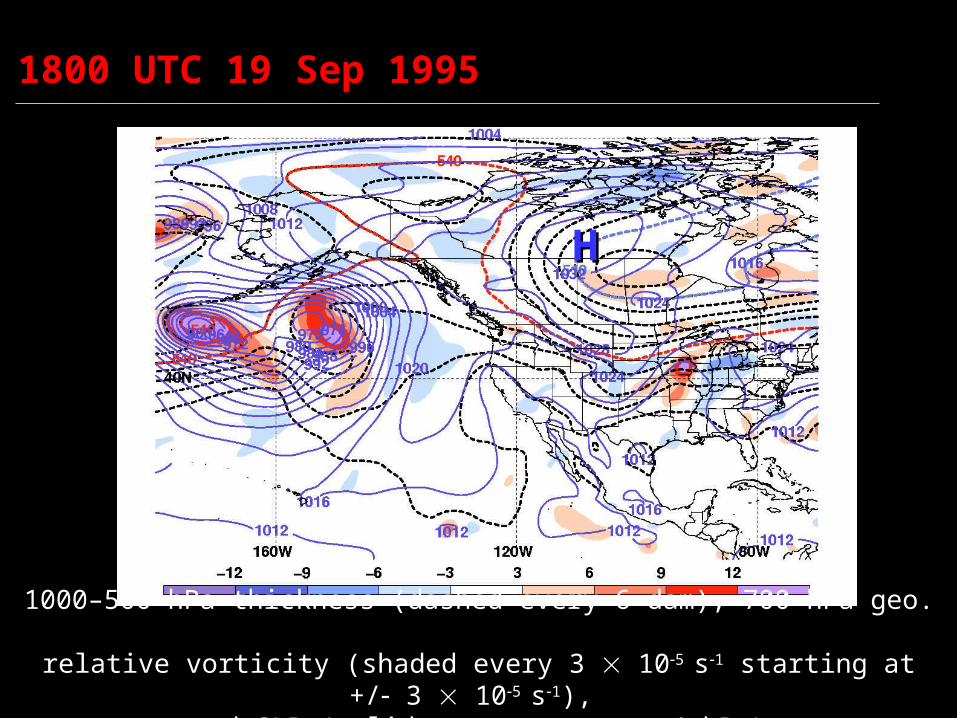
1800 UTC 19 Sep 1995
HH
1000–500-hPa thickness (dashed every 6 dam), 700-hPa geo. relative vorticity (shaded every 3 105 s1 starting at +/ 3 105
s1), and SLP (solid contours every 4 hPa)
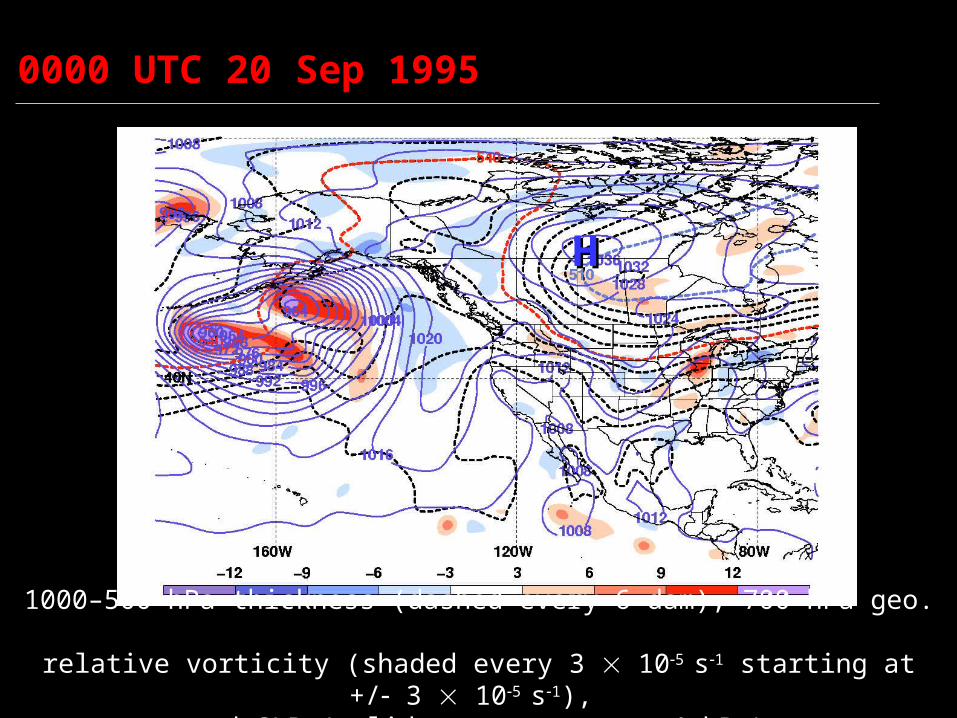
0000 UTC 20 Sep 1995
HH
1000–500-hPa thickness (dashed every 6 dam), 700-hPa geo. relative vorticity (shaded every 3 105 s1 starting at +/ 3 105
s1), and SLP (solid contours every 4 hPa)

0600 UTC 20 Sep 1995
HH
1000–500-hPa thickness (dashed every 6 dam), 700-hPa geo. relative vorticity (shaded every 3 105 s1 starting at +/ 3 105
s1), and SLP (solid contours every 4 hPa)
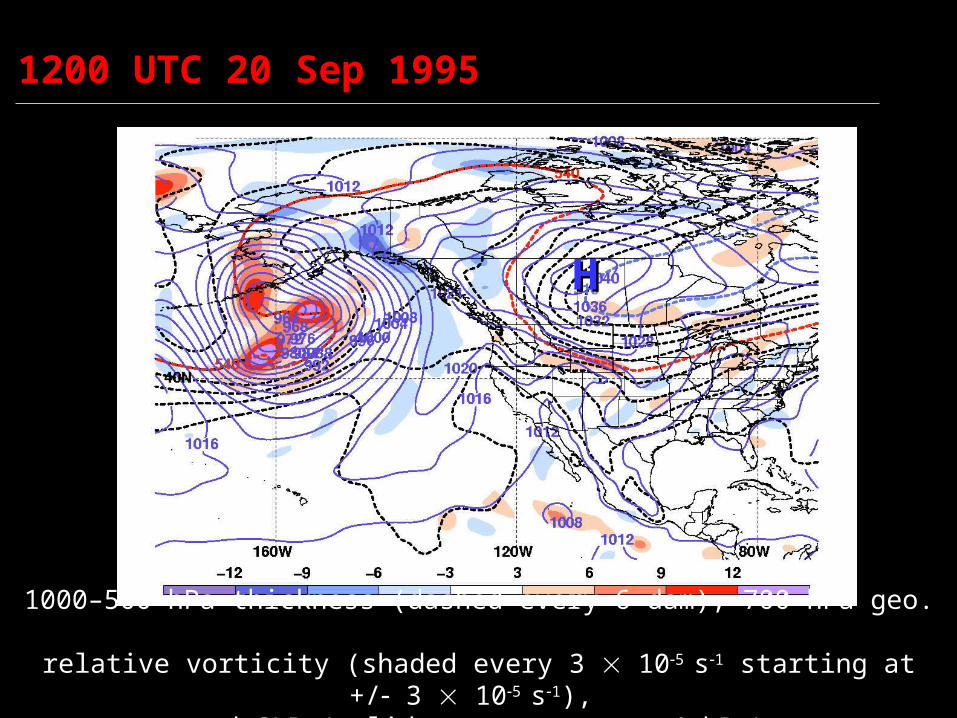
1200 UTC 20 Sep 1995
HH
1000–500-hPa thickness (dashed every 6 dam), 700-hPa geo. relative vorticity (shaded every 3 105 s1 starting at +/ 3 105
s1), and SLP (solid contours every 4 hPa)
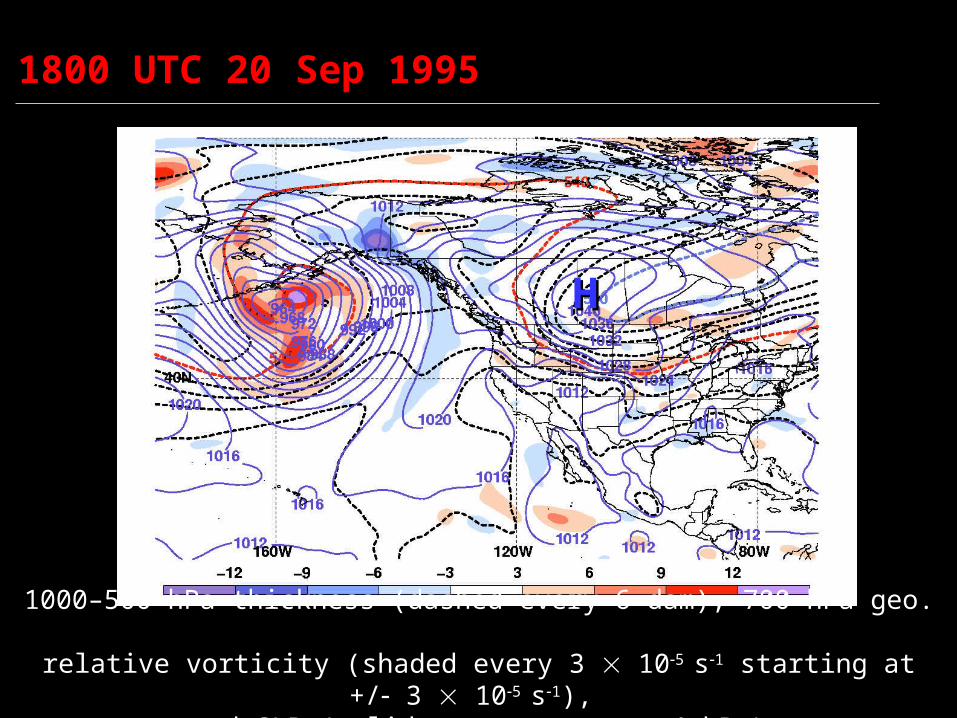
1800 UTC 20 Sep 1995
HH
1000–500-hPa thickness (dashed every 6 dam), 700-hPa geo. relative vorticity (shaded every 3 105 s1 starting at +/ 3 105
s1), and SLP (solid contours every 4 hPa)
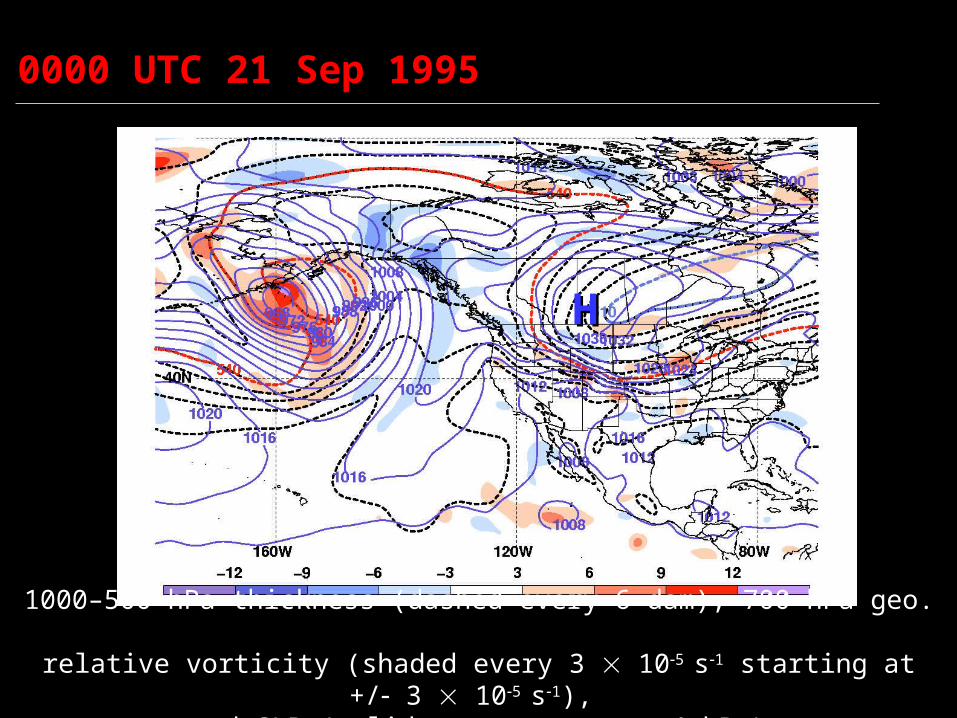
0000 UTC 21 Sep 1995
HH
1000–500-hPa thickness (dashed every 6 dam), 700-hPa geo. relative vorticity (shaded every 3 105 s1 starting at +/ 3 105
s1), and SLP (solid contours every 4 hPa)
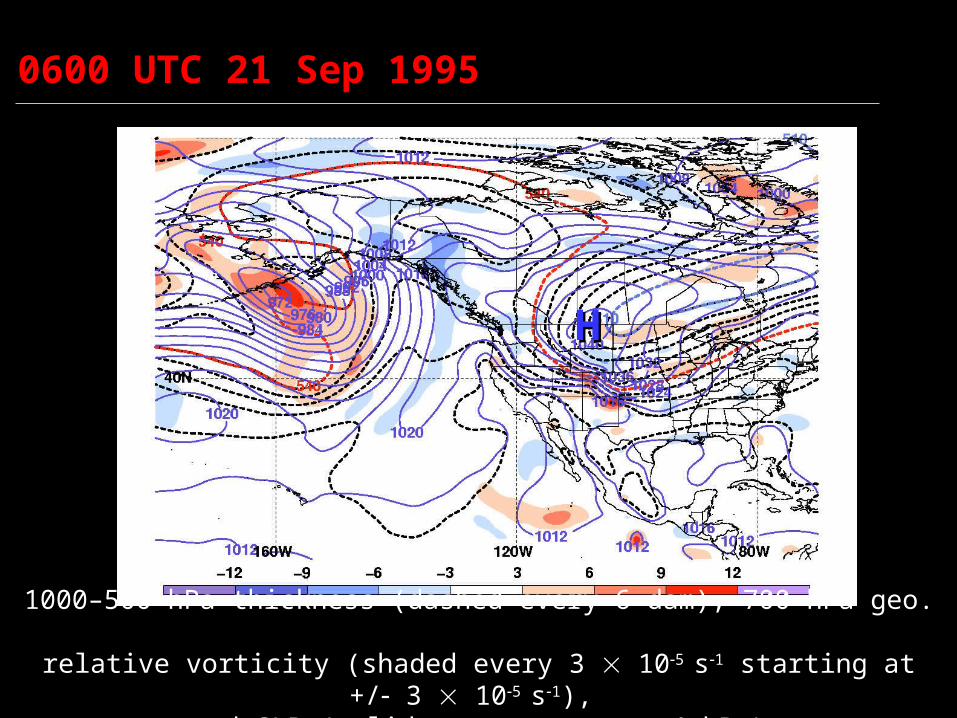
0600 UTC 21 Sep 1995
HH
1000–500-hPa thickness (dashed every 6 dam), 700-hPa geo. relative vorticity (shaded every 3 105 s1 starting at +/ 3 105
s1), and SLP (solid contours every 4 hPa)
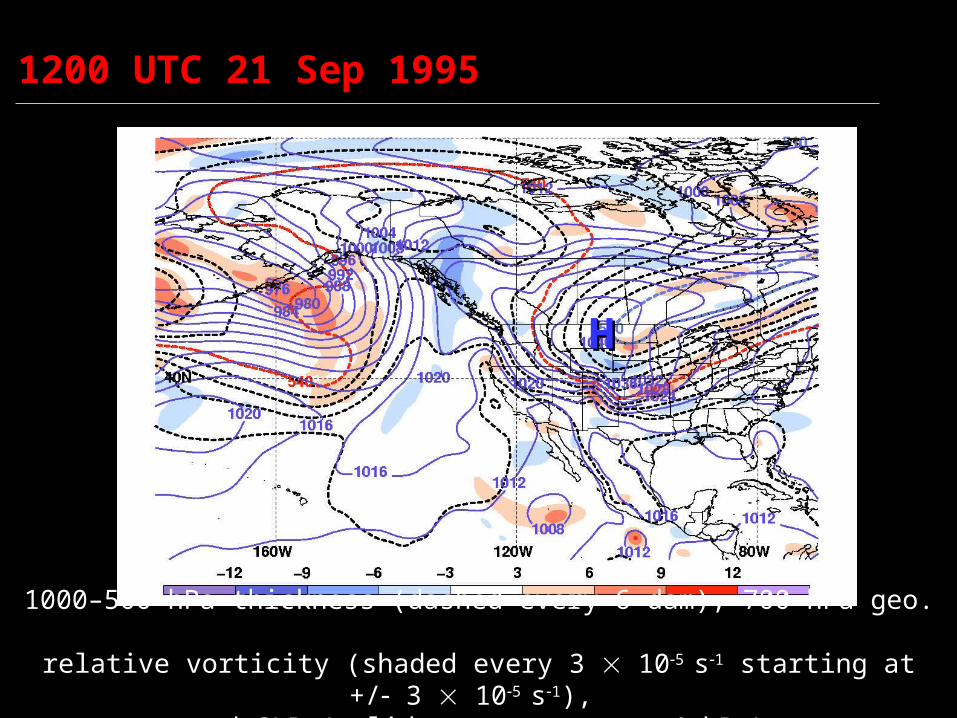
1200 UTC 21 Sep 1995
HH
1000–500-hPa thickness (dashed every 6 dam), 700-hPa geo. relative vorticity (shaded every 3 105 s1 starting at +/ 3 105
s1), and SLP (solid contours every 4 hPa)
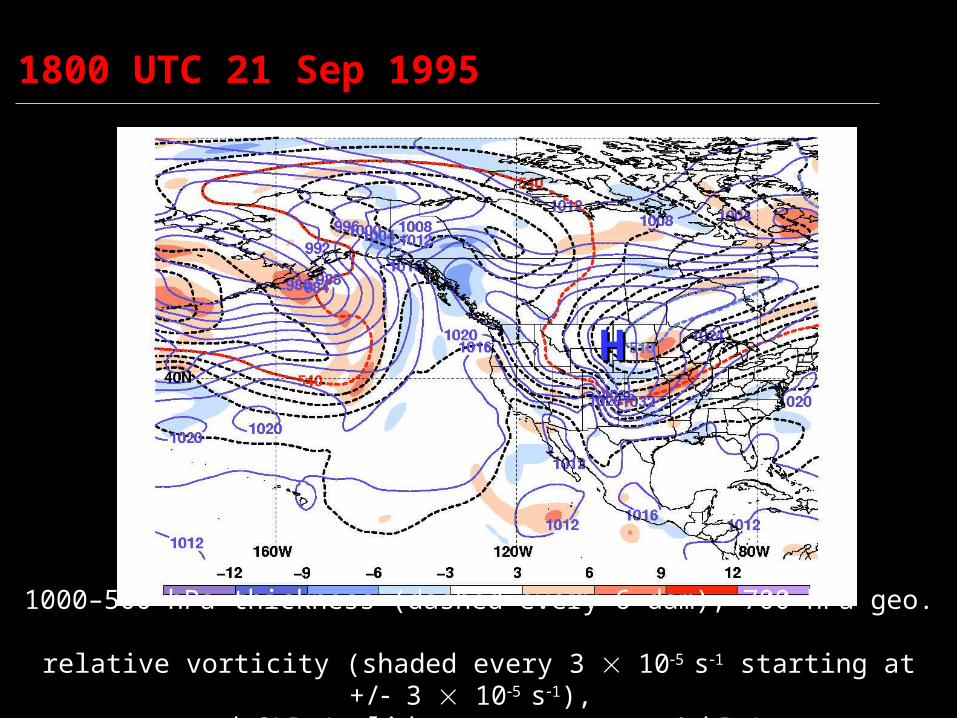
1800 UTC 21 Sep 1995
HH
1000–500-hPa thickness (dashed every 6 dam), 700-hPa geo. relative vorticity (shaded every 3 105 s1 starting at +/ 3 105
s1), and SLP (solid contours every 4 hPa)
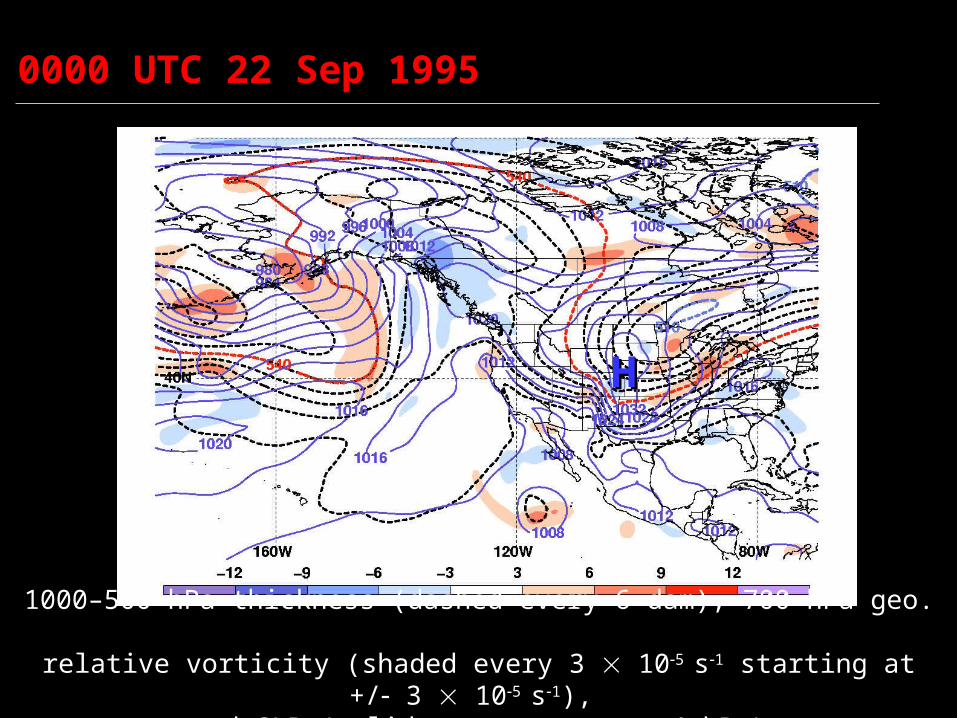
0000 UTC 22 Sep 1995
HH
1000–500-hPa thickness (dashed every 6 dam), 700-hPa geo. relative vorticity (shaded every 3 105 s1 starting at +/ 3 105
s1), and SLP (solid contours every 4 hPa)
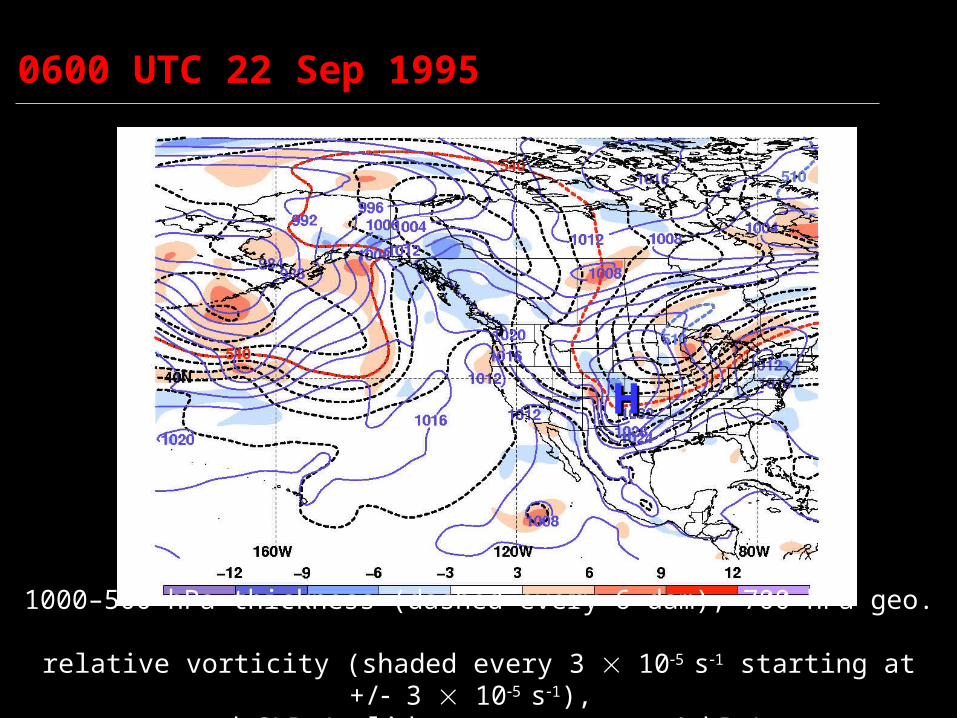
0600 UTC 22 Sep 1995
HH
1000–500-hPa thickness (dashed every 6 dam), 700-hPa geo. relative vorticity (shaded every 3 105 s1 starting at +/ 3 105
s1), and SLP (solid contours every 4 hPa)
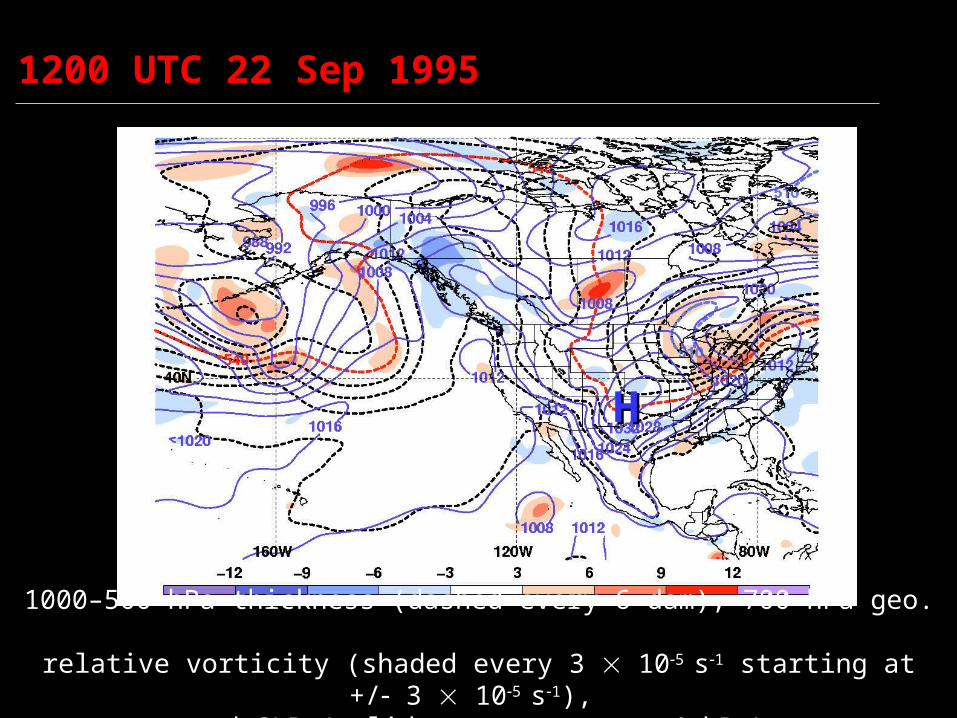
1200 UTC 22 Sep 1995
HH
1000–500-hPa thickness (dashed every 6 dam), 700-hPa geo. relative vorticity (shaded every 3 105 s1 starting at +/ 3 105
s1), and SLP (solid contours every 4 hPa)
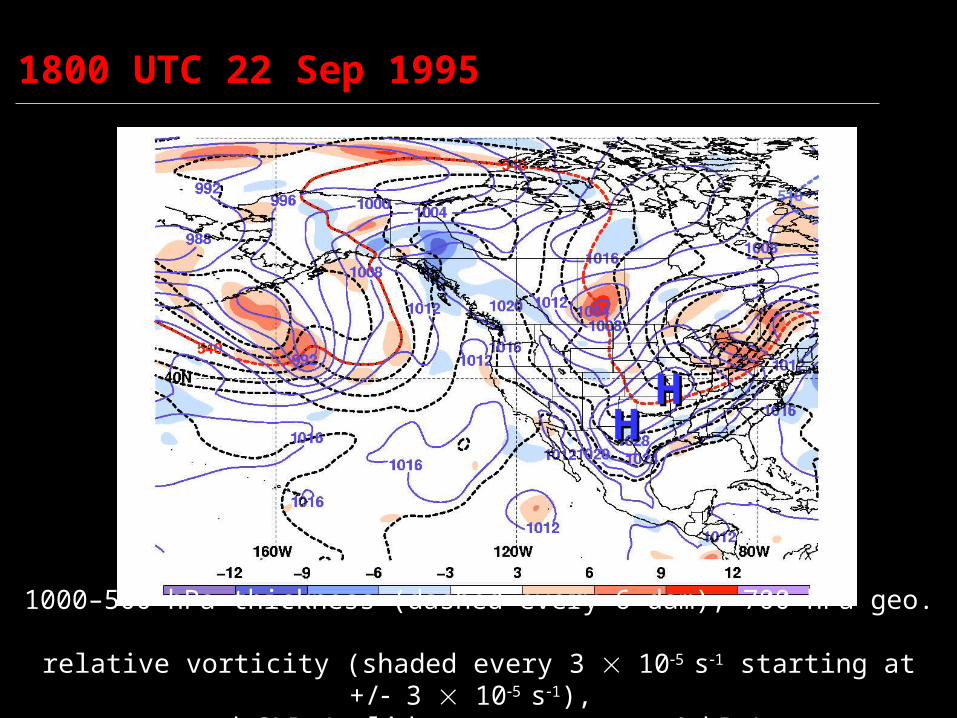
1800 UTC 22 Sep 1995
HHHH
1000–500-hPa thickness (dashed every 6 dam), 700-hPa geo. relative vorticity (shaded every 3 105 s1 starting at +/ 3 105
s1), and SLP (solid contours every 4 hPa)
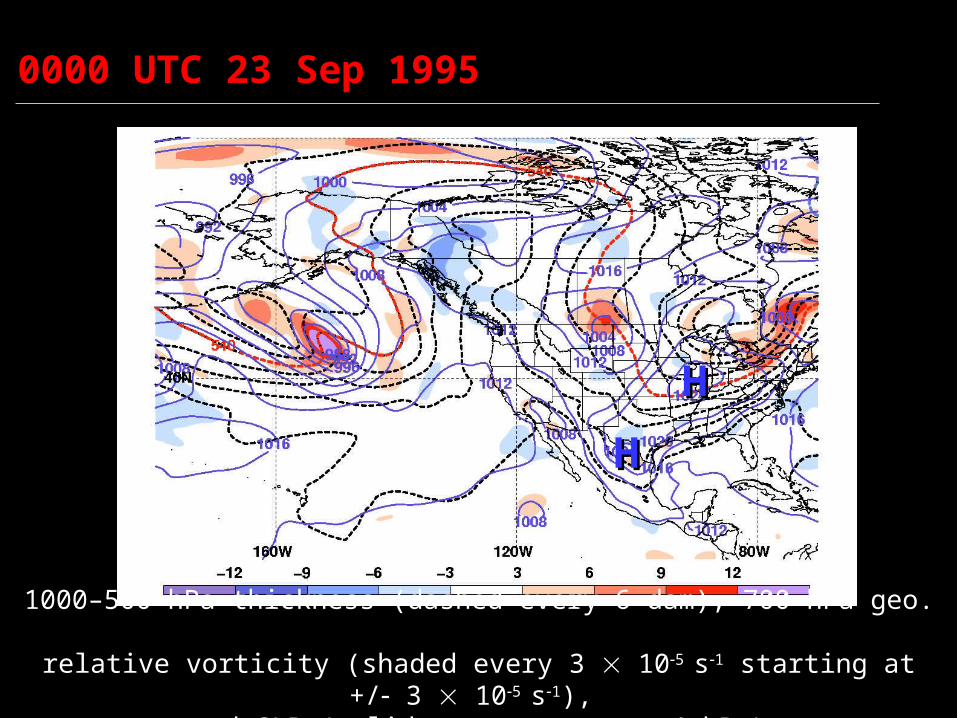
0000 UTC 23 Sep 1995
HH
HH
1000–500-hPa thickness (dashed every 6 dam), 700-hPa geo. relative vorticity (shaded every 3 105 s1 starting at +/ 3 105
s1), and SLP (solid contours every 4 hPa)
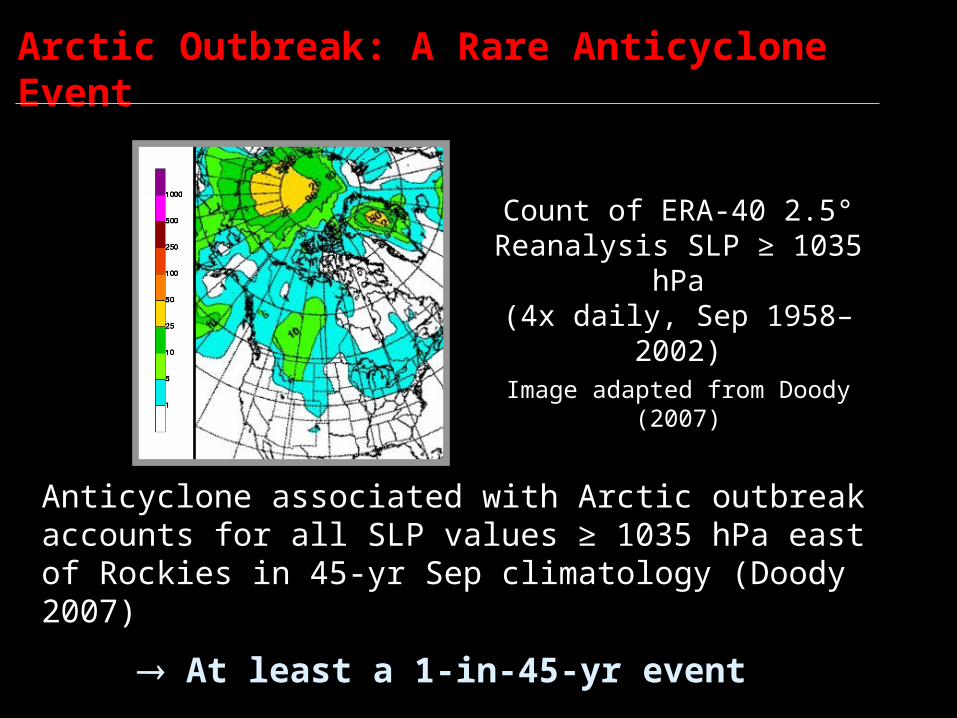
Arctic Outbreak: A Rare Anticyclone Event
Anticyclone associated with Arctic outbreak accounts for all SLP values ≥ 1035 hPa east of Rockies in 45-yr Sep climatology (Doody 2007)
At least a 1-in-45-yr event
Count of ERA-40 2.5° Reanalysis SLP ≥ 1035
hPa(4x daily, Sep 1958–
2002)Image adapted from Doody
(2007)
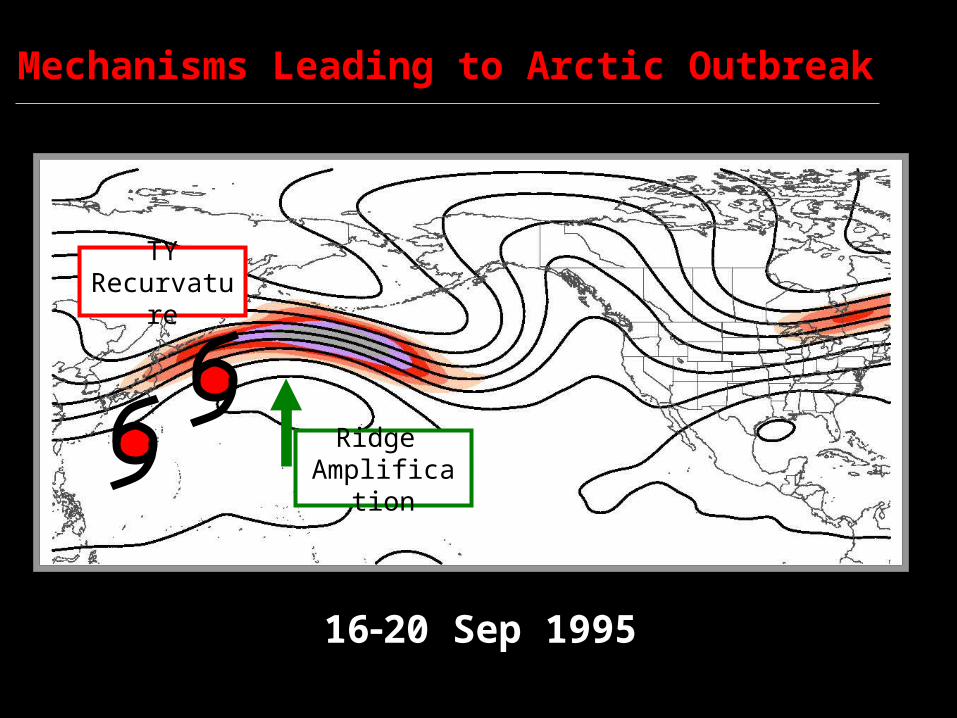
TY Recurvatu
re
Ridge Amplificati
on
1620 Sep 1995
Mechanisms Leading to Arctic Outbreak

Downstream
Development
Persistent Cyclogenes
is
1722 Sep 1995
Mechanisms Leading to Arctic Outbreak
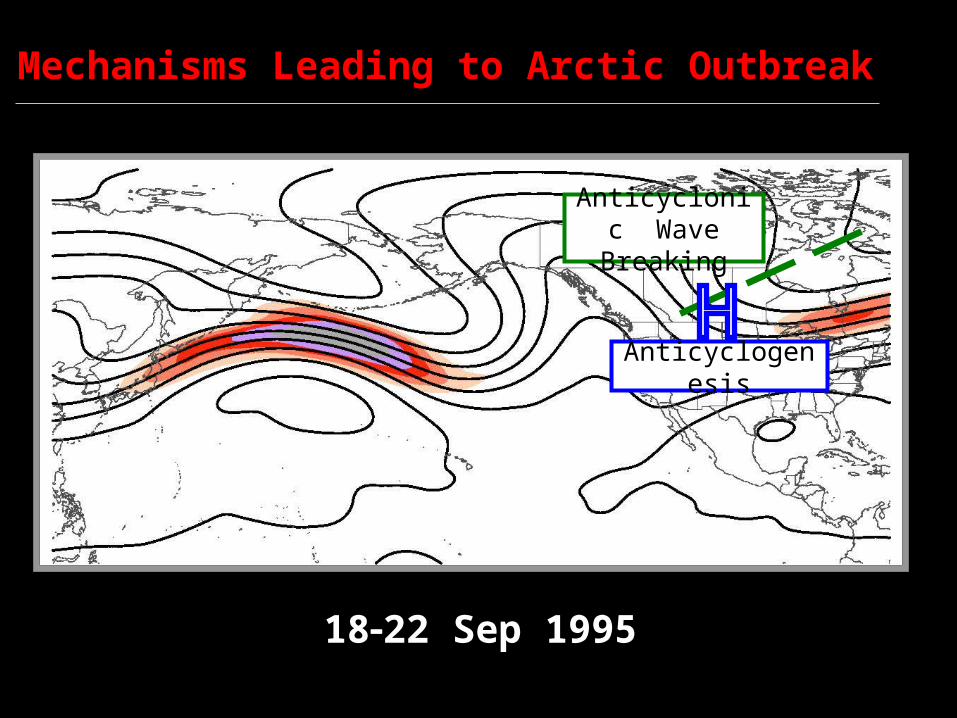
Anticyclonic Wave
Breaking
Anticyclogenesis
1822 Sep 1995
Mechanisms Leading to Arctic Outbreak
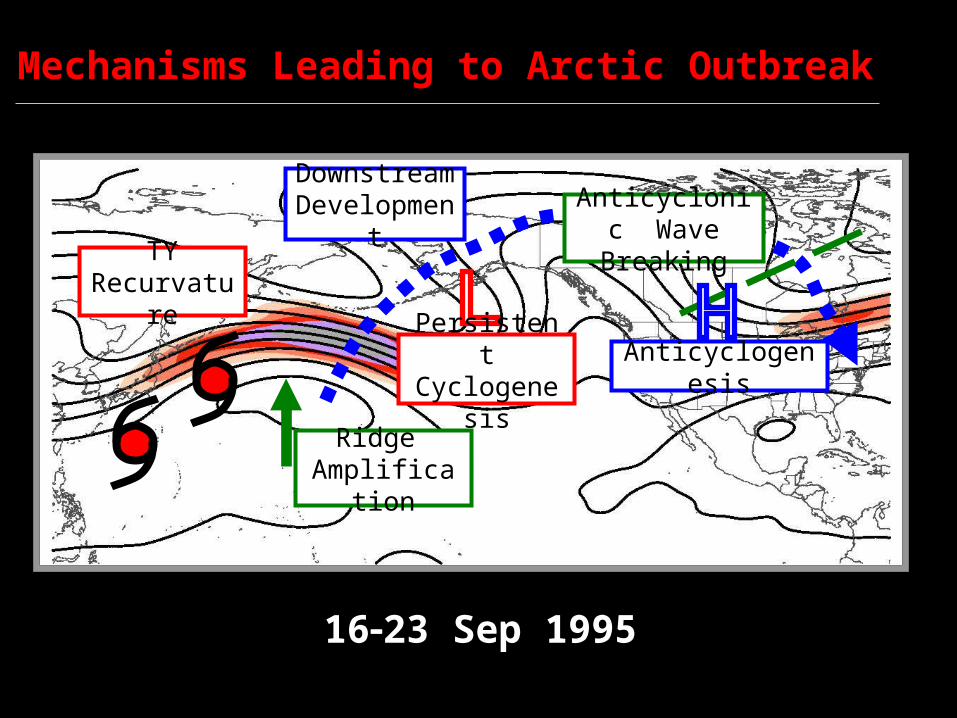
TY Recurvatu
re
Ridge Amplificati
on
Downstream
Development
Persistent Cyclogenes
is
Anticyclonic Wave
Breaking
Anticyclogenesis
1623 Sep 1995
Mechanisms Leading to Arctic Outbreak
Conclusions
• 2022 September 1995 continental U.S. Arctic outbreak is directly linked to recurving western Pacific typhoons via downstream development
• Surface anticyclone associated with Arctic outbreak is strongest September event in 2.5° ERA-40 dataset (19582002)
• Arctic outbreak characteristics are generally similar to characteristics of other documented cases (e.g., upstream omega block, surface anticyclogenesis, precursor cold surge, mountain range channeling)
• Apparent first documented case of an Arctic outbreak directly linked to upstream recurving tropical cyclones