i. spectrophotometric determination of cerium (iv) with 3
TRANSCRIPT
University of Windsor University of Windsor
Scholarship at UWindsor Scholarship at UWindsor
Electronic Theses and Dissertations Theses, Dissertations, and Major Papers
1-1-1970
I. Spectrophotometric determination of cerium (IV) with I. Spectrophotometric determination of cerium (IV) with
3-thianaphthenoyltrifluoroacetone II. Spectrophotometric 3-thianaphthenoyltrifluoroacetone II. Spectrophotometric
investigation of the reaction between neodymium (III) and investigation of the reaction between neodymium (III) and
3-thianaphthenoyltrifluoroacetone. 3-thianaphthenoyltrifluoroacetone.
A. Edward Veel University of Windsor
Follow this and additional works at: https://scholar.uwindsor.ca/etd
Recommended Citation Recommended Citation Veel, A. Edward, "I. Spectrophotometric determination of cerium (IV) with 3-thianaphthenoyltrifluoroacetone II. Spectrophotometric investigation of the reaction between neodymium (III) and 3-thianaphthenoyltrifluoroacetone." (1970). Electronic Theses and Dissertations. 6877. https://scholar.uwindsor.ca/etd/6877
This online database contains the full-text of PhD dissertations and Masters’ theses of University of Windsor students from 1954 forward. These documents are made available for personal study and research purposes only, in accordance with the Canadian Copyright Act and the Creative Commons license—CC BY-NC-ND (Attribution, Non-Commercial, No Derivative Works). Under this license, works must always be attributed to the copyright holder (original author), cannot be used for any commercial purposes, and may not be altered. Any other use would require the permission of the copyright holder. Students may inquire about withdrawing their dissertation and/or thesis from this database. For additional inquiries, please contact the repository administrator via email ([email protected]) or by telephone at 519-253-3000ext. 3208.
I SPECTROPHOTÜMETRIC DETERMINATIONOP CERIUM (IV) WITH
3-THTANAPHTHENOYLTRIFLUOROACETONE
II SPECTROPHOTOMETRIC INVESTIGATION OF THE REACTION BETWEEN NEODYMIUM (III) AND
3-THIANAPHTHENOYLTRIFLUOROACETONE
BY
A ThesisSubmitted to the Faculty of Graduate Studies through the Department of Chemistry in Partial Fulfillment
of the Requirements for the Degree of Master of Science at the
University of Windsor
Windsor, Ontario1970
Reproduced with permission of the copyright owner. Further reproduction prohibited without permission.
UMI Number: EC52843
INFORMATION TO USERS
The quality of this reproduction is dependent upon the quality of the copy
submitted. Broken or indistinct print, colored or poor quality illustrations and
photographs, print bleed-through, substandard margins, and improper
alignment can adversely affect reproduction.
In the unlikely event that the author did not send a complete manuscript
and there are missing pages, these will be noted. Also, if unauthorized
copyright material had to be removed, a note will indicate the deletion.
UMIUMI Microform EC52843
Copyright 2008 by ProQuest LLC.
All rights reserved. This microform edition is protected against
unauthorized copying under Title 17, United States Code.
ProQuest LLC 789 E. Eisenhower Parkway
PC Box 1346 Ann Arbor, Ml 48106-1346
Reproduced with permission of the copyright owner. Further reproduction prohibited without permission.

This thesis has been examined and approved by:)vea ny: iti/g\ ..r
_c
305830
Reproduced with permission of the copyright owner. Further reproduction prohibited without permission.
11
ABSTRACT
PART I
SPECTROPHOTOMETRIC DETERMINATION OF CERIUM (iV)WITH 3-t h i a n a p h t h e n o y e t r i f l u o r o a c e t o n e
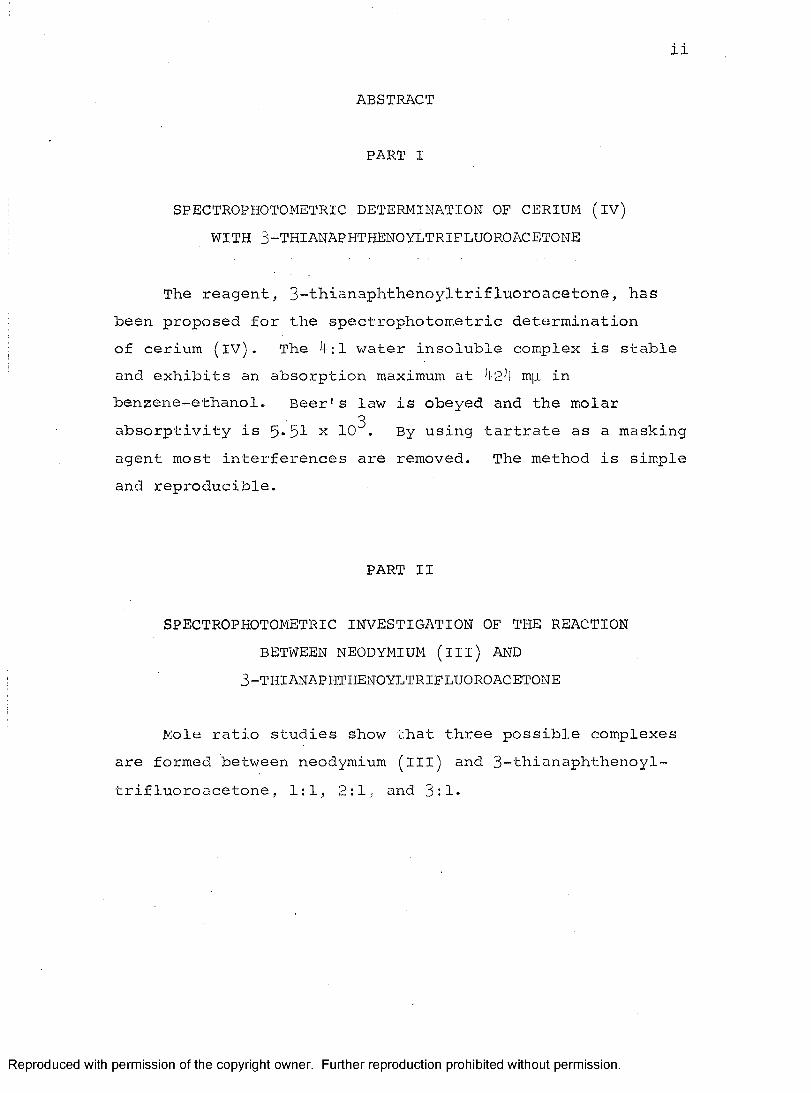
The reagent, 3-thianaphthenoyltri£luoroacetone, has been proposed for the spectrophotometric determination of cerium (iv). The 4:1 water insoluble complex is stable and exhibits an absorption maximum at m[i inbenzene-ethanol. Beer's law is obeyed and the molar
3absorptivity is 5*51 x 10 . By using tartrate as a masking agent most interferences are removed. The method is simple and reproducible.
PART II
SPECTROPHOTOMETRIC INVESTIGATION OF THE REACTION BETWEEN NEODYMIUM (ill) AND
3-t h i a n a p h t h e n o y l t r i f l u o r o a c e t o n e
Mole ratio studies show that three possible complexes are formed between neodymium (ill) and 3-thianaphthenoyl- trifluoroacetone, 1:1, 2:1, and 3:1.
Reproduced with permission of the copyright owner. Further reproduction prohibited without permission.

Xll
ACKNOWLEDGEMENTS
I would like to express my appreciation to Dr. W.J. Holland for his guidance during the course of this research.
I also wish to thank my committee for their valuable remarks. Furthermore, I am indebted to the staff and to my fellow students for their valuable assistance.
Acknowledgement is also extended to the University of Windsor for a Laboratory Assistantship.
Reproduced with permission of the copyright owner. Further reproduction prohibited without permission.

IV
TABLE OF CONTENTSPage
TITLE P A G E .......................................... iABSTRACT............................................ iiACKNOWLEDGEMENTS . , . , i üTABLE OF CONTENTS ............................... ivLIST OF FIGURES ................. viiLIST OF TABLES viiiGENERAL INTRODUCTION ................................ 1
PART I
SPECTROPHOTOMETRIC DETERMINATION OF CERIUM (IV) WITH
3-t h i a n a p h t h e n o y l t r i f l u o r o a c e t o n echapter
I. INTRODUCTION ..................................II. EXPERIMENTAL .................................
A. Materials and Apparatus ............1) Synthesis of 3-Thianaphthenoyl-
trifluoroacetone .................2) Properties of 3-Thianaphthenoyl-
trifluoroacetone as an Analytical Reagent. . . . ...................
3) Reagent Solution .................4) Standard Solutions ...............5) Instruments .....................
B. Procedure ...........................1) Recommended Procedure for the
Determination of Cerium (iv) . . .
466
67799
Reproduced with permission of the copyright owner. Further reproduction prohibited without permission.
V
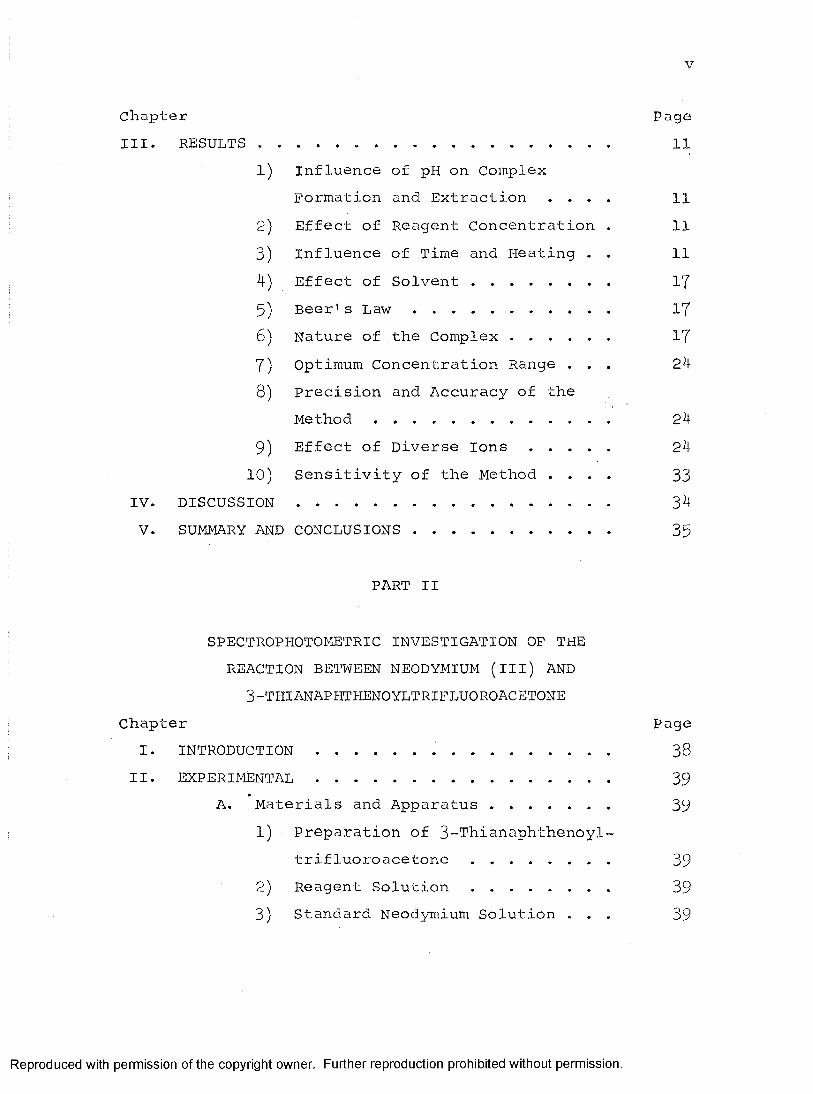
chapter PageIII. RESULTS....................................... 11
1) Influence of pH on ComplexFormation and Extraction . . . . 11
2) Effect of Reagent Concentration . 113) Influence of Time and Heating . . 114) Effect of Solvent............... 175) Beer's L a w ...................... 176) Nature of the Complex........... 177) Optimum Concentration Range . . . 248) Precision and Accuracy of the
M e t h o d ......................... 249) Effect of Diverse I o n s ......... 2410) Sensitivity of the Method . . . . 33
IV. DISCUSSION.................................. 34V. SUMMARY AND CONCLUSIONS...................... 35
PART II
SPECTROPHOTOMETRIC INVESTIGATION OF THE REACTION BETWEEN NEODYMIUM (ill) AND
3-t h i a n a p h t h e n o y l t r i f l u o r o a c e t o n eChapter Page
I. i n t r o d u c t i o n ............. 38II. EXPERIMENTAL................................ 39
A. Materials and Apparatus.............. 391) Preparation of 3-Thianaphthenoyl-
trifluoroacetone ............... 392) Reagent Solution ............... 393) standard Neodymium Solution . . . 39
Reproduced with permission of the copyright owner. Further reproduction prohibited without permission.

VI
chapter Page4) Instruments.......... 395) Experimental P r o c e d u r e....... 4-0
III. RESULTS...................................... 4l1) Effect of Solvent.............. 4l2) Influence of pH on Extraction . . 4l3) Effect of Ion Pair Formation
on Extraction................. . 4l4) Spectral Curve of the Chelate . . 475) Mole Ratio S t u d i e s ........... 47
IV. SUMMARY AND CONCLUSIONS.................... 50BIBLIOGRAPHY...................................... 51VITA AUCTORIS................ 53
Reproduced with permission of the copyright owner. Further reproduction prohibited without permission.
VXl
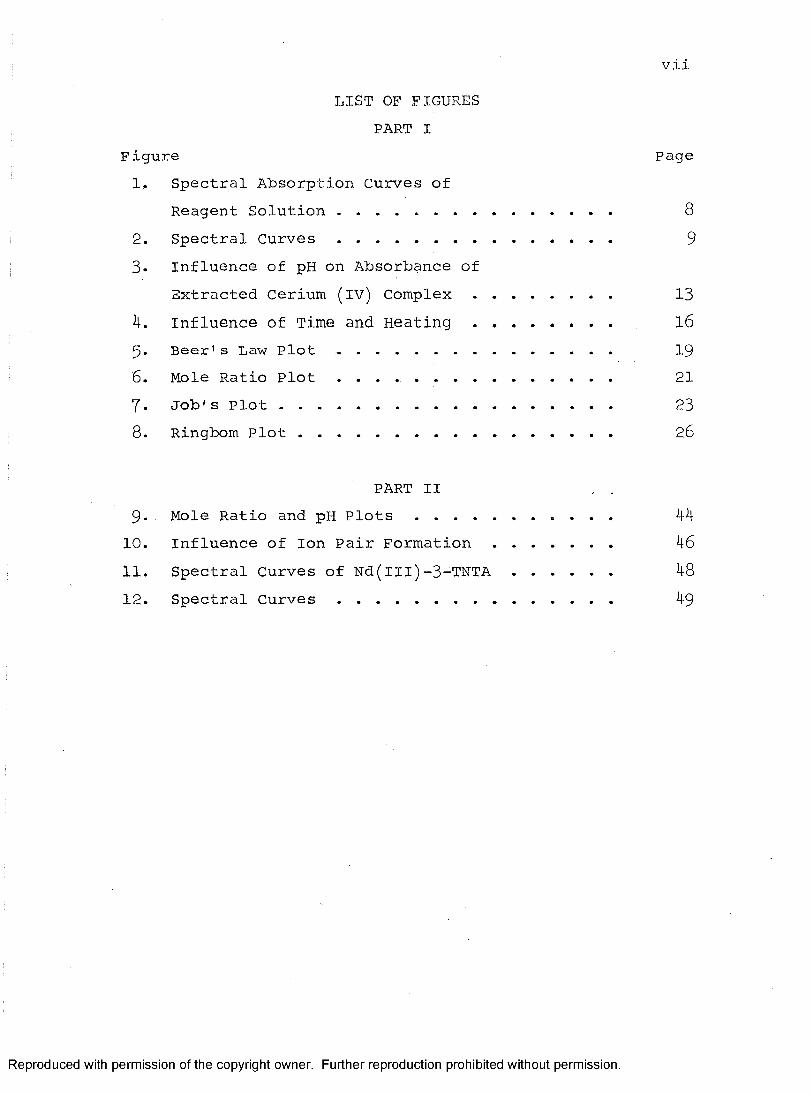
LIST OF FIGURES PART I
Figure Page1. Spectral Absorption Curves of
Reagent Solution ............................. 82. Spectral Curves .............................. 93. Influence of pH on Absorbance of
Extracted Cerium (iv) Complex ................ 134. Influence of Time and H e a t i n g ................ l65. Beer's Law P l o t .............................. 196. Mole Ratio P l o t ........... 217. Job's P l o t ..................................... 238. Ringbom P l o t ................................... 26
PART II . .9. Mole Ratio and pH P l o t s ...................... 4410. Influence of Ion Pair F o r m a t i o n ............. 4611. Spectral Curves of Nd(III)-3-TNTA ........... 4812. Spectral C u r v e s .............................. 49
Reproduced with permission of the copyright owner. Further reproduction prohibited without permission.

V l l X
TableI.
II.
III.
IV.V.
VI.VII.
VIII.IX.X.
X I .
XII.
LIST OF TABLES PART I
Influence of pH on Extraction Influence of Amount of 2 Percent 3-Thianaphtlienoyltr if luoroacetoneon Absorbance . . . . .............Effect of Time and Heating on Colour DevelopmentBeer's Law Data , , , . , . . . . .Mole Ratio Data Job's Plot DataRingbom Data . . . . . . . . . ........Reproducibility Data, 6.0 ppm Cerium . Reproducibility Data, 10.0 ppm Cerium Reproducibility Data, 20.0 ppm CeriumPrecision and Accuracy . . ..........Effect of Diverse Ions ...............
Page12
14
15 18 20 22 25272829
30
31,32
PART IIXIII. Data on Mole Ratio Studies and Effect of pH XIV. Influence of Ion Pair Formation on
Extraction . . . . .........................
42,43
45
Reproduced with permission of the copyright owner. Further reproduction prohibited without permission.

GENERAL INTRODUCTION
0-dlketones exist in a keto-enol tautomerism. In theirenolic form they have a hydrogen atom which can be replaced by a metal ion and a ketonic oxygen which completes the chelate ring.
-"(I -"(2 — CZk4:==(l --w 2 W II .O O O OHSome of the well-established ^-diketones are acetylacetone, dibenzoylmethane, and benzoylacetone (1). Thenoyltrifluoroacetone is one of the best of a group of fluorinated 0-diketones, R - COCH^ - COCFg. The trifluoromethyl group was introduced to increase the acidity of the enol form so that extractions from solutions of very low pH would be feasible. Thus a wide range of metals may be extracted without interference from hydrolysis.
The purpose of the present work was to investigate the organic reagent, 3-thianaphthenoyltrifluoroacetone,
in order to apply it to the determination of trace amounts of cerium (iv) and to investigate its reaction with neodymium (III).
Spectrophotometry affords the analytical chemist one of the simplest and fastest methods for trace metal analysis. It is based on converting the constituent to be determined
Reproduced with permission of the copyright owner. Further reproduction prohibited without permission.

into a substance which is strongly coloured (1). Such a solution shows differential absorption of light of different wavelengths.
For dilute solutions the Beer-Lambert fundamental law of colorimetry and spectrophotometry is found to be applicable.
IA = log = abc.
Iq = intensity of incident light beam; I = intensity oftransmitted light beam; A = absorbance; a = absorptivity;b = light path in cm.; c = concentration of coloured species.
Analytical methods based on measurements of light absorption often present few manipulative difficulties, are rapid, and are usually suitable for routine work. Furthermore, they can be extremely sensitive and consequently capable of detecting minute amounts of a substance. For these reasons, such methods are of great importance in trace analysis.
Organic reagents of this type generally combine with metal cations to form chelate rings. Most chelate forming compounds contain both an acidic and basic, electron donating, functional group. Upon interaction with both of these groups, the metal becomes part of a heterocyclic ring.Strain theory predicts that rings of this type would be mainly 5 and 6 membered. Thus the acidic and basic functions must be so situated, in the organic molecule, as to permit the closure of such rings.
Reproduced with permission of the copyright owner. Further reproduction prohibited without permission.

P A R T I
SPECTROPHOTOMETRIC DETERMINATION OF CERIUM (iV) WITH 3-THIANAPHTHENOYLTRIFLUOROACETONE
Reproduced with permission of the copyright owner. Further reproduction prohibited without permission.

CHAPTER I
INTRODUCTIONCerium (IV) can be determined colorimetrically by
various chelating agents; 8-hydroxyguinoline, cupferron, and 2-thenoyltrifluoroacetone (2). Xylenol Orange has also been reported to be adaptible for cerium (iv) determinations (3). Cerium (IV) in sulphuric acid can be estimated spectrophotometrically using its absorption maximum at 320 m|i. The oxidizing action of acid solutions of cerium (iv) on organic compounds which include anthranilic acid, brucine, and sulphanilic acid also serves as the basis of indirect colorimetric methods (4). Around 1930, Willard and Young (5) and Furman (6) made systematic studies into the analytical uses of cerium (iv) as a versatile oxidizing agent. Cerium is frequently determined by oxidizing to cerium (IV) with peroxydisulphuric acid in the presence of silver ion, adding an excess of iron (ll), and titrating the excess iron (ll) with cerium (IV) sulphate solution; tris (1, 10-phenan- throline) iron (ll) sulphate is used as the indicator.
Complex formation is the strongest with oxygen containing anionic ligands such as the 0-diketones (7)* Although the monoanion of acetylacetone reacts with many metal ions to give neutral complexes, the comparable complexes of thiophene-substituted acetylacetones are much more readily extractable into organic solvents.
Various substituted acetylacetones have been used for the spectrophotometric determination of trace metals (8, 9) •
In the present work, 3-thianaphthenoyltrifluoroacetone has been found to be a selective reagent for cerium (iv).
4
Reproduced with permission of the copyright owner. Further reproduction prohibited without permission.

5The reaction produces a water-insoluble chelate readily extractable into benzene-ethanol. The reaction was studied to determine such factors as optimum reagent concentration,, influence of time and heating on complex formation, effect of diverse ions, and precision and accuracy.
Reproduced with permission of the copyright owner. Further reproduction prohibited without permission.

CHAPTER II
EXPERIMENTAL
A. Materials and Apparatus
1) Synthesis of 3-ThianaphthenoyltrifluoroacetoneMethyl-3-thianaphthenyl ketone was prepared by
acétylation of thianaphthene according to the procedure of Farrar and Levine (10). A mixture of methyl-3-thianaphthenyl and methyl-2-thianaphthenyl ketones was obtained; they were separated by crystallization from ethanol and petroleum ether. The melting point of 62° - 63°C for the 3-isomer corresponded to the literature value of 64° - 65°C. The semicarbazone derivative of the 3-isomer melted at 248° - 24g°C while the literature gave a value of 249° - 250°C (11). Reaction of the methyl-3-ketone with ethyl trifluoroacetone by the method of Barkley and Levine (12) gave the desired product, 3-thianaphthenoyltrifluoroacetone. The melting point of this compound was 58° - 59°C compared to the literature value of 58.5° - 59-5°C.
2) Properties of 3-Thianaphthenoyltrifluoroacetone as an Analytical ReagentChelates formed with this type of reagent, contain
ing one uncharged and one anionic basic functionality, are far less soluble in water than they are in organic solvents (13) This reduces the distribution ratio of the chelate between the aqueous and organic phases and results in a more complete extraction. The fact that the extracted reagent is colourless
Reproduced with permission of the copyright owner. Further reproduction prohibited without permission.
7is also important. This property is primarily applicable to visible spectrophotometry 'where absorption due to an excess of a coloured reagent could constitute an interference unless corrected for in some way. The ideal reagent would show little or no absorption in the visible region of the spectrum iwhere analytical measurements of a coloured complex are made.
3) Reagent SolutionA 2fo w/v solution of the reagent in 95? ethanol
was used. The reagent solution was quite stable as shown by the nearly identical absorption curves (Fig. 1) for a 2°fo
freshly prepared solution and another, two weeks old. During this period the reagent solution was protected from light and no discolouration occurred. The absorbance due to reagent is small compared to the complex (Fig. 2).
4) Standard SolutionsAll chemicals used were of reagent grade. The
standard cerium (iV) solution was prepared from 99*9^ Ce(SO^) which was standardized by titration according to the method outlined in "Reagent Chemicals and Standards" (l4). The standard solution was made up to contain 1 mg. per millilitre. This solution was further diluted to give a standard cerium (iV) solution containing 100 pg per ml. Solutions of diverse cations were prepared from their chlorides or nitrates. Arsenic, molybdenum, rhenium, and selenium solutions were prepared from the corresponding oxides. Diverse anion solutions were prepared from reagent grade sodium or potassium salts.
ACS grade sodium tartrate, benzene, and ethanol were used without further purifications.
Reproduced with permission of the copyright owner. Further reproduction prohibited without permission.
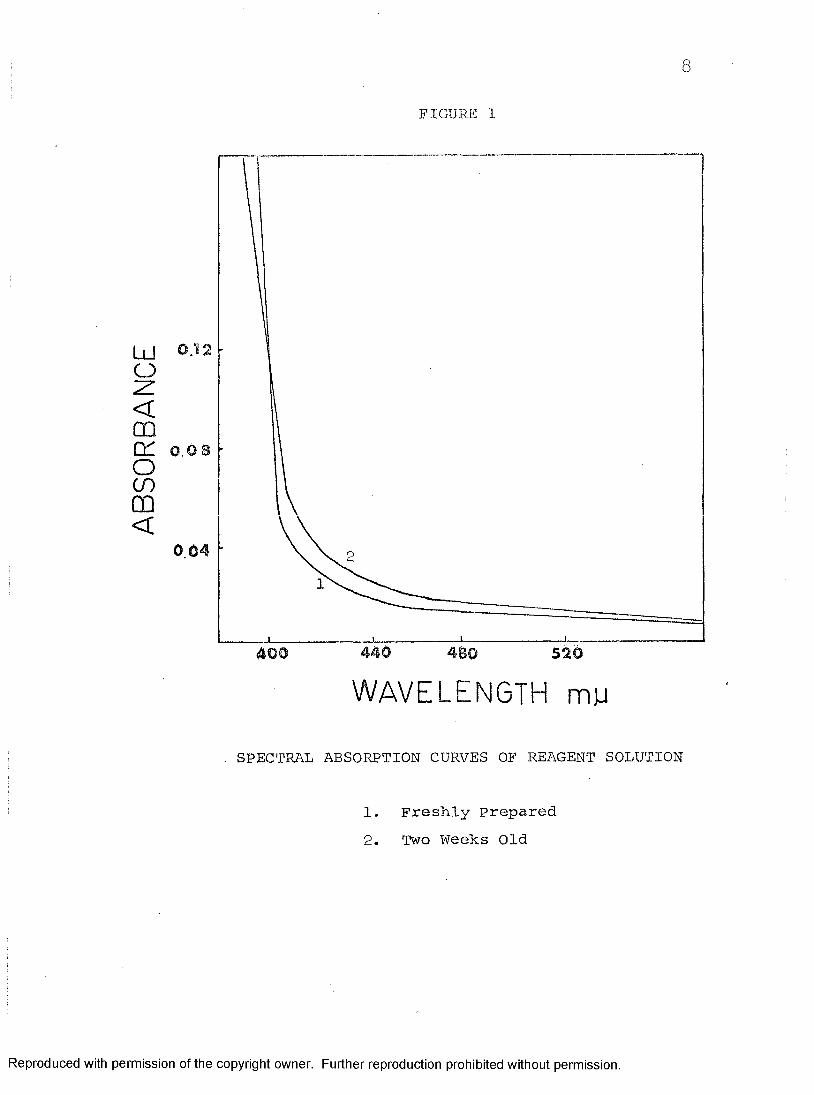
FIGURE 1
<m
008oenC Û<
0Ù4
440 480 520400WAVELENGTH mu
SPECTRAL ABSORPTION CURVES OF REAGENT SOLUTION
1. Freshly Prepared2. Two Weeks Old
Reproduced with permission of the copyright owner. Further reproduction prohibited without permission.

FIGURE 2 9
0.4
LUOz<00û:ocoCÛ 0.2<
420 500460 540
WAVELENGTH mu
SPECTRAL CURVES1. Reagent in Ethanol2. 6.00 ppm cerium3. 8.00 ppm cerium4. 10.00 ppm cerium5. 12.00 ppm cerium
Reproduced with permission of the copyright owner. Further reproduction prohibited without permission.
10
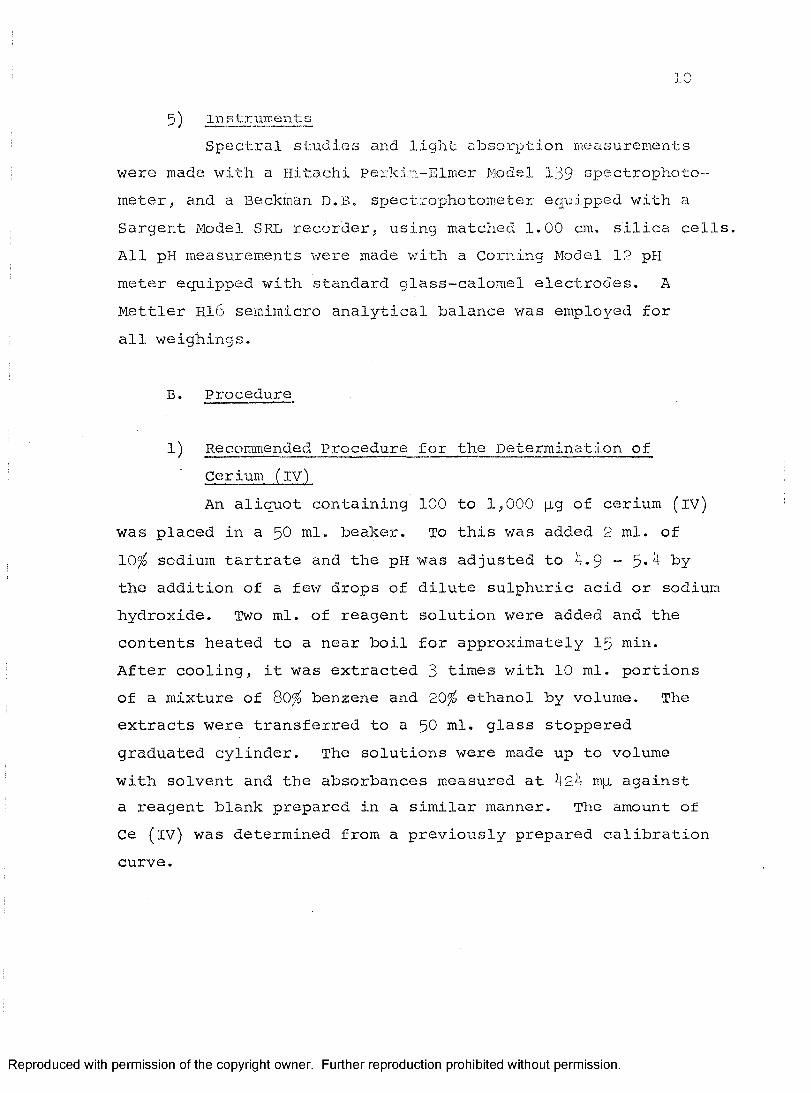
5) InstrumentsSpectral studies and light absorption measurements
were mad^ with a Hitachi Perkin-Elmer Model 13^ spectrophotometer, and a Beckman D.B. spectrophotometer equipped with a Sargent Model SRE recorder, using matched 1.00 cm. silica cells, All pH measurements were made with a Corning Model 12 pH meter equipped with standard glass-calomel electrodes. A Mettler Hi6 semimicro analytical balance was employed for all weighings.
B. Procedure
1) Recommended Procedure for the Determination of Cerium (iv)An aliquot containing 100 to 1,000 pug of cerium (iv)
was placed in a ^0 ml. beaker. To this was added 2 ml. of 10^ sodium tartrate and the pH was adjusted to 4.9 - 5*9 by the addition of a few drops of dilute sulphuric acid or sodium hydroxide. Two ml. of reagent solution were added and the contents heated to a near boil for approximately 15 min.After cooling, it was extracted 3 times with 10 ml. portions of a mixture of 80^ benzene and 20^ ethanol by volume. The extracts were transferred to a 90 ml. glass stoppered graduated cylinder. The solutions were made up to volume with solvent and the absorbances measured at 424 m|i against a reagent blank prepared in a similar manner. The amount of Ce (iv) was determined from a previously prepared calibration curve.
Reproduced with permission of the copyright owner. Further reproduction prohibited without permission.

CHAPTER III
RESULTS
1) Influence of pH on Complex Formation and ExtractionThe optimum pH in the aqueous phase for extraction
was between 4-9 and 5.7 as seen from Table I and Fig. 3*After three extractions the absorbance readings were constant.
2) Effect of Reagent ConcentrationA large excess of reagent could be used. There was
no significant change in absorbance when 0.75 or 8.00 ml. of the reagent solution was used (Table Ii). Low absorbance readings were obtained for O.5O ml. of reagent solution or less. The absorption characteristics of the reagent are compared with the complex in Fig. 2. There was slight absorption of reagent at 424 mp., the wavelength where the extracted complex absorbs.
3) Influence of Time and HeatingTable III and Fig. 4 illustrate the effect of both
time and heating on the development of the cerium complex. Within the pH range of the determination the cerium complex was completely developed after heating for approximately 15 minutes at a near boil. Heating for one hour also gave satisfactory results. If no heating was employed, colour development increased with time,but even after 45 minutes, was below the absorbance reading when heated for 5 minutes.The benzene-ethanol extract was stable for at least 2 weeks in direct light and indefinitely stable in the dark.
11
Reproduced with permission of the copyright owner. Further reproduction prohibited without permission.

12TABLE I
INFLUENCE OF pH ON EXTRACTION (10.0 ppm cerium)
Absorbance at 424 mp.
pH
0.105 1.00.114 1.50.129 2.00.150 2.50.184 3.00.231 3.50.280 4.00.303 4 .2
0 .342 4.50.386 4.80.391 4.90.393 5.00.393 5.10.392 5.20.390 5.40.390 5.50.391 5.60.390 5.70.375 6 .00.360 6.20.336 6.70.316 7.20.300 8 .0
Reproduced with permission of the copyright owner. Further reproduction prohibited without permission.

FIGURE 3 13
0.4
0.3
ÜÜCz<00g 0.2coCO<
2 4 6
P HINFLUENCE OF pH ON ABSORBANCE OF
EXTRACTED CERIUM (iV) COMPLEX
Reproduced with permission of the copyright owner. Further reproduction prohibited without permission.

I k
TABLE II
INFLUENCE OF AMOUNT OF 2 PERCENT 3-THIANAPHTHENOYLTRIFLUOROACETONE ON
ABSORBANCE (10.0 ppm cerium)
Reagent Solution Absorbanceml. at k 2k mji
0.50 0.3490.75 0.3891.00 0.3932.00 0.3943.00 0.3925.00 0.3927.00 0.3938.00 0.3919.00 0.368
Reproduced with permission of the copyright owner. Further reproduction prohibited without permission.
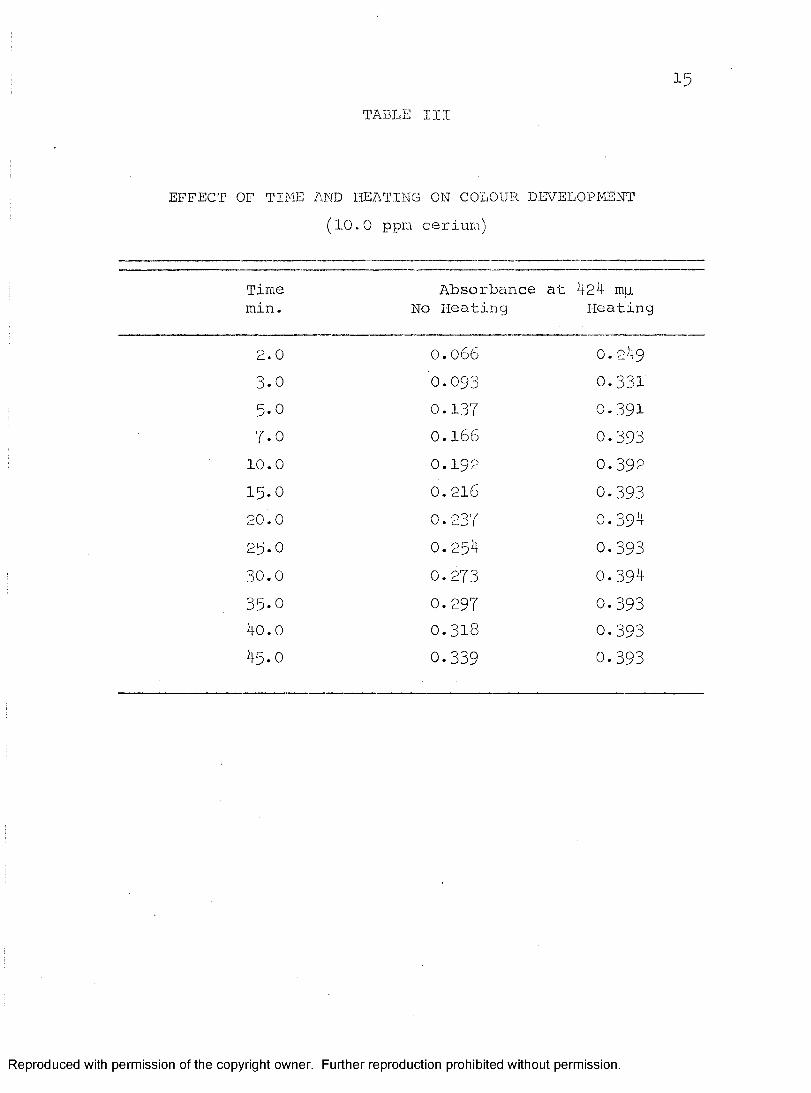
15T A B L E I I I
EFFECT OF TIME AND HEATING ON COLOUR DEVELOPMENT(10.0 ppm cerium)
Time Absorbance at 424 mjj,min. No Heating Heating
2.0 0.066 0.2493 .0 0.093 0.3315.0 0.137 0.3917.0 0.166 0.393
10.0 0.192 0.39215.0 0.216 0.39320.0 0.237 0.39425.0 0.254 0.39330.0 0.273 0.39435.0 0.297 0.39340.0 0.318 0.39345.0 0.339 0.393
Reproduced with permission of the copyright owner. Further reproduction prohibited without permission.

FIGURE 4 16
r)
30NvadosavINFLUENCE OF TIME AND HEATING
1. No Heating2. Heating
o
oCELU
Reproduced with permission of the copyright owner. Further reproduction prohibited without permission.
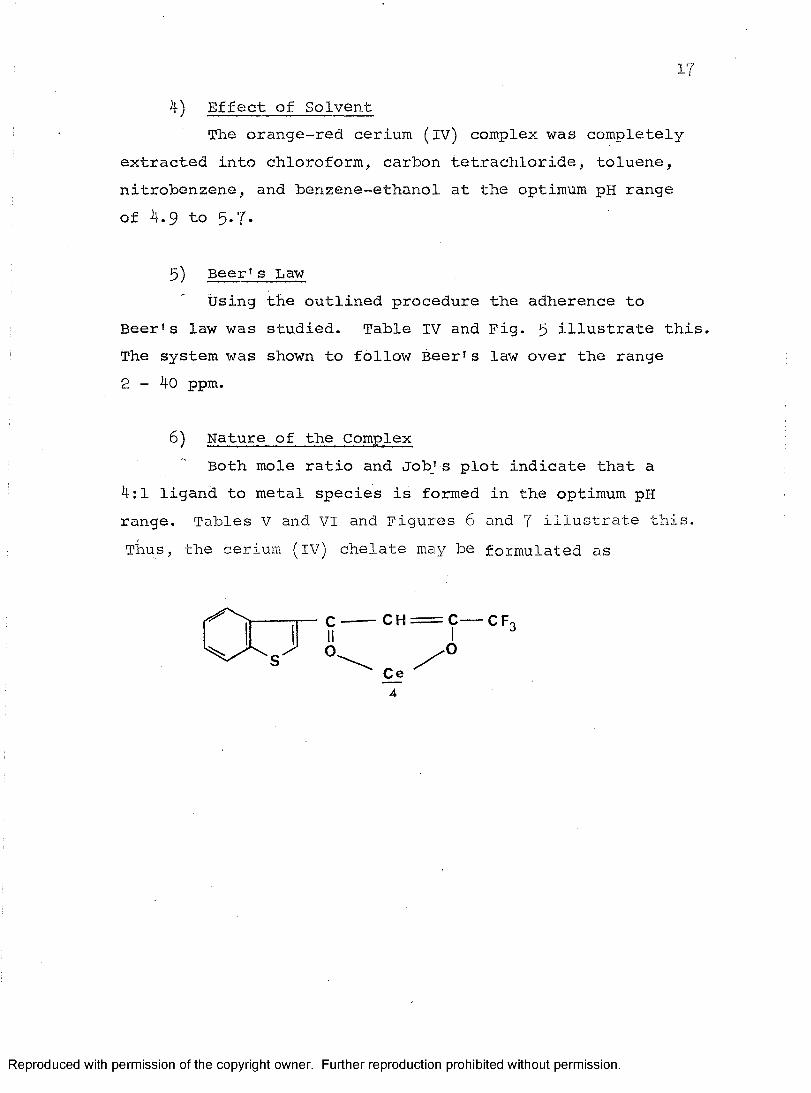
174) Effect of Solvent
The orange-red cerium (iv) complex was completely extracted into chloroform, carbon tetrachloride, toluene, nitrobenzene, and benzene-ethanol at the optimum pH range of 4.9 to 5.7.
5) Beer's LawUsing the outlined procedure the adherence to
Beer's law was studied. Table IV and Fig. 5 illustrate this. The system was shown to follow Beer's law over the range 2 - 4 0 ppm.
6) Nature of the ComplexBoth mole ratio and Job's plot indicate that a
4:1 ligand to metal species is formed in the optimum pH range. Tables V and VI and Figures 6 and 7 illustrate this. Thus, the cerium (iv) chelate may be formulated as
Reproduced with permission of the copyright owner. Further reproduction prohibited without permission.

18T A B L E I V
BEER'S LAW DATA
Sample Concentrationppm.
Absorbanceat 424 mp.
1 2.0 0.0702 4 .0 0.157
3 6.0 0.2394 8.0 0.314
5 10.0 0.3936 12.0 0.471
7 14.0 0.5508 16.0 0.6259 18.0 0.70710 20.0 0.78311 22.0 0.85912 24.0 0.93613 26.0 1.0114 28.0 1.0915 36.0 1.72l6 40.0 1.84
Reproduced with permission of the copyright owner. Further reproduction prohibited without permission.

FIGURE 6 19
o
00o
DcrLUo
zCL CL
33NV8yOS8VBEER'S LAW PLOT
OF EXTRACTED CERIUM (iV) COMPLEX
Reproduced with permission of the copyright owner. Further reproduction prohibited without permission.
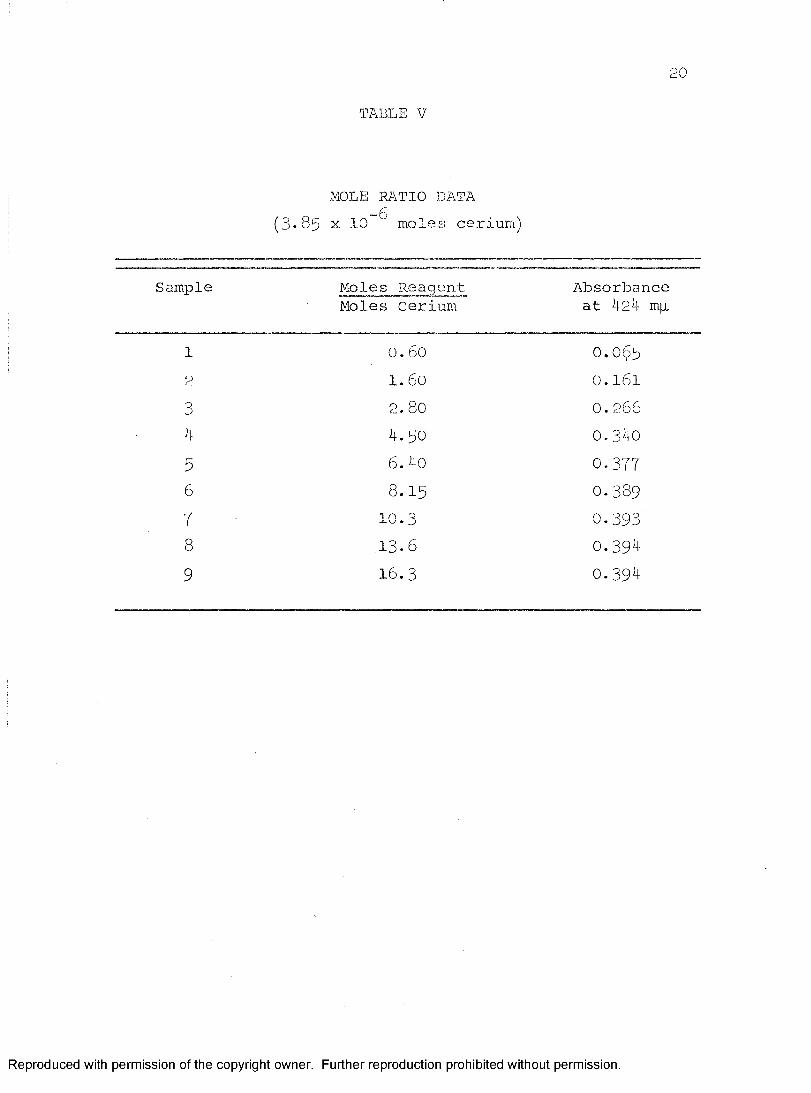
TABLE V
MOLE RATIO DATA -6(3"89 X 10 moles cerium)
Sample Moles ReagentMoles cerium
Absorbance at 424 m|i
1 0.60 0.0$52 l.6o 0.1613 2.80 0.2664 4.50 0.3405 6 .40 0.3776 8.15 0.389'r 10.3 0.3988 13.6 0.3949 16.3 0.394
Reproduced with permission of the copyright owner. Further reproduction prohibited without permission.

21FIGURE 6
I4"d nd
esd30NV8H0S8V
MOLE RATIO PLOT
SLUOLUO
û:LUCLQZ<O
u_ocoLUO
Reproduced with permission of the copyright owner. Further reproduction prohibited without permission.

TABLE VI
JOB'S PLOT DATA
22
Sample Mole Fraction Ligand Absorbance
1 1.000 0.0002 0.951. 0.1193 0.901 0.2364 0.852 0.3595 0.801 0 .4846 0.700 0.4367 0.601 0.3828 0.500 0.3139 0.400 0.251
10 0.300 0.19111 0.000 0.000
Reproduced with permission of the copyright owner. Further reproduction prohibited without permission.

FIGURE 7 23
\ ;
30Nvadosav
00
Q Z<O
o o
<e n
LU_jo
J O B 'S PLO T
Reproduced with permission of the copyright owner. Further reproduction prohibited without permission.

24
7) Optimum Concentration RangeIt is often desireable to determine the optimum
concentration range of a specific method. The Ringbom method, a plot of percent absorptancy (100 minus transrnittancy) versus the logarithm of concentration, produces a curve with an inflection point. This plot has a virtually linear segment corresponding to the optimum concentration range.For the present work the optimum concentration range was found to be 2.6 to l4.6 ppm cerium as indicated in Table VII and Fig. 8.
8) Precision and Accuracy of the MethodThe precision and accuracy of the method was studied
by analyzing known amounts of cerium (iV) solutions using the outlined procedure, (Tables VIII, IX, X and Xl).
9) Effect of Diverse ionsAn extensive foreign ion study was undertaken to
make the procedure as diversified as possible. Variouscations or anions were added, (Table XIl) to $00 pg of cerium and the outlined procedure followed. An error of 2% in the absorbance reading was considered tolerable.
As can be seen iron, tin, vanadium, fluoride, and the lanthanides interfere severely. None of the common masking agents, EDTA, citrate, phosphate, or thiourea, could be used to mask these interferences as they themselves interfere.
Reproduced with permission of the copyright owner. Further reproduction prohibited without permission.

25T A B L E V I I
RINGBOM DATA
Absorbanceat 424 mpL
Transmittance ^ T
Absorptancy 100 - T
Concentrationppm
0.045 87.6 12.4 1.00.070 83.5 ' 16.5 2.00.122 76.0 24.0 3.00.157 69.2 30.8 4.0
0.239 57.6 42.4 6.00.314 48.1 51.9 8.00.393 40.1 59.9 10.00.471 33.7 66.3 12.00.550 27.6 72.4 14.0
0.625 23.2 76.8 16.00.707 19.1 80.9 18.00.781 16.3 83.7 20.0
0,859 13.9 86.1 22.0
Reproduced with permission of the copyright owner. Further reproduction prohibited without permission.
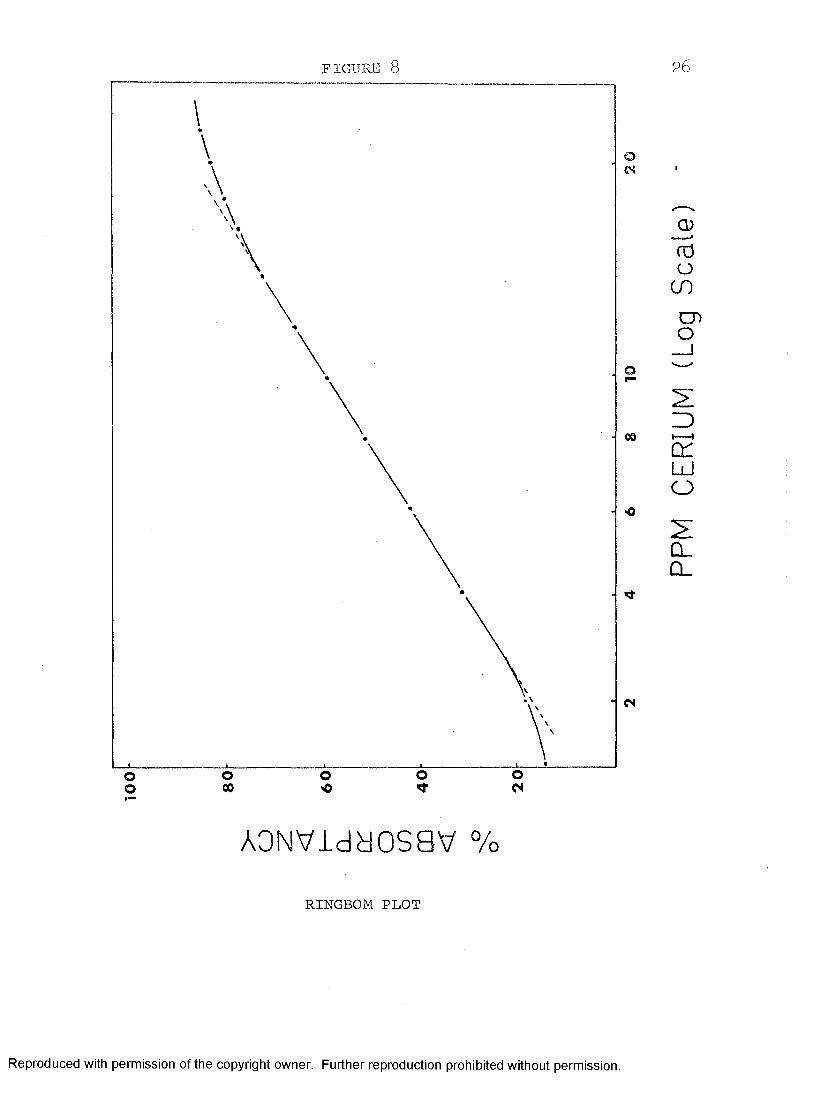
FIGURE 8 26
.\
OOooo
o(S
co
es
O )rOO
coeno
Z)crLUo
CL CL
00 es
AONViddOSaV %RINGBOM PLOT
Reproduced with permission of the copyright owner. Further reproduction prohibited without permission.

27
T A B L E V I I I
■ E P R O D U C IB IL IT Y D A T A , 6.0 ppm Cerium
^Experiment Absorbance Deviationat 424 mp. From Average
0.239 O.QOO2 0.238 0.0013 0.241 0.0024 0.237 0.0025 0.239 0.000
' 6 0.239 0.0000.240 0.001
8 0.239 0.0009 0.238 0.00110 0.239 0.000
Average = 0.239Relative standard Deviation = 0.$6^
Reproduced with permission of the copyright owner. Further reproduction prohibited without permission.

28TABLE IX
REPRODUCIBILITY DATA, 10.0 ppm Cerium
Experiment Absorbance at 424 mpL
Deviation From Average
1 0.393 . 0.0002 0.391 0.0023 0.394 0.0014 0.393 0.0005 0.393 0.0006 0.392 0.0017 0.394 0.0018 0.393 0.0009 0.393 0.00010 0.393 0.000
Average = 0.393Relative Standard Deviation = 0.31^
Reproduced with permission of the copyright owner. Further reproduction prohibited without permission.
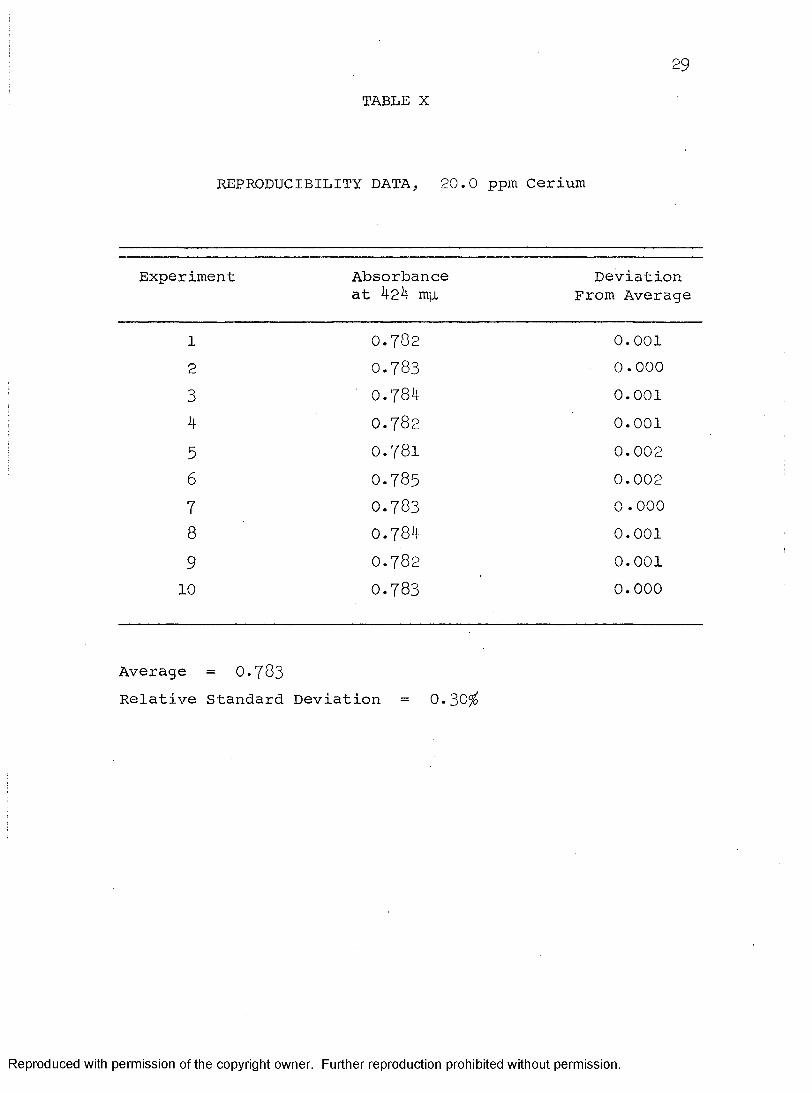
29TABLE X
REPRODUCIBILITY DATA, 20.0 ppm Cerium
Experiment Absorbanceat 424 mp.
Deviation From Average
1 0 .7 8 2 0.0012 0 .7 8 3 0.0003 0.784 0.0014 0 .7 8 2 0 .0 0 1
5 0 .7 8 1 0.0026 0 .7 8 5 0.0027 0 .7 8 3 0.0008 0.784 0.0019 0 .7 8 2 0.00110 0 .7 8 3 0.000
Average = O .783
Relative Standard Deviation = 0.30^
Reproduced with permission of the copyright owner. Further reproduction prohibited without permission.

3 0
T A B L E X I
PRECISION AND ACCURACY
Experiment Cerium Absorbance Relative Relativeppm at 424 mp. Stand. Dev. Stand. Dev,
0 ppm
1 6.0 , 0.239 0.96 0.062 10.0 0.393 0.31 0.033 20.0 0 .783 0.30 0.06
Reproduced with permission of the copyright owner. Further reproduction prohibited without permission.

31
TABLE XII
EFFECT OF DIVERSE IONS 10.0 ppm Cerium
Ion Amount(mg) Absorbance at 424 mu
- 0.0 0.393Ag+ 2.5 0 .3 9 6As+3 5.0 0 .3 94Au*3 10.0 0 .3 9 0Ba+2 2.0 0 .3 94
Be*^ 10.0 0 .393Bi+2 5 . 0 0 .3 9 2
Br“ 10.0 0.393
Ca*^ 10.0 0 .3 9 0
Cd+^ 10.0 0 .3 9 1Ce’*' 4.0 0 .3 9 2
Cl" 10.0 0 .3 93
Co'*' 10 .0 0 .3 9 1Cr+3 10 .0 0 .3 9 0
Cu+^ 5 . 0 0 .3 8 7
Er+3 5 .0 0.093
Fe^^ 5 .0 0 .183
10 .0 , 0 .394
10.0 0 .3 9 1ln^3 2 .0 0.393Ir+3 10.0 0 .3 9 2
10.0 0.393La+^ 5 .0 0 .1 6 7
10.0 0 .3 9 2
.continued
Reproduced with permission of the copyright owner. Further reproduction prohibited without permission.

32
TABLE XII continued
Mn^^
Na+Nd+3Ni^2NO
Pd+^Pr+3Pt+2Re+7Rh+3Ru*3Sb+3Se+4Sm+3SO = Sr+2 Te+4Th^^t i+3Y+3
10.0 0.389
10.0 0.39110.0 0.393
5 . 0 0.203
10.0 0.387
10.0 0.39110.0 0.39610.0 0.3955.0 0.05210.0 0.39710.0 0.389
2.5 0.3965.0 0.3925.0 0.3905.0 0.3925.0 0.123
10 .0 0.39310.0 0.3905.0 0.3965.0 0.390
10 .0 0.3905.0 0.264
2.5 0.394
Reproduced with permission of the copyright owner. Further reproduction prohibited without permission.

' 3310) Sensitivity of the Method
For comparative purposes the sensitivity of amethod can be described in terms of the molar absorptivity of the solution for the wavelength of maximum absorption (I5) In the present work the molar absorptivity was found to be 5.51 X 10 at 424 m|i, based on
a = Abe
0.393-6500 X 10 1000* 140.12 * 50
5.51 X 10^
Alternately, the spectrophotometric sensitivity can be defined as the number of micrograms of element, convertedto the coloured product, which, in a column of solution
2having a cross-sectional area of 1 cm , shows an absorbanceof 0 .001. This is referred to as the Sandell sensitivity(15,16). Based on this definition, the cerium chelate in
_2benzene-ethanol had a sensitivity of 0.025 pg-cm as shown below.
X 0.001.393-2= 0.025 P9'cm
Reproduced with permission of the copyright owner. Further reproduction prohibited without permission.
CHAPTER IV
DISCUSSIONIn the present work, a procedure was developed for the
spectrophotometric determination of cerium (iv) based on the formation of an intensely coloured 4:1 water-insoluble complex. The complex could be extracted into benzene- ethanol, resulting in a procedure which was relatively free from interferences. The method was rapid, and the complex stable. Beer's law was obeyed and no critical parameters were encountered.
Stary has reported that there are colorimetric methods for cerium (IV), for example, 8-hydroxyquinoline and 2- thenoyltrifluoroacetone (2). The 8-hydroxyquinoline procedure is relatively free from interferences, but the process is very time-consuming. The 2-thenoyltrifluoroacetone procedure is, on the other hand, fast, but many metals interfere. However, with the present reagent the procedure is both fast and relatively free from interferences.
34
Reproduced with permission of the copyright owner. Further reproduction prohibited without permission.

CHAPTER V
SUMMARY AND CONCLUSIONSThe spectrophotometric determination of cerium (IV)
described in this thesis involved the extraction of the cerium (iv)-3-thianaphthenoyltrifluoroacetone complex from an aqueous solution of pH 4.9 - 5-7, into benzene-ethanol and the measurement of the absorbance at 424 mji.
A 2 percent solution of 3-tbianaphthenoyltrifluoroacetone in 95 percent ethanol was used and was found to be stable for over tv/o weeks.
The /3-diketone was prepared by the methods of Farrar and Levine (10) and Barkley and Levine (12).
A number of critical parameters were studied. The maximum colour intensity developed between a pH of 4 .9 and 5-7* Stable absorbance readings were obtained for the range 0 .75 to 8.0 ml. of reagent solution. Absorption due to reagent at 424 m|i was slight. The orange-red colour developed to a maximum intensity after 5 minutes of heating was employed and was stable for at least two weeks. The procedure follows Beer's law over the range 2 to 40.0 ppm cerium and was found to be precise and accurate. The foreign ion study showed the procedure to be widely applicable and few metals were found to interfere.
The new reagent, 3-thianaphthenoyltrifluoroacetone, hastbree advantages over the analagous, and w i d e l y usedcompound 2-thenoyltrifluoroacetone in the determination of cerium (iv).
-21. The sensitivity is greater, 0.025 hU'Cm as^ -2 compared to O.O56 ug.cm
35
Reproduced with permission of the copyright owner. Further reproduction prohibited without permission.

362. The maximum absorbance occurs at 4z4 m^ at which
wavelength there is only slight absorbance due to reagent (Fig. 2), whereas, the 2-thenoyltrifluoroacetone-cerium complex exhibits a maximum absorbance in the region where the reagent absorbs strongly.
3. Following the recommended procedure, tartrate does not interfere and therefore may be used as a masking agent. With 2-thenoyltrifluoroacetone tartrate interferes severely.
The procedure described herein has been accepted for publication (I?)-
Reproduced with permission of the copyright owner. Further reproduction prohibited without permission.

PART II
SPECTROPHOTOMETRIC INVESTIGATION OF THE REACTION BETWEEN NEODYMIUM (ill) AND
3-THIANAPHTHENOYLTRIFLUOROACETONE
Reproduced with permission of the copyright owner. Further reproduction prohibited without permission.

CHAPTER I
INTRODUCTIONThe special properties of the transition metal ions
are attributable directly to their incompletely filled d orbitals; the rare earths owe their similarities to the possession of incompletely filled f orbitals (18); but the screening of the 4f orbital electrons by the 5^ orbital electrons results in the formation of few lanthanide element complexes. Most of the ones that are formed are with oxygen compounds. The ^-diketones, such as acetylacetone and thenoyltrifluoroacetone, form complexes of stoichiometry M(jS-diketonate) (ig).
The work undertaken with the neodymium (lIl)-3- thianaphthenoyltrifluoroacetone system involved a study on the effect of ion pair formation, a mole ratio study, and the influence of pH on extraction.
38
Reproduced with permission of the copyright owner. Further reproduction prohibited without permission.
C H A P T E R I I
EXPERIMENTAL
A. Materials and Apparatus1) Preparation of 3-Thianaphthenoyltrifluoroacetone
The reagent was synthesized by the method outlined in Part I with the exception that a 20°/o excess of ethyl trifluoroacetate was used. (An error in the procedure of Farrar and Levine (10) results in an excess of the monoketone used in the synthesis causing a slight contamination of the product.)
2) Reagent Solution-6A reagent solution containing 1.00 x 10 moles
of 3-thianaphthenoyltrifluoroacetone per millilitre was made up in 95^ ethanol.
3) standard Neodymium SolutionPurified reagent grade neodymium (ill)-chloride
hexahydrate was used. It was standardized gravimetrically by precipitating the neodymium with concentrated ammonium hydroxide and weighing the neodymium as Nd^Og after ignitionto the oxide (20).
The standard solutions used contained 1.25 and 2.50X 10 moles of neodymium (ill) per millilitre.
4) InstrumentsSpectral studies and light absorption measurements
were made on a Beckman D.B. spectrophotometer equipped with
39
Reproduced with permission of the copyright owner. Further reproduction prohibited without permission.
4o ■a Sargent model SRL recorder. All absorption measurements were obtained using matched 1.00 cm. silica cells. Measurements of pH were made with a Sargent LS pH meter.
5) Experimental ProcedureAn aliquot of neodymium (ill) solution is placed
in a 50 ml. beaker and 2 ml. of saturated KCIO^ is added.The pH is adjusted to 5-00 using dilute hydrochloric acid or sodium hydroxide. The reagent solution is added and the contents heated to near boiling for approximately 10 minutes. After cooling, the aqueous layer is extracted twice with chloroform and the extracts added to a 25 ml. stoppered graduated cylinder. The extracts are brought up to volume and the absorbance read against a chloroform blank at 348 mp.
Reproduced with permission of the copyright owner. Further reproduction prohibited without permission.
C H A P T E R I I I
RESULTS
1) Effect of SolventThe reaction species were equally well extracted
into benzene, carbon tetrachloride, toluene, and chloroform, but n-amyl alcohol could not be used as a colour reaction took place which was not dependent on neodymium ion concentration. Chloroform was used in all subsequent studies.
2) Influence of pH on ExtractionThe previously mentioned studies were undertaken at
two pH values, 3.8 and 5.0- As can be seen from Table XIII and Fig. 9 , absorbances were greater at the pH value of ^ . 0 .
This is reasonable since at higher pH values more of the /3-diketone is in the anionic form and thus ready to react with the cationic metal ion.
3) Effect of Ion Pair Formation on ExtractionThe property of extractability into an organic
solvent can often be conferred on a charged complex if a suitable ion of opposite charge is added to give an ion association product (21). The presence of perchlorate in this system has increased the absorbance greatly as can be seen froiQ TaLie Xnv and Fig- 10. The fact that t here is an increase in absorbances with the addition of a saturated potassium perchlorate solution infers that the complexes are cationic in nature. The perchlorate anion is well established as a means of forming ion association products, and complexes are often isolated in this form (22,23).
41
Reproduced with permission of the copyright owner. Further reproduction prohibited without permission.

42
T A B L E X I I I
DATA ON MOLE RATIO 1.25 X lO"
STUDIES AND EFFECT •6 moles Nd(lll)
OF pH
Sample Mole Ratio Absorbance aipH = 3-8
(1)
- 348pH = 5*0
(2)1 0,40 0.046 0.140
2 0.60 0.107 0.2123 0.80 0.178 0.284
4 0.88 0.187 0.3145 1.00 0.203 0.348
6 1.10 0.220 0.3627 1.20 0.236 0.3708 1.40 0.262 0.383
9 1.60 0.270 0.401
10 1.80 0.276 0.43211 2.00 0.295 0. 47112 2.20 0 .346 0.49313 2.40 0.398 0.56814 2.60 0.402 0.59815 2.80 0.404 0.65216 2.88 0.430 0. 66417 3.00 0.458 0.67218 3 .0 8 0.482 0.69219 3.20 0.520 0.70620 3.40 0.559 0.724
Reproduced with permission of the copyright owner. Further reproduction prohibited without permission.

4
TABLE XIII Continued
21 3.60 0.594 0.75022 3.80 0.625 0.76323 4.00 0.664 0.788
Reproduced with permission of the copyright owner. Further reproduction prohibited without permission.

FIGURE 9
00d d d30Nvgyosgv
MOLE RATIO AND pH PLOTS1. pH 3.82. pH 9'0
ri
Ciri
oCi
a
08d
d
44
Z)>QOLü
LU« OfH
wÛL
QZ<O
Ll.OCOLUO
Reproduced with permission of the copyright owner. Further reproduction prohibited without permission.
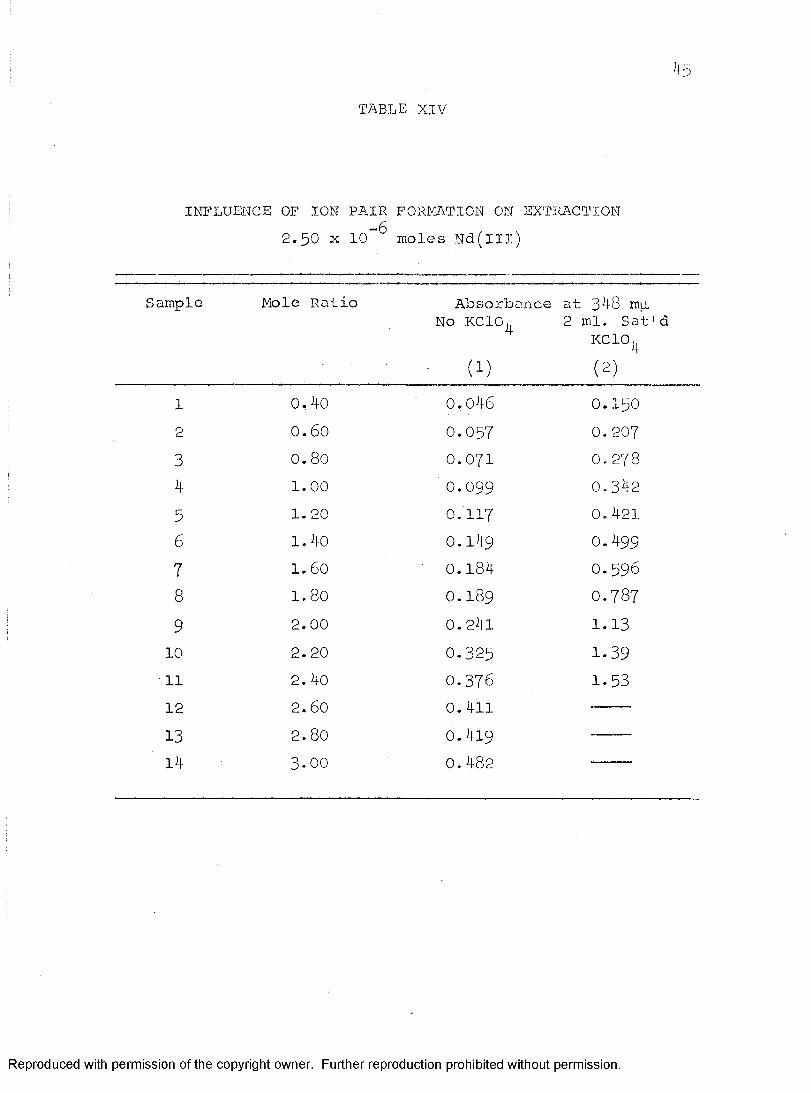
45DT A B L E X I V
INFLUENCE OF ION PAIR FORMATION ON EXTRACTION“62.50 X 10 moles Nd(lll)
Sample Mole Ratio
1 0,40
2 0.603 0.804 1.005 1.206 1.40
7 1.608 1.809 2.0010 2.2011 2.40
12 2.6013 2.8014 3.00
Absorbance at 348 m|j.No KCIO,
(1)0.046
0.0570.0710.0990.1170.1490.184
0.1890.241
0.3250.3760.4110.4190.482
2 ml. Sat'dKCIO,'4(2)0.150 0.207 0.278 0.342
0. 421
0.499 0.5960.7871.131.391.53
Reproduced with permission of the copyright owner. Further reproduction prohibited without permission.
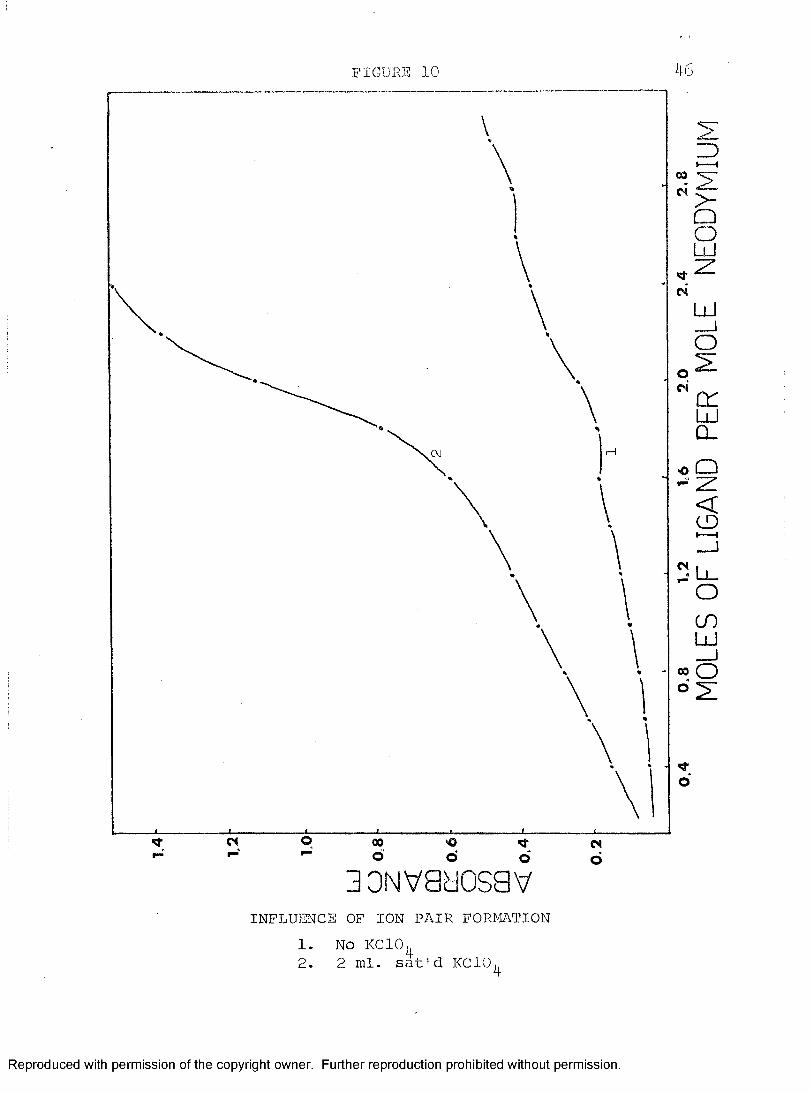
FIGURE 10 46
o o00
=)
<5f(S
00 ^ CM ^Q O ÜJ ZüJ_jO
o" c rLüCLQ Z«o
=feCOÜJ
00 o
o
30NV8H0S8VINFLUENCE OF ION PAIR FORMATION
1. No KCIO,42. 2 ml. sat'd KCIO 4
Reproduced with permission of the copyright owner. Further reproduction prohibited without permission.

474) Spectral Curve of the Che1at e
From Fig. 11 it can be seen that the chelate has no absorption maxima in the visible region at a wavelength where excess reagent does not blank out the peak. The chelate formed in the presence of excess neodymium has a maximum at 348 mp, and all measurements are made at this wavelength.
Because of the location of this maxima, in the region blanked out by the reagent, all studies were carried out using a less than 3:1 ratio of ligand to metal.
As can be seen from Fig. 11 there is a possibility that the absorbance at 348 mp. could be due to extracted reagent. If this were true, upon changing the metal to ligand ratio from 4:1 to 8:1 the absorbance would decrease.Fig. 12 shows the opposite to be true. This indicates that the absorbance is due to the complex rather than the reagent.
5) Mole Ratio StudiesThe mole ratio studies, Table XIII and Pig. p , indicate
points of inflection for the extracted complex at ligand to metal ratios of 1:1, 2:1, and 3:1. This indicates that all
+ 2three complexes are formed to some extent; that is, Nd(/3-dike) Nd(iS-dike)and Nd(p-dike) .
Reproduced with permission of the copyright owner. Further reproduction prohibited without permission.

FIGURE 11 J|8
0.2
ÜJoZ
3R
I R
320 340 380360
WAVELENGTH mu
SPECTRAL CURVES1. 0.25 X 10⁻⁶ Moles Reagent2. 0.50 X 10⁻⁶ Moles Reagent3. 0.75 X 10⁻⁶ Moles ReagentIR. 0.25 X 10⁻⁶ Moles Reagent Blank2R. 0.50 X 10⁻⁶ Moles Reagent Blank3R. 0.75 X 10⁻⁶ Moles Reagent Blank
Reproduced with permission of the copyright owner. Further reproduction prohibited without permission.

FIGURE 12
4g
0.2
LÜOZ<æCLoCO 0.1m<
380340 360320
WAVELENGTH muSPECTRAL CURVES
-60.75 X 10 M. Reagent Métal to Ligand Ratios
1. 8.02. 7.03. 5.34. 4 .75. 4.0
Reproduced with permission of the copyright owner. Further reproduction prohibited without permission.

C H A P T E R I V
SUMMARY AND CONCLUSION
From the present work it can he seen that the reaction of neodymium (ill) with 3”thianaphthenoyltrifluoroacetone produces three extractable species. The presence of perchlorate ion, to form a better extractable species, increases the absorbance. Increasing the pH from 3.8 to 5-0 also caused an increase in absorbance.
Because excess reagent would blank out the 348 m|i peak, care was taken to use less than stoichiometric amounts of reagent.
This preliminary study indicates the possibility of using 3-thianaphthenoyltrifluoroacetone as a reagent for the extraction of the rare-earths.
50
Reproduced with permission of the copyright owner. Further reproduction prohibited without permission.

B IB L IO G R A P H Y
1. Sandell, E.B., Colorimetric Determination of TraceMetals, Ed., Vol. 3, Interscience Publishers,New York, 1959^ pg. 75*
2. Stary, J., The Solvent Extraction of Metal Chelates,Pergamon Press Ltd., Oxford, England, 1964, pg. 51*
3. Tonosake, K., and Otomo, M., Bull. Chem. Soc. Japan,35, 1683, (1962).
4. Perrin, D.D., Organic Complexing Reagents, Vol. XVIII, Interscience Publishers, New York, 1964, pg. 28$.
5. Willard, H.H., and Young, D., J. Am. Chem. Soc., 50,1322-1334, (1928).
6. Furman, N.F., J. Chem. Soc., 50, 755-764, (I928).7. Perrin, D.D., Organic Complexing Reagents, Vol. XVIII,
Interscience Publishers, New York, 1964, pg. 287.8. Morrison, G.E., Ed., Trace Analysis, Physical Methods,
Interscience Publishers, New York, I965, pg. 184-189.9. Morrison, G.E., and Fraiser, H., Solvent Extraction in
Analytical Chemistry, John Wiley and Sons Ltd., London,1957, pg. 157-161.
10. Farrar, W., and Levine, R., J. Chem. Soc., 72, 4433,(1950).
11. Hartough, H.D., and Meisel, S.L., The Chemistry of Heterocyclic Compounds, Condensed Thiophenes, Interscience Publishers, New York, I954, pg. I25.
12. Barkley, "L.B., and Levine, R., J. Chem. Soc. . 72.4433, (1950).
13. Morrison, G.E., and Freiser, E., Solvent Extraction in Analytical Chemistry, John Wiley and Sons Ltd., London, 1957, pg. 38.
51
Reproduced with permission of the copyright owner. Further reproduction prohibited without permission.

52
14. Rosin, J., Reagent Chemicals and Standards, 5th Ed.,Van Nostrand Co. Ltd., Princeton, New Jersey, I966, pg. 127.
15. Sandell, E.B., Colorimetric Determination of Trace Metals, 3rd Ed., Vol. 3, Interscience Publishers,New York, 1959, pg. 83.
16. Erode, W.R., Chemical Spectroscopy, John Wiley and Sons Ltd., New York, 1943, pg. 134.
17. Holland, W.J., Veel, A.E., and Gerard, J., Mikrochim. Acta, in press.
18. Perrin, D.D., Organic Complexing Reagents, Vol. XVIII, Interscience Publishers, New York, 1964, pg. I7.
19. Cotton, F.A., and Wilkinson, G., Advanced Inorganic Chemistry, A Comprehensive Text, 2nd Ed., Interscience Publishers, New York, I967, pg. IO63.
20. Furman, N.H., Ed., Scott's Standard Methods of Chemical Analysis, 5th Ed., Vol. 1, Van Nostrand Co. Inc.,New York, 1939, pg. 245 f.
21. Perrin, D.D., Organic Complexing Reagents, Vol. XVIII, Interscience Publishers, New York, 1964, pg. 225.
22. Collins, D.F., and Diehl, H., Anal. Chem., 3I, 1862,(1959).
23. Jensen, R.E., and Pflaum, T., Anal. Chim. Acta, 3 2,235, (1965).
24. Ayres, G.H., Anal. Chem. , _21, 652, (1949).
25. Ringbom, A., Z. Anal. Chem., 115, 332, (1938).26. Yoe, J.H., and Jones, A.R., Ind. Eng. Chem. Anal. Ed.,
16, 111, (1944).27. Job, P., Chim. . (Paris), 5 , II3, (1927).28. Khopkar, S.M., and De, A.K., Anal. Chem.. 32, 479,
(1960).
Reproduced with permission of the copyright owner. Further reproduction prohibited without permission.

V I T A A U C T O R IS
1945 Born in Goteborg, Sweden, December 30, 19^5*
1965 Graduated from General Amherst High School,Amherstburg, Ontario.
1968 Graduated from University of Windsor, Windsor, Ontario with the degree of Bachelor of Science in Chemistry.
1969 Accepted into the Faculty of Graduate Studies of the University of Windsor to study for the degree of Master of Science.
1970 Accepted position at Stelco of Canada Research Department, Burlington, Ontario.
Publications :1. Spectrophotometric Determination of Iron (ill) with
3-Thianaphthenoyltrifluoroacetone, Gerard, J., Holland, W.J., Veel, A.E., and Bozic, J.,Mikrochim. Acta, (Wein) 1969, 724-730.
2. Spectrophotometric Determination of Cerium (iv) with 3-Thianaphthenoyltrifluoroacetone, Holland, W.J., Veel, A.E., and Gerard, J., Mikrochim. Acta,in press.
53
Reproduced with permission of the copyright owner. Further reproduction prohibited without permission.