ingineria · și a tehnicilor de estimare a acestora. În continuare se prezintă metode de calcul...
TRANSCRIPT

DISTR IBU TED WITH AU TOTEST M AG A ZINEVol. 8, no. 1 (30) / March 2014
SIAR IS A MEMBER OF
INTERNATIONALFEDERATION OFAUTOMOTIVEENGINEERINGSOCIETIES
EUROPEANAUTOMOBILEENGINEERSCOOPERATION
Ingineriaautomobilului Society of
AutomotiveEngineers
of Romania
RomanianAutomobileRegister
l Independent Component Analysis Applied to Combustion Images l The Air Filtering Technologies for Motor Vehicles l Aproximation Methods Used to Model an Engine Torque Map l Simulation Methods of C.I. Engines Processes l Performance Improvement of a pressure Wave Supercharger
Interview with Mr. Jérôme OLIVE – General Manager Group Renault România

CONTROL AND ATTENUATION OF MOTOR VEHICLES NOISES AND VIBRATIONSFUNDAMENTAL CONCEPTS, ROLLING NOISEAuthor: Gabriel Anghelache
Publishing: BRENPublished: 2008ISBN: 978-973-648-631-9
The paper approaches the investigation domain of noises and vibrations generated by motor vehicles, in direction of analyzing the noise produced by the interaction of tyre-road. The book is structured in two parts. First part presents the basic concepts of
noises and vibrations. The main topics refers to the frequency’s analyze of noises and vibrations, sound waves, characteristic units for measuring the noises, human noise perception, human body exposure to the mechanical vibrations and measuring devices of the noises and vibrations. The second part approaches the sound levels of motor vehicles and the rolling noise.
MOTOR VEHICLE STRUCTURES. CONCEPTS AND FUNDAMENTALSAuthors: Jason C Brown, A John Robertson, Stan T Serpento
Publisher : SAE InternationalPublished: 2002ISBN: 076-800-909-X
Lucrarea este dedicată prezentării elementelor necesare înțelegerii conceptelor de bază necesare pentru proiectarea structurilor automobilelor. Pentru început se face o trecere în revistă a solicitărilor elementare din corpurile autovehiculelor și a tehnicilor de estimare a acestora. În continuare se prezintă metode de calcul și proiectare a componentelor structurilor automobilelor. În ultimul capitol se prezintă un studiu de caz edificator asupra algoritmilor recomandați.Contents:
1. Introduction2. Fundamental vehicle loads and their estimation3.Terminology and overview of vehicle structure types4. Introduction to the simple structural surfaces (SSS) method5. Standard sedan (saloon) – baseline load paths6. Alternative construction for body subassemblies and model variants 7. Structural surfaces and floor grillages8. Application of the SSS method to an existing vehicle structure
9. Introduction to vehicle structure preliminary design SSS method10. Preliminary design and analysis of body subassemblies using the SSS method11. Fundamentals and preliminary sizing of sections and joints12. Case studies – preliminary positioning and sizing of major car components
ReferencesIndex
Cuprinsul lucrării este următorul:Part I Fundamental concepts of noises and vibrationsChapter 1 Definitions, classification, units, characteristics of the vibrations phenomenon;Chapter 2 Frequency’s analyze of noises and vibrationsChapter 3 The propagation of mechanical oscillations. Sound waves Chapter 4 Human noise perceptionChapter 5 The exposure of human body to the mechanical vibrationsChapter 6 Measuring devices of the noises and vibrations
Part II The sound levels of motor vehicles. The rolling noiseChapter 7 The sound levels of motor vehicles Chapter 8 Measuring the noises produced by motor vehiclesChapter 9 Noises made by the interaction of tyre-road
The paper also includes references and 7 annexes.
3
Ingineria automobilului Vol. 8, no. 1 (30) / March 2014
The engineers, researchers and professors which have in countries with famous car manufacturers a direct relationship with
the creation, production and maintenance of the automobile are generally very good informed – not only by manuals – but also by periodical pub-lications which offer the most recent information in this domain: Automotive Engineering in the USA but also for the 80,000 worldwide members of the SAE International, Ingegneria dell´Autoveicolo in
Italy, Ingenieur de l´Automobile in France, Automobiltechnische Zeitschrift ATZ and Motortechnische Zeitschrift MTZ in Germany – and also around the world in the english version – I have seen them in different occasions on the desk of the engine chief engineer of Ferrari and of the specialized professor in Detroit. The IA Magazine, restarted 2006 – after the series 1990-2000 – by exceptional colleagues which given their knowledge and their spirit in the texts, is essential for the automobile industry, for the af-filiate development centers, for the academic world and for the Romanian suppliers – despite the fact that some local experts do not want to see or to hear or to participate to this action, experts which believe to have other interests. In a previous editorial, as well as during my discussions with the SIAR and with the responsibles for the IA Magazine, when they asked me to be a board member, I underlined my opinion about the directions which should be followed:1. We must popularize the education and the research work in the field of automotive engineering in Romania – despite the fact that their state changed with the time, by objective and by subjective reasons. This should be the spark for a salutary restart! I take into account in this sense the universities, the car manufacturers with their development centers, but especially the groups which are developing and producing subsys-tems, parts and modules. 80% of a Mercedes, Audi or BMW are produced outside of the OEMs – at ZF, Mahle, Thyssen as well as in numerous small companies which have no means for an own development, finding ap-propriate cooperation partners through ATZ,MTZ or in good structured conferences. 2. We can popularize the Romanian automotive school inside by the printed IA Magazine and by the online edition as well as outside by the english online edition which could have more space for descriptions. We can generate in this mode a platform for internal and external cooperation, for PhDs, stages, small or large research contracts. The example of ATZ, MTZ should be well of use: in addition to the usual papers with authors from universities and from companie , the two magazines have sections with peer review papers, evaluated by a committee composed by well-known professors as guaranty for the quality of the scientific papers. On the other hand, considering the papers without peer review and their authors, I think that a professor would not impair his authority and repu-tation when publishing sometime in the IA Magazine something from his own scientific knowledge, at less as an example for young researchers – such contributions are very poor in the last time. This model is usual in the whole automobile world; this is the best form of scientific publicity for a professor in order to obtain research contracts - additionally to the projects supported by national, governmental or European organizations - about the efficiency, the level and the results of a lot of such projects I could give in another occasion interesting examples.
3. We can popularize the education and the research work in the field of auto-motive engineering in countries with significant car manufacturers in the IA Magazine in romanian language, for Romanian engineers – summaries of PhD thesis, papers which are republished from international magazines, reports from well-known international conferences and congresses, inter-views with great personalities about development aspects – I offered per-sonally some of these examples in the past editions of the IA Magazine. Why I am doing that? The Secretary General of SIAR asked recently “why should a professor or a researcher from France, USA, Germany or Japan publish something in our magazine?” In addition to the friendship, many of them want to participate, to help; there are others which want to es-tablish relations, partnerships with other universities, and others which want PhD students with a strong scientific ground – which are well given in Romania.However, I know as well some positions which are blocking such con-tacts: “forget it, dear colleagues, we are not bed in this matter, more than that, we are just better in the theoretical field, on the west side they have only the better equipment…”In different occasions it was delighting for me to read some scientific oeu-vre created by such scientists – the reinvention of the wheel for a several time, in base of very dangerous looking equations built up on rudimental scientific ground, without a logical connection to each other and without reference to the studied practical application. On the other hand, I am informed also about the tendencies to create own scientific magazines of the University X, Y or Z. A pragmatic view would be even better – such dismemberment would be catastrophic within a specialization such as the Automotive Engineering in Romania – we are not yet so strong and not yet so known in the world – despite some international classification or evaluation – we cannot expect that a University like Berkeley, Munich or Paris would take into account as a scientific publications the papers of a doctoral student published in such magazines. With united forces within an IA Magazine with Peer Review the base would be enlarged and the cooperation between the universi-ties - as a condition for complex research contracts – would be improved. In my opinion, for a salutary and prosperous future of our magazine two conditions are strongly required:- The permanent coordination between SIAR and the car manufacturers and suppliers in Romania – actually the most of their engineers should be members of SIAR! An annual conference of these experts, under the patronage of SIAR would be a good impulse. - The formation of a Peer Committee of the Romanian Professors in this specialization – for the evaluation of the scientific papers to be published in the IA Magazine as well as for the coordination of the Scientific Con-ferences on Automobiles which are organized till now by each University. The Committee would establish national rules for the scientific program and for the conferences organization and – why not? - for the form of doc-toral thesis in this domain.
Dear colleagues, it would be a distinct honor for me if these proposals would determine actions and interactions!
I look forward to receive your opinions. Faithfully yours,
Professor Cornel Stan
RIA – We Remain on the Outside or we Refresh the IA Magazine?IA – Rămânem În Afară sau Revigorăm Ingineria Automobilului?

4
Ingineria automobilului Vol. 8, no. 1 (30) / March 2014
ROMANIAN AUTOMOBILE
REGISTER
General ManagerGeorge-Adrian DINCĂ
Technical ManagerFlavius CÂMPEANU
AUTO TEST
Chief EditorLorena BUHNICI
EditorsRadu BUHĂNIŢĂ
Emilia PETRE
Contact:Calea Griviţei 391 A,
sector 1, cod poştal 010719, Bucureşti, România
Tel/Fax: 021/202.70.17E-mail: [email protected]
www.rarom.rowww.autotestmagazin.ro
SIAR
ContactFaculty of Transport
University POLITEHNICAof Bucharest
Splaiul Independenţei 313Room JC 005
Cod poştal 060032, sector 6Bucureşti, România
Tel/Fax: 021/316.96.08E-mail: [email protected]
www.ingineria-automobilului.rowww.siar.ro
PRINTINGART GROUP INT SRL
Str. Vulturilor 12-14, sector 3Bucureşti
Full or partial copying of text and pictures can be done only with Auto Test Magazine approval, of the Romanian Automobile
Register and of SIAR
SOCIETY OF AUTOMOTIVE ENGINEERS OF ROMANIAPresident: Conf. dr. ing. Adrian CLENCI, University of Piteşti
Honorary President: Prof. dr. ing. Eugen NEGRUŞ, University Politehnica of BucharestVice-president: Prof. dr. ing. Cristian ANDREESCU, University Politehnica of Bucharest
Vice-president: Prof. dr. ing. Nicolae BURNETE, Technical University of Cluj-NapocaVice-president: Prof. dr. ing. Anghel CHIRU, University „Transilvania” of Braşov
Vice-president: Prof. dr. ing. Victor OŢĂT, University of CraiovaVice-president: Prof. dr. ing. Ioan TABACU, University of Piteşti
General Secretary of SIAR: Prof. dr. ing. Minu MITREA, Military Technical Academy of Bucharest
Editor in chief: Prof. Dr. -Ing. habil. Prof. E. h. Dr. h.c. Cornel STAN West Saxon University of Zwickau, Germany
Executive editor: Prof. dr. ing. Mircea OPREAN, University Politehnica of BucharestDeputy chief editor:
Prof. dr. ing. Gheorghe-Alexandru RADU, University „Transilvania” of BraşovProf. dr. ing. Ion COPAE, Military Technical Academy of Bucharest
Conf. dr. ing. Ştefan TABACU, University of PiteştiRedactors:
Conf. dr. ing. Adrian SACHELARIE, University „Gheorghe Asachi” of IaşiConf. dr. ing. Ilie DUMITRU, University of Craiova
S.l. dr. ing. Cristian COLDEA, Technical University of Cluj-NapocaS.l. dr. ing. Marius BĂŢĂUŞ, University Politehnica of Bucharest
S.l. dr. ing. Gheorghe DRAGOMIR, University of OradeaEditorial secretary: Prof. dr. ing. Minu MITREA, General Secretary of SIAR
AVL List Romania – Werner MOSERRomanian Automobile Register – RAR – George-Adrian DINCĂ
The National Union of Road Hauliers from Romania – UNTRR – Florian MIHUŢ
EDITORIAL BOARD
HONORARY COMMITTEE OF SIAR
SCIENTIFIC AND ADVISORY EDITORIAL BOARDProf. Dennis ASSANIS
University of Michigan, Michigan, United States of America
Prof. Rodica A. BĂRĂNESCUUniversity of IIlinois at Chicago College of
Engineering, United States of America
Prof. Nicolae BURNETEUniversitatea Tehnică din Cluj-Napoca, România
Prof. Giovanni CIPOLLAPolitecnico di Torino, Italy
Dr. Felice E. CORCIONEEngines Institute, Naples, Italy
Prof. Georges DESCOMBESConservatoire National des Arts et Metiers de Paris,
France
Prof. Cedomir DUBOKAUniversity of Belgrade Serbia
Prof. Pedro ESTEBANInstitute for Applied Automotive Research
Tarragona, Spain
Prof. Radu GAIGINSCHIUniversitatea Tehnică „Gh. Asachi” din Iaşi,
România
Prof. Berthold GRÜNWALDTechnical University of Darmstadt, Germany
Eng. Eduard GOLOVATAI-SCHMIDTSchaeffler AG & Co. KG Herzogenaurach, Germany
Prof. Peter KUCHARUniversity for Applied Sciences, Konstanz,Germany
Prof. Mircea OPREANUniversitatea Politehnica din Bucureşti, România
Prof. Nicolae V. ORLANDEARetired Professor, University of Michigan Ann Arbor, M.I., USA
Prof. Victor OȚĂTUniversitatea din Craiova, România
Prof. Pierre PODEVINConservatoire National des Arts et Metiers de Paris, France
Prof. Andreas SEELINGERInstitute of Mining and Metallurgical Machine, Engineering, Aachen, Germany
Prof. Ulrich SPICHERKalrsuhe University, Karlsruhe, Germany
Prof. Cornel STANWest Saxon University of Zwickau, Germany
Prof. Dinu TARAZAWayne State University, United States of America
Automotive Engineering: print edition publication, 2006 (ISSN 1842-4074), electronic edition, 2007 (ISSN 2284-5690).New Series of the Journal of Automotive Engineers (RIA), printed in 1990-2000 (ISSN 1222-5142)

5
Ingineria automobilului Vol. 8, no. 1 (30) / March 2014
Automotive Engineering: Dear Mr. Olive, Dacia Renault plays a key role in the European car industry. How do you assess the future evolution of Dacia cars’ manufacturing?
Jerome OLIVE: Dacia enjoys a real commercial success with more than 2.5 million cars registered in Europe and in the Mediterranean region. Dacia has a completely new range, the newest in Europe and it continues its expansion with 6 new markets in 2013: UK, Ireland, Nor-way, Denmark, Cyprus and Malta. Dacia is the car manufacturer
with the most important growth (+20.2% in the first 10 months) on a market decreasing by 3.1% and it has reached a market share of 2.4%.Indeed, when Logan was launched in 2004 we did not expect for the brand to become so rapidly a mass manufacturer and we did not ex-pect such a success in Western Europe. However, this success has not come over night. Ever since the launch of Logan we kept on devel-oping the range and today Dacia is a true car manufacturer counting 8 models.Moreover, the entry range cars - sold in Europe under the Dacia
brand – are also manufactured in other plants around the world (Morocco, Russia, Columbia, Bra-zil, Iran, India and South Africa) and marketed under the Renault, Nissan or Lada brands.In the future it is important to maintain our competitive advan-tage. The car market is rapidly changing, other car manufacturers are interested in getting in the low-cost segment and we have to stay on the watch and continuously im-prove quality and competitiveness.
AE: Taking into account the cur-rent regulations on CO2 emissions
do you envisage hybrid or electric Dacia cars?
JO: For the time being, electric and hybrid technologies are expensive; they are used more in the premium sector. Moreover, Dacia has a full range and it shall benefit from its renewal. Of course, this does not stop us from exploring other pro-jects but for the moment we aren’t targeting these segments.
AE: Your company has good con-tacts with universities in Romania. How could this cooperation be-come more intensive? Do you think Renault Romania should draw up a list of research topics for com-mon partnerships developed with industry departments and univer-sities in Romania?
JO: Since Dacia’s takeover by Re-nault our activities in Romania have increased a lot – both in terms of manufacturing and engineering or services. This development gen-erated more diverse jobs and a need for specialists in various fields.That is why we got in contact with universities – to recruit and train our future staff we commonly built a system that meets our needs. So far we consolidated the training as-pect, but of course this cooperation can be extended to research pro-jects. There are many areas where we can suggest research topics, but for this we need a clear legislative framework.
AE: Companies generally hold the opinion that students’ practical
Interview with Mr. Jérôme OLIVEGeneral Manager of Group Renault Romania Interviu cu domnul Jérôme OLIVEDirector General Group Renault Romania
6
Ingineria automobilului Vol. 8, no. 1 (30) / March 2014
training acquired in universities is insufficient. Taking into account that SIAR’s members are – to their great majority – university staff in the field of car engineering, we would like to know your global appraisal of graduates’ knowl-edge and know-how in Romania. And how does Renault Romania get involved in practical knowl-edge acquisition by students?
JO: Well, we have noticed as well that students’ theoretical level is good, but they lack in practi-cal competences, such as project management and team work. That is why we have developed in part-nership with 4 universities a mas-ter’s program in car engineering with a stress laid on project man-agement. There are other fields, less covered in Romania, in which we set up training programs (e.g. master’s program in logistics and in advanced technology, i.e. noise and vibrations). Renault Romania has a share in students’ practical training via one
of the most significant internship programs on the market: each year more than 100 students spend at least 3 months within the various companies of the group in Roma-nia. They get internship projects, internship supervisors and their experience can be summed up in their MS paper.In addition to this, there are col-leagues of ours – from the engi-neering and manufacturing area – that go on a regular basis and give talks in universities about chal-lenges in a real automotive project and each year dozens of students get to visit the Dacia plants and Titu Technical Center.
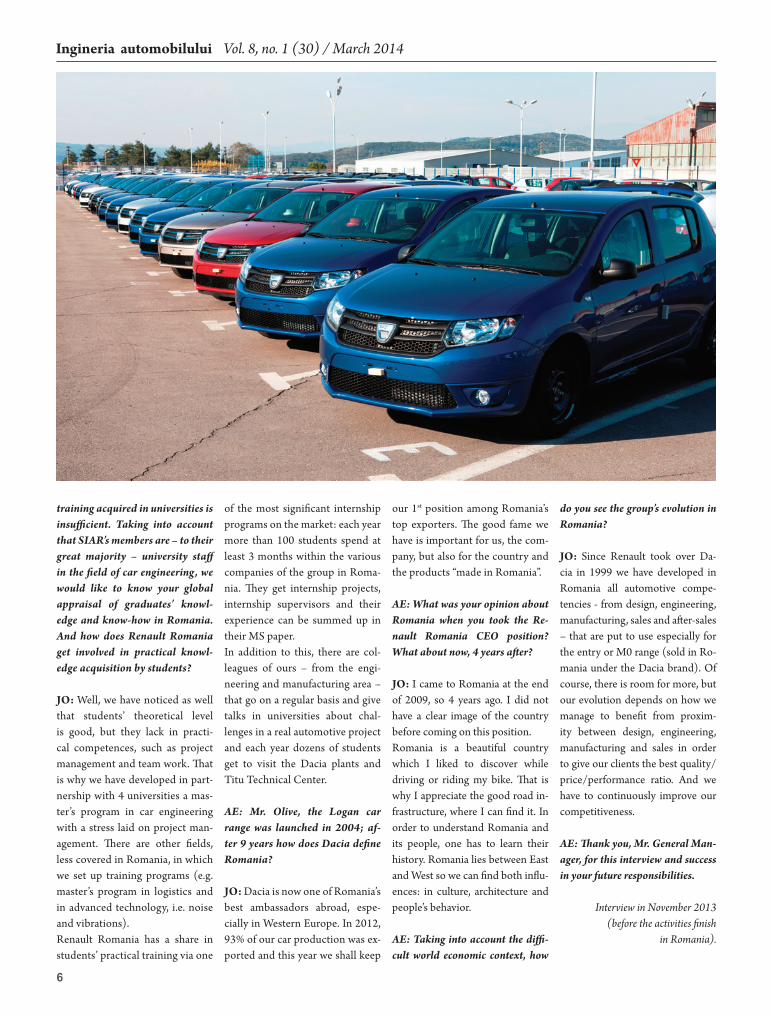
AE: Mr. Olive, the Logan car range was launched in 2004; af-ter 9 years how does Dacia define Romania?
JO: Dacia is now one of Romania’s best ambassadors abroad, espe-cially in Western Europe. In 2012, 93% of our car production was ex-ported and this year we shall keep
our 1st position among Romania’s top exporters. The good fame we have is important for us, the com-pany, but also for the country and the products “made in Romania”.
AE: What was your opinion about Romania when you took the Re-nault Romania CEO position? What about now, 4 years after?
JO: I came to Romania at the end of 2009, so 4 years ago. I did not have a clear image of the country before coming on this position.Romania is a beautiful country which I liked to discover while driving or riding my bike. That is why I appreciate the good road in-frastructure, where I can find it. In order to understand Romania and its people, one has to learn their history. Romania lies between East and West so we can find both influ-ences: in culture, architecture and people’s behavior.
AE: Taking into account the diffi-cult world economic context, how
do you see the group’s evolution in Romania?
JO: Since Renault took over Da-cia in 1999 we have developed in Romania all automotive compe-tencies - from design, engineering, manufacturing, sales and after-sales – that are put to use especially for the entry or M0 range (sold in Ro-mania under the Dacia brand). Of course, there is room for more, but our evolution depends on how we manage to benefit from proxim-ity between design, engineering, manufacturing and sales in order to give our clients the best quality/price/performance ratio. And we have to continuously improve our competitiveness.
AE: Thank you, Mr. General Man-ager, for this interview and success in your future responsibilities.
Interview in November 2013 (before the activities finish
in Romania).

7
Ingineria automobilului Vol. 8, no. 1 (30) / March 2014
1. INTRODUCTIONThe modern optical setups employed in the internal combustion engine re-search, permits to collect and analyze in-cylinder phenomena both with high spatial and temporal resolution. However, as the process under con-sideration is very complex, mostly due to the variety of the phenom-ena taking place in the combustion chamber during the combustion, a straightforward interpretation of the imaging data can be very difficult. This difficulty is also due to the mas-sive character of the collected data.The problem of the analysis of the experimental data collected from
optically accessible engines has been approached by a number of sophis-ticated mathematical techniques, among which the most widespread is perhaps proper orthogonal decom-position (POD) [1]. The method permits to extract dominant struc-tures from an ensemble of data and it was proven to be a useful analysis tool in the engine imaging applications. POD has been successfully employed to the determination of the hidden structures in the velocity fields from motored engine [2]. When in come to the fired conditions, POD was ap-plied to the analysis of the flame lu-minosity fields collected from Diesel and SI engines [3].More detailed statistical analysis of the POD coefficients was also pro-posed to characterize cyclic variabil-ity [3] and to distinguish between well-burning and misfired cycles [4]. Despite of a significant number of applications in the field of engines, POD has some limitations as it only removes correlation among variables but does not separate statistically in-dependent structures. Hence, under the assumption that structures cor-responding to different physical pro-cesses are statistically independent, their identification requires consid-eration of alternative computational approaches.In this view, independent compo-nent analysis (ICA), in which the components are chosen based on their statistical independence, is ex-pected to provide better insight [5]. The method of ICA belongs to a class of blind source separation methods used to separate signal mixtures into a set of underlying structures, which
are statistically independent. More precisely, blind source separation is performed with very little, if any, knowledge about the nature of the data, only using statistical independ-ence. Originally, the method was conceived to deal with the so-called cocktail-party problem [6] that is separation of speech signals from a sample of data of people talking si-multaneously in a room, aiming at the identification of a set of single voices. The versatility of ICA has resulted in a large number of appli-cations in many fields, from neuro-imaging [7] and medical signals (e.g. electroencephalogram recordings) [8] to spectrochemistry [9]. In the IC engines context, a separation of the sources corresponding to the
normal and faulty engine vibrations have been reported in [10], while in [11] source signals related to me-chanical events (e.g. piston slap or valves motion) have been identified from recorded acoustic signals. This paper reports on the compari-son of the application of ICA to im-ages of combustion-related lumi-nosity collected from two optically accessible engines: Diesel and spark ignition, and is a continuation of an earlier study [12] in which the first attempt of the application of ICA to luminosity data from a Diesel engine was performed. The study is aiming at identifying independent struc-tures corresponding to different in-cylinder phenomena or phases of the combustion process. To facilitate the
Independent Component Analysis Applied to Combustion Images in Transparent EnginesAnaliza Componentei Independente (ICA) aplicatăimaginilor arderii din motoare transparente
Katarzyna BIZON*
Ezio MANCARUSO**
Gaetano CONTINILLO*
Paolo SEMENTA**
Simone LOMBARDI*
Bianca Maria VAGLIECO**
* Università del Sannio, Benevento, Italy** Istituto Motori CNR, Naples, Italy
Engine type 4-stroke single cylinderBore 8.5 cmStroke 9.2 cmSwept volume 522 cm3
Combustion bowl 21 cm3
Compression ratio 17.7:1Injection system Common RailInjector type Solenoid drivenNumber of holes 6Cone angle of fuel jet axis 148°Hole diameter 0.145 mmRated flow @ 100bar 40 cm3/30s
Table 1. Diesel engine and injection system specifications
Displacement 250 cm3
Bore 72 mm
Stroke 60 mm
Connecting rod 130 mm
Compression ratio 10,5:1
Table 2. SI Specifications of the single cylinder SI engine

8
Ingineria automobilului Vol. 8, no. 1 (30) / March 2014
analysis, in-cylinder parameters are measured along with image acquisi-tion, and examined together with the time dependent coefficients of the independent components.
2. EXPERIMENTAL SETUP2.1. Diesel engineThe first part reports on the appli-cation of ICA to the combustion luminosity images collected during experiments performed on a direct injection four-stroke common rail (CR) Diesel engine with a single cylinder, equipped with an injection system operating at a maximum pres-sure of 2000 bar. The engine features a classic extended piston with a UV–visible grade crown window (34 mm
diameter) which provides a full view of the combustion bowl. In order to obtain the same in-cylinder condi-tions of the real multi-cylinder en-gine, and to compensate for the lower compression ratio typical of optical engines, an external air compressor has been used to supply pressurized intake air. The engine and injection system specifications are reported in Table 1, while further details on the experimental setup can be found in [3].Images presented in this work were collected from the engine operating in continuous mode with commer-cial diesel fuel at 1000 rpm and with no exhaust gas recirculation. A typical common rail (CR) injection strategy
of pre, main, and post injections was employed; the injections started at –9°, –4° and 11° CA (crank angle) re-spectively, and had durations of 400, 625 and 340 μs, and 600 bar injec-tion pressure. The injected fuel mass and IMEP were 12.9 mm3/st and 3.6 bar, respectively. To investigate temporal and spatial evolution of the combustion process, several images of visible flames were recorded per cycle using a high-speed digital com-plementary metal oxide semiconduc-tor (CMOS) camera with a dynamic range digitization. A high frame rate (4 kHz) was needed in order to take several images per cycle – at 1.5° CA increments – resulting however in low light sensitivity and spatial reso-lution of 529×147 pixels which was consecutively clipped to 120×120 by framing the combustion chamber.2.2. SI engineThe second part reports on the ICA applied to the images from the opti-cally accessible single cylinder spark ignition (SI) engine (details in Ta-ble 2) is equipped with the cylinder head of a two-wheel, port fuel injec-tion (PFI) SI engine, having four valves and a centrally located spark plug. A commercial 3-holes injector is used, with the injection pressure fixed at 3.5 bar. A quartz pressure transducer is flush-installed in the
region between intake and exhaust valves. The engine piston is flat and made transparent by means of a sap-phire window. An elongated piston arrangement is used, together with unlubricated Teflon-bronze compos-ite piston rings in the optical section, to avoid window contamination by lubricating oil. Further details on the experimental setup can be found in [13].Combustion is detected through the wide sapphire window located in the piston. Images are reflected by a 45° inclined UV-visible mirror located at the bottom of the engine, and con-veyed towards the optical detection assembly, made of a 78 mm focal length, f/3.8 UV Nikon objective, fol-lowed by a CMOS 16-bit high speed camera (1024x1024 pixel). A camera region of interest (896×496 pixel, successively clipped to 496×496) was selected to obtain the best match between spatial and temporal resolu-tion, allowing for a spatial resolution around 0.11 mm/pixel and a frame rate of 30000 fps, which correspond to 0.4° CA increments at 2000 rpm. The exposure time is fixed at 30 μs. All of the tests are performed at 2000 rpm with the spark timing fixed at -34° CA. The intake air pressure and the temperature are set at 1600 mbar and 298 K, respectively. The engine is
Fig. 1. Sequence of crank-angle resolved images from a Diesel engine
Fig. 2. In-cylinder pressure, drive injector current (DIC) and rate of heat release (ROHR) in the Diesel engine

9
Ingineria automobilului Vol. 8, no. 1 (30) / March 2014
fuelled with commercial gasoline at a stoichiometric equivalence ratio.
3. INDEPENDENT COMPONENT ANALYSISLet us denote by x(t) a vector made of the temporal mixtures x1(t),…, xm(t) of mutually independent tem-poral source signals s1(t), …, sn(t) (s(t) in the vector form). In the sim-plest case, assuming that m=n, i.e. the number of available signal mixtures is equal to the number of the underly-ing sources, the ICA mixing model can be written as [3]:x = As (1)with A being the so-called mixing matrix. Hence, the ICA problem consists of estimating both A and s, when only x is observed. When the matrix A is invertible, Eq.(1) can be recast as:s = Wx (2)where W=A-1 and y=Wx is the op-timal estimation of the independent source signals s. Then, the basic ICA problem given by Eq. (1) and Eq. (2)
can be solved by maximization of the statistical independence of the com-ponents of vector y. Depending on the definition of in-dependence, the most popular al-gorithms for solving ICA problem are either based on minimization of the mutual information or on maxi-mization of the non-gaussianity [5]. Here, a FastICA algorithm [5] is employed which maximizes kurtosis – one of the measures of statistical independence – by means of a gra-dient method. Moreover, since the number of the underlying structures n is expected to be smaller than the number of the recorded images m – which would lead a non square ma-trix A in Eq. (1) – the rank of the data is reduced, during the preprocessing phase, by means of POD [1]. This permits to operate still on square ma-trices and to employ a classical ICA. More details on the algorithm em-ployed and a clarification of the ICA concept applied to imaging data can be find in Ref. [12].
4. RESULTS AND DISCUSSION A representative sequence (a single cycle) of images of combustion-relat-ed luminosity collected during exper-iments performed on a Diesel engine in presented in Figure 1. It consists of 24 frames, recorded in the range of CA from –2.5° to 30.5°. The presence of the first light spots, due to igni-tion of the pre injected fuel, is visible around –2.5° CA. Successively, main injection flames can be observed: in particular from about 2° up to 5° CA, combustion is present on all jets and close to the chamber wall, and it starts to move towards the bowl wall as the fuel is consumed along the jets axes. At around 15.5°, autoignition of the post injection jets takes place.Figure 2 reports in-cylinder pressure (P), drive injection current (DIC) and rate of heat release (ROHR) for the analyzed engine cycle from Fig-ure 1. The study of the ROHR curve can help identify the angle values where the ROHR becomes positive or has a change in the slope of the
curve. Three SOCs (start of com-bustion) are detected in the ROHR curve, corresponding to the CA val-ues at which the ROHR becomes positive or has a change in the slope of the curve are detected, i.e. at -4° CA, 1° CAD, and 14° CAD. To study the transient behavior, ICA was applied to the crank-angle resolved data, separately for each cycle (in particular, images from N=37 consecutive fired cycles were recorded and analyzed). Direct im-plementation of Eq. (1) or Eq. (2) on this data could theoretically result (if the algorithm converges) in the iden-tification of 24 underlying structures, most likely with no physical meaning or at least very difficult for interpreta-tion. Hence, in the first application, the rank of the original data set was reduced by means of POD and only two independent components (ICs) were sought.Figure 3a and 3b shows independ-ent components (ICs) y1 and y2, extracted from the image sequence
Fig. 3. Independent components (a-b) and (d-e) for two cycles of Diesel engine, and the corresponding coefficients a1 and a2 with a relative integral luminosity (c and f ) vs. crank angle
10
Ingineria automobilului Vol. 8, no. 1 (30) / March 2014
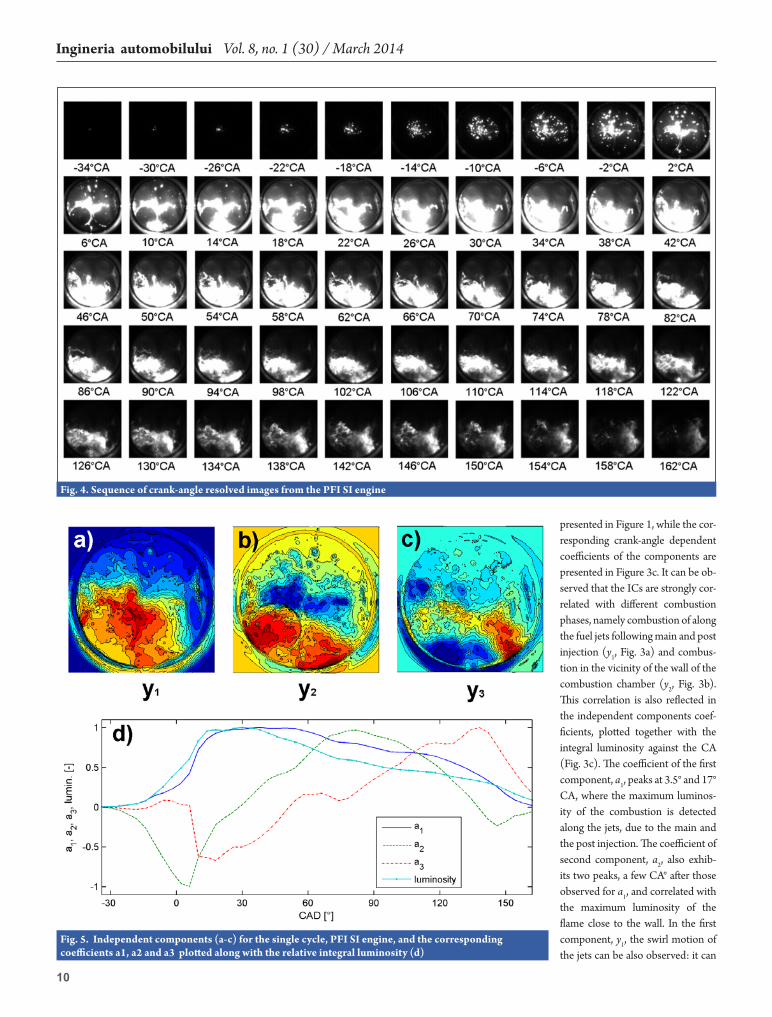
presented in Figure 1, while the cor-responding crank-angle dependent coefficients of the components are presented in Figure 3c. It can be ob-served that the ICs are strongly cor-related with different combustion phases, namely combustion of along the fuel jets following main and post injection (y1, Fig. 3a) and combus-tion in the vicinity of the wall of the combustion chamber (y2, Fig. 3b). This correlation is also reflected in the independent components coef-ficients, plotted together with the integral luminosity against the CA (Fig. 3c). The coefficient of the first component, a1, peaks at 3.5° and 17° CA, where the maximum luminos-ity of the combustion is detected along the jets, due to the main and the post injection. The coefficient of second component, a2, also exhib-its two peaks, a few CA° after those observed for a1, and correlated with the maximum luminosity of the flame close to the wall. In the first component, y1, the swirl motion of the jets can be also observed: it can
Fig. 4. Sequence of crank-angle resolved images from the PFI SI engine
Fig. 5. Independent components (a-c) for the single cycle, PFI SI engine, and the corresponding coefficients a1, a2 and a3 plotted along with the relative integral luminosity (d)

11
Ingineria automobilului Vol. 8, no. 1 (30) / March 2014
be indentified in the curved shape of the „jets“ components and their mushroom-shaped character (Fig. 3a and 3d). The general character of the findings (ICA was in fact run separately on 37 consecutive engine cycles) is confirmed in Fig. 3d-f, in which results for another cycle are reported: the same considerations apply here.The satisfactory results obtained for the Diesel engine led to the attempt of the ICA application to the data collected from the PFI SI engine, in which we deal with phenomena of different character. Again, a num-ber of images sequences from con-secutive fired cycles was collected using a high speed camera. Due to the computational limitations, the original sequence of 500 images per cycle, collected at 0.4° CA in-crements, was sampled uniformly (every 10 frames) and the analysis was performed on 50 frames. A typi-cal sequence collected during a sin-gle cycle is reported in Figure 4. As one can see, the flame kernel, ignited at -34° CA moved quickly from the spark plug with a radial-like behav-ior until around TDC, and after 8° CA is barely visible. Several bright spots were detected in the burned gas before the flame front reaches the chamber walls. The bright spots were due to the fuel deposits on the optical window and also due to not completely vaporized fuel droplets. The fuel deposits create fuel-rich zones with sub-millimeter size, that ignite when reached by the pre-mixed flame front. Intense diffusion flames are visible also later, around and between the intake valve seats, and then elsewhere in the chamber, due to the ignition of the fuel film deposited near the valves during the injection. Such flames produce soot (rich zones), whereas chamber re-gions containing a lean mixture can-not sustain flame propagation and, hence, are responsible for unburned hydrocarbon emissions. As for the Diesel engine, to avoid determination of spurious underly-
ing signals, physically inconsistent with the experimental data, the rank of the data was reduced by means of POD and only three independ-ent components were extracted. The results of ICA application to the sequence presented in Figure 4 are presented in Figure 5: again, the ex-tracted components can be correlat-ed with successive phases of the com-bustion process. When looking at the components determined (Fig. 5a-c) and their corresponding coefficients (Fig. 5d), it can be observed that the first component, y1, represents the prevailing initial luminosity with the peak of the relative coefficient, a1, corresponding to the peak of the inte-gral luminosity (Fig. 5d). Successive components - y2 and y3 - represent the subsequent (in time) evolution of the luminosity field, which is confirmed by the time succession of the coeffi-cients peaks: 82° and 138° CA for a2 and a3, respectively.
5. SUMMARY AND CONCLUSIONSThis work reports on the comparison of the application of the ICA method to the 2D cycle-resolved images of the combustion-related luminosity, collected during the experiments con-ducted on two optically accessible en-gines: Diesel and PFI SI. Independent components and their coefficients are first extracted from sets of luminosity images, and then used to identify the leading structures and to study the transient behavior of the combus-tion process. The two components identified from the single Diesel cycle appear to be clearly related to early combustion along the fuel jets and later combustion near the bowl walls, respectively; quantitative analysis of statistics coefficient confirms the lower variability of the jet flames with respect to combustion near the cham-ber walls. The same can be said of the results of the analysis for PFI SI com-bustion images, which are separated in early, median, and final luminous combustion. The analysis proposed in this work is fast and reliable and can be
prospectively applied to many differ-ent optical engine configurations.
Acknowledgments: The authors wish to thank Carlo Rossi and Bruno Sgammato for their pre-cious help with the experimental apparatus.
REFERENCES[1] Holmes, P., Lumley, J.L., Berkooz, G., Turbulence, Coherent Structures, Dynamical Systems and Symmetry, Cambridge University Press, Cam-bridge, ISBN 0-512-63419-9, 1998.[2] Fogelman, M., Lumley. J., Remp-fer, R., Haworth, D., Application of the proper orthogonal decomposition to datasets of IC engine flows, Journal of Turbulence (5):1-18, 2004.[3] Bizon, K., Continillo, G., Manca-ruso, E., Merola, S.S., Vaglieco, B.M., POD-based analysis of combustion images in optically accessible engines, Combustion and Flame (157):632-640, 2010.[4] Chen, H., Reuss, D.L., Sick, V., Analysis of Misfires in a Direct Injec-tion Engine Using Proper-Orthogonal Decomposition, Experiments in Fluids (51):1139–1151, 2011.[5] Hyvärinen, A., Karhunen, J., Oja, E., Independent Component Analysis, John Wiley and Sons, New York, ISBN 0-471-40540, 2001.[6] Hyvärinen, A., Oja, E., Indepen-dent Component Analysis: Algorithms and Applications, Neural Networks (13):411-430, 2000.[7] Anemüllera, J., Duanna, J.-R., Sejnowski, T.J., Makeiga, S., Spatio-temporal dynamics in fMRI recordings revealed with complex independent component analysis, Neurocomputing (69):1502–1512, 2006.[8] Vigário, R., Särelä, J., Jousmäki, M. Hämäläinen, Oja, E., Independent component approach to the analysis of EEG and MEG recordings, IEEE Tran-sactions on Biomedical Engineering (47):589–593, 2000.[9] Martín, J.C.G., Spietz, P., Orphal, J., Burrows, J.P., Principal and indepen-dent components analysis of overlapping spectra in the context of multichannel time-resolved absorption spectroscopy, Spectrochimica Acta - Part A: Mole-cular and Biomolecular Spectroscopy (60):2673–2693, 2004.[10] Liu, X., Randall, R.B., Blind source separation of internal com-bustion engine piston slap from other measured vibration signals, Mecha-nical Systems and Signal Processing (19):1196–1208, 2005.[11] Albarbar, A., Gu, F., Ball, A.D., Diesel engine fuel injection monitoring using acoustic measurements and inde-pendent component analysis, Measure-ment (43): 1376–1386, 2010.[12] Bizon, K., Continillo, G., Lom-bardi, S., Mancaruso, E., Vaglieco, B.M., Analysis of Diesel engine com-bustion using imaging and independent component analysis, Proceedings of the Combustion Institute (34):2921-2931, 2013.[13] Sementa, P., Vaglieco, B.M., Ca-tapano, F., Non-intrusive investigation in a small GDI optical engine fuelled with gasoline and ethanol, SAE Paper 2011-01-0140, 2011.
ABSTRACTHigh speed and high resolution im-aging devices coupled with optically accessible engines constitute a very powerful investigation tool, permit-ting for detailed investigation of the transient phenomena taking place in the chamber of internal combus-tion engine. Impressive amount of data that can be collected during experiments and complexity of the phenomena involved requires implementation of the sophisticated mathematical tools. In this work, a method of Independent Compo-nent Analysis (ICA) was used to separate spatial structures related to different combustion events. In particular, the paper reports on the analysis of the combustion dynam-ics by means of ICA technique ap-plied to 2D line-of-sight images of combustion-related luminosity, col-lected from two different optically accessible engines: Diesel and port fuel injection spark ignition (PFI SI). The method is used here for the extraction of the independent com-ponents, which are expected to de-scribe the underlying patterns of the combustion process. The determined components and their coefficients are then used to analyze the tran-sient behavior of the flame. It was found that, in the case of the Diesel engine, components and coefficients correlate with different combustion modes, i.e. early combustion along the fuel jets and later combustion near the bowl walls. Similar results were obtained from the application of the ICA method to the data col-lected on PFI SI engine: the deter-mined independent structures are clearly separated in time and are correlated with the early, median and final luminous combustion.
Keywords: combustion, images, transparent engines, Independent Component Analysis

12
Ingineria automobilului Vol. 8, no. 1 (30) / March 2014
1. INTRODUCTIONThe air filters changed significant over the passing time. The first wires and oil bath were used at the beginning of 1920’s. In the 1950’s were used textile materials mois-tened in engine’s oil and forward appeared the cellulosic fibres, synthetic fibres and other types of materials. Due to the intensive re-search activities over the filtering process, was possible to improve the air filtering system.An adequate filtering has good influ-ences over the engine’s wearing and the good operating of the sensors inside the air supply system.The majority of motor vehicles’ fil-ters used in nowadays are made of fibre in different shapes and sizes.The effective filtering material ef-ficiently retains the impurities on their material and between their fibers. There are different filtering methods that have the aim of retain-ing impurities. Usually the filtering materials are classified in three class-es after the filtering method [1],[2]:
1. The load at the surface – struc-ture of paper from cellulose;2. Deep loading – filtering mate-rial made by multiple layers, felt;3. Deepness loading – multi-layer, special medium filtering (reticulate structure of foam) etc.
An average of air consumed by a motor vehicle engine is about 30,000 to 60,000 m3 over a year. This air can contain, in normal en-vironment conditions, about 0.3 to 0.6kg of impurities. Those quanti-ties corresponds to a 10mg/m3 concentration of impurities in the used air [3].To prevent reaching the dust parti-cles in the kinematic couples of the engines, the air must be filtered.The main appreciation criteria of the air filtering performances are:
y High values of efficiency at the beginning, at the middle and at the end of the life cycle; y Small gas-dynamic resist-
ance over the filter’s life cycle; y High capacity of storage the
impurities.
The filtering efficiency depends on the quality and size of dust parti-cles that passes through the filter. It profound influences the engine’s wearing.The efficiency of the filters rises over time while they load with im-purities. Even in small quantities, the dust inside the filter’s fibres significantly contributes at their ef-ficiency. The new filters made from different materials and with differ-ent structural particularities have the initial efficiency between 94 to 99%. At their end of life cycle it passes over 99%, making possible a coefficient of 99.9% [4].For a truck filter, made by a cel-lulosic fibre, the degree of pen-etration, in their first part of its life cycle, is 16 times higher (3%) then the rest of its life [5].
2. CLASSIC FILTERING MEDIUMThe typical filtering mediums used for the engines are: y Paper fibres from cellulose,
that uses phenolic or non-phenolic resin as a binding material – most used; y Paper layers and synthetic fi-
bres from cellulose; y A mix of cellulose and synthet-
ic fibres inside a filtering medium; y Synthetic fibres glued one with
others; y Multilayer, synthetic fibres
(the material density varies with depth – felt); y Filters with two or multiple
stages of filtering that uses reticular foams or felt as a pre-filter.Filtering medium with a load at the surface – is specific for the paper from cellulose with a single layer (a type of filtering layer which has the high ratio between surface and thickness) (fig.1). For the exposed surface, a layer of impurities (en-trustment) at its level appears as a characteristic. The ingrained with dust porosity and the structure of the texture influences the filtering efficiency and the pressure drop induced by the filter.
The Air Filtering Technologies for Motor Vehicles’ Internal Combustion EnginesTehnologii de filtrare a aerului pentru motoarele cu ardere internă de autovehicule
Marius TOMA
Ştefan VOLOACĂ
Gheorghe FRĂŢILĂ
Universitatea POLITEHNICA din Bucureşti, Româ[email protected] a. Section through the filtering medium b. The filtering surface
Fig. 1. Paper filtering material from cellulose

13
Ingineria automobilului Vol. 8, no. 1 (30) / March 2014
The type”dry paper” filtering ma-terial generally is built of cellulose fibres. Some dry papers filtering mediums use a mixture of cellu-lose and synthetic fibres to rise the resistance of filters in a wet state. The majority of filters uses a non-phenolic resign as a binding. Those filters are wide spread in North America, Europe and some Asian markets.The paper filtering element can be ingrained with oil and then treated to rise the performances at high val-ues of air flow speeds. Those treat-ments are used on large scale but they must be used with attention due to the effect over the seasons downstream the filter. This effect is influenced by the migration the oil micro particles.The studies shown the low protec-tion to dust of the engine. For a normal use conditions, to protect the engine, the filtering efficiency must be about 98-99%.In high dusty conditions, the ef-ficiency must reach 98.8% for pas-senger cars and 99.95% for trucks [1], [6].The filtering medium with an in volume load – those filters have a multilayer construction. They are known as synthetic texture fibres or felt. It is a generic appellation after filtering element, to define the density and the porosity of its structure. The filtering mediums are made of 2-5 layers, combined to catch even smallest particles.The felt has a good hardness and resists at high temperature and hu-midity variations.Generally the dust storage capacity is two times bigger than the filters with loads at surface, (fig.2),[1]. The permeability is higher com-pared to the one of paper.The structure can be exposed at higher speeds of air flows than the paper one.In paper [1] a comparative study was made for three types of filters – dry paper, moistened paper and felt. The filters are from different
producers. Tests were made after ISO 5011/SAE J726 standards. They stop when the final pressure restriction, compared to the one of the new ones, reached a value of 2.5kPa (fig. 2,3). The felt filtering medium collected dust approxi-mately 85% higher than the mois-tened one and 20% bigger than the dry paper one. Similar results are presented in paper [4].Figure 3 presents the initial filter-ing efficiency for three filtering me-diums. The dry paper filters have a high dispersion of filtering efficien-cy values, somewhere around 94 to 99.8% with an average of 96.5%. The tested filters are the same type but made from different producers. The initial efficiency for the paper filter is unsatisfactory. The filters made of felt and the wet filters have good average values about 98%.Usually the felt filter has a volume about 40-60% smaller than the pa-per one for the same engine, but more expensive than the paper ones [1].
3. NEW FILTERING TECHNOLOGIESFilters with nan-fibresNan-fibres is a generic name of fi-bres with dimensions under one micron. Using nan-fibres can raise the filtering efficiency and life time, having a minimum impact over the pressure drop.The nan-fibre material can be ex-tremely thin, made by layers of 1-5 microns, and having a high perme-ability of the intake air. Its disad-vantage consists in low mechanical resistance. To raise the resistance, the layers are installed on the mate-rial of a conventional filter.Figure 4 presents a nan-fibre layer installed on a moistened filtering material made of paper [7]. The raise of the filtering material mass is insignificant, somewhere around 0.02 to 0.07 g/m2, but the raise of efficiency is significant (fig.5) [7],[8]. Also, the formed layer (the encrusment) of impurities, at the
Fig. 2. The capacity of dust storage (test made after SAE/ISO standards with fine dust [1]).
Fig. 3. The initial massic efficiency (tests made after SAE/ISO stan-dards with fine dust [1]).
Fig. 4. Microscopic electronic view of a nan-fibre material; the nan-fi-bres are fixed on a classic filtering element [7]

14
Ingineria automobilului Vol. 8, no. 1 (30) / March 2014
filter’s surface, can’t be thicker. It can be easily removed by blowing air in the opposite direction of the air flow. On the other hand it fluffs inside the filter’s box, due to motor vehicle vibrations, making the re-moving procedure, of it, easier.In dusty environment the life time of a nan-fibre filter is two time big-ger than the conventional one [7].The filtering efficiency of the new filters is presented in figure 5. For nan-fibre filters, the initial efficien-cy have a high level of 90%, at a di-mension of particles of 2µm, com-pared to the classical one which have a 40% value.Using those filters, a high level of the engine’s protection is obtained. The abrasive particles passed through the filter, which have a dimension under 5µm are respon-sible for the most part of the wear of the cylinder-segment–piston coupling [7].Another benefit of using nan-fibre filters is the reduced quantity of the exhausted powders at the diesel en-gines [9], [10].The production technology of the nan-fibre filters makes possible obtaining them at a small dimen-sions, compared with the filters from the same category but from classical materials. The difference is about 30 to 60%, depending on their shape (parallelepiped – 30%, cylinder – 60%) [8], [11].The progressive structure of fibre and micro-fibresThe paper [12] presents an air filter with a filtering medium made of a synthetic progressive structure of fibres and nan-fibres (fig.6). Compared to the paper one with a thickness smaller than a mm, it has a mass of 230-250g/m2 while the paper one have values between 190-300g/m2. The initial efficiency of the filter with progressive struc-ture of unwoven fibres is around 99.5-99.7. Mechanical resistance of those filters was superior in severe conditions, excessive humidity (kept in water before use) and ex-
Fig. 5. The particle dimension influence over the filtering efficency [7]
Fig. 6. The filtering material with a progressive structure of fibres and micro-fibres (felt) [12].
Fig. 7. The raise of pressure drops for the classic paper filter and the one with a progressive structure of fibres, during outside tests [12]
Pres
sure
dro
p [b
ar]
Using perriod [h]

15
Ingineria automobilului Vol. 8, no. 1 (30) / March 2014
treme temperatures of 110oC.The tests of the classical paper fil-ters and the one with progressive structure were made on a special testing bench, placed near a high traffic road. A flux of atmospheric airpasses through the filters with a value of the debit of 300m3/h, 24
hours per day, 7 days a week (fig. 7).Using this type of filtering mate-rial with the same characteristics as the classical one, a small dimen-sion of the filter can be reached. For the same dimensions as the classical one the life time will be higher [12].
The filtering element with reticular porous structure ( foam)A high efficiency of collecting the impurities and high storage capacity is obtained for a special foam with a porous reticular structure (fig.8) [6].Paper [6] presents the filtering sys-tem equipped with a filtering ele-ment obtained by 4 layers reticular foam. This system has a long period of use which was used on Ford Focus (fig.9). This technology uses an element made of pressed layers of reticular foam which has a life time period of 240,000km. A supplementary benefit repre-sents the possibility of loading them with active carbon. By this procedure is possible to retain the gasoline vapours.The multilayer reticular foam filters have the next advantages [6]:- Large filtering surface;
- The foam can have lots of shapes and dimensions;- Water resistance, snow and sol-vents;- The cell size (the flowing chan-nels) permits a good filtering of many size particles;- Selectively, some layers can be impregnated with oils to improve filtering performances;- High storage capacity of dust in high filtering efficiency;- Competitive costs.Figure 10 presents the experi-mental results, from paper [6], of the filter presented in figure 9, impregnated with “ISO fine dust” [16]. The figure contains the aver-age values of dust storage obtained after ISO 5011 standard – tests made with fine dust. The test was made until the rise of the pressure drop reached 2.5kPa, compared to the values of new filters [6].The new used technology has the initial gravimetric efficiency of 99.48% and the final value of 99.52% (fig.11) and a 2.5kPa rise of pressure drop for a mass of dust of 500g at a flow of 384m3/h. The efficiency of those filters is higher than the one of the paper filters (fig. 11). The storage capacity of the dust for a filter that equips Ford Focus is at a high level com-pared with other filters, but, well below the technology potential (fig. 10, fig.11).The structure of wet special fibresThe filters made of fibres (felt) met on the market are not totally capable to totally maintain the oil on them, thus they are used as dry
Fig. 9. A section through the multilayers filter used on Ford Focus [6]Fig. 8. The filtering medium of a reticular foam; clean and load with impurities [6]
Cap
acita
tea d
e sto
care
[g]
Dry paper Treated paper Synthetic fibre 2003/4Ford’s foam
Foam with max capa-bility
Fig. 10. The average values of dust storage [6].
Fig. 11. The gravimetric efficiency – a comparison between Ford’s technology and other filtering mediums [6]

16
Ingineria automobilului Vol. 8, no. 1 (30) / March 2014
filters. The paper [13] presents a fibre material with a tubular shape empty inside (fig. 12) which uses its material properties and shape to have a capacity of storage and to rise the filtering efficiency.The oil is retained inside the tubes (between the fibres) substantial reducing the oil penetration inside the intake manifold).The retention of the dust appears at the surface of moistened fibres, not inside the pains (fig. 13). Thus the gasodynamicresistances are reduced and the pressure drop on the filter is smaller compared to the one of the classic filters. The capacity of storage the dust is 20% bigger than one of the moistened paper filters and with 6% big-ger than the filters with dry non-weaved fibres.By the ISO 5011 standards the initial efficiency of those filters is 98.75%.Donaldson Companydeveloped an air filter capable of self-clean-ing by an air jet (Pulse Air Jet Cleaning (PJACTM) UltraTM air cleaner). This filter is made special for the military motor vehicles. PJAC cleans the filtering element
with short period compressed sir impulses. The life time of this filter rises by minimizing the mainte-nance activity [14].
4. CONCLUSIONSThe innovation design of the air filtering system is absolutely neces-sary to obtain high performances and improving air flowing with the effect on the engine’s performances and wearing.The air filtering using classic paper filters and non-weaved synthetic fi-bres have a reduced initial efficiency. The new developed technologies of air filtering efficiency (at the begin-ning and the end of their lifetime), of storage dust the dust capacity and reduced values of gasodynamic resistances.Using new filtering technologies makes possible:- to reduce the wear of the kine-matic couples by reducing abrasive particles that passes through the filter;- to reduce the dimensions of the filters maintaining the filtering per-formances;- to obtain bigger replacement in-tervals.
dust
Fig. 12. Tubular fibers [13].
ABSTRACTThe air contains lots of impurities, of various sizes and different chemical compounds. The size of the dust particle that passes through the air filter influences the wear of kinematic couples inside the internal combustion engines. The paper presents the classical air filtering performances and the improvements brought by the new filtering technologies. The innovatory design of filtering system is absolutely necessary to rise the performances of the filtering and make an improvement of air flowing and forward increasing engine’s life and performances.
Keywords: air filtering technologies, tests, engines maintenance
REFERENCES[1] Barhate, R.,S., S. Sundarrajan and D. Pliszka, S. Ramakrishna, The poten-tial of nanofibres in filtration, Filtration +Separation May 2008, http://www.sciencedirect.com/science/article/pii/S0015188208700922[2] Barris, M., A., Total Filtration TM, The Influence of Filter Selection on Engine Wear, Emissions, and Per-formance, SAE technical paper series, 952557, Fuels & Lubricants, Meeting & Exposition, Toronto, Ontario, Oc-tober 16-19, 1995[3] Bugli, N.,J., Automotive Engine Air Cleaners - Performance Trends, SAE technical paper series 2001-01-1356, SAE 2001 World Congress, Detroit, Michigan, March 5-8, 2001, ISSN 0148-7191[4] Bugli, N., J., Service Life Expec-tations and Filtration Performance of Engine Air Cleaners, SAE technical pa-per series 2000-01-3317, 2000 Word Congres, Sao Paulo, Brazilia, Octom-brie 3-5, 2000,[5] Bugli, N., J., and Gregory S. Green, G., S., Performance and Bene-fits of Zero Maintenance Air Induction Systems , SAE technical paper series 2005-01-1139, 2005 Word Congres, Detroit, Michigan, Aprilie 11-14, 2005, SP-1966[6] Bugli, N., J., Scott Dobert and Scott Flora, Investigating Cleaning Procedures for OEM Engine Air Intake Filters, SAE technical paper series 2007-01-1431, 2007 Word Congres, Detroit, Michigan, Aprilie 16-19, 2007, SP-2096[7] Cappello, Monica, Air inta-ke filtration media tackles soot challenge, Filtration+Separation July/August 2012, http://www.sci-encedirect.com/science/article/pii/S0015188212701982[8] Gerald Liu, Z., Edward M. Thu-row, Byron A. Pardue and Thomas J. Wosikowski, Effect of Nano-Filtered Intake Air on, Diesel Particulate Mat-ter Emissions, SAE technical paper series 2004-01-0642, Detroit, Michi-gan, Martie 8-11, 2004
[9] Grafe, T., Mark Gogins, Marty Barris, James Schaefer, Ric Canepa, Nanofibers in Filtration Applications in Transportation, Presented at Filtra-tion 2001 International Conference and Exposition of the INDA (Asso-ciation of the Nowovens Fabric In-dustry), Chicago, Illinois, December 3-5, 2001 http://www.donaldson.com/en/filtermedia/support/datali-brary/052024.pdf[10] Jaroszczyk, T., Byron A. Par-due, Cristopher E. Holm, Recent advance in engine cleaners design and evaluation, Journal of KONES Inter-nal Combustion Engines 2004, vol 11, No, 1-2 http://ilot.edu.pl/KO-NES/2004/01/29.pdf[11] Jaroszczyk, T., Stanislav Petrik, Kenneth Donahue, Recent develop-ment in heavy duty engine air filtration and the role of nanofiber filter media, Journal of KONES Powertrain and Transport, Vol. 16, No. 4. Pp 207-216. Presented at the International Scientific Congres on Powertrain & Transport Means, Zacopane, Poland, September 13-16, 2009[12] Stahl U., and Heinz Reinhardt, New Nonwoven Media for Engine In-take Air Filtration with Improved Per-formances, SAE technical paper series 2006-01-0272, 2006 Word Congres, Detroit, Michigan, Aprilie 3-6, 2006, SP-2014[13] Tanaka, S., and Kenji Koga, High Performance Wet Type Nonwoven Air Cleaner Filter Element, SAE technical paper series 2009-01-1065, [14] ***Air filter for maximum engi-ne protection, Technology news 12, Filtration+Separation September 2008, www.donaldson.com; www.ahlstrom.com[15] *** Bosch Automotive Hand-book, 8th Edition, may 2011, [16] *** International Standard ISO 5011, Inlet air cleaning equipment for internal combustion engines and compressors – Performance testing, Second edition 2000-12-01, Corected and reprinted 2001-07-15
Fig. 13. The dust retaining principle for wet tubular fibres [13]

17
Ingineria automobilului Vol. 8, no. 1 (30) / March 2014
filters. The paper [13] presents a fibre material with a tubular shape empty inside (fig. 12) which uses its material properties and shape to have a capacity of storage and to rise the filtering efficiency.The oil is retained inside the tubes (between the fibres) substantial reducing the oil penetration inside the intake manifold).The retention of the dust appears at the surface of moistened fibres, not inside the pains (fig. 13). Thus the gasodynamicresistances are reduced and the pressure drop on the filter is smaller compared to the one of the classic filters. The capacity of storage the dust is 20% bigger than one of the moistened paper filters and with 6% big-ger than the filters with dry non-weaved fibres.By the ISO 5011 standards the initial efficiency of those filters is 98.75%.Donaldson Companydeveloped an air filter capable of self-clean-ing by an air jet (Pulse Air Jet Cleaning (PJACTM) UltraTM air cleaner). This filter is made special for the military motor vehicles. PJAC cleans the filtering element
dust
Shorter design to production in-tervals and fast attainment of valid data require calculations to be per-formed on virtual models as similar as possible to real ones. In computer aided design of internal combustion engines a surrogate engine model is defined as a model capable of sub-stituting the behavior of the physical model. These models proved use-ful in situations where there are too many simulation cases, when the costs of a physical experiment are too high and for real time applica-tions where time is essential.By using surrogate models it was found that there is a decrease of up to 70% in the processing time of the simulation in comparison to the simulations performed on the physical model. The use of surrogate models in computer simulations yielded datasets for the combus-tion process, fuel consumption and pollutant emissions parameters of compression ignition (C.I.) engines with high accuracy. This emphasizes the importance and viability of using virtual models to substitute existing real models from experimental test-ing laboratories.Considering the above stated, a sur-rogate model of a physical C.I. en-
gine model was built using real-time simulation and testing application AVL Boost RT. Another application, Design Explorer, provided the neces-sary tools to create and configure the surrogate model. The steps required to transform the physical model into a surrogate model can be observed in figure 1.In order to develop and implement the transformation algorithm of the physical model into the surrogate model it is necessary to obtain some primary input data such as: experi-mental data regarding the operating parameters of the physical engine, injection parameters, combustion parameters, etc.Experimental measurements con-ducted on the engine test bench (1)
for a duty cycle of a compression ignition engine provided data about the following parameters: combus-tion chamber pressure variations, in-take and exhaust flow rate variations, intake and exhaust manifold tem-perature, fuel consumption, ambient temperature and barometric pres-sure. The recorded data is used as in-put data to create and study a physi-cal model in the AVL Boost applica-tion. For this model, the AVL MCC (combustion model) and iRate (rate of injection) were defined.The combustion process parameters influencing the heat release rate (or ROHR) were optimized using De-sign Explorer. This application runs a series of simulations in order to iden-tify the optimal combustion process
coefficients, so that the simulation results precisely match the results of the experimental measurement. Based on the initial gathered data, through experimental measure-ments on the engine test bench, the physical model (4) was developed using AVL Boost RT.The computer simulations running on the cylinder physical model pro-vided values for NOx and CO. Values concerning emissions distribution in the cylinder physical model are com-pared for validation with the values obtained after running simulations on the AVL Boost model, which in turn are validated by experimental results.In order to reduce the number of simulations and the total simulation
Advanced Computer Simulation Methods of C.I. Engines Processes. Surrogate Models Modelsetode avansate de simulare computerizată a proceselor M.A.C. prin utilizarea modelelor surogat
Nicolae Vlad [email protected]
.Călin [email protected]
Uversitatea Tehnică din Cluj-Napoca
Fig. 1. Development of the surrogate model.

18
Ingineria automobilului Vol. 8, no. 1 (30) / March 2014
time, a surrogate model was devel-oped. This model replaces the physi-cal model built in AVL Boost RT and substitutes its behavior based on data flow concerning intake and exhaust manifold pressure as well as temperature and the exhaust enthal-py. The necessary data is gathered by the built-in monitoring interfaces of AVL Boost. Afterwards, the data is evaluated and optimized using a se-ries of experiments designed in DoE (Design of Experiment) in order to provide the response parameters for optimal control of the combustion process. Intake and exhaust modules remain the same while, based on the gathered data flow, the cylinder module, heat transfer module and, partially, the control module are replaced. This way, the whole simu-lation process is simplified and the simulation time is reduced by up to 70%.
The physical model built using AVL Boost RT can be seen in figure 2. It consists of the following modules: intake, cylinder, dynamometer, heat transfer, exhaust and control.To generate the surrogate model the physical model, running AVL MCC combustion version and iRate injec-tion law, designed in AVL Boost was used (figure 3).The next step was to attach the en-gine interface elements to the physi-cal model. These elements were designed to extract data from the simulation process through electri-cal connections that identify with the bus (LIN, CAN, etc.) [2].The engine interface element EI1 is connected to the cylinder element and has the purpose of managing the Cylinder Temperatures data set. EI2 element manages the Combustion Data based on the following input parameters: combustion coefficient,
turbulence coefficient and the kinet-ic energy dissipation coefficient [3]. Pipe Wall Temperature it’s managed by the EI3 element, while the Up/Down Wall Temperature it’s handled by EI4. The last engine interface ele-ment, namely EI5, manages the Air/Fuel Ratio datasets.The FI (Formula Interpreter) and MNT (Monitor) elements extract, through sensory channels, the corre-sponding values for the mean cylin-der pressure and temperature, as well as for mass flow and system enthalpy of intake and exhaust manifold. The acquired data is used to generate the surrogate model. The FI elements use an algorithm that returns a de-sired value (OUTPUT) as a func-tion of other variables (INPUT) [5]. Resulting cycle average values are presented by the MNT element after a simulation process for an arbitrary number of actuation channels and
for an arbitrary number of sensory channels. The characteristics of the monitor element connected to the intake valve, namely MNT1, are listed in table 1, while the character-istics for the exhaust valve, namely MNT2, can be observed in table 2.To run the DoE experiment in the Design Explorer application, result-ing data from the physical model simulation process is loaded (Figure 4) and the statistical analysis func-tion Y_AT_X_MAX (Statistics Re-sponse) is applied (Figure 5). This generates the maximum value for the studied parameters, which are: engine torque, cylinder walls heat transfer, exhaust enthalpy flow, in-take air mass, mean intake air pres-sure, exhaust correction coefficient, mean exhaust temperature, mean exhaust pressure, the sum of exhaust mass flows, combustion products mass flow, burned fuel mass flow,
Fig. 2. The physical model - designed with AVL Boost RT.

19
Ingineria automobilului Vol. 8, no. 1 (30) / March 2014
mean mass flow.The method of choice for statistical evaluation was the Sobol Sequence, which is a quasi-random sequence that covers the design space by using a small number of design points [1]. This sequence uses the same set of parameters for all evaluation process phases, in order to generate uniform-ly distributed successive partitions for the unit interval for the purpose of reordering the coordinates in each
evaluated dimension (Figure 6).After evaluating a sufficient enough amount of experiments, the results are loaded into the Design Explorer application for the analysis of the correlation matrix (figure 7). It is a square symmetrical MxM matrix with the ij(th) element equal to the correlation coefficient rij between the i(th) and the j(th) variable. The diagonal elements (correlations of variables with themselves) are
always equal to 1. The correlation is 1 in the case of an increasing lin-ear relationship, −1 in the case of a decreasing linear relationship, and some value in between in all other cases, indicating the degree of linear dependence between the variables. The closer the coefficient is to either −1 or 1, the stronger the correlation between the variables.The frequency histogram is shown as a chart with bars that represent
the values of the selected parameter within certain ranges (bins). A red curve shows the probability that a parameter will have a value in a par-ticular bin. The vertical axis on the right is the probability. Some statis-tical information about the distribu-tion of the parameter values and the boundaries are shown at the bottom of the plot (Figure 8).The 3D Scatter Plot shows a 3D plot of the design points. The design vari-ables and the design variable con-straints can be used as x-axis, y-axis and z-axis. The Bubble Chart shows a 4D plot of the design points. The de-sign variables and the design variable constraints can be used as x-axis and y-axis of the plot as well as color and size of the bubbles (Figure 10).The History Plot shows only the de-sign points, which have the status “Completed”. It shows the values of the selected parameters (up to four parameters can be selected) versus the RunID of the design points (Fig-ure 11). A response surface model (RSM) is generated by using the design points available in the Re-
Table 1. Characteristics of the elements connected to the intake valve, MNT1
Table 2. Characteristics of the elements connected to the exhaust valve, MNT2
Fig. 3. Generating the surrogate model.SB1... SB2 – boundary conditions; 1 ... 11 – pipes; J1 – junction; MP1 ... MP5 – measuring points; CL1 – air filter; R1 ... R2 – restrictions; PL1 ... PL3 – manifolds; I1 – injector; C1 – cylinder; CAT1 – catalyst; ECU1 - electronic control unit; E1 – engine element; EI1 ... EI5 – enigne interface; FI1 ... FI2 – formula interpretor; MNT1 ... MNT2 – monitor elements.
Nr. Variable Explanation Element Sensory channel
1 fc_correction Flow correction coefficient FI1 Output No.1
2 t_mean_intake Mean intake temperature FI1 Output No.2
3 p_mean_intake Mean intake pressure FI1 Output No.3
4 mflow_sum_intake Intake mass flow FI1 Output No.4
Nr. Variable Explanation Element Canal senzorial1 fc_exhaust Exhaust flow coefficient FI2 Output No.12 t_mean_exhaust Mean exhaust temperature FI2 Output No.23 p_mean_exhaust Mean exhaust pressure FI2 Output No.34 mflow_sum_exhaust Exhaust mass flow FI2 Output No.45 mf_CP_exhaust Mass flow of combustion products FI2 Output No.56 mf_FB_exhaust Burned fuel mass flow FI2 Output No.67 mf_FV_exhaust Fuel mass flow FI2 Output No.7

20
Ingineria automobilului Vol. 8, no. 1 (30) / March 2014
sults table. The order of the RSM depends on the selected regression model. The parameters in the x-axis and the y-axis are varied to plot the surface and the other parameters are fixed at the values shown in the entry boxes. The values of the entry boxes define a reference point in the design space, which is used to calculate the distance of the design points to the reference point (Figure 12).After analyzing the results of the
response model survey, the input variables needed for generating the surrogate model are selected: engine torque and load signal. Afterwards the evaluated variables are estab-lished.In order to configure the surrogate model SM1, the evaluated variables are managed through a Common Flux Vector. The surrogate model SM2 is used to define the Wall Heat evolution, SM3 the Intake Flow coef-
ficient, SM4 the Exhaust Flow coef-ficient, while SM5 defines the Torque [5].The function element FI1 (Func-tion 1) is used for the estimation of the flow coefficient as the product between the fuel flow controlled by the control unit, based on the signals from the accelerator pedal sensor, and the flow rate coefficient. FI2 is used to calculate the elapsed time (Real Time) until the monitored parameters are outputted. The surro-gate model can be seen in figure 13.To illustrate the benefits of using a surrogate model as a substitute for the physical model in computer simulations of the internal com-bustion engine, a series of identical simulations for the two models were performed. The surrogate model was developed to replace the physical be-
havior of the physical model in order to reduce the time needed to run simulations. Figure 14 is the result of a comparison between measured simulation times for the two models.The DoE mechanism was used to analyze the simulated models re-sponse parameters for determining the optimal control values of the combustion process. To achieve the desired results an optimal number of points, that best define the simulated process, is determined. Following this process, an algorithm is applied to manipulate their values until the set objective is achieved. The optimi-zation process was designed to mini-mize the discrepancies between the simulated and the experimentally determined values.Considering the previously stated, it becomes clear that the use of a sur-
Fig. 5. Y_AT_X_MAX function.
Fig. 6. Sobol Sequence.
Fig. 9. 3D Scatter Plot. Fig. 10. Bubble chart.
Fig. 4. Response Editor.
Fig. 7. Correlation matrix. Fig. 8. Frequency histogram.

21
Ingineria automobilului Vol. 8, no. 1 (30) / March 2014
rogate model drastically reduces the simulation time. Furthermore, the simulated values do not exceed the required 3% deviation to validate the results.
As a general conclusion, we can state that, based on the presented and validated results, the trans-formation of the physical model into a surrogate model is desir-
able because of its many benefits: reduction of simulation, develop-ment and validation time, as well as costs for the considered engine model.
REFERENCES[1] *** AVL WORKSPACE version 2011, AWS DoE and Optimization, AVL List GmbH, Graz, Austria, Do-cument no. 18.0103.2011, Edition 07.2011;[2] Mariaşiu, F., Iclodean, C., Mana-gementul Motoarelor cu Ardere Inter-nă, Editura Risoprint, Cluj-Napoca, 2013, ISBN: 978-973-53-1004-2;[3] *** AVL BOOST version 2011, Users Guide, AVL List GmbH, Graz, Austria, Document no. 01.0104.2011, Edition 07.2011;[4] Tepimonrat, T., Wannatong, K., Aroonsrisopon, T., Effects of Exha-ust Valve Timing on Diesel Dual Fuel Engine Operations under Part Load Conditions, International Confe-rence on Mechanical Engineering TSME, Krabi, Thailand, 2011;[5] *** AVL BOOST RT version 2009, Training DoE and Surrogates, Edition 10.2009;[6] *** AVL BOOST RT version 2011.1, Impress xD Surrogates Cre-ation – Users Guide, Document no. 18.0110.2011.1, Edition 12.2011; [8] *** AVL BOOST version 2011, Aftertreatment, AVL List GmbH, Graz, Austria, Document no. 01.0107.2011, Edition 07.2011.
ABSTRACTThis paper intends to shed some light on a new way to improve computer simulation times of internal com-bustion engines with a good enough accuracy. This improvement is nec-essary due to the need for shorter design to production intervals, lower costs and fast and cheap gathering of valid data. Eventhough, computer simulation is a good way to achieve these desiderates, in some cases the equipment used is very expensive and/or a lot of processing power is required. Using a surrogate model to substitute the physical model in sim-ulations can reduce simulation time by up to 70% without exceeding the accepted 3% deviation. Before presenting the comparison results between the necessary simulation times for the physical and surrogate model, the reader is introduced into the process of transforming a physi-cal model into a surrogate model.
Keywords: engines processes, com-puter simulation, surrogate models
Fig. 11. Istoricul procesului de evaluare.
Fig. 14. Computer simulation duration.
Fig. 11. History plot. Fig. 12. Response surface.
Fig. 13. Surrogate model – designed with AVL boost RT

22
Ingineria automobilului Vol. 8, no. 1 (30) / March 2014
1. INTRODUCTIONThe analyzed product is an over-charged, V8 diesel engine.In order to determine the analyti-cal expression of the approximation function, which allows us to calcu-late the actual torque based on the angular speed and load, it is neces-sary to build a mathematical model which will interpolate the experi-mental data gathered from the test bench [1]. The results of the experi-mental tests are imported into Math-cad software program in order to do some processing and to plot a graph (fig. 1). We notice that the mathe-matical function which describes the torqe is not fully determined, except for a few values defined on a discrete
and finite array. The values are in a clearly defined interval that starts at the minimum angular speed - 1760 rpm (nemin) and end at the maximum angular speed 2300 rpm (nemax).Generating the mathematical model through polynomial interpolation using spline functionsThe polynome used to approximate the torque is defined using spline functions. One of their properties is that they are twice differenti-able and continuous in the interval [nemin,nemax] [2]. In this interval we define a nodes network composed of 6 (six) points, labeled Ai(nei,Mei), and (m-1) subintervals, labeled [nei, nei+1] (fig. 2). The discrete values of the function, (Mei) on the ordinate and (nei) on the abscissa, are known and used as entry data. The interpolation method requires using successions of third-degree spline functions.
The unknown factors (ak, bk, ck and dk), where (k = 1,2 ... m-1), are deter-mined by imposing differentiability and continuity condition to the cu-bic spline function, as follows:yy in each point (nei) belonging to
the nodes network, the (Mei) dis-crete values are equal with the ex-pression of the spline approximation functions corresponding to these
points;yy the 1st and 2nd degree differ-
entials of Sk(n) and Sk+1(n) spline functions, specific to the successive subintervals [ne(i-1),nei] and [nei,ne(i+1)], are equal in the (nei) points which represent the intersection of those subintervals;yy the 2nd degree differentials of
the spline functions specific to the subintervals fron the nodes net-work’s extremity, calculated for the points at the beginning and the end of the interval - (ne0) and (ne(m-1)), are equal to zero.From the first condition we get 10 (ten) equations, from the second we get 8 (eight) equations and from the last condition we get two more equa-tions. The 20 resulting equations are put together into the following equa-tion system:
We use the Mathcad software to de-termine the solutions for the equation system. By replacing these values into the approximation polynomials we obtain a group of analytical expres-sions for the third-degree spline func-tions corresponding to each subinter-val of the nodes network:The mathematical model derived through polynomial interpolation using linear independent algebraic functionsThe method of interpolation using lin-ear independent algebraic functions approximates the function we wish to plot Mi(n) with the interpolation polynome Mali(n), defined by the rela-tion [3]:The interpolation function is de-fined using discrete points, randomly distributed inside the interval [nemin, nemax], which are described by angu-
Some Aproximation Methods Used to Model An Engine Torque Map Metode de aproximare a curbei de variaţie a momentului motor
Octavian [email protected]
Radu VILĂ[email protected]
Ioan BĂRBUŞ[email protected]
Academia Tehnică Militară, Bucureşti, România
Sistemul de ecuaţii (1)
Grupul de expresii analitice ale funcţiilor spline de ordinul trei pentru fiecare subinterval al reţelei de noduri (2)
Polinomul de interpolare (3)Fig. 1. Engine torque MAP- experimental data
Fig. 2 The point network nodes reprezentation

23
Ingineria automobilului Vol. 8, no. 1 (30) / March 2014
lar velocity (ni) on the abscissa and torque (Mei) on the ordinate. The co-ordinates (ni, Mi) are determined from the experimental data [1]. We notice that the approximation polynome is defined using monoms that resemble the (xk) template (k is chosen depend-ing on (m) – the number of points of the nodes network). The (Mali) polynome is a continuous function, that has real values, defined into the closed interval [nemin, nemax]. Determin-ing the value of (ak) – the approxima-tion polynome’s unknowns, is being accomplished by using the condition imposed by the polynomial interpola-tion – yi=Mi(ni)=Mali(ni), meaning that for any point (ni) from the interval [nemin,nemax], the value of the interpola-tion polynome is equal to the value of the polynome that is being interpo-
lated. By applying this condition, we obtain a system that has six equation and six unknowns. After replacing the solutions of the equation system we get the final form of the interpolation poly-nome’s analytical expression.The mathematical model derived through the approximation method that uses Lagrange polynomesThe method has Lagrange’s poly-nome [4] as a starting point and al-lows the approximation of the func-tion we wish to plot on the interval [nemin,nemax] in which the function is defined. The mathematical model of the polynome being used to ap-proximate the function we wish to plot is defined using the (m) points of the nodes network and has the following structure: Li(n) represents Lagrange’s polynome, and Me(nei)
the value of the interpolation func-tion (yi) calculated for the (m) points from the nodes network. The specific form of Lagrange’s polynome is: The analytic expression of the interpola-tion function that passes through the (m) nodes defined inside the interval [nemin, nemax] is determined by replac-ing the expression set (6) inside the mathematical model of Lagrange’s polynome.The analytic expression of the ap-proximation function defined by the Lagrange’s polynome is identical to that derived from interpolation using linear independent algebraic polynomes (fig. 3). MODEL VALIDATIONThe proposed mathematical models have allowed us to get some analyti-
cal expressions which approximate the torque variation curve (the exter-nal engine characteristic on full load – fig. 4) . By comparing the curve obtained by using the mathematical model and the one we got from ex-perimental data we can observe that the model built upon the method that uses cubic spline functions ap-proximates better the external char-acteristic of the engine.CONCLUSIONSIn this article we analyzed several methods to approximate the torque depending on the angular veloc-ity, and thus we obtained several analytical models of the function we want to map. The solution analysis revealed that the interpolation poly-nome generated using third-degree spline functions approximates bet-ter the engine torque map on full load, that we determined on the test bench. The approximation methods are useful if we want to determine the values of the mapped function in other points than the ones we know, respectively the ones determined on the test bench.
Fig. 3. Suprapunerea funcțiilor de interpolare
Fig. 4. The engine torque MAP, mapped using Spline and Lagrange functions
Curve A – The experimental mapped external characteristic, Curve B - The external characteristic, mapped using Spline functions, Curve C - The external characteristic,
mapped using Lagrange polynome, Curve D - The error of the model that uses Spline functions, Curve E - The error of the model that uses Lagrange polynome.
Expresia analitică a polinomului de interpolare (4)
Modelul matematic al polinomului care stă la baza aproximării funcţiei de modelat este definit cu ajutorul celor (m) puncte
ale reţelei de noduri (5).
Forma particulară a polinomului lui Lagrange (6)
ABSTRACTThe paper aims at providing a math-ematical model for the variation of the engine’s torque vs. its angular speed. When developing the model, we based it on simple approxima-tion methods as the polynomial in-terpolation using “spline” functions, polynomial interpolation using in-dependent algebraic linear functions and Lagrange polynomial functions. The modeled phenomenon was the engine torque map of a V8 engine, which is used to power a military tracked vehicle. The map was plotted on a test bench. Unfortunately, when plotting the map, a small number of points have been used (only six), spread within the maximum torque’s
angular speed and the maximum power ones. Building up a model aims at issuing an analytical expres-sion of a certain function that will be able to provide the engine’s torque no matter what the angular speed will be within the previously mentioned range. The engine’s throttle will be kept all the time at its maximum value. The model is further validated by graphical comparison between its own provided curve and the experi-mental plotted one. We noticed that the proposed model covers, within acceptable margins of error, the en-gine’s experimental torque map.
Keywords: spline, Lagrange, engine torque map, mathematical model.
REFERENCES[1] Liviu LOGHIN, Contribuţii privind studiul proceselor ce au loc la schimbarea etajelor în transmisiile hi-dromecanice ale autovehiculelor militare cu şenile, Teză de doctorat, 2005;[2] V.V. Gorskii, Spline Approximation Method, ISSN 0965-5425, Computa-tional Mathematics and Mathemati-
cal Physics, 2007, Vol. 47, No. 6, pp. 895-899;[3] George M. Philips, Interpolation and Approximation by Polynomials, Springer-Verlag, New York, 2003.[4] Jean-Paul Berrut, Lloyd N. Tre-fethe, Barycentric Lagrange Interpola-tion, SIAM REVIEW, Vol. 46, No. 3, pp. 501-517.

24
Ingineria automobilului Vol. 8, no. 1 (30) / March 2014
1. INTRODUCTIONThe will for the automotive engi-neers to manufacture engines with higher and higher efficiency led to an increase of the researches in this domain [2]. By comparing the effi-ciencies of the internal combustion engines used by car makers, we can say that the maximum is achieved by the compression ignition engine (Figure 1). Although the electric mo-tor has a very high efficiency (about 80-90%), his drawback is the fossil energy consumed to produce the necessary electric energy. The effi-ciency for producing electric energy from fossil energy is 30%, including the transport to the delivery point. From here, results an efficiency of the electric engine of just 27%. The same calculus, but converting coal into electric energy, raises the overall electric motor energy up to 29% [4].In order to improve the internal combustion engines efficiency, is mandatory to increase their per-formance. In order to increase per-formance, the fuel-air ratio must be higher. The relation of these two parameters is: for 1kg of fuel we burn 14.5kg of air in Otto engines and 14.7kg of air in Diesel engines. The injection system depends of the intake system of the engine. With other words, if we increase the amount of air that is inducted
into the cylinders, we can increase also the amount of fuel. In order to increase the amount of air aspirated by the engine, we need to use an su-percharging equipment.. Internal combustion engine su-percharging can be done using different methods, among we say: natural supercharging (or acoustic supercharging; the intake system is designed to generate a little higher pressure than ambient pressure by using pressure waves in the system), supercharging using mechanical driven compressors (the super-charger is powered by the engine crankshaft; Roots, Sprintex, G, etc) or supercharging using the exhaust gases pressure to build up the intake pressure (turbocharger, pressure wave supercharger) [3, 5].One particular supercharger that is very little used by the automotive manufacturers, but although very efficient, is the pressure wave su-percharger (figure 2) [1]. This was introduced first time in year 1942, when it has been used as a final com-pression step of a steam locomotive (figure 3) [1, 2].By analyzing figure 3, we can see that the area defined by the points 0-1-4’-5’ is smaller than the area 0-2-3-5, which leads to a lower available engine work, for the same amount of fuel used.The first application in automotive domain of the pressure wave super-charger was done by Mazda back in 1985, which launched the model 626 2.0 DCX.One of the problems of that engine was the fact that the pressure wave supercharger was mechanically driv-
Researches regarding performance improvementof a pressure wave superchargerCercetări privind îmbunătăţirea performanţeiunui compresor cu unde de presiune
Cătălin George [email protected]
Universitatea Transilvania din Braşov, România
Fig. 1. Thermal engine efficiency comparison
Fig. 2. Pressure wave supercharger, Comprex CX-93 type
Fig. 3. T-s diagram of the steam turbine of the locomotive engine
Effici
ency
[%]
Tem
pera
ture
C.I. Engine S.I. EngineSteam Engine
Entropy
Stirling EngineE-motorGas Turbine (1600K)
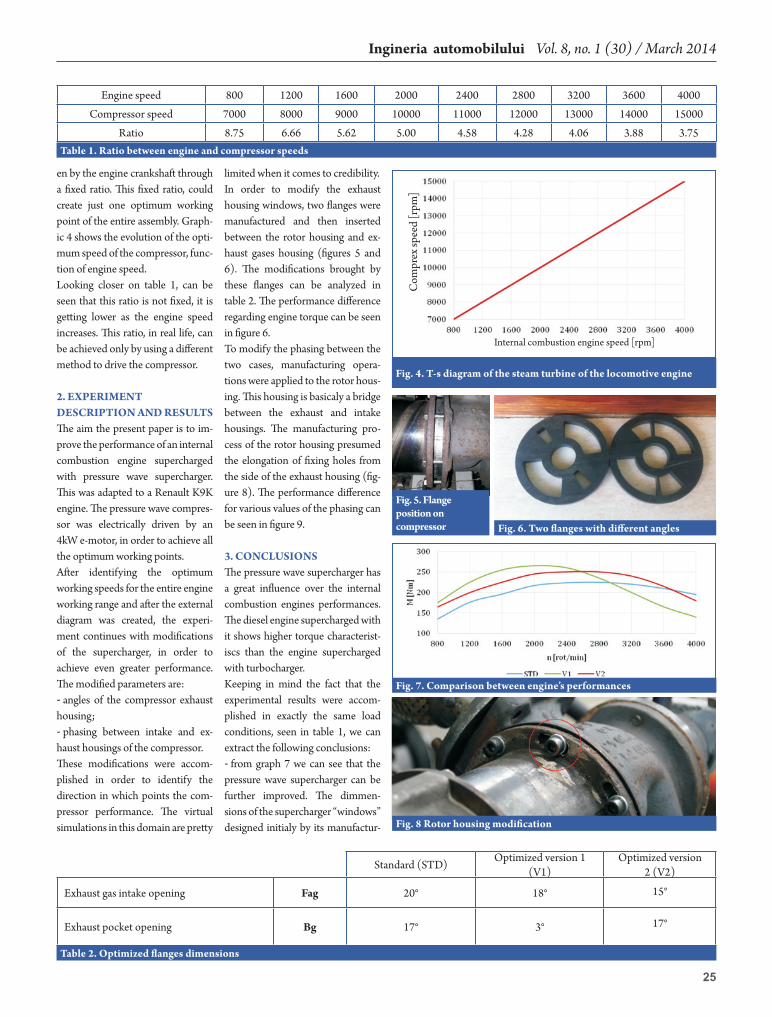
25
Ingineria automobilului Vol. 8, no. 1 (30) / March 2014
en by the engine crankshaft through a fixed ratio. This fixed ratio, could create just one optimum working point of the entire assembly. Graph-ic 4 shows the evolution of the opti-mum speed of the compressor, func-tion of engine speed.Looking closer on table 1, can be seen that this ratio is not fixed, it is getting lower as the engine speed increases. This ratio, in real life, can be achieved only by using a different method to drive the compressor.
2. EXPERIMENT DESCRIPTION AND RESULTSThe aim the present paper is to im-prove the performance of an internal combustion engine supercharged with pressure wave supercharger. This was adapted to a Renault K9K engine. The pressure wave compres-sor was electrically driven by an 4kW e-motor, in order to achieve all the optimum working points.After identifying the optimum working speeds for the entire engine working range and after the external diagram was created, the experi-ment continues with modifications of the supercharger, in order to achieve even greater performance. The modified parameters are:- angles of the compressor exhaust housing;- phasing between intake and ex-haust housings of the compressor.These modifications were accom-plished in order to identify the direction in which points the com-pressor performance. The virtual simulations in this domain are pretty
limited when it comes to credibility. In order to modify the exhaust housing windows, two flanges were manufactured and then inserted between the rotor housing and ex-haust gases housing (figures 5 and 6). The modifications brought by these flanges can be analyzed in table 2. The performance difference regarding engine torque can be seen in figure 6.To modify the phasing between the two cases, manufacturing opera-tions were applied to the rotor hous-ing. This housing is basicaly a bridge between the exhaust and intake housings. The manufacturing pro-cess of the rotor housing presumed the elongation of fixing holes from the side of the exhaust housing (fig-ure 8). The performance difference for various values of the phasing can be seen in figure 9.
3. CONCLUSIONSThe pressure wave supercharger has a great influence over the internal combustion engines performances. The diesel engine supercharged with it shows higher torque characterist-iscs than the engine supercharged with turbocharger. Keeping in mind the fact that the experimental results were accom-plished in exactly the same load conditions, seen in table 1, we can extract the following conclusions:- from graph 7 we can see that the pressure wave supercharger can be further improved. The dimmen-sions of the supercharger “windows” designed initialy by its manufactur-
Engine speed 800 1200 1600 2000 2400 2800 3200 3600 4000
Compressor speed 7000 8000 9000 10000 11000 12000 13000 14000 15000
Ratio 8.75 6.66 5.62 5.00 4.58 4.28 4.06 3.88 3.75Table 1. Ratio between engine and compressor speeds
Fig. 6. Two flanges with different angles
Fig. 5. Flange position on compressor
Fig. 4. T-s diagram of the steam turbine of the locomotive engine
Fig. 7. Comparison between engine’s performances
Fig. 8 Rotor housing modification
Standard (STD) Optimized version 1 (V1)
Optimized version 2 (V2)
Exhaust gas intake opening Fag 20° 18° 15°
Exhaust pocket opening Bg 17° 3° 17°
Table 2. Optimized flanges dimensions
Com
prex
spee
d [r
pm]
Internal combustion engine speed [rpm]

26
Ingineria automobilului Vol. 8, no. 1 (30) / March 2014
ers, can be further improved because they are not optimal for the entire working range of the engine;- from graph 9 we can see that as the phasing between the two housing is getting smaller, the performance in the low-rev area are higher. In the same time, at high rev points, the per-formances are lower. An optimum value for the phasing could be 20°.
INTERNATIONAL SUPPORTThis paper is supported by the Sec-toral Operational Programme Hu-man Resources Development (SOP HRD), financed from the European Social Fund and by the Romanian Government under the contract number POSDRU ID76945
REFERENCES[1] Gyarmathy George, How does the Comprex pressure-wave su-percharger work [C], SAE paper 830234.1983:pp. 91–105;[2] Weber F, Guzzella L. Control oriented modeling of a pressure-wa-ve supercharger (PWS) to gasoline engine[C]. SAE paper 2000-01-0567. 2000;[3] Stone R., Introduction to Inernal Combustion Engines, Third Edition, SAE 1999, ISBN: 0-7680-0495-0;[4] Heisler H, Advanced engine technology, 1995, ISBN: 978-1560917342;[5] Hermann H., Peter P., Charging the internal combustion engine, Sprin-ger Wien New York, 2003.
ABSTRACTThis paper presents the results of experimental investigations carried out on a internal combustion engine supercharged with pressure wave compressor, Comprex CX-93 type. The supercharger, however, shows potential for improvement in terms of construction. This article proposes two modifications of the
unit, namely: modifications of the exhaust housing angles and phasing modification between the inlet and exhaust housings. The results are presented as graphs, showing the influences of the new setup over engine torque.
Keywords: supercharging, pressure, phasing, compressor, engine.
Fig. 9. Performance comparison
Talon de abonamentDoresc să mă abonez la revista Auto Test pe un an
(12 apariţii „Auto Test” şi 4 apariţii supliment „Ingineria automobilului”)
Numele ......................................... Prenumele .........................................Societatea....................................... Funcţia ..............................................Tel ................................................... Fax: ....................................................E-mail ............................................. Adresa .......................................................................................................... Cod poştal. .....................................Oraşul ............................................. Ţara ...................................................
Preţul abonamentului anual pentru România: 65 lei. Plata se face la Banca Română de Dezvoltare (BRD) Sucursala Calderon, cont
RO78BRDE410SV19834754100.
Subscription FormI subscribe to the Auto Test magazine for one year
(12 issues of „Auto Test” and 4 issues of it’s supplement „Ingineria automobilului”)
Name ............................................ Surname .............................................Society........................................... Position ..............................................Tel .................................................. Fax: .....................................................E-mail ........................................... Adress .......................................................................................................... Postal Code. ......................................City .................................................Country...............................................
Yearly subscription price: Europe 40 Euro, Other Countries 40 Euro. Payment delivered to Banca Română de Dezvoltare (BRD)
Calderon Branch, Account RO38BRDE410SV18417414100 (SWIFT BIC: BRDEROBU).
Summary „Ingineria automobilului“ No. 30 (vol. 8, no. 1)3 RIA – We Remain on the Outside or we Refresh the IA Magazine?5 Interview with Mr. Jérôme OLIVE General Manager of Group Renault Romania7 Independent Component Analysis Applied to Combustion Images in Transparent Engines12 The Air Filtering Technologies for Motor Vehicles’ Internal Combustion Engines
17 Advanced Computer Simulation Methods of C.I. Engines Processes. Surrogate Models22 Some Aproximation Methods Used to Model An Engine Torque Map24 Researches regarding performance improvement of a pressure wave supercharger
Torq
ue [N
m]
Type A (14°)Standard (21°) Type B (7°)

Politehnica University of Bucharest (UPB) through Automotive Engineering Department has a fruitful collaboration with Technical University of Ingolstadt (THI), Germany.
During the last two years, students from Romania participated at the International Summer Schools in Ingolstadt. Romanian students’ participation is very important in terms of European technological evolution and changing ideas
in order to improve the educational level, the innovation and the competitiveness of the automotive industry.For two weeks every year in July and August, eight-ten students from the Automotive Engineering Department
attended and graduated from the International Summer School organized by Technical University of Ingolstadt.
The Romanian students were coordinated by Mr. Valerian Croitorescu, PhD - university assistant professor of Automotive Engineering Department from UPB (he is also associate lecturer at THI and contact person for international cooperation between the two universities).
The opportunities and the support for the students to take part in international projects (such as the International Summer School at THI, developing diploma projects and dissertation projects, following Master programs at university from abroad) are offered via the portal web AutoJobs Romania (autojobs.ro). The goal of the web portal Autojobs Romania consists in helping the students to find suitable employment after graduation.
After a short discussion with Mr. Croitorescu, he showed his satisfaction and enthusiasm for how things went during 2013 International Summer School:
“I am honored that we all had the possibility to integrate and to develop our ideas as part of the 53 international students’ team, almost double than the last year team. The team consisted in students from 11 different countries, including Brazil, Poland, China, India, Spain and Romania. We took part at different lectures, debating challenging topics in automotive technology, management and production. We participated at different working visits, including EDAG, EADS/Cassidian and Audi. During Audi Ingolstadt factory tour and Audi A1 production line, all the Romanian students showed a great interest in how a vehicle is made and they were willing to follow the summer practice there. They wanted to visit more of the factory sectors, but the time was limited. Visiting Audi Museum in Ingolstadt and BMW Museum in Munchen represented a challenge for all the participants and for sure, they are now more ambitious and more willing to take part in the vehicles developing processes. This moment in our life is very important; we have the opportunity to travel abroad and to participate at international research project. It is necessary to improve students’ mobility, technical and cultural exchanges. We have to support all enthusiasts that are willing to take part in exchange programs and to make contacts with universities from abroad. The industry, the higher education and the students benefit from the International Summer Schools in terms of vehicles development and we have to promote this kind of activities.”
For the next years, the partnership between Politehnica University of Bucharest and Technical University of Ingolstadt aims developing joint projects.
We wish them good luck and we are waiting to receive news about their projects!
Autojobs Romania supported the Romanian team at the 2013 International Summer School Ingolstadt – ©autojobs.ro
Politehnica University of Bucharest and Technical University of IngolstadtPartnership in Automotive Engineering Domain

auto test 3eISSN 2284-5690 • pISSN 1842-4074