hydrologic & hydrodynamic modeling - uf/ifas oci · hydrodynamic modeling hydrologic &...
TRANSCRIPT

Hydrologic & Hydrodynamic Modeling
Hydrologic & Hydrodynamic Modeling
Shabbir Ahmed ,CORPS Miao-Li Chang, SFWMDVic Engel, ENP Laura Kuebler, SFWMDChristian Langevin, USGS Jayantha Obeysekera, SFWMDEric Swain, USGS Yongshan Wan, SFWMD

Restoration FocusRestoration Focus

Peat Thickness ComparisonNatural System and Current System
Peat Thickness ComparisonNatural System and Current System
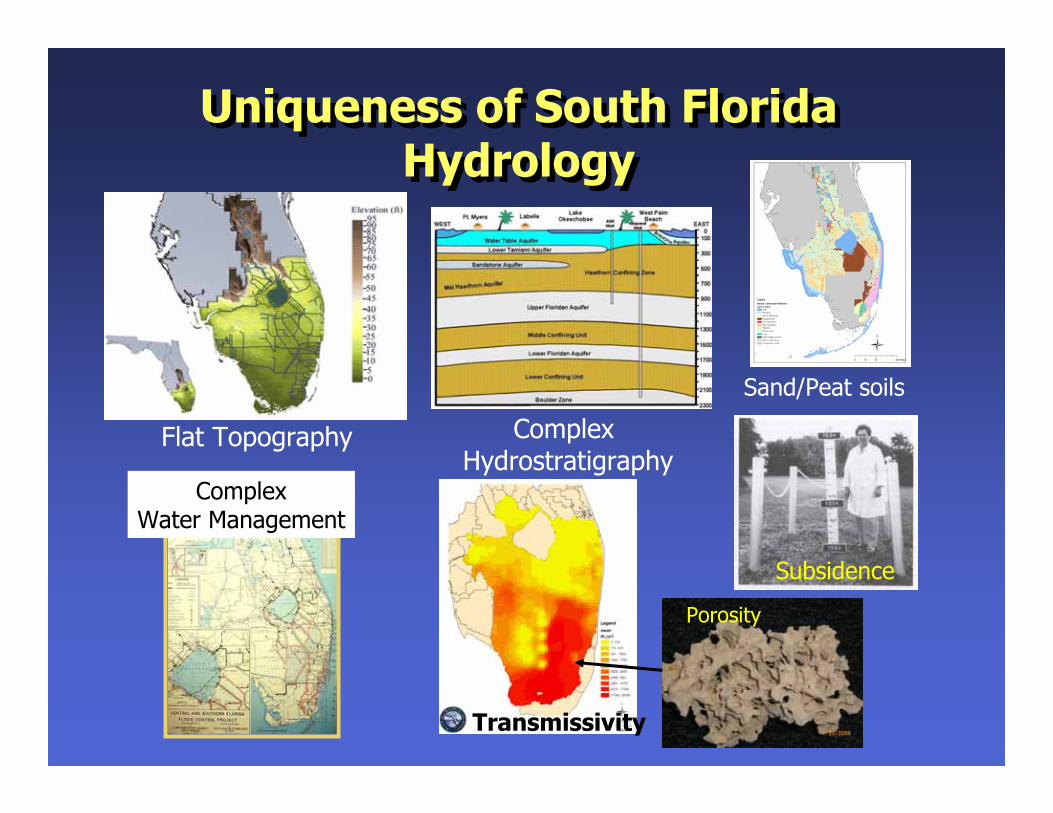
Uniqueness of South Florida Hydrology
Uniqueness of South Florida Hydrology
Flat Topography Complex Hydrostratigraphy
Sand/Peat soils
Subsidence
Porosity
Transmissivity
ComplexWater Management

Role of Models in RestorationRole of Models in Restoration
A tool (not a substitute for decision making) for
Planning and implementation of restoration alternatives (“Getting Water Right”)
Regional, Subregional and Project-scales (design)Impacts on other users: water supply & agricultural
Operational PlanningEvent, seasonal, multi-seasonal
RegulationWater Reservations, Minimum Flows and Levels, Compliance Monitoring

Regional & Subregional Simulation Models
Regional & Subregional Simulation Models
NSRSM
NSM
SFWMM
“Regional (system-wide” “Subregional-gw”
SJWMD
SWFWMD
SFWMD
Model Locations (as of 3/27/07)
LKBGW
ECFT
LWC SAS
LWCF
LECsR
East Central FloridaTransient Model
Lower Kissimmee BasinGround Water Model
LECsR
Lower West Coast Floridian Model
Lower East CoastsubRegional Model
LowerKissimmee
ECFT
LWC Floridan
Water Supply Planning Department High Resolution
subRegional Models
LoxahatcheeWatershed RSM
East Coast FloridanAquifer System Model
Lower West CoastSurfical Aquifer System
EC FLA 0 9 18 27 364.5Miles
LWC SAS
EC FLA
LECs
R

Decade of the 70sDecade of the 70s
[analog model]
Electric Analog ModelSimulated water levels and flows in coastal region
Upgraded Regional Routing Model to include daily time stepInitial development of SFWMM (2x2)- a regional-scale computer simulation model
Electric Analog ModelSimulated water levels and flows in coastal region
Upgraded Regional Routing Model to include daily time stepInitial development of SFWMM (2x2)- a regional-scale computer simulation model
Analog ModelAnalog ModelAnalog Model

Decades of the 1980s
Physical Modeling at UC-Berkeley
Decades of the 1980s
Physical Modeling at UC-Berkeley
Real System
Model

Integrated surface water groundwater modelRegional-scale 3.2 x 3.2 km, daily time stepMajor components of hydrologic cycleOverland and groundwater flowCanal and levee seepageOperations of C&SF systemWater shortage policiesExtensive performance measuresProvides input and boundary conditions for other models
South Florida Water Management Model (SFWMM)
South Florida Water Management Model (SFWMM)
www.sfwmd.gov/org/pld/hsm/models

CERP Plan EvaluationCERP Plan Evaluation
2050
Planning Horizon
1965
2005
Periodused formodeling
Assumption: 1965-2000 period used for modeling is representative of the climate expected during the future planning horizon (“Stationarity”)
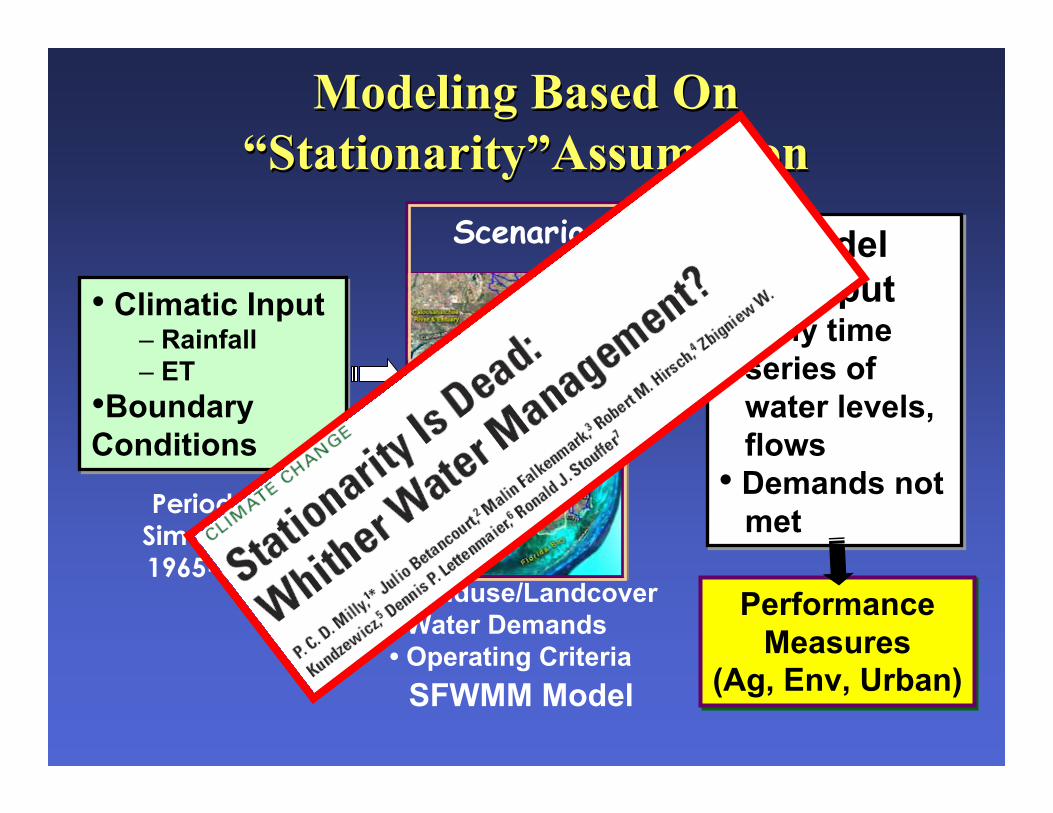
Modeling Based On “Stationarity”Assumption
Modeling Based On “Stationarity”Assumption
SFWMM Model
Model Output
• Daily time series of water levels, flows
• Demands not met
Model Output
• Daily time series of water levels, flows
• Demands not met
• Landuse/Landcover• Water Demands• Operating Criteria
• Climatic Input– Rainfall– ET
•Boundary Conditions
• Climatic Input– Rainfall– ET
•Boundary Conditions
Period ofSimulation1965-2000
PerformanceMeasures
(Ag, Env, Urban)
PerformanceMeasures
(Ag, Env, Urban)
Scenario

Hydrologic Performance Measureswww.sfwmd.gov/org/pld/restudy/hpm

Lake Okeechobee Monthly Position Analysis
Middle 50%

Subregional ModelingSubregional Modeling

Model ScalesModel Scales

LECsR Model AbilitiesLECsR Model Abilities
Manage Groundwater ConditionsMinimize Water Shortage RestrictionsEvaluate Wetland HydropatternsExamine Underground BarriersImprove Surface Water OperationsProvide boundary conditions to local-scale models
Manage Groundwater ConditionsMinimize Water Shortage RestrictionsEvaluate Wetland HydropatternsExamine Underground BarriersImprove Surface Water OperationsProvide boundary conditions to local-scale models

Model Code and PackagesModel Code and PackagesIn MODFLOW and SEAWAT (USGS)Add-on packages
Wetland: SW-GW interactionDiversion: OperationsReinjection Drainflow: OperationsTrigger: Water restrictionsUGEN: Utility Multibud: Budget
In MODFLOW and SEAWAT (USGS)Add-on packages
Wetland: SW-GW interactionDiversion: OperationsReinjection Drainflow: OperationsTrigger: Water restrictionsUGEN: Utility Multibud: Budget

LECsR Model LimitationsLECsR Model Limitations
Uncoupled unsaturated and saturated zones (in non-WTL areas)Limited routing capabilitiesNo density-dependence
Uncoupled unsaturated and saturated zones (in non-WTL areas)Limited routing capabilitiesNo density-dependence

L-31 N (L-30) Seepage Management Pilot Project
L-31 N (L-30) Seepage Management Pilot Project
S-335
1,000
ft
Project Footprint
L-30 Levee & Canal
To investigate seepage To investigate seepage management technologies management technologies by controlling wet season by controlling wet season seepage while minimizing seepage while minimizing impacts to existing legal impacts to existing legal users and the environmentusers and the environment
Modeled (using Modeled (using FEMWATER) a 1,000FEMWATER) a 1,000--ft ft seepage control barrier seepage control barrier along with a 100along with a 100--ft wide ft wide window including window including injectioninjection--extraction wellsextraction wells

Barrier, window, two extraction wells (red) @ 3 cfs and three injection wells (blue) @ 2 cfs in FEMWATER finite element meshBarrier, window, two extraction wells (red) @ 3 cfs and three
injection wells (blue) @ 2 cfs in FEMWATER finite element mesh
Barrier
Window

Simulated Pathlines and VelocitiesSimulated Pathlines and Velocities
Pathlines showing the Pathlines showing the effects of barrier, effects of barrier, window, and extractionwindow, and extraction--injection wells.injection wells.
Red represents high Red represents high velocity and blue velocity and blue represents low velocity represents low velocity for extractionfor extraction--injection injection wells. Injection wells are wells. Injection wells are able to block flow able to block flow through the window through the window opening.opening.
Layer 5
Velo
city
M
agni
tud
e, ft
/d

USGS Modeling FocusUSGS Modeling Focus
Characterize the interaction between marine and terrestrial waters.Develop computer programs that simulate flows and salinities in coastal wetlands and aquifers.Apply these programs to evaluate the effects of ecosystem restoration, population growth, sea-level rise, and management practices in South Florida.
Characterize the interaction between marine and terrestrial waters.Develop computer programs that simulate flows and salinities in coastal wetlands and aquifers.Apply these programs to evaluate the effects of ecosystem restoration, population growth, sea-level rise, and management practices in South Florida.

USGS models in South FloridaUSGS models in South Florida

MODEL APPLICATIONSMODEL APPLICATIONSMODEL ISSUE ADDRESSED
TIME Coastal flow and salinity changes due to Everglades restoration
TTI Potential changes in temperature and salinity conditions in manatee refugia
Biscayne Response of Biscayne Bay hydrology to proposed water-management changes
Pompano Intrusion Causes of saltwater intrusion near a municipal well field
Deep Well Injection Fate and transport of injected wastewater in the Floridan aquifer
Northwest Well Field Effects of turbulent flow conditions in close proximity to pumping wells

South Florida Estuaries/BaysSouth Florida Estuaries/Bays
Southern Indian River Lagoon/St. Lucie River & EstuaryLoxahatchee RiverLake Worth LagoonBiscayne Bay Florida BayNaples BayEstero BayCaloosahatchee RiverSouthern Charlotte Harbor
Southern Indian River Lagoon/St. Lucie River & EstuaryLoxahatchee RiverLake Worth LagoonBiscayne Bay Florida BayNaples BayEstero BayCaloosahatchee RiverSouthern Charlotte Harbor

Watershed/Groundwater ModelHydrology (Surface flow, TSS)/
Hydrodynamic/sediment transport ModelVelocity, Diffusion, Surface Elevation,Salinity, Temperature
WQ/Toxic ModelTemperature, Salinity, TSS, Algae, Carbon, Nitrogen, Phosphorus, COD, DO, Silica, toxics
Watershed/Groundwater Modelnutrients, sediments, toxics
Sediment Diagenesis ModelSediment initial condition, Sediment settling rate
Point Source and other loads
WQ predictionsEcological ModelSeagrass, oyster, VECs
WATERSEHD ESTUARY ECOSYSTEM
Integrated Modeling Framework
Integrated Modeling Framework

ApplicationApplicationWater Quantity - Caloosahatchee MFLsWater Quantity - Caloosahatchee MFLs
Fish Trap Bay
05
101520253035
1/1/03 4/1/03 6/30/03 9/28/03 12/27/03 3/26/04 6/24/04 9/22/04 12/21/04
Ch3d Monitoring data
Hydrodynamic Model-CH3D
Flow and Salinity
Watershed inputs
Salinity tolerance:The response of the VECs to salinity in the estuary is examined to determine the flow quantity

ApplicationApplicationNW Fork of Loxahatchee River RestorationNW Fork of Loxahatchee River Restoration
Hydrodynamic/Salinity Model-2D RMA
Short term influences in tributary inflow and tide
Watershed hydrological model-WaSh
Predicting daily salinity in the
estuary
Long-term salinitymanagement model-LSMM model
Salinity tolerance:The response of the VECs to salinity in the estuary is examined to determine the flow quantity

ApplicationApplicationLoad Reductions -St. Lucie River and EstuaryLoad Reductions -St. Lucie River and Estuary
Hydrodynamic Model – CH3D
Watershed inputs
Point sources
Non-Point sources
Water Quality Model
0
2
4
6
8
10
12
1 2 3 4 5 6 7 8
Time
DO
(mg/
L)
Current Standard after pollution reduction
Watershed Model-WaSh Estuary Models Water Quality
Targets/Standards

Next Generation Regional Tool:Regional Simulation Model
Next Generation Regional Tool:Regional Simulation Model

RSM Design ConsiderationsRSM Design ConsiderationsRegional in nature – simplifications may be neededReproduce the functionality of the legacy code SFWMM (daily, continuous simulation for planning applications)Reasonable run timesImproved process and solution algorithms, use of advances in computer technology including programming languages, GIS and databasesBetter resolution than SFWMM in areas where it is neededEliminate or minimize “hard coding” of simulation alternatives
Regional in nature – simplifications may be neededReproduce the functionality of the legacy code SFWMM (daily, continuous simulation for planning applications)Reasonable run timesImproved process and solution algorithms, use of advances in computer technology including programming languages, GIS and databasesBetter resolution than SFWMM in areas where it is neededEliminate or minimize “hard coding” of simulation alternatives

RSMRSM
Hydrologic SimulationEngine (HSE)
Management SimulationEngine (MSE)
RSM Engines
South Florida Regional Simulation ModelSFRSM
• Model physical setup• Simulate hydrologic processes
• Overland flow• Groundwater flow• Canal network • Calibration/validation of model parameters
• Use observed structure flows
• Simulate structure operations
• Implementation of operational rules
• Flood control rules• Water supply policies• Maintain minimum flows & levels
• Regional operational coordination

Hydrologic Process ModulesHydrologic Process Modules
System of integrated waterbodies
Wat
er
Supp
ly
Rec
harg
e
Run
off
ETRain
homecell
rechargerunoff
ETRain
Water supply
homecell
Simple landscape Complex landscape

Diffusive Wave FormulationDiffusive Wave Formulation
Mass Balance
Momentum EquationWaterbodyWaterbody WatermoverWatermover
⎟⎟⎠
⎞⎜⎜⎝
⎛−−
=byy
bxx
ghSghS
Fτρτρ
*For diffusive formulation, neglect all the inertia terms in RHS

Watermover to Sparse Matrix Interaction
Watermover to Sparse Matrix Interaction
Simultaneous solution
surface / groundwater
canal networkInteractions
Watermovers’submatrices fall into place in overall matrix
All components of the system are coupled
Simultaneous solution
surface / groundwater
canal networkInteractions
Watermovers’submatrices fall into place in overall matrix
All components of the system are coupled
x x xx x x xx x xx x xx x x
x x x xx x x
x x x xx x
x xx x xx x xx x xx x xx x
3 4
LegendSn - segment M - stiffness matrixEn - cell H - head vector hn - head in cell & segment Q - flow vectorkc - segment hydraulic conductivity x - 2D & 1D network matrix markersksw - surface water conductivity - mesh-network interaction matrix markers
kgw - ground water conductivity
S5 S6qE1qE2qE3qE4qE5qE6qE7qE8qE9qS1qS2qS3qS4qS5qS6
hE1hE2hE3hE4hE5hE6hE7hE8hE9hS1hS2hS3hS4hS5hS6
hp6 kc-hp5 kc-hp6 kchp5 kc
2
1
3
45
67
8
9
S3S4
S5
S1
S6
S2
wall flow
junction flow
“M” “H” “Q”
X =
Network
Mesh
mesh-
netw
ork
inter
actio
n
mesh-network
interaction
-hE3ksw hE3ksw hE4ksw -hE4ksw
-hE3kgw hE3kgw hE4kgw -hE4kgw
Surface water flow Groundwater flow
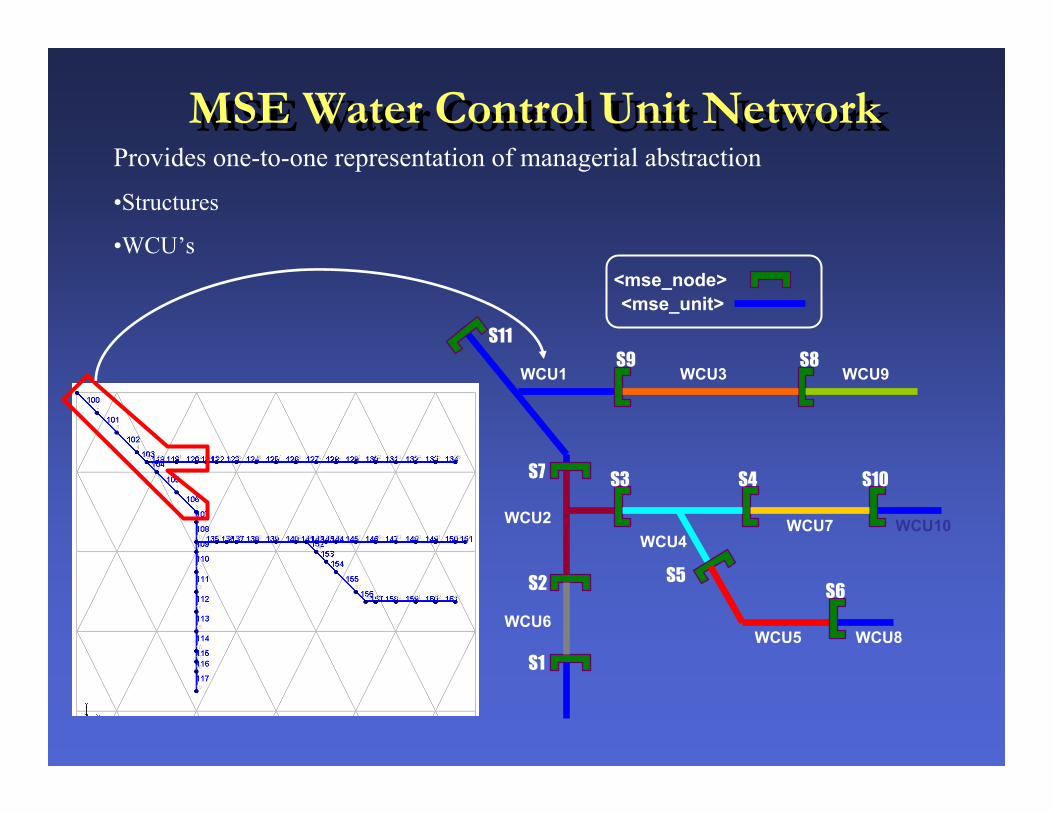
MSE Water Control Unit NetworkMSE Water Control Unit Network
S11S9 S8
S7
S2
S1
S10S4S3
S6S5
WCU1
WCU8
WCU3 WCU9
WCU2
WCU6
WCU4WCU7 WCU10
WCU5
<mse_unit><mse_node>
Provides one-to-one representation of managerial abstraction
•Structures
•WCU’s

Integration of Management Database with Hydrologic Model
Integration of Management Database with Hydrologic Model
f(Σ)
S1
S2 S3
S4
S8
S7S6S5
S10S9
WCU1
WCU8
WCU3 WCU9
WCU2
WCU6
WCU4WCU7 WCU10
WCU5
<mse_unit><mse_node>
Assessor
State Σ
HydrologicSimulationEngine
ManagementSimulationEngine
MSE Network
Control
Δ (χ, μ)
Consolidated Synoptic
State Information
Management Constraints &
Objectives
Assessed State

Glades-LECSA Model DomainGlades-LECSA Model Domain

Lattice Boltzmann Modeling Lattice Boltzmann Modeling
Microscopic (particle) approach to model macroscopic dynamics
Adapted to solve Navier-Stokes Equations
Application (Variano et. al 2008?)
Microscopic (particle) approach to model macroscopic dynamics
Adapted to solve Navier-Stokes Equations
Application (Variano et. al 2008?)
Ridge & Sloughimage Bitmap LBM results

Questions!Questions!