hydrologic and hydrodynamic modeling of the skagit river ... · skagit river estuary ......
TRANSCRIPT

Hydrologic and Hydrodynamic Modeling of the Skagit River Estuary - Rawlins Road Restoration Feasibility Study Zhaoqing Yang Tarang Khangaonkar October 2006 Prepared for Skagit Watershed Council Battelle—Pacific Northwest Division Richland, Washington 99352
PNWD-3692

LEGAL NOTICE This report was prepared by Battelle Memorial Institute (Battelle) as an account of sponsored research activities. Neither Client nor Battelle nor any person acting on behalf of either: MAKES ANY WARRANTY OR REPRESENTATION, EXPRESS OR IMPLIED, with respect to the accuracy, completeness, or usefulness of the information contained in this report, or that the use of any information, apparatus, process, or composition disclosed in this report may not infringe privately owned rights; or Assumes any liabilities with respect to the use of, or for damages resulting from the use of, any information, apparatus, process, or composition disclosed in this report. Reference herein to any specific commercial product, process, or service by trade name, trademark, manufacturer, or otherwise, does not necessarily constitute or imply its endorsement, recommendation, or favoring by Battelle. The views and opinions of authors expressed herein do not necessarily state or reflect those of Battelle.
This document was printed on recycled paper.


Hydrologic and Hydrodynamic Modeling of Skagit River Estuary - Rawlins Road Restoration Feasibility Study Zhaoqing Yang Tarang Khangaonkar October 2006 Prepared for Skagit Watershed Council Battelle—Pacific Northwest Division Richland, Washington 9935
PNWD-3692

iii
Executive Summary
The Skagit Watershed Council (SWC) initiated the Rawlins Road Restoration Feasibility Study to evaluate the potential for improving habitat for migrating salmonids along the bayfront region of the Skagit River delta. The bayfront region of interest includes the mudflats and marsh habitat located adjacent to the dike on the seaward side. Fir Island is the region of the Skagit River delta enclosed inside a long perimeter dike that was constructed nearly 150 years ago for agriculture and flood protection. Historically, the Skagit River delta has provided rich estuarine and freshwater habit for salmon and other fish and wildlife. However, construction of the perimeter dike around the delta isolated Fir Island between the North and South Forks of the Skagit River and eliminated the pathways of freshwater and natural sediment to the mudflats and tidal marsh areas.
In a collaborative effort between the affected parties represented by the Western Washington Agricultural Association and the project sponsors including the Washington Department of Fish and Wildlife, Seattle City Light, and Skagit River System Cooperative in a technical advisory role, SWC selected the northwest corner of Fir Island as the target of this feasibility study. The region north of Browns Slough and around Rawlins Road tide gate became the focus of the Rawlins Road Restoration Feasibility Study. The expectation was that restoration alternatives in this region would have minimum impact on the agricultural lands, allow repair of the leaking tide gates, and provide additional benefit of improved drainage along with restoration of habitat.
Battelle’s Marine Sciences Laboratory (Battelle) conducted a hydrologic and hydrodynamic assessment in support of SWC’s efforts to evaluate the feasibility of achieving restoration goals through modifications of the Fir Island dike near the Rawlins Road project site at the northwest corner of the delta. The study had four major goals that included restoring marsh habitat, improving salinity conditions in the nearshore habitat, increasing conveyance and passage, and minimizing impact on current land use. In addition, the project team saw this as an opportunity to improve drainage conditions in the farmland interior of the Fir Island dikes.
Battelle developed predictive numerical models for the Skagit River estuary, Skagit Bay and the Fir Island watershed associated with the Rawlins Road study area. The hydrodynamic model was constructed using the Finite Volume Coastal Ocean Model (FVCOM) developed by the University of Massachusetts. The hydrodynamic model was driven by a combination of tides, freshwater discharge, and surface-wind stresses. The model was set up using observed tide, current, and salinity data collected for this study for a period of 14 days. The hydrologic models included the U.S Army Corps of Engineers HEC-HMS model to provide runoff from rainfall and the UNET model, which routed flows in the agricultural drainage canals interior to the Fir Island dikes. Both models were calibrated to data collected in the summer of 2005. The models were then applied for five different alternatives that looked at cross-island diversions, breaches, and dike removals near the Rawlins Road study area.
Specific restoration alternatives that were evaluated as part of this study are as follows.
• Alternative 1: Creating a diversion/channel at the northwest corner of Fir Island along the existing dike to connect the North Fork of the Skagit River to Skagit Bay.

iv
• Alternative 2: Reconnecting the North Fork of the Skagit River through a diversion channel to Skagit Bay along the existing Hall Slough channel through a tide gate.
• Alternative 3: Constructing a dike setback at the northwest corner of Fir Island to provide more tidal marsh area for salmon habitat.
• Alternative 4: Constructing a natural opening of channel near the mouth of the North Fork of the Skagit River to investigate the effect of channel modification on nearshore salinity distribution.
• Alternative 5: Reconnecting the North Fork through a diversion to Skagit Bay along the existing Browns Slough Channel by breaching the existing dike at the North Fork end.
A complete relative comparison of the effectiveness of these alternatives has not been performed. Qualitative assessment of the results indicates that it is feasible to improve salinities and conveyance along the bayfront of the Fir Island dike by making modifications to the North Fork branch of the Skagit River. In its current state, the North Fork of the Skagit River is constrained on either side by dikes that direct the flow of freshwater away from the target habitat in the bayfront region. Diversions and dike modifications showed considerable potential for the water to be re-directed towards the bayfront for restoration of the marsh habitat.
Alternatives 1 and 4 address modifications outside the dike. While these alternatives would cause minimal impacts to land owners, their locations are at the northwest corner of Fir Island, and the beneficial effects would likely not reach the middle part of the Fir Island bayfront.
Alternatives 2 and 5 are based on the concept of constructing channels that would convey freshwater and nutrients from the North Fork to the bayfront region. The model simulations indicate very promising results with these for reducing salinity and providing conveyance for migrating fish. Also, these alternatives provide flexibility in the placement of the outlet along the bayfront dike.
Alternative 3 involves a dike setback and reducing the existing Fir Island dike section to grade. This would produce a significant change in the hydrodynamic behavior of the system. While it appears to provide the greatest restoration benefit in terms of volume of freshwater conveyed from the North Fork, it caused reduced velocities downstream of the dike set back. Flows in the South Fork were also reduced due to increased flow being drawn through the North Fork.
The study also showed that drainage issues currently faced by the Fir Island agricultural community could be addressed effectively as part of the restoration efforts through modifications, repair, maintenance of canals, and hydraulic structures that control the routing and distribution of flows in the system.

v
Acronyms
CTD Conductivity-Temperature-Depth DEM Digital Elevation Model FVCOM Finite Volume Coastal Ocean Model GPS global positioning system LIDAR Light Detection and Ranging MLLW mean lower low water MSL mean sea level NOAA National Oceanic and Atmospheric Administration RM river mile SRSC Skagit River System Cooperative SWC Skagit Watershed Council USGS United States Geological Survey UW University of Washington WDFW Washington Department of Fish and Wildlife WSE water surface elevation


vii
Contents
Executive Summary ............................................................................................................................... iii Acronyms............................................................................................................................................... v 1.0 Introduction ................................................................................................................................... 1-1 1.1 Background ........................................................................................................................... 1-1 1.2 Study Area............................................................................................................................. 1-2 1.3 Study Objectives and Approach............................................................................................ 1-2 2.0 Review of Available Data.............................................................................................................. 2-1 2.1 Introduction ........................................................................................................................... 2-1 2.2 Bathymetry Data ................................................................................................................... 2-1 2.3 Skagit River Inflow Data....................................................................................................... 2-4 2.4 Wind Data and Tide Data...................................................................................................... 2-4 2.5 Field Data Collection ............................................................................................................ 2-4 2.5.1 Oceanographic Data ................................................................................................... 2-4 2.5.2 Hydrologic and Geometry Survey Data ..................................................................... 2-9 3.0 Interior Hydraulic and Hydrologic Model Setup and Calibration ................................................. 3-1 3.1 Introduction ........................................................................................................................... 3-1 3.2 Modeling Approach............................................................................................................... 3-1 3.3 Interior Hydraulic Model UNET Setup................................................................................. 3-3 3.3.1 UNET Model Assumptions ........................................................................................ 3-3 3.3.2 Model Geometry and Input Parameters...................................................................... 3-4 3.4 Model Calibration Results..................................................................................................... 3-5 4.0 Skagit Bay Hydrodynamic Model Setup and Calibration ............................................................. 4-1 4.1 Introduction ........................................................................................................................... 4-1 4.2 Model Setup .......................................................................................................................... 4-1 4.2.1 Model Description...................................................................................................... 4-1 4.2.2 Model Grid ................................................................................................................. 4-1 4.2.3 Model Boundary Condition........................................................................................ 4-3 4.3 Model Calibration Results..................................................................................................... 4-3 5.0 Model Application for Restoration Alternatives ........................................................................... 5-1 5.1 Introduction ........................................................................................................................... 5-1 5.2 Model Simulations for Restoration Alternatives................................................................... 5-2 5.2.1 Restoration Alternative 1- Diversion/channel at the Northwest Corner of
Fir Island .................................................................................................................... 5-2 5.2.2 Restoration Alternative 2 - Diversion Channel to Skagit Bay at Hall Slough ........... 5-2 5.2.3 Restoration Alternative 3 - Dike Setback at the Northwest Corner of Fir Island....... 5-11

viii
5.2.4 Restoration Alternative 4 - A Natural Channel near the River Mouth....................... 5-16 5.2.5 Restoration Alternative 5 - Diversion to Skagit Bay along Browns Slough .............. 5-23 6.0 Summary and Conclusions ............................................................................................................ 6-1 7.0 References ..................................................................................................................................... 7-1

ix
Figures
1-1 Study Area - Skagit River Estuary North Whidbey Basin, Puget Sound ................................... 1-3 2-1 Skagit Bay Study Area and Monitoring Stations........................................................................ 2-2 2-2 Skagit River Channel Cross-Section Data.................................................................................. 2-3 2-3 Skagit River Flow Time History at Mt. Vernon, WA ................................................................ 2-5 2-4 Wind Stick Plot at Paine Field near Everett, WA....................................................................... 2-6 2-5 Predicted Tides at the Skagit Bay Open Boundaries .................................................................. 2-7 2-6 Observed Tidal Elevations and Velocities at Skagit Bay Station............................................... 2-8 2-7 Observed Tidal Elevations and Velocities at North Fork Station............................................... 2-10 2-8 Observed Salinity Time History at Skagit Bay and North Fork Stations ................................... 2-11 2-9 Observed Temperature Time History at Skagit Bay and North Fork Stations ........................... 2-12 2-10 T-S Diagram at Skagit Bay Station ............................................................................................ 2-13 2-11 Observed Salinity Profiles at Skagit Bay and North Fork Stations ............................................ 2-14 2-12 Observed Temperature Profiles at Skagit Bay and North Fork Stations .................................... 2-15 2-13 Irrigation Channel Cross-Section Data....................................................................................... 2-17 2-14 Flow and Water Level Time Histories at Rawlins Road Tide Gate ........................................... 2-18 2-15 Flow and Water Level Time Histories at Browns Slough Culvert ............................................. 2-19 3-1 Drainage Network in Fir Island East of Browns Slough ............................................................ 3-2 3-2 Drainage System B Network ...................................................................................................... 3-6 3-3 UNET Model Calibration for Flow at Rawlins Road Tide Gate ................................................ 3-7 3-4 UNET Model Calibration for Water Level at Rawlins Road Tide Gate .................................... 3-8 4-1 FVCOM Model Grid for Skagit Bay.......................................................................................... 4-2 4-2 Hydrodynamic Model Bathymetry for Skagit Bay..................................................................... 4-4 4-3 Comparisons of Tidal Elevations and Velocities at Skagit Bay Station..................................... 4-5 4-4 Comparisons of Tidal Elevations and Velocities at North Fork Skagit River............................ 4-7 4-5 Comparisons of Salinities at Skagit Bay and North Fork Stations ............................................. 4-8 4-6 Comparisons of Salinity Profiles at Skagit Bay Station ............................................................. 4-9 4-7 Skagit Bay Velocity Distribution during Flood Tide ................................................................. 4-10 4-8 Skagit Bay Velocity Distribution during Ebb Tide .................................................................... 4-11 4-9 Surface Salinity Distribution at Flood ........................................................................................ 4-13 4-10 Surface Salinity Distribution at Ebb........................................................................................... 4-14 5-1 Alternative 1 – Diversion Channel at the Northwest Corner of Fir Island ................................. 5-3 5-2 Comparison of Bathymetric Contours – Existing Condition and Alternative 1 ......................... 5-4 5-3 Comparison of Surface Salinity and Velocity – Existing Condition and Alternative 1 ............. 5-5 5-4 Comparison of Velocity Time Histories – Existing Condition and Alternative 1...................... 5-6 5-5 Comparison of Salinity Time Histories – Existing Condition and Alternative 1 ....................... 5-7 5-6 Alternative 2 – Diversion Channel to Skagit Bay at Hall Slough .............................................. 5-9

x
5-7 Preliminary Concept of Diversion Structure at North Fork Skagit River for Alternative 2 ....... 5-10 5-8 Comparison of Water Surface Profile in Drainage System B .................................................... 5-12 5-9 Comparison of Surface Salinity and Velocity – Existing Condition and Alternative 2 ............. 5-13 5-10 Comparison of Salinity Time Histories – Existing Condition and Alternative 2 ....................... 5-14 5-11 Alternative 3 – Dike Setback at Northwest Corner of Fir Island................................................ 5-15 5-12 Modified Model Grid and Geometry – Alternative 3 ................................................................. 5-17 5-13 Comparison of Surface Salinity and Velocity – Existing Condition and Alternative 3 ............. 5-18 5-14 Comparison of Salinity Time Histories – Existing Condition and Alternative 3 ....................... 5-19 5-15 Alternative 4 – A Natural Channel near the River Mouth.......................................................... 5-20 5-16 Comparison of Surface Salinity and Velocity – Existing Condition and Alternative 4 ............. 5-21 5-17 Comparison of Salinity Time Histories – Existing Condition and Alternative 4 ....................... 5-22 5-18 Alternative 5 – Diversion to Skagit Bay along Browns Slough ................................................. 5-24 5-19 Comparison of Surface Salinity and Velocity – Existing Condition and Alternative 5 ............. 5-25 5-20 Comparison of Salinity Time Histories – Existing Condition and Alternative 5 ....................... 5-26
Tables
5-1 Principal Dimensions of the Proposed Alternative 2 Diversion Channel................................... 5-8 5-2 Preliminary Design Parameters for the North Fork Diversion Structure.................................... 5-8

1-1
1.0 Introduction
1.1 Background
The Skagit River is the largest river to enter the Puget Sound system. It is known to contribute a large fraction of the total sediment and freshwater loading to Puget Sound. Historically, the Skagit River delta has provided rich estuarine and freshwater habit for salmon and other fish and wildlife. However, over the past 150 years, economic development in the Skagit River estuary delta region has resulted in significant losses of wildlife habitat, particularly due to dike construction. The construction of dikes in the Fir Island region inside the estuarine delta has disconnected and isolated the pathways of freshwater and natural sediment to the mudflats and tidal marsh areas of Skagit Bay. The land enclosed within the Fir Island dikes has been used for agriculture over the last century and has subsided below mean sea level (MSL). This has resulted in reduced efficiency of drainage of agricultural canals and dikes and has directly impeded fish passages through the area. A number of opportunities therefore exist in the Skagit River delta for restoring estuarine functions and tidal marsh habitat while improving drainage conditions in the agricultural areas.
Under the direction of the Skagit Watershed Council (SWC), several studies of Fir Island have recently been completed including Browns Hall Slough Restoration Feasibility study (PWA 2000), An Assessment of Potential Habitat Restoration Pathways for Fir Island, Washington (PWA 2004), and others. These studies identified several potential restoration pathways that could result in significant increases in habitats preferred by juvenile salmon. Subsequently, through a grant from the Salmon Recovery Fund Board, SWC initiated the North Fork Feasibility Study for evaluating restoration alternatives along the North Fork of the Skagit River. The purpose of the feasibility study was to develop a range of conceptual alternatives from no action to comprehensive restoration, evaluate effectiveness, costs, and initiate a process for design and implementation of the selected alternative depending on the willingness of the landowners and affected parties.
The affected parties represented by Western Washington Agricultural Association and the project sponsors including the Washington Department of Fish and Wildlife (WDFW) and Seattle City Light, in collaboration with the Skagit River System Cooperative (SRSC) in a technical advisory role, selected the northwest corner of Fir Island as the target of the feasibility evaluation. The focus was on the region north of Browns Slough and around the Rawlins Road tide gate. The expectation was that restoration alternatives in this region would have minimum impact on the agricultural lands, allow repair of the leaking tide gate, and provide the additional benefit of improved drainage along with restoration of habitat. The project was then titled the Rawlins Road Restoration Feasibility Study.
SWC contracted with Battelle’s Marine Sciences Laboratory to conduct the necessary hydrologic and hydrodynamic analysis of the study area, help select and develop conceptual designs of the proposed restoration alternatives, and evaluate the effectiveness and impact with respect to restoration goals. This report presents a review of the information, collection of the data, hydrologic and hydrodynamic model development, and analysis of alternatives that were considered as part of the Rawlins Road restoration study.

1-2
1.2 Study Area
The Skagit River estuary and Skagit Bay are located in the north end of Whidbey Basin of the Puget Sound estuarine system (Figure 1-1). Skagit Bay connects to Saratoga Passage at the south, which leads to the Puget Sound Main Basin through Possession Sound. Skagit Bay connects to the Strait of Juan de Fuca through Deception Pass at the north end of the Whidbey Basin. The Skagit River is the largest river in the Puget Sound estuarine system. It discharges nearly 39% of total sediment and more than 20% of the freshwater into Puget Sound (Downing 1983). The Skagit River delta is a complex estuarine system, which is bounded by the North Fork of the Skagit River, Skagit Bay, and the South Fork of the Skagit River. A large tidal mudflat area exists at the mouth of the estuary, and most of the northeastern region of the bay is above the Mean Lower Low Water (MLLW) line. The mainstem of the Skagit River splits into the North Fork and South Fork, which branches at river mile 9.5 near Mt. Vernon, Washington. The flow through these two branches is tidally influenced. The tidal influence extends 15 miles upstream of Mount Vernon. At low tide, roughly one-third of the river flow passes through the South Fork, and two-thirds in the North Fork (Pickett 1997); however, this is a function of river flow and the flow may be more evenly split during the low-flow season. The deepest region in the bay is about 30 m below Mean Sea Level (MSL) near the southern entrance of the bay. A deep channel exists along the Whidbey Island shoreline of Skagit Bay, which extends north towards Deception Pass. Skagit Bay is subjected to tides from Puget Sound, primarily propagating from the south. Density-induced currents are also important in Skagit Bay due to salinity stratification and a strong freshwater front produced by Skagit River flow.
1.3 Study Objectives and Approach
The overall objectives of the Rawlins Road Restoration project, aligned with the restoration goals (in italics) applicable to the entire Fir Island delta, are as follows.
1. Increase Productivity of Chinook Salmon Rearing Habitat: Fir island forms a transitional zone between freshwater rearing and spawning and the saline water environment of Puget Sound. The nearshore waters seaward of the dikes are considerably more saline than historic dike-free conditions. Restore supply of freshwater from North Fork to provide brackish salinity for the emergent tidal marsh, scrub-shrub marsh and forested wetlands.
2. Expand Migratory Opportunity between Skagit and Nearshore Marsh Habitats: Distributory channels, which play several key roles in the life cycle of salmonids, also provide connection between the main forks of the Skagit River and near-shore emergent marsh habitat. This connection was eliminated with the construction of the dikes. Provide direct conveyance between the North Fork and the nearshore region west of the Fir Island dike.
3. Restore Landscape-Scale Ecological Processes on Fir Island: The health of a coastal marshland habitat is dependent upon an adequate supply of sediment and nutrients, which was eliminated with construction of the dikes. Restore nutrient and sediment supply by providing conveyance, required freshwater velocity, and tidal energy for transport.
4. Minimize Impact on Current Land Use: Approximately 7,600 acres of Fir Island are currently being used for agriculture. Restoration alternatives must minimize impacts to the local community. Select restoration alternative, which provides mutual benefits in terms of improving drainage infrastructure and minimizing maintenance in exchange for restoring some of the lost physical processes to the island.

1-3
FIGURE 1-1 Study Area - Skagit River Estuary
North Whidbey Basin, Puget Sound
Skagit Watershed Council Mount Vernon, WA
Skagit Bay
Crescent Harbor
Saratoga Passage
Deception Pass
Swinomish Channel
Skagit River
North Fork
South Fork
Strait of Juan De Fuca
Washington Port Susan Bay
Goat Island
Whidbey Island
Camano Island
Note: • Data Source: Topography of the Puget
Sound lowlands from University of Washington

1-4
In support of the goals listed above for the Rawlins Road Feasibility Study, Battelle recommended an approach of developing two separate models for the study area. A hydrologic/hydraulic model for the Fir Island interior region would be used to conduct rainfall runoff and conveyance in the drainage network of the agricultural lands up to the tide gates and pump stations to let the water out of the dikes. In the region outside the dikes, a hydrodynamic model would be used to predict hydrodynamics in the Skagit River estuary. The models would be calibrated over a two-week period using synoptic oceanographic data collected specifically for calibration. The models would then be applied to evaluate the impacts and estuarine response to the proposed alternatives.
The objective of the Hydrologic and Hydrodynamic Modeling Study for this project is to evaluate the relative performance of the proposed alternatives in terms of a) improved conveyance of Skagit River freshwater and sediments to the tidal marsh lands, b) restoration of tidal functions (habitat) over an increased area, and c) improved drainage of runoff water from inside the dikes out to Skagit Bay, and d) impacts to existing land use.
The specific tasks of this study are as follows:
• Review available data required for the development of the hydrologic/hydraulic and hydrodynamic models and identify data gaps
• Conduct a field data collection program to obtain oceanographic and hydrologic data for model calibration
• Set up and calibrate the interior hydraulic model for the Rawlins Road area in the northwest corner of Fir Island
• Set up and calibrate the hydrodynamic model for the Skagit River estuary and Skagit Bay
• Apply the calibrated models to evaluate the performance of different restoration alternatives.
In this preliminary feasibility study, the performance of the alternatives was qualitatively addressed focusing mostly on the ability of the proposed modification to produce an improved supply of freshwater from the North Fork of the Skagit River to the Fir Island shoreline, thereby also improving salinity, conveyance, and associated supply of sediment and nutrients to help improve the tidal marshland habitat.

2-1
2.0 Review of Available Data
2.1 Introduction
In this section, the available existing data and field survey data collected as part of this study for development of the hydrologic and hydrodynamic model are reviewed. The data required for the hydrodynamic model setup and calibration include tides, currents, river flow, salinity, temperature, bathymetry, and meteorological information. The required data were obtained from two sources: publicly available data sources and a field survey specifically designed for this study.
River flow, bathymetry, wind, and some tide data were obtained from open data sources. The Skagit River flow, which brings freshwater to the bay, was obtained from the nearby United States Geological Survey (USGS) gauge. Wind data were obtained from a nearby National Oceanic and Atmospheric Administration (NOAA) National Weather Service site. Tides near the mouth of Skagit Bay were obtained using the XTIDE program based on NOAA’s National Oceanic Service algorithms. Bathymetry data for the model domain was obtained from the University of Washington’s (UW) Puget Sound Digital Elevation Model (DEM) and the U.S. Army Corps of Engineers, Seattle District.
Review of the data revealed a major data gap in that that synoptic time history data for velocity, tide, and salinity were not available but were needed for setup and calibration of the hydrodynamic model. Also, geometric information about the Fir Island interior channels was not available for constructing the hydrologic model. A 2-week data-collection program encompassing a complete neap-spring tidal period was conducted in the study area. This data-collection program covered a two week summer period from June 6 to 23, 2005. Currents, tidal elevation, salinity, and temperature time histories were collected. Salinity and temperature profiles were also collected during the deployment and retrieval of the instruments. WDFW staff conducted surveys of the Fir Island interior drainage channels and collected cross-section and hydraulic structure details.
2.2 Bathymetry Data
Bathymetry data in the Skagit Bay region were obtained from the UW Puget Sound Digital Elevation Model. The data have 30 ft by 30 ft spatial resolution. Figure 2-1 shows the entire Skagit Bay and the lower Skagit River region along with bathymetry and locations of the monitoring stations. The UW elevation data were referenced to the North American Vertical Datum of 1988 (NAVD 88). In the study area, MSL is about 1.35 m above the NAVD 88 datum, and the corresponding MLLW level is about 0.50 m below the NAVD 88 datum. All bathymetry data used in the model were converted to MSL data prior to use in the model development. Skagit Bay is very shallow in most of the region of interest, and a large inter-tidal zone exists along the coastline of the Skagit River delta. A deep channel exists along the west side of Skagit Bay (Whidbey Island shoreline) and extends north connecting to the Strait of Juan de Fuca through Deception Pass. Lidar data in the mudflat area were provided by the Skagit River System Cooperative (SRSC) and USGS. Bathymetry data in the Swinomish Channel were obtained from U.S. Army Corps of Engineers (USACE). Channel cross-section data from the Skagit River Flood Damage Reduction Feasibility Study by USACE were used to define the river cross-sections in the river sections of the model (USACE August 2004). Available river cross-section data locations are indicated in Figure 2-2.

2-2
FIGURE 2-1
Skagit Bay Study Area and Monitoring Stations
Skagit Watershed Council Mount Vernon, WA
Skagit Bay
Vertical Datum: NAVD 88
Skagit River
Washington
Crescent Harbor
Swinomish Channel
Yokeko Point
North Fork
Note: • Data Source: Topography of the Puget Sound
Lowlands from University of Washington • Elevations are with reference to North
American Vertical Datum of 88 (NAVD 88). • Mean Lower Low Water (MLLW) = -1.64 ft
(NAVD 88). • Mean Sea Level (MSL) = 4.43 ft (NAVD 88).

2-3
FIGURE 2-2
Skagit River Channel Cross-Section Locations
Skagit Watershed Council Mount Vernon, WA
Note: • Data Source: Seattle District – US Army Corps of
Engineers

2-4
2.3 Skagit River Inflow Data
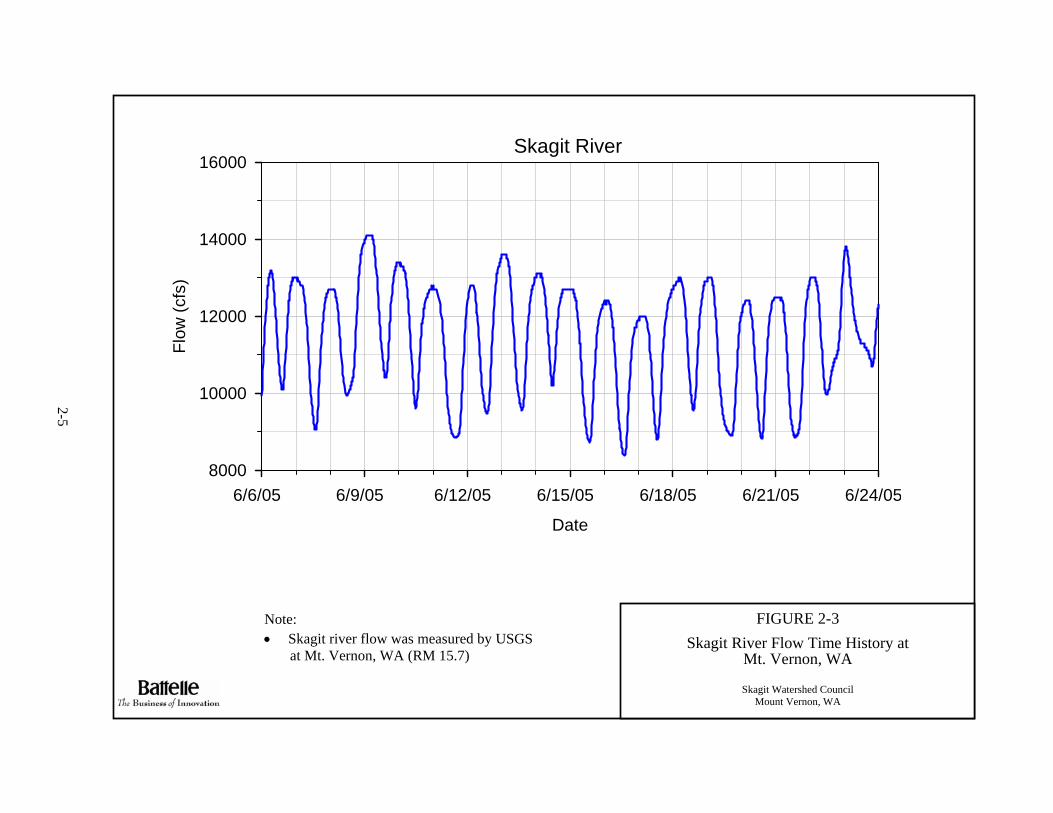
The Skagit River brings in freshwater to the bay from the northeastern end, entering the bay via the North Fork and South Fork branches. Skagit River inflow was estimated from the flow data measured at the USGS gauge (Station 12200500) near Mt. Vernon, Washington at RM 15.7. River flow time history corresponding to the field data collection period in June 2005 is plotted in Figure 2-3. Strong daily variation in the river flow is observed due to daily peaking mode operation at the upstream Skagit Hydropower Project owned and operated by Seattle City Light. Average river flow during the field study period was about 333 m3/s (11,400 cfs).
2.4 Wind Data and Tide Data Wind data are required to specify wind stress at the water surface in the model. Wind data were obtained from the NOAA’s National Weather Service site at Everett/Paine Field (KPAE) Station about 30 miles south of the study area. Figure 2-4 shows a windstick plot for Paine Field wind data for June 2005. The data were available every 10 minutes. Average wind speed during the period of interest was about 4.5 m/s. The dominant wind direction is towards the southwest.
Skagit Bay is influenced by tides, predominantly propagating to the north through Saratoga Passage, past the river mouth, and through Deception Pass to the Strait of Juan de Fuca. The Swinomish Channel also provides a connection to Padilla Bay to the north. Tidal elevations along these open boundaries are needed to specify the open boundary conditions for simulating tidal circulation. Direct measured data near the study area do not exist for the study period. However, predicted tidal elevations at Crescent Harbor located near the mouth, at Yokeko Point near Deception Pass, and Swinomish Channel are available through the NOAA tide prediction network. The predicted tidal elevations were calculated using the XTIDE program based on NOAA’s National Oceanic Service tidal prediction algorithms. Predicted tidal elevations at Crescent Harbor, Yokeko Point, and Swinomish Channel for the period of June 5 to 24, 2005 are shown in Figure 2-5. Tidal elevations at these three locations are very similar except the tidal range in Crescent Harbor is slightly greater than those at Yokeko Point and Swinomish Channel. Figure 2-5 shows a clear spring-neap tidal cycle and large diurnal inequalities in all the three stations.
2.5 Field Data Collection
2.5.1 Oceanographic Data
A field-data collection program was conducted from June 7 to 22, 2005. Velocity, tidal elevation, salinity, and temperature time histories were collected. Two S4 current meter mooring stations were deployed in the study area, one in the bay area near the deep channel and another in the main channel of North Fork branch (see Figure 2-1). Instantaneous salinity and temperature profiles were also obtained near these two stations during instrument deployment and retrieval.
Measured tidal elevations and currents at the Skagit Bay station are shown in Figure 2-6. Tides observed in Skagit Bay showed a very similar pattern to tides in Crescent Harbor (Figure 2-5). Tidal range varied from 4 m (13.1 ft) during spring tide to 2 m (6.6 ft) during neap tide during the field data collection period. Tidal currents are predominant in the north component in the bay, which is
2-5
FIGURE 2-3 Skagit River Flow Time History at
Mt. Vernon, WA
Skagit Watershed Council Mount Vernon, WA
Skagit River
Date
6/6/05 6/9/05 6/12/05 6/15/05 6/18/05 6/21/05 6/24/05
Flow
(cfs
)
8000
10000
12000
14000
16000
Note: • Skagit river flow was measured by USGS at Mt. Vernon, WA (RM 15.7)

2-6
FIGURE 2-4
Wind Stick Plot at Paine Field near Everett, WA
Skagit Watershed Council Mount Vernon, WA
0 3 6 9 12 15 18
5 m/s
06/6/05 06/24/05
N
Note: • Wind Direction Convention: Measured from North in
Clockwise. 0 is South to North, 90 is West to East. • Source: National Weather Service

2-7
FIGURE 2-5 a, b, c Predicted Tides at the Skagit Bay
Open Boundaries
Skagit Watershed Council Mount Vernon, WA
Crescent Harbor
Date6/6/05 6/9/05 6/12/05 6/15/05 6/18/05 6/21/05 6/24/05
Tide
Ele
vatio
ns (m
)
-4
-2
0
2
4
Swinomish Channel
Date6/6/05 6/9/05 6/12/05 6/15/05 6/18/05 6/21/05 6/24/05
Tide
Ele
vatio
ns (m
)
-4
-2
0
2
4
Yokeko Point
Date6/6/05 6/9/05 6/12/05 6/15/05 6/18/05 6/21/05 6/24/05
Tide
Ele
vatio
ns (m
)
-4
-2
0
2
4
Note: • Times are in Pacific Time zone. • Elevations are with reference to
Mean Sea Level (MSL). • Source: University of South Carolina tide
predictor.

2-8
FIGURE 2-6 a, b
Observed Tidal Elevations and Velocities at Skagit Bay Station
Skagit Watershed Council Mount Vernon, WA
a
b Date
6/6/05 6/9/05 6/12/05 6/15/05 6/18/05 6/21/05 6/24/05
Tida
l Ele
vatio
n (m
)
-4
-2
0
2
4
Date
6/6/05 6/9/05 6/12/05 6/15/05 6/18/05 6/21/05 6/24/05
Vel
ocity
(m/s
)
-1.0
-0.5
0.0
0.5
1.0East ComponentNorth Component

2-9
two to three times higher than the east component. Average current magnitude during the data collection period was about 0.15 m/s. Figure 2-7 shows the tidal elevation and current data collected at the North Fork station. The instrument was operational only until June 16, 2005. Tidal elevations at the North Fork station appear to be modified significantly by shallow water depths and the construction of dikes. Tidal range at the North Fork station is much smaller (about 1.0 m) compared to the bay, and a backwater effect from the Skagit River inflow was observed on the water surface elevation. Eastern currents are predominant at this station because the river channel is oriented east to west. Average current magnitude during the data collection period at the North Fork station was about 0.22 m/s.
Figure 2-8 shows the salinity time series data collected at the Skagit Bay and North Fork stations. Salinities at the Skagit Bay station showed considerable variation in response to tidal influence and freshwater discharged from the river. The salinity values reached 30 ppt during high tides and were as low as 10 ppt during low tides during spring tides. The effect of the neap-spring tidal cycle on salinity variations was clearly observed at the Skagit Bay station. Salinities at the North Fork station were zero for the entire field data collection period indicating the salt intrusion point was farther downstream of the North Fork station.
Figure 2-9 shows the water temperature time series data collected at the Skagit Bay and North Fork stations. Water temperatures at the North Fork station showed little daily variations. Water temperatures at the Skagit Bay station showed a clear tidal influence. However, the temperature variations were relatively small, generally within 4°C most of the time. Colder water temperatures occurred at high tides, which also corresponded to high salinities at the Skagit Bay station (see Figure 2-8). The temperature-salinity (T-S) diagram at the Skagit Bay station indicated that this location was mainly dominated by Puget Sound low-temperature and high-salinity water and was only influenced by the mixed river water during limited low tide periods (Figure 2-10).
Salinity profiles were obtained near the Skagit Bay and North Fork stations during instrument deployment and retrieval. All the salinity and temperature profile measurements were conducted close to low tide, which corresponded to the maximum downstream movement of the Skagit River water/plume. Figure 2-11 shows salinity profiles measured near the Skagit Bay station. The two profile curves in each plot represent the down-cast and up-cast of Conductivity-Temperature-Depth (CTD) instrument during the data collection period. A high degree of stratification was observed due to a large freshwater plume at the water surface layer. Salinities ranged from 0 at the surface to at least 25 ppt at the bottom at a depth of about 6 m (20 ft). Profiles measured at the North Fork station showed uniformly distributed salinity, where salinity values were close to zero.
Figure 2-12 shows the temperature profiles measured at the Skagit Bay and North Fork stations. Some temperature stratification was observed at the Skagit Bay station with a water temperature difference of around 2°C from the surface to the bottom. Similar to salinity distribution, temperatures at the North Fork station showed no stratification, with uniform temperatures of 12°C on June 7, 2005 and 14°C on June 22, 2005.
2.5.2 Hydrologic and Geometry Survey Data
With the support of WDFW, Battelle collected data for the development and calibration of the Interior hydraulic model. Data collection consisted of conducting a field monitoring program and literature data search. The field program consisted of collecting geometric

2-10
FIGURE 2-7 a, b
Observed Tidal Elevations and Velocities at North Fork Station
Skagit Watershed Council Mount Vernon, WA
a
b Date
6/6/05 6/9/05 6/12/05 6/15/05 6/18/05 6/21/05 6/24/05
Tida
l Ele
vatio
n (m
)
-4
-2
0
2
4
Date
6/6/05 6/9/05 6/12/05 6/15/05 6/18/05 6/21/05 6/24/05
Vel
ocity
(m/s
)
-1.0
-0.5
0.0
0.5
1.0East ComponentNorth Component

2-11
FIGURE 2-8 a, b Observed Salinity Time History at
Skagit Bay and North Fork Stations
Skagit Watershed Council Mount Vernon, WA
Skagit Bay
Date
6/6/05 6/9/05 6/12/05 6/15/05 6/18/05 6/21/05 6/24/05
Sal
inity
(PS
U)
0
5
10
15
20
25
30
35
North Fork
Date
6/6/05 6/9/05 6/12/05 6/15/05 6/18/05 6/21/05 6/24/05
Sal
inity
(PS
U)
0.10
0.12
0.14
0.16
0.18
0.20
a
b

2-12
FIGURE 2-9 a, b Observed Temperature Time History at
Skagit Bay and North Fork Stations
Skagit Watershed Council Mount Vernon, WA
Skagit Bay
Date
6/6/05 6/9/05 6/12/05 6/15/05 6/18/05 6/21/05 6/24/05
Tem
pera
ture
(o C)
5
10
15
20
North Fork
Date
6/6/05 6/9/05 6/12/05 6/15/05 6/18/05 6/21/05 6/24/05
Tem
pera
ture
(o C)
5
10
15
20
a
b

2-13
FIGURE 2-10
T-S Diagram at Skagit Bay Station
Skagit Watershed Council Mount Vernon, WA
Skagit Bay
Salinity (ppt)
5 10 15 20 25 30 35
Tem
pera
ture
(o C)
5
10
15
20

2-14
FIGURE 2-11 Observed Salinity Profiles at Skagit Bay
and North Fork Stations
Skagit Watershed Council Mount Vernon, WA
Note: CTD deployment information:
• Skagit Bay North – June 7, 2005, 12:38 PM; Skagit Bay North2 – June 22, 2005, 9:14 AM • Skagit Bay South – June 7, 2005, 10:44 AM; Skagit Bay South2 – June 22, 2005, 10:02 AM • North Fork Skagit – June 6, 2005, 3:48 PM; North Fork Skagit2 – June 22, 2005, 2:25 PM
Skagit Bay North
Salinity (ppt)
0 5 10 15 20 25 30
Dep
th (f
t)
0
5
10
15
20
25
Skagit Bay South
Salinity (ppt)
0 5 10 15 20 25 30
Dep
th (f
t)
0
5
10
15
20
25
Skagit Bay North2
Salinity (ppt)0 5 10 15 20 25 30
Dep
th (f
t)
0
5
10
15
20
25
Skagit Bay South2
Salinity (ppt)
0 5 10 15 20 25 30
Dep
th (f
t)
0
5
10
15
20
25
North Fork Skagit
Salinity (ppt)
0.00 0.01 0.02 0.03
Dep
th (f
t)
0
5
10
15
20
25
North Fork Skagit2
Salinity (ppt)0.00 0.01 0.02 0.03
Dep
th (f
t)
0
5
10
15
20
25

2-15
FIGURE 2-12 Observed Temperature Profiles at Skagit Bay
and North Fork Stations
Skagit Watershed Council Mount Vernon, WA
Skagit Bay North
Temperature (oC)
10 11 12 13 14 15 16
Dep
th (f
t)
0
5
10
15
20
25
Skagit Bay South
Temperature (oC)
10 11 12 13 14 15 16
Dep
th (f
t)
0
5
10
15
20
25
Skagit Bay North2
Temperature (oC)
10 11 12 13 14 15 16
Dep
th (f
t)
0
5
10
15
20
25
Skagit Bay South2
Temperature (oC)
10 11 12 13 14 15 16
Dep
th (f
t)
0
5
10
15
20
25
North Fork Skagit
Temperature (oC)
10 11 12 13 14 15 16
Dep
th (f
t)
0
5
10
15
20
25
North Fork Skagit2
Temperature (oC)
10 11 12 13 14 15 16
Dep
th (f
t)
0
5
10
15
20
25
Note: CTD deployment information:
• Skagit Bay North – June 7, 2005, 12:38 PM; Skagit Bay North2 – June 22, 2005, 9:14 AM • Skagit Bay South – June 7, 2005, 10:44 AM; Skagit Bay South2 – June 22, 2005, 10:02 AM • North Fork Skagit – June 6, 2005, 3:48 PM; North Fork Skagit2 – June 22, 2005, 2:25 PM
2-16
data (such as cross sections), continuous monitoring of the water surface and flows at the interior drainage (System B) boundaries (Rawlins Road tide gate and Browns Slough/Fir Island Road tide gate), and additional field trips to verify the direction of flows and water depths at various locations inside the drainage network and to spot measure infiltration rates on the site. The literature data search consisted of collecting precipitation data, information on soils, Light Detection and Ranging (LIDAR) data, as well as, extracting all relevant information from the previously published studies.
The UNET model geometry was developed utilizing field survey information provided by WDFW. The WDFW survey consisted of 91 cross sections including the sections of Hall Slough and Browns Slough. WDFW surveyors also measured water surface elevations at the time of the survey. Locations of all surveyed sections are indicated in Figure 2-13.
Flow velocities and flow depths were measured using ISCO flow modules during the two-week data collection period. The 2150 ISCO Area Velocity modules were mounted inside the 48-inch tide gates at two monitoring locations (the Rawlins Road tide gate and the Browns Slough culvert/gate). The 2110 Ultrasonic Flow Modules were also installed at both locations to confirm water levels obtained by the 2150 modules.
The 2150 instruments were mounted at the bottom of the culvert. These instruments use Doppler technology to directly measure velocities in the culvert or stream. The integral pressure transducer measures flow depth to determine flow area, then flow discharge is calculated by multiplying the flow area by its average velocities. The 2110 module was mounted on the top of the 48-inch culverts, inside the metal ring. This instrument emitted sound waves, which are reflected from the water surface. The water level was determined using the sound velocity and the elapsed time between the sound signal being transmitted and returned. The flow discharge, velocities, and flow depths, were processed using ISCO FlowLink 4 Software. All flow depths were recorded with respect to the culvert invert and then converted to the NAVD datum in feet. All ISCO instruments measured data every 5 minutes. The ISCO data are presented in Figures 2-14 and 2-15.
Precipitation is continuously monitored at the NOAA rainfall station in Paine Field (Everett) and sporadically in Mt. Vernon (closer to the project site). However, during the June 7–21 monitoring period, only the Paine Field data were available. The measurable rainfall events at that station were 0.15-in./6 hours (June 8-9), 0.20 in./5 hours (June 15), 0.30 in./6 hours (June 17), and 0.06-in./2 hours (June 22). We estimate rainfall at Mt. Vernon to be 20% higher using comparative evaluation of the available rainfall statistics at Mt. Vernon and Paine Field.
Dominant soils on the project site are Sumas Silt Loam and Skagit Silt Loam, both with an estimated infiltration rate of 0.6 to 2.0 in./hour in the surface soil layer. Battelle confirmed that soils on the site were of moderate permeability by conducting in-situ tests using an infiltrometer. The permeability was at least 2.0 in./hour, except on the roads crossing the site.
Battelle staff visited the project site on June 13, 2005, midway through the monitoring period to measure flow direction, velocities (if any), and dimensions of all internal hydraulic structures. The field staff recorded direction of flows and flow depths in all major interior channels and marked dry and non-flowing channels (with only stationary water). The staff also measured dimensions of all interior culverts.

2-17
FIGURE 2-13
Irrigation Channel Cross Section Locations
Skagit Watershed Council Mount Vernon, WA
Skagit Bay
Rawlins Road Tide Gate
Browns Slough Culvert
North Fork Skagit River

2-18
FIGURE 2-14 Flow and Water Level Time Histories at
Rawlins Road Tide Gate
Skagit Watershed Council Mount Vernon, WA
FLOWS AND WATER LEVELS RECORDED AT RAWLINS ROAD TIDE
GATE
5.00
5.20
5.40
5.60
5.80
6.00
6.20
6.40
6.60
6.80
7.00
7-Jun 9-Jun 11-Jun 13-Jun 15-Jun 17-Jun 19-Jun 21-Jun 23-Jun
Date
Wat
er L
evel
[ft N
AVD
]
-10.00
-8.00
-6.00
-4.00
-2.00
0.00
2.00
4.00
6.00
Flow
[cfs
]
Hourly Average Water Level [ftNAVD]Hourly Average Flow [cfs]

2-19
FIGURE 2-15 Flow and Water Level Time Histories at
Browns Slough Culvert
Skagit Watershed Council Mount Vernon, WA
FLOWS AND WATER LEVELS RECORDED AT BROWNS SLOUGH (FIR
ISLAND ROAD) CULVERT
0.00
1.00
2.00
3.00
4.00
5.00
6.00
7.00
8.00
6/7/05 0:00 6/9/05 0:00 6/11/05 0:00 6/13/05 0:00 6/15/05 0:00 6/17/05 0:00 6/19/05 0:00 6/21/05 0:00 6/23/05 0:00
Date
Wat
er L
evel
[ft N
AVD
]
-10.00
-8.00
-6.00
-4.00
-2.00
0.00
2.00
4.00
6.00
Flow
[cfs
]
Hourly Average Water Level [ft NAVD]Hourly Average Flow [cfs]

3-1
3.0 Interior Hydraulic and Hydrologic Model Setup and Calibration
3.1 Introduction
One of the potential benefits of restoration actions envisioned by the project team was improvement to the drainage of irrigation and rainfall runoff water in the Fir Island interior region. The land interior to the Fir island dikes has subsided considerably and is at an elevation well below MSL. The runoff water is currently routed through the extensive network of channels toward outlets in the dike that are regulated with the help of hydraulic control structures such as tide gates and pump stations. Gravity flow out of the area is currently inefficient and occurs only during low tide. The restoration project provides an opportunity of revisiting the hydraulic design of the drainage system and to plan improvements in conjunction with the restoration actions.
The hydrologic and hydraulic behavior of the system is dependent on various physical parameters. The general hydrology, topography, soils and vegetation characteristics of Fir Island were previously described in SWC’s Assessment of Potential Habitat Restoration Pathways for Fir Island (PWA 2004) and will not be repeated. Also, this study focused on a relatively small triangularly shaped area (Rawlins Road Project Site) bounded by Browns Slough on the east, the North Fork Skagit River on the north, and Skagit Bay on the south and west (see Figure 3-1).
In addition to direct loading through rainfall and irrigation, the Rawlins Road Project Site receives inflow of water through a leaking tide gate at the western end of Rawlins Road. Water also enters the Rawlins Road Project Site from the southeast and through a series of three Browns Slough tide gates. The northern end of Browns Slough, historically connected to the North Fork, has been silted in within the last century. Hall Slough, historically connected to Browns Slough from the north, has also been silted in. The outflow from the interior drainage south through Hall Slough also has been impeded; and therefore, drainage of water is currently achieved through intermittent pumping from Hall Slough into Skagit Bay.
The primary source of water to the project site is precipitation, the majority of which falls during the wet season (from October through April). The mean annual precipitation on the site varies between 30 and 40 in. A secondary outside source of water comes from periodic flooding of the Skagit River during extreme flood events (50- to 100-year floods) that overtop the Skagit River levees.
The subsurface flow from the North Fork and the Skagit Bay likely feeds shallow groundwater on the site. The groundwater level was reported to be significantly higher during the wet season (6-24 in. below the ground surface). During this period, it could contribute to the interior drainage flows. However, contribution of the groundwater to the drainage during the study period (June 2005) was found to be negligible (average reported depth 36-60 in. below the ground surface).
3.2 Modeling Approach
The hydrologic system for this project is illustrated in Figure 3-1. The system consists of three separate networks of connected channels and storage areas: Drainage Areas A, B and C. The

3-2
FIGURE 3-1
Drainage Network in Fir Island East of Browns Slough
Skagit Watershed Council Mount Vernon, WA

3-3
northeastern corner of the site, north of Rawlins Road (System A), drains to the ditch parallel to the road. In the past, this ditch probably drained into Browns Slough. However, our field crew could not find any connecting culvert, indicating that the culverts were probably too deeply buried and/or incapacitated to convey any flows. With the current conditions, System A can not convey any water out of the system, so it probably fills, overflows onto Rawlins Road, and connects into System B during high-flow events.
The majority (75%) of the site drains through System B. This system receives water at two locations: from the west by tidal action entering through the existing damaged/leaking 48-in. tide gate (marked red in Figure 3-1, Rawlins Road tide gate or tide gate 7 of the House Bill 1418 Report (Smith et al. 2005)) and from the south by tides entering Browns Slough through three 48-inch tide gates downstream (Tidegate 12 of the House Bill 1418 Report (Smith et al. 2005)) and one 48-in. tide gate upstream (marked red in Figure 3-1, Tidegate 13 of the House Bill 1418 Report, (Smith et al. 2005)), located at the Fir Island Road crossing over Browns Slough. The interior drainage network of System B is marked in blue in Figure 3-1.
The interior hydraulic model included Drainage System B, as this system lies in the path of the proposed restoration project. When very high flood flows are modeled, System A would be added to the already developed model. System C lies outside the proposed restoration project and is not included in the existing model.
The modeling approach was to first use the hydrologic model HEC-HMS to develop tributary overland runoff hydrographs at various locations of the interior drainage network, then route hydrographs through a drainage network of irrigation canals and sloughs using the UNET model. The HEC-HMS model (USACE 2000) uses information on precipitation, infiltration, and land-use to compute overland runoff hydrographs. The hydraulic model UNET (used with HEC-RAS) (USACE 2002a, 2002b, 20002c) simulates one-dimensional unsteady flow through the drainage network, routing flows using a four-point linear implicit finite difference solution of the St. Venant equations. The runoff hydrographs are input directly into the UNET model. Because of its ability to include off-channel storage and over-bank storage areas, UNET can be considered as a quasi two-dimensional (2-D) model. The model handles flow through culverts, gated structures, spillways, bridges, and pump stations. Dynamic routing in the model is based on a four-point linear implicit finite difference solution of the St. Venant equations. The simulated outflows from the UNET model are then used to specify boundary inflows to the FVCOM model.
3.3 Interior Hydraulic Model UNET Setup
3.3.1 UNET Model Assumptions
The UNET model assumptions and limitations are as follows:
• The hydraulic system was modeled assuming the land use remains the same for both the existing condition and the evaluation of alternatives (no new housing or industrial development, and no new roads).
• The surveyed cross sections were not available for all drainage channels. The non-surveyed reaches were assumed to have the same geometry as the neighboring reach with a known surveyed cross section.

3-4
• Subsurface component of a runoff (i.e., groundwater) was assumed small and not included in the modeling calculations.
• Inverts at any interior drainage culvert were assumed equal to the nearest known channel thalweg. This assumption would likely not produce significant errors inside the drainage network, except for two locations near the model boundaries:
o The nearest cross section to the Browns Slough/Fir Island culvert was at a distance of 1 mile, resulting in some uncertainty to the assumption
o An observed sediment deposition area near the Rawlins Road tide gate could make the assumption invalid
• Hydraulic effects from the Browns Slough beaver dam (located between channel reach d34 and Browns Slough culvert/tide gate) were not included in the model.
• For modeling purposes, both dry channels and non-flowing channels (stagnant water) were assumed to have some flow. This assumption was needed for model stability.
• Calibration of the UNET model was conducted during summer flows, consistent with little precipitation, overland flow, and low flows in North Fork Skagit River.
3.3.2 Model Geometry and Input Parameters
The channel network, surveyed cross sections, information on culverts, and recorded flows and water levels were imported into the UNET model utilizing graphical features of the HEC-RAS model.
Hydraulic roughness throughout the hydrologic system was assumed to be 0.04 in the main channels and 0.10 in the floodplain. The flow through the concrete culverts and concrete channel parts was modeled with a roughness of 0.012 to 0.013. Since tidal inflows were directly measured at the inflow boundaries, the malfunctioning tide gates were not included in the model.
Hydraulic losses at all interior culverts were obtained by standard step method, momentum balance, and Yarnell equation for low flows and by the standard step method (energy method) for high flows. The method that gave the highest energy was then used in subsequent computations.
Flow was distributed proportionally according to hydraulic conveyance at all flow junctions at the start of simulations. The energy equation was used to distribute flow at all junctions, as calculations using the momentum balance increased the model instability. Cross sections at different reaches surrounding each junction were placed as close together as possible to minimize error in the calculation of energy losses.
The maximum precipitation rate during the monitoring period was 0.05 in./hour. Since this is less than the lowest estimated infiltration rate of 0.6 in./hour, there is no overland runoff for the existing (low-flow) condition. Thus, the HEC-HMS model had no input to the UNET model.

3-5
Parameters used to stabilize UNET during unsteady flow simulations were as follows:
• Computational time interval: 1 minute • Implicit weighting factor in unsteady flow equations: 1.0 • Water surface elevation error criterion: 0.02 ft. • Storage area water surface elevation criterion: 0.05 ft.
3.4 Model Calibration Results
Figure 3-2 depicts the System B drainage network. The channels with observed water flow (and flow velocities >0) during several site visits in June 2005 were noted (d1 through d34). All other channels were found to be either dry or flowing very slowly. Hall Slough, connected to slow-flowing channels, currently serves as a storage area until water is pumped out into Skagit Bay. There was no pumping of the storage during the monitoring period from June 7 through June 22, 2005.
Flow enters and exits this drainage system at the two boundary tide gates (red circles in Figure 3-2) and is distributed inside the network, with some of the flow being detained in Hall Slough. The model was first applied in a stationary mode for various flows to obtain correct flow distributions at all junctions as a start-up step. All channels with significant flows were found to respond correctly during these trial runs. The channel branches transporting these significant flows are shown in dark blue in Figure 3-2. These branches consist of two major channel laterals that distribute the majority of flows (over 90%) from west to east and vice-versa. The upper laterals are: d5-d11-d13-d15 and d31, and the lower laterals are d16-d17 and d32.
The non-stationary model UNET was then applied for the two-week simulation period with known tidal inflows (and water surface elevations) from the Browns Slough tide gate. The hydraulic roughness for various channels was then adjusted until simulated flows and water surface elevations best matched the monitored flows and water surface elevations at the western boundary. The calibration results are presented in Figures 3-3 and 3-4. An important point to note is that fluctuations in the water surface elevations caused by reverse flow into the system through the leaking tide gate were small, typically less than 6 in. Water surface elevations were found to be sensitive to the channel geometry and limited by available information and therefore any further attempt at refining the network geometry was not made. The model calibration focused on matching the observed flow with measured data.
The UNET model was further validated by comparing direction of flows in the interior channels on June 13, 2005 (midway through the monitoring period June 7-22) with the direction of flows observed during the site visit on that same day. The validation was satisfactory; flow directions in all major channels were confirmed through model results. In several channels, simulations showed flow direction reversing, consistent with the reversals observed during the site visit.
Drainage from and to the existing channel network depends on the sediment deposition and erosion in the individual channels, other constraints in the drainage system (such as woody debris, beaver dams, log-jams), and maintenance frequency of the interior drainage culverts and the existing outside drainage structures (tide gates).

3-6
FIGURE 3-2
Drainage System B Network
Skagit Watershed Council Mount Vernon, WA

3-7
FIGURE 3-3 UNET Model Calibration for Flow
at Rawlins Road Tide Gate
Skagit Watershed Council Mount Vernon, WA
Note: • Negative flow values indicate flow out of the system

3-8
FIGURE 3-4
UNET Model Calibration for Water Level at Rawlins Road Tide Gate
Skagit Watershed Council Mount Vernon, WA
5
5.2
5.4
5.6
5.8
6
6.2
6.4
6.6
6.8
7
9-Jun 11-Jun 13-Jun 15-Jun 17-Jun 19-Jun 21-Jun 23-JunDate
Wat
er L
evel
[ft N
AVD
]
UNET computed stage
Measured Data

3-9
Drainage in and from the network would be expected to improve by increasing channel maintenance frequency (i.e., removing sediment accumulations), maintaining unobstructed culvert connections in the interior channel network, and removing the leakage from the existing Rawlins Road tide gate.
Sensitivity analysis of the existing drainage shows the biggest improvement to drainage would be achieved by replacing the existing Rawlins Road tide gate with a positive flap gate (allowing only drainage out of the system and preventing tidal water from entering the system). The longitudinal water surface profile through the main east-west drainage channel indicates that water surface elevations would drop to 0.50 ft at some locations within the network from existing condition (with the leaking tide gate). Increasing the size of culverts in the interior drainage network does not change drainage efficiency for the simulated low summer conditions but could be a factor during higher runoff events.
The hydraulic model application showing improved drainage with installation of an operational tide gate at Rawlins Road is discussed in Section 5.

4-1
4.0 Skagit Bay Hydrodynamic Model Setup and Calibration
4.1 Introduction
The ultimate goal of coastal and estuarine restoration projects is to minimize the impact of human activities on ecological processes and improve wildlife habitats through the restoration of dynamic physical processes such as water surface inundation, salinity variation, residence time, and circulation. Numerical modeling has been used as a predictive tool in many studies to provide guidance in estuarine and coastal restoration (Day et al. 1999; Moller et al. 1999; French and Clifford 2000). In this section, the development and calibration of a hydrodynamic model for the Skagit River estuary and Skagit Bay is described in detail. Due to the complexity of the geometry and complicated dynamic physical processes in the Skagit River delta and bay, a three-dimensional (3-D) hydrodynamic model that can simulate wetting-drying and tide- and density-driven circulation in an unstructured, finite element framework was selected. The model selected for this study is the Finite Volume Coastal Ocean Model (FVCOM) developed by University of Massachusetts.
4.2 Model Setup
Data needed for the hydrodynamic model setup and calibration were obtained from existing database and the field survey specifically designed for this study as described in Section 2. The hydrodynamic model setup for Skagit Bay consists of two procedures: 1) construction of an unstructured model grid in the study area, and 2) specification of the model boundary conditions and forcing mechanisms. These two procedures are described in detail below.
4.2.1 Model Description
The 3-D hydrodynamic model used in this study is the Finite Volume Coastal Ocean Model (FVCOM) developed by Chen et al. (2003). FVCOM solves the 3-D momentum, continuity, temperature, salinity, and density equations in an integral form by computing fluxes between non-overlapping, horizontal, and triangular control volumes. This finite volume approach combines the advantages of finite element methods for flexibility in handling complex shorelines and the superior ability of finite difference methods for simple discrete structures and computation efficiency. A sigma-stretched coordinate system was used in the vertical plane to better represent the irregular bathymetry. Unstructured triangular cells were used in the lateral plane. The model employs the Mellor Yamada level 2.5 turbulent closure scheme for vertical mixing and the Smagorinsky scheme for horizontal mixing. The model has been successfully applied to simulate hydrodynamics and transport processes in lakes and estuaries (Zheng et al. 2003; Chen et al. 2004).
4.2.2 Model Grid
An unstructured finite element grid was generated for the entire Skagit Bay (see Figure 4-1). The model grid represents the physical study area overlain by the computational grid that defines the model boundaries and model cells. Physical properties of the domain such as water depth, land and water boundaries, and other properties are defined at each node point. A numerical model then computes the hydrodynamic solution at these node points. The upstream end of the model domain is extended

4-2
FIGURE 4-1
FVCOM Model Grid for Skagit Bay
Skagit Watershed Council Mount Vernon, WA
Note: • Number of elements = 9,122 • Number of nodes = 5,496 • Number of layers = 10

4-3
considerably beyond the split of the Skagit River into the North Fork and South Fork. The flow and stage data from the USGS stream gage at Mt. Vernon Station at RM 15.7 was used to specify the upstream model boundary condition. To simulate the tidal wave propagation and salinity intrusion properly in the multi-channel and tidal mud-flat area, finer grid cells were specified in the North Fork and South Fork river delta region. Model bathymetry in the river sections was interpolated based on available river cross-section data. At least four node points were specified across the width to represent the river cross-section profiles in the model. The model element size varied from 16 m near the mouth of the estuary to 400 m at the entrance of Skagit Bay. The model grid resolution was gradually reduced away from the estuarine delta to the open boundaries in order to maintain the computational efficiency of the model. The model consists of 9,122 elements and 5496 nodes in the horizontal plane. Ten uniform vertical layers were specified in the water column in a sigma-stretched coordinate system. The model was set up in UTM NAD 83 (Zone 10) coordinates in the horizontal plane with reference to MSL in the vertical direction. Model bathymetry was interpolated using the combination of UW DEM data, Lidar data provided by SRSC, and river cross sections, as described in Section 2. The final bathymetry incorporated into the model is shown in Figure 4-2. Water depths in most of Skagit Bay are less than 5 m. The deepest water is 40 m near Deception Pass in the north of the model domain.
4.2.3 Model Boundary Condition
Model open boundary conditions specified were tidal elevations predicted using the XTIDE program based on National Oceanic Service algorithms. Tidal elevations were specified at the following three open boundaries: 1) mouth of Skagit Bay, 2) Deception Pass, and 3) Swinomish Channel. There were no salinity data available along the open boundaries. Salinity profiles along the open boundaries were initially estimated based on historical data in the Puget Sound area and further adjusted during model calibration. Field data indicated that temperature variations in the study area are less than 3°C most of the time, and salinity variations are more than 20 ppt. Therefore, the effect of temperature on density is likely not significant in comparison to the effect of salinity. Temperature effect on the density-induced currents thus was not simulated in this study. At the water surface, wind stress was specified. Wind stress was applied uniformly to the entire model domain.
4.3 Model Calibration Results
Model calibration was conducted for June 6 to 23, 2005, corresponding to the field data collection. Because of the existence of a large tidal mudflat region in the study domain, wetting and drying processes of the intertidal zone were simulated in the model. A water depth of 20 cm was used as the dry cell criteria in the model (i.e., when the depth fell below 20 cm, the model assumed that element was dry). Model calibration was conducted through matching model results to field data by adjusting salinity open boundary conditions, refining bathymetry, and adjusting bottom roughness. Predicted water surface elevation, velocity, and salinity time series were compared to the field measurements. Comparisons of predicted tidal elevations and currents to the observed data at the Skagit Bay station are shown in Figure 4-3. Predicted water surface elevations matched the observed data well. The spring-neap tidal cycle and the diurnal inequality were reproduced well in the model. Predicted high and low tidal phases were also in good agreement with observed data. Predicted velocities in general matched the observed data, but the level of accuracy was less satisfactory. This was likely due to the complexity at the measured data location and the model grid resolution in both the horizontal and vertical direction. Unlike water surface elevations, the

4-4
FIGURE 4-2 Hydrodynamic Model Bathymetry for
Skagit Bay
Skagit Watershed Council Mount Vernon, WA
Note: • Water depths are relative to mean sea
level (MSL). • Negative values indicate depth above
MSL.

4-5
FIGURE 4-3 a, b, c Comparisons of Tidal Elevations and Velocities
at Skagit Bay Station
Skagit Watershed Council Mount Vernon, WA
Note: • Times are in Pacific Time Zone.
a
b
c
Date6/6/05 6/9/05 6/12/05 6/15/05 6/18/05 6/21/05 6/24/05
Tida
l Ele
vatio
n (m
)
-4
-2
0
2
4
DataModel
Velocity - East Component
Date6/6/05 6/9/05 6/12/05 6/15/05 6/18/05 6/21/05 6/24/05
Vel
ocity
(m/s
)
-1.0
-0.5
0.0
0.5
1.0
DataModel
Velocity - North Component
Date6/6/05 6/9/05 6/12/05 6/15/05 6/18/05 6/21/05 6/24/05
Vel
ocity
(m/s
)
-1.0
-0.5
0.0
0.5
1.0
DataModel
4-6
signature of neap-spring tidal cycle and diurnal inequality was not clear in the velocity distributions. Both observed and predicted velocities showed some degree of irregularity over the observation period. This was likely because the observation location was at the sharp slope of the deep channel in Skagit Bay, where tidal currents were generally more dynamic and unstable. Predicted tidal elevations and currents at the North Fork station were also compared to observed data (Figure 4-4). Good agreement was obtained between model results and observations for both water surface elevations and velocities. Water surface elevation at the North Fork station was elevated due to the river backwater effect. The minimum water surface elevation at the North Fork Station was about 1.0 m above MSL. The tidal range was significantly reduced at the mouth of the North Fork Skagit River due to the presence of tidal marsh and shallow water depths that dampens the incoming tide. These features were also reproduced well in the model. Velocity distribution at the North Fork station was completely dominated by the east component because of the east-west orientation of the river channel. The special feature of unidirectional seaward flow in the North Fork branch due to the strong river discharge and channel confined by dikes on either bank was correctly reproduced in the model. Similar to water surface elevations, diurnal inequality in velocity distributions was also well reproduced in the model.
Comparison of salinity time histories at the Skagit Bay and North Fork stations are shown in Figure 4-5. Overall, predicted salinities matched the observed data reasonably well at both stations. At the North Fork station, both predicted and observed salinities were close to zero for the entire simulation period, indicating salinity intrusion did not reach upstream to the North Fork station. Salinities at the Skagit Bay station showed strong variations as a result of tidal fluctuations and the spring-neap tidal cycle. Salinities in the bay increased up to 30 ppt during flood tides, due to the intrusion of Puget Sound water, and dropped below 10 ppt during ebb tides due to the dispersion and spreading of the Skagit River freshwater plume. Predicted salinities matched this pattern of observed data very well.
Salinity profiles were collected during deployment and retrieval of instruments in the field survey program. Predicted instantaneous salinity profiles at the Skagit Bay station were compared to the measured data. Model results were extracted at times and grid node locations nearest to the data station. Figure 4-6 shows the comparisons of salinity profiles at the Skagit Bay station. Two profiles were obtained at the beginning (June 7, 2005) and the end (June 22, 2005) of the field program. In general, predicted salinity profiles matched the observed data reasonably well. Both model results and measured data showed stronger stratification in the top 5 ft. of the water column. The model over-predicted the bottom salinities compared to the data. At the North Fork station, the model also predicted zero salinity over the entire water column as shown in the observed data plot. Therefore, comparison of salinity profiles at the North Fork station is not presented here.
Predicted 2-D velocity distributions at the surface layer corresponding to flood and ebb tides on June 8, 2005 for the existing condition are shown in Figures 4-7 and 4-8, respectively. The dark yellow area without velocity vectors in the model domain indicates that the model elements are dry (water depths less than 0.2 m). Strong velocities along the deep channel moving toward the north were observed. Velocities near the bayfront of Fir Island were generally small because of the shallow water depths in the mudflat region. During ebb tide, strong currents were present from the North Fork Skagit River channel to the bay because of the combination of ebb currents and the outflowing freshwater plume of the Skagit River. Large mudflat area in the bay became dry during low tide. Strong ebb currents were predicted in the tidal channels. Distinct ebb currents along the deep channel in the west side of the bay were also predicted as shown in Figure 4-8

4-7
FIGURE 4-4 a, b, c Comparisons of Tidal Elevations and Velocities
at North Fork Skagit River
Skagit Watershed Council Mount Vernon, WA
Note: • Times are in Pacific Time Zone.
a
b
c
Date6/6/05 6/9/05 6/12/05 6/15/05 6/18/05 6/21/05 6/24/05
Tida
l Ele
vatio
n (m
)
-4
-2
0
2
4
DataModel
Velocity - East Component
Date6/6/05 6/9/05 6/12/05 6/15/05 6/18/05 6/21/05 6/24/05
Vel
ocity
(m/s
)
-1.0
-0.5
0.0
0.5
1.0DataModel
Velocity - North Component
Date6/6/05 6/9/05 6/12/05 6/15/05 6/18/05 6/21/05 6/24/05
Vel
ocity
(m/s
)
-1.0
-0.5
0.0
0.5
1.0
DataModel

4-8
FIGURE 4-5 a, b Comparisons of Salinities at Skagit Bay
and North Fork Stations
Skagit Watershed Council Mount Vernon, WA
Note: • Times are in Pacific Time Zone.
Skagit Bay
Date
6/6/05 6/9/05 6/12/05 6/15/05 6/18/05 6/21/05 6/24/05
Sal
inity
(PS
U)
0
5
10
15
20
25
30
35
DataModel
North Fork
Date
6/6/05 6/9/05 6/12/05 6/15/05 6/18/05 6/21/05 6/24/05
Sal
inity
(PS
U)
0
5
10
15
20
25
30
35
DataModel
a
b

4-9
FIGURE 4-6
Comparisons of Salinity Profiles at Skagit Bay Station
Skagit Watershed Council Mount Vernon, WA
Note: CTD deployment information:
• Skagit Bay North – June 7, 2005, 12:38 PM; Skagit Bay North2 – June 22, 2005, 9:14 AM • Skagit Bay South – June 7, 2005, 10:44 AM; Skagit Bay South2 – June 22, 2005, 10:02 AM
Skagit Bay North
Salinity (ppt)
0 5 10 15 20 25 30
Dep
th (f
t)
0
5
10
15
20
25
DataModel
Skagit Bay South
Salinity (ppt)
0 5 10 15 20 25 30
Dep
th (f
t)
0
5
10
15
20
25
Skagit Bay North2
Salinity (ppt)0 5 10 15 20 25 30
Dep
th (f
t)
0
5
10
15
20
25
Skagit Bay South2
Salinity (ppt)
0 5 10 15 20 25 30D
epth
(ft)
0
5
10
15
20
25

4-10
FIGURE 4-7
Skagit Bay Velocity Distribution during Flood Tide
Skagit Watershed Council Mount Vernon, WA
Note: • Model result corresponds to 06/08/2005, 7:00 pm • Indicates dry area.

4-11
FIGURE 4-8
Skagit Bay Velocity Distribution during Ebb Tide
Skagit Watershed Council Mount Vernon, WA
Note: • Model result corresponds to 06/08/2005, 12:00 pm • Indicates dry area.

4-12
Predicted 2-D salinity distributions in the surface layer corresponding to flood and ebb tides on June 8, 2005 for the existing condition are presented in Figures 4-9 and 4-10. A large freshwater plume occupied the region from the mouth of the North Fork of the Skagit River to Goat Island during the entire tidal cycle. Simulations showed that during flood tide, the freshwater plume was confined in the North Fork river mouth area and pushed north a couple of miles passing Goat Island. During ebb tide, the freshwater plume appeared to have moved south, pushed by the southerly directed ebb currents, all the way to the deep channel on the west side of the bay. In contrast to the North Fork branch, only a dispersed freshwater plume was observed emanating from the mouth of the South Fork. Freshwater discharged from the South Fork was shown to be dispersed throughout the multiple channels present at the mouth of the South Fork. Results show that salt water intrusion could reach the multiple tidal channels in the South Fork during flood tide. During ebb tide, a mixed-water mass with salinities in the range of 5 to 15 ppt occurred along the bayfront of the South Fork. Salinities in the bayfront region between the South Fork and North Fork were shown to be generally high, with salinities greater than 20 ppt.
Overall, there was good agreement between the model results and observed data for water surface elevations, velocities, and salinities indicating that the hydrodynamic model for Skagit Bay was calibrated satisfactorily. The model successfully reproduced many important features observed in the unique and complex estuarine system including wetting and drying processes in the intertidal zone, strong tidal circulation, and back-water effects in the North Fork Skagit River channel due to the shallow mudflats and high river inflows. Comparisons of predicted and measured salinity profiles indicated that the model is capable of reproducing the general mixing and stratification patterns in the bay. On the other hand, the model over-predicted bottom-water salinity at the Skagit Bay station and under-predicted the level of stratification at the surface layer.
Further improvement of model calibration at the Skagit Bay station may be achieved by refining the model grid in the region of the deep channel in the bay, and by increasing the number of vertical layers. However, because the focus of the model simulation was on the Skagit River delta region, the level of accuracy of model predictions for Skagit Bay is considered sufficient for this study.

4-13
FIGURE 4-9
Surface Salinity Distribution at Flood
Skagit Watershed Council Mount Vernon, WA
Note: • Model result corresponds to 06/08/2005, 7:00 pm • Indicates dry area.

4-14
FIGURE 4-10
Surface Salinity Distribution at Ebb
Skagit Watershed Council Mount Vernon, WA
Note: • Model result corresponds to 06/08/2005, 12:00 pm
Indicates dry area.

5-1
5.0 Model Application for Restoration Alternatives
5.1 Introduction
Once the hydrodynamic model of Skagit Bay was calibrated for the existing condition, restoration alternatives for improving Fir Island wetlands and marine habitats were evaluated with the model. One of the key factors for salmon life cycle is nearshore habitat with availability of brackish or near-brackish water for rearing. Restoring low-salinity waters in the bayfront area of Fir Island was one of the desired goals. Model results for the existing condition showed that the salinity ranges in the nearshore area between the North Fork and South Fork are considerably higher than ideal, with salinities in the range of 5-10 ppt (Figures 4-9 and 4-10). Freshwater discharged from the South Fork currently tends to be transported and trapped to the south because of the tidal circulation in the south corner of the bay. Freshwater discharged from the North Fork appears to be confined to the north because of the orientation of the river channel and strong tidal currents direct to the north during flood tide.
To reduce the salinity in the Skagit River delta, especially in the bayfront area, five restoration alternatives were considered; designed to transport more freshwater from the North Fork to the delta bayfront area. In addition to providing freshwater, the alternatives would also provide the required conveyance for fish to migrate. The alternatives considered in this study are described below.
1. Alternative 1: Creating a diversion channel at the northwest corner of Fir Island along the existing dike to connect the North Fork Skagit River to Skagit Bay.
2. Alternative 2: Reconnecting the North Fork through a diversion channel to Skagit Bay along the existing Hall Slough channel. The tide gate would allow freshwater to flow into the bay but restrict tidal propagation upstream to provide flood control.
3. Alternative 3: Constructing a dike setback at the northwest corner of Fir Island to provide more tidal marsh area for salmon habitat.
4. Alternative 4: Constructing a natural opening of the channel near the mouth of the North Fork Skagit River to investigate the effects of channel modification on nearshore salinity distribution.
5. Alternative 5: Reconnecting the North Fork through a diversion channel to Skagit Bay along the existing Browns Slough channel by breaching the existing dike at the North Fork end and installing a tide gate. Compared to Alternative 2, this alternative would allow more freshwater outflow along the middle portion of the bayfront area between the mouths of the North and South Forks.
The Fir Island interior hydraulic model (UNET) and Skagit Bay hydrodynamic model (FVCOM) were applied to simulate the hydrodynamic response of the Skagit River estuary and Fir Island drainage to proposed restoration alternatives. Predicted hydrodynamic changes, such as water surface inundation, salinity, and velocity distributions were simulated for use in the evaluation of impact on ecological processes and the selection of a preferred restoration alternative.

5-2
Simulations for the restoration alternatives were conducted for the same period as the calibration conditions from June 6 to 23, 2005. Model parameters and forcing functions were retained at the same values as those set up during the model calibration.
5.2 Model Simulations for Restoration Alternatives
5.2.1 Restoration Alternative 1 - Diversion Channel at the Northwest Corner of Fir Island
In this alternative, the configuration of the drainage system did not change. However, the cutting of the new channel would bring its water closer to the Rawlins Road tide gate. With a leaking Rawlins Road tide gate repaired, the impact of this change on the hydraulic circulation in the interior channels would be minimal. Therefore, application of the interior hydraulic model for this alternative is not presented. The location and configuration of the diversion channel is shown in Figure 5-1.
To apply the hydrodynamic model to Alternative 1, bathymetry in the model was modified to correspond to the creation of the flow diversion along the existing dike at the northwest corner of Fir Island. A channel with a depth of 2.9 m, referenced to MSL, was created outside of the existing dike. In order for the channel to work effectively, the ground elevations seaward of the diversion channel were dropped down to grade elevations to ensure water depths increased smoothly from the diversion channel to the bay. Comparison of bathymetric contours between existing condition and Alternative 1 in the diversion channel region is shown in Figure 5-2. The model setup and boundary conditions were retained at the model calibration specifications.
Comparison of surface salinity and velocity distributions between existing condition and Alterna-tive 1 near the diversion region during ebb tide is shown in Figure 5-3. Results show that velocities in Alternative 1 increased in the North Fork River channel upstream of the diversion and decreased downstream of the diversion. This was because the creation of the diversion channel allowed more freshwater to flow through the diversion channel from the North Fork of the Skagit River to the bayfront. Comparison of velocity time histories at two selected locations indicate the presence of a strong current in the diversion channel, while velocities in the North Fork main channel downstream of the diversion were reduced by 27% in the two-day period examined (Figure 5-4).
Compared to the surface salinity distribution in the existing condition, the salinity at the Northwest corner of the bayfront area was reduced because more freshwater was transported from the North Fork to the Northwest corner of Fir Island. However, the extent of salinity reduction due to the creation of the diversion channel was relatively small compared to the large scale of the Fir Island bayfront (~10 km). Predicted surface salinity time histories between existing condition and Alternative 1 were compared at a location in the bayfront (Figure 5-5). The location was about 600 m south of the diversion channel at North Fork. Results show that the mean salinity dropped from 22.3 ppt for the existing condition to 13.6 ppt for Alternative 1 at the selected location.
5.2.2 Restoration Alternative 2 - Diversion Channel to Skagit Bay at Hall Slough
The proposed diversion channel in Alternative 2 would extend from the south bank of the North Fork Skagit River through a gated diversion structure into an open channel. The diversion route selected would

5-3
Proposed Channel Cross Section
FIGURE 5-1 Alternative 1 – Diversion Channel at the
Northwest Corner of Fir Island
Skagit Watershed Council Mount Vernon, WA
MSL
2.9 m10:1
40 m
MSL
2.9 m10:1
40 m
Diversion Channel
Diversion Channel

5-4
FIGURE 5-2 Comparison of Bathymetric Contours –
Existing Condition and Alternative 1
Skagit Watershed Council Mount Vernon, WA
Alternative 1 Existing Condition

5-5
FIGURE 5-3 Comparison of Surface Salinity and Velocity –
Existing Condition and Alternative 1
Skagit Watershed Council Mount Vernon, WA
Alternative 1 Existing Condition
Note: • Model result corresponds to ebb tide on 06/08/2005 • Indicates dry area.

5-6
FIGURE 5-4 Comparison of Velocity Time Histories –
Existing Condition and Alternative 1
Skagit Watershed Council Mount Vernon, WA
Note: • Negative velocity indicates ebb flow in the
downstream direction. C1
C2
Station C1
Date
6/10/05 6/11/05 6/12/05
Vel
ocity
(m/s
)
-1.5
-1.0
-0.5
0.0
0.5
ExistingAlternative 1
Station C2
Date
6/10/05 6/11/05 6/12/05
Vel
ocity
(m/s
)
-3
-2
-1
0
1
ExistingAlternative 1

5-7
FIGURE 5-5 Comparison of Salinity Time Histories –
Existing Condition and Alternative 1
Skagit Watershed Council Mount Vernon, WA
S1
Station S1
Date
6/10/05 6/11/05 6/12/05
Sal
inity
(ppt
)
0
10
20
30
ExistingAlternative 1

5-8
avoid the existing farming residences and minimize the number of road and drainage crossings. The route would require bridge crossings over the proposed canal at the Rawlins Road intersection and at Maupin Road. After the second bridge crossing, the channel would be placed parallel to Maupin Road, following the route of the existing north-south System B drainage canal. The channel would end in the existing slough just south of the existing Hall Slough with another gated structure. The diversion channel route is indicated in Figure 5-6.
The existing major west-east System B drainage conveyance canals would be connected to the diversion channel through either positive flap gates (enabling drainage only into diversion channel) or through pumps. If connected through flap gates, canals would drain into the diversion channel only during periods of low flow diversions.
The preliminary design parameters of the diversion channel used in the UNET model application for Alternative 2 are presented in Table 5-1.
Table 5-1 Principal Dimensions of the Proposed Alternative 2 Diversion Channel
Average bottom width 100 ft.
Side Slope (H:V) 2.5:1
Average Width of ROW (right of way) 300 ft.
Levee Height (toe to top) 15 ft. (upstream) – 11 ft. (downstream)
The top of the levee was designed to be at least 3 ft. above the water surface at all times during the diversion.
The diversion structure was conceptually designed to maximize the highest possible diversion from the North Fork Skagit River during the period of ebb tide and to maximize freshwater inflow in the drainage system. The conceptual design of the diversion structure is shown in Figure 5-7. The preliminary design parameters for the diversion structure are given in Table 5-2:
Table 5-2 Preliminary Design Parameters for the North Fork Diversion Structure
Overflow Weir 18-ft. high, 225 ft. wide
7 gates 12.5 ft. (width) by 5 ft. (height)
Side Slopes 2.5:1
Figure 5-7 shows a conceptual design for the proposed diversion structure that would allow the North Fork water to be diverted into the diversion channel.
It is important to note that Alternative 2 separates Drainage System B into two parts, east and west of the diversion channel. During existing condition, major water conveyance is east to west. Following construction of Alternative 2, the drainage would be altered.

5-9
FIGURE 5-6 Alternative 2 – Diversion Channel to Skagit Bay
at Hall Slough
Skagit Watershed Council Mount Vernon, WA
Diversion Structure
Gated Structure

5-10
FIGURE 5-7 Preliminary Concept of Diversion Structure at
North Fork Skagit River for Alternative 2
Skagit Watershed Council Mount Vernon, WA

5-11
For the region west of the diversion channel, the flow would be directed westward to the Rawlins Road tide gate during high flow, and eastward into the diversion channel during low flow. For the drainage east of the diversion channel, the flow would be directed eastward to Browns Slough during high flow in the and westward into the diversion channel during low flow.
A maximum flow rate of 2,750 cfs was assumed for the diversion from the North Fork Skagit River. This roughly corresponds to approximately 40% of the freshwater flow in the North Fork, assuming a 60:40 split between North Fork and South Fork flow, for a typical Skagit River summer flow of 12,000 cfs. The diversion flow time history was generated as a function of tidal elevation in the bayfront near the end of Hall Slough based on the tide gate rating curve. Maximum diversion flow occurs near low tide and minimum flow occurs near high tide (Figure 5-8). For simplicity, the diversion flow time history was generated based on tidal elevation on June 9, 2005 and applied to the entire simulation period from June 6 to 23, 2005. Preliminary UNET runs show the interior drainage improves in regions east as well as west of the diversion channel since water drains out of Drainage System B faster than it does during the existing condition. Figure 5-8 also shows a snapshot of water surface profiles along the main drainage route from the Rawlins Road tide gate to the pump station at Browns Slough. The water surface elevations for Alternative 2 are at times nearly 0.5 ft. lower than in the existing condition, indicating faster and more efficient drainage.
Once the diversion flow from the North Fork of the Skagit River to the bayfront at the end of the existing Hall Slough was estimated, the Skagit Bay hydrodynamic model was applied to simulate the effect of Alternative 2 on the salinity distribution along the bayfront. For simplicity, the effect of Alternative 2 was simulated by withdrawing water from the North Fork at the starting location of the diversion channel and discharging the same amount of freshwater into the bayfront at the end of the Hall Slough to ensure mass balance. The model geometry, therefore, was not modified. The model boundary conditions were modified by adding outflow at the North Fork and inflow at the Hall Sough end.
Comparison of 2-D surface salinity and velocity distributions between the existing condition and Alternative 2 near the mouth of Hall Slough during ebb tide is shown in Figure 5-9. A strong jet current associated with a freshwater plume from Hall Slough to the bayfront was seen due to the discharge from the diversion channel. Comparisons of surface salinity time series at a location about 1,200 m from the diversion channel discharge point at the end of Hall Slough for existing condition and Alternative 2 are shown in Figure 5-10. The figure shows that salinities are reduced significantly during flood and ebb tidal phases in Alternative 2. The mean salinity for Alternative 2 for the two-day comparison period (June 10 -11, 2005) was 5.34 ppt, which is significantly reduced compared to the mean salinity of 21.44 ppt in the existing condition.
5.2.3 Restoration Alternative 3 - Dike Setback at the Northwest Corner of Fir Island
Alternative 3 involves restoration of tidal flows over a piece of land currently used for agriculture by setting the dike back at the northwest corner of Fir Island. This would provide more tidal marsh area for salmon habitat. The proposed dike aligns with an existing irrigation channel and avoids crossing existing residential properties. The proposed dike configuration is shown in Figure 5-11. This alternative would change the hydrology of Drainage System B because of the change in the drainage area at the northwest corner of Fir Island. However, the reduction of the drainage area is small compared to the total drainage

5-12
FIGURE 5-8 Comparison of Water Surface Profiles in
Drainage System B
Skagit Watershed Council Mount Vernon, WA
Tida
l Ele
vatio
n (m
)
-3
-2
-1
0
1
2
3
Date
6/9/05 6/10/05 6/11/05 6/12/05 6/13/05
Flow
(cfs
)
0
500
1000
1500
2000
2500
3000
Diversion FlowSkagit Bay Tidal Elevation
Note: • This figure shows a snapshot of water
surface profiles along a drainage route from Rawlins Road tide gate to pump station at Browns Slough.

5-13
FIGURE 5-9 Comparison of Surface Salinity and Velocity –
Existing Condition and Alternative 2
Skagit Watershed Council Mount Vernon, WA
Alternative 2 Existing Condition
Note: • Model result corresponds to ebb tide on 06/08/2005 • Indicates dry area.

5-14
FIGURE 5-10 Comparison of Salinity Time Histories –
Existing Condition and Alternative 2
Skagit Watershed Council Mount Vernon, WA
Station S2
Date
6/10/05 6/11/05 6/12/05
Sal
inity
(ppt
)
0
10
20
30
ExistingAlternative 2
S2S2

5-15
FIGURE 5-11 Alternative 3 – Dike Setback at Northwest Corner
of Fir Island
Skagit Watershed Council Mount Vernon, WA
New DikeNew Dike

5-16
and the overall effect is expected to be very small. With a leaking Rawlins Road tide gate repaired, the impact of this change on the hydraulic circulation in the interior channel would be minimal. Therefore, hydraulic analysis in the interior system is not presented.
To simulate the hydrodynamics in Alternative 3, model grid and geometry for the existing condition were modified corresponding to the dike setback shown in Figure 5-11. The farmland, which in the exist-ing condition was outside the model domain, was now included in the model as shown in Figure 5-12. The bottom elevations inside the new modeled area were interpolated based on LIDAR data. Due to the subsidence of the farmland, ground elevations outside the existing dike were higher than elevations within the farmland. To ensure efficient water exchange between North Fork and Skagit Bay through the restored region, ground elevations outside the farmland just south of Rawlins Road were reduced to grade levels. The model setup and boundary conditions in Alternative 3 remained the same as the model calibration specifications.
Comparison of surface salinity and velocity distributions between existing condition and Alternative 3 near the diversion region during ebb tide is shown in Figure 5-13. Comparison of model results showed that velocities in Alternative 3 increased in the North Fork channel upstream of the restoration area. This was due to the new restored area at the mouth of North Fork Skagit River, allowing more freshwater to flow through to the bayfront. This effect was similar to that observed in Alternative 1, but the diversion was wider and had much higher flows. As compared to surface salinity distribution in the existing condition, with this alternative a freshwater plume from the restored area was seen to travel clearly to the bayfront region of interest. Comparison of predicted surface salinity time histories between existing condition and Alternative 3 at a location along the bayfront is presented in Figure 5-14. The location is about 800 m from the south end of the restored area. Model results showed that mean salinity dropped from 20.36 ppt for existing condition to 14.62 ppt for Alternative 3 at the selected location.
5.2.4 Restoration Alternative 4 - A Natural Channel near the River Mouth
Near the mouth of the river, the North Fork branch takes a sharp turn to the north before turning west again. It appears that the channel geometry, tidal action, and sediment dynamics have caused erosion near the bend. Over time it is possible that a natural breach could occur that would allow freshwater to flow in a southerly direction. Alternative 4 simulates a natural opening of the channel near the mouth of the North Fork Skagit River to investigate the effects on nearshore salinity distribution. Since this alternative only involves modification of channel geometry outside Fir Island, the interior hydraulic analysis is not repeated.
Selection of the location of the new channel opening was based on the orientation of the existing main channel and surrounding bathymetric information. Bathymetry in the model was modified to create a new channel near the mouth as shown in Figure 5-15. Comparison of the bathymetry between existing condition and Alternative 4 is also shown. The model setup and boundary conditions were the same as the model calibration specifications.
Comparison of surface salinity and velocity distributions between existing condition and Alternative 4 during ebb tide is shown in Figure 5-16. Although salinity was reduced and velocity increased near the opening of the new channel compared to existing condition, the overall changes, especially near the bayfront, were small. Comparison of predicted surface salinity time histories between existing condition

5-17
FIGURE 5-12
Modified Model Grid and Geometry – Alternative 3
Skagit Watershed Council Mount Vernon, WA
Existing Dike
New Dike
Existing Dike
New Dike

5-18
FIGURE 5-13 Comparison of Surface Salinity and Velocity –
Existing Condition and Alternative 3
Skagit Watershed Council Mount Vernon, WA
Alternative 3 Existing Condition
Note: • Model result corresponds to ebb tide on 06/08/2005 • Indicates dry area.

5-19
FIGURE 5-14 Comparison of Salinity Time Histories –
Existing Condition and Alternative 3
Skagit Watershed Council Mount Vernon, WA
Station S3
Date
6/10/05 6/11/05 6/12/05
Sal
inity
(ppt
)
0
10
20
30
ExistingAlternative 3

5-20
FIGURE 5-15 Alternative 4 – A Natural Channel near the
River Mouth
Skagit Watershed Council Mount Vernon, WA
Alternative 4 Existing Condition

5-21
FIGURE 5-16 Comparison of Surface Salinity and Velocity –
Existing Condition and Alternative 4
Skagit Watershed Council Mount Vernon, WA
Alternative 4 Existing Condition
Note: • Model result corresponds to ebb tide on 06/08/2005 • Indicates dry area.

5-22
FIGURE 5-17 Comparison of Salinity Time Histories –
Existing Condition and Alternative 4
Skagit Watershed Council Mount Vernon, WA
S4S4
Station S4
Date
6/10/05 6/11/05 6/12/05
Sal
inity
(ppt
)
0
10
20
30
ExistingAlternative 4

5-23
and Alternative 4 at a location along the bayfront is shown in Figure 5-17. The location is about 1,100 m south of the diversion channel. Again, the time history comparison showed that the salinity reduction in Alternative 4 was quite small compared to existing condition. Model results showed that mean salinity dropped significantly from 14.9 ppt for existing condition to 5.1 ppt for Alternative 4 at the selected location.
5.2.5 Restoration Alternative 5 - Diversion to Skagit Bay along Browns Slough
This alternative is very similar to Alternative 2, except the diversion channel was placed along the existing Browns Slough as shown in Figure 5-18. The diversion structure and flow rate used in this alternative was assumed to be the same as in Alternative 2 (see Figure 5-8). The model inflow and outflow boundaries were modified by placing the withdrawal location at the confluence of Browns Slough and the North Fork, and the discharge location was placed at the end of the Browns Slough. The motivation for investigating this alternative was that it would allow freshwater to be discharged about midway between the North and South Forks, thereby allowing the retention time of brackish water to be sustained longer before being flushed to the north.
A comparison of 2-D surface salinity and velocity distributions between existing condition and Alternative 5 near the mouth of Browns Slough during ebb tide on June 8, 2005 is shown in Figure 5-19. A strong freshwater plume emanating from Browns Slough to the bayfront was seen due to the discharge of diversion flow. Comparison of surface salinity time series at a location around 1,100 m from the diversion discharge point at the end of Browns Slough for existing condition and Alternative 5 is shown in Figure 5-20. The figure shows that salinities were reduced significantly during ebb tidal phases in Alternative 5. The mean salinities for Alternative 5 for the two-day comparison period was 5.1 ppt, which represents a reduction in salinity of about 66.1% compared to existing condition (15.3 ppt). The effect of this alternative on salinity distribution in bayfront was similar to Alternative 2 as described in Section 5.2.2.

5-24
FIGURE 5-18 Alternative 5 – Diversion to Skagit Bay along
Browns Slough
Skagit Watershed Council Mount Vernon, WA
GatedStructure
DiversionStructure
GatedStructure
DiversionStructure

5-25
FIGURE 5-19 Comparison of Surface Salinity and Velocity –
Existing Condition and Alternative 5
Skagit Watershed Council Mount Vernon, WA
Alternative 5 Existing Condition
Note: • Model result corresponds to ebb tide on 06/08/2005 • Indicates dry area.

5-26
FIGURE 5-20 Comparison of Salinity Time Histories –
Existing Condition and Alternative 5
Skagit Watershed Council Mount Vernon, WA
S5S5
Station S5
Date
6/10/05 6/11/05 6/12/05
Sal
inity
(ppt
)
0
10
20
30
ExistingAlternative 5

6-1
6.0 Summary and Conclusions
A hydrologic and hydrodynamic assessment was conducted in support of SWC and the North Fork Skagit River Restoration project team’s efforts to evaluate the feasibility of achieving restoration goals through modifications of the Fir Island dike near the Rawlins Road Project Site at the northwest corner of the delta. The study had four major goals that included restoring marsh habitat, improving salinity conditions in the nearshore habitat, increasing conveyance and passage, and minimizing impacts on current land use. In addition, the project team saw this as an opportunity to improve drainage conditions in the farmland inside the Fir Island dikes.
To assist in evaluating the impacts of proposed restoration alternatives, predictive numerical models were developed for the Skagit River estuary and Skagit Bay, and the Fir Island watershed associated with the Rawlins Road study area. The hydrodynamic model, FVCOM, and the hydrologic/hydraulic models, HEC_HMS and UNET, were used for this analysis. The hydrodynamic model was driven by a combination of tides, freshwater discharges, and surface-wind stresses using existing data. The model was set up using observed tide, current, and salinity data collected for this study area for a period of 14 days. The hydrologic model, HEC-HMS provided runoff from rainfall data, and the hydraulic model UNET, was used to route flows in the agricultural drainage canals inside Island dikes. Both models were calibrated to data collected in the summer of 2005. This represents a dry, low-river flow condition and may be considered a baseline critical condition during which there is a minimum supply of freshwater to the site. The models were then applied for five different alternatives that evaluated cross-island diversions, breaches, and dike removal near the Rawlins Road study area.
The overall conclusion is that it is feasible to improve salinities and freshwater conveyance along the bayfront of the Fir Island dike through modifications to the North Fork branch of the river. In its current condition, the North Fork of the Skagit River is constrained on both banks by dikes that direct the flow of freshwater away from the target habitat in the bayfront region. The alternative diversions and dike modifications considered in this analysis showed potential for freshwater to be re-directed towards the bayfront for restoration of marsh habitat. The study also showed that drainage issues currently faced by the Fir Island agricultural community could be addressed effectively as part of the restoration efforts through modifications, repair, and maintenance of canals and hydraulic structures that control the routing and distribution of flows in the system.
The specific conclusions of the study based on model calibration and application efforts are as follows:
• A major finding of this study was that freshwater plumes generated by the North and South Forks of the Skagit River are subjected to complex hydrodynamics that cause the freshwater plumes to remain separated and directed away from the bayfront between the two forks. The model results provide an explanation for higher salinities along the bayfront.
o The North Fork dikes direct North Fork freshwater towards the northwest corner of Skagit Bay

6-2
o The South Fork freshwater plume is entrained in the southwest portion of Skagit Bay as a result of currents being directed through the deep channel of Skagit Bay along the Whidbey Island shoreline, diluting and transporting freshwater to the south.
• Model results indicate that diversions reconnecting the North Fork and Skagit Bay through Hall Slough (Alternative 2) and Browns Slough (Alternative 5) have a high potential for improving the estuarine habitat along the bayfront area between the North Fork and South Fork by reducing the nearshore water salinities.
o The goal of providing conveyance and the accompanying nutrient and sediment loads is also accomplished by providing a supply of freshwater to the bayfront areas from the North Fork.
• The study showed that the flow in the North Fork of Skagit River is trained by dikes on either bank. The dikes have eliminated the network of estuarine channels associated with this branch. As a result the river flow bypasses the bayfront and discharges to Skagit Bay just east of Goat Island. This causes out-migrating fish to be released farther downstream into Skagit Bay than is desirable.
o Diversions would provide direct migration pathway for the salmonids to the bayfront marshes. Supply of this freshwater and the associated sediment and nutrients will help restore the bayfront marshes.
• The dike setback in Alternative 3 has a potential to produce significant changes in the hydrodynamic behavior of the system. Removing the dike provides an outlet for the North Fork flow, currently restricted by the dikes. Initially, the strength of the flow through this pathway may be controlled by the presence of the elevated mud flat bathymetry west of the existing dike (SRSC Lidar data). However, this sill like blockage would likely erode and form a deeper channel with a capacity to carry a much larger flow than the results shown in this report. Sensitivity test with a larger and deeper channel shows that total flow through the North Fork could then increase, which in turn could reduce the flow through the South Fork. Also, velocities in the North Fork channel downstream of the project may reduce relative to existing condition. This could lead to increased sedimentation and possible impact the restoration efforts in connection with Swinomish Channel currently under investigation by SRSC. While this alternative will produce the most benefit in terms of improving salinity and conveyance, its consequence on other reaches of the system requires a more thorough and cautious investigation.
• Drainage of interior agricultural canals could be improved through the following actions:
o Repairing the malfunctioning tide gates that allows higher salinity Skagit Bay water to enter the interior agricultural system.
o Maintaining the canals by removing accumulated sediments.
o Eliminating constrictions caused by improperly sized culverts, although this did not appear to be the case in the study area.

7-1
7.0 References
Chen C, H Liu, and RC Beardsley. 2003. “An Unstructured, Finite-Volume, Three-Dimensional,
Primitive Equation Ocean Model: Application to Coastal Ocean and Estuaries.” J. Atm. & Oceanic Tech. 20:159-186.
Chen C, J Zhu, L Zheng, E Ralph, and JW Budd. 2004. “A Non-Orthogonal Primitive Equation Coastal
Ocean Circulation Model: Application to Lake Superior.” J. Great Lakes Res. 30 (Supple-ment 1), 41-54.
Downing, J., 1983. “The coast of Puget Sound: It’s process and development.” Puget Sound Books,
Washington
Day JW, J Rybczyk, F Scartonb, A Rismondob, D Areb, and G Cecconic. 1999. “Soil Accretionary Dynamics, Sea-Level Rise and the Survival of Wetlands in Venice Lagoon: A Field and Modeling Approach.” Estuarine Coastal and Shelf Science 49(5):607-628.
French JR and NJ Clifford. 2000. “Hydrodynamic Modeling as a Basis for Explaining Estuarine Environmental Dynamics: Some Computational and Methodological Issues.” Hydrological Processes 14(11-12):2089-2108.
Moller I, T Spencer, JR French, DJ Leggett, and M Dixon. 1999. “Wave Transformation over Salt Marshes: A Field and Numerical Modeling Study from North Norfolk, England.” Estuarine Coastal and Shelf Science 49(3):411-426.
Philip Williams and Associates, LTD (PWA), 2004. An Assessment of Potential Habitat Restoration Pathways for Fir Island, Washington, working document, prepared for Skagit Watershed Council, Mt. Vernon, Washington.
Philip Williams and Associates, LTD (PWA), 2000. Browns Hall Slough Restoration Feasibility Study, Technical Memorandum to Skagit Watershed Council, December 29, 2000, Mt. Vernon, Washington.
Pickett, P.J. 1997. Lower Skagit River Total Maximum Daily Load Water Quality Study. Publication Number 97-326, Washington Department of Ecology, Olympia, WA.
Smith, C.J., E. Manary, The Western Washington Agricultural Association, G. Hood. 1995. House Bill 1418 Report: Tidegates and Intertidal Salmon Habitat in the Skagit Basin.
USACE. 2002a. U.S. Army Corps of Engineers, HEC-RAS, River Analysis System, User’s Manual, Version 3.1.
USACE. 2002b. U.S. Army Corps of Engineers, HEC-RAS, Rivers Analysis System, Applications Guide, Version 3.1.

7-2
USACE. 2002c. U.S. Army Corps of Engineers, HEC-RAS, Rivers Analysis System, Hydraulic Reference Manual, Version 3.1.
USACE. 2004. U.S. Army Corps of Engineers Draft Report, Skagit River Flood Damage Reduction
Study. Hydraulic Technical Documentation.
USACE. 2000. U.S. Army Corps of Engineers, Hydrologic Modeling System HEC-HMS: Technical Reference Manual. U.S. Army Corps of Engineers, Davis, California. March 2000.
Zheng L, C Chen, and H Liu. 2003. “A Modeling Study of the Satilla River Estuary, Georgia. Part I: Flooding/Drying Process and Water Exchange Over the Salt Marsh-Estuary-Shelf Complex.” Estuaries 26(3):651-669.