hydrogen 21-cm emission line-final
TRANSCRIPT
8/8/2019 Hydrogen 21-Cm Emission Line-final
http://slidepdf.com/reader/full/hydrogen-21-cm-emission-line-final 1/10
The 21-cm Line: The Hydrogen 21-cm Emission Line
Demystifying Scientific Data: RET 2006, Rev 2 167
The Hydrogen 21-cm Emission Line*
GasAbout 99% of the interstellar medium (ISM) is gas: About 90% atomic or
molecular hydrogen, 10% helium, and traces of other elements. Dust scatters andabsorbs visible light much more than a gas. The interstellar gas can be seen when you look at the spectral lines of a binary star system. Among the broad lines thatshift as the two stars orbit each other, there are narrow lines that do not move.The narrow lines are from much colder gas in the interstellar medium between usand the binary system.
The hydrogen gas is observed in a variety of states: ionized, neutral atomic andmolecular forms. The ionized hydrogen emits visible light as the electrons combinewith the protons to form neutral hydrogen. Both neutral atomic and molecularhydrogen emit in the radio region of the electromagnetic spectrum.
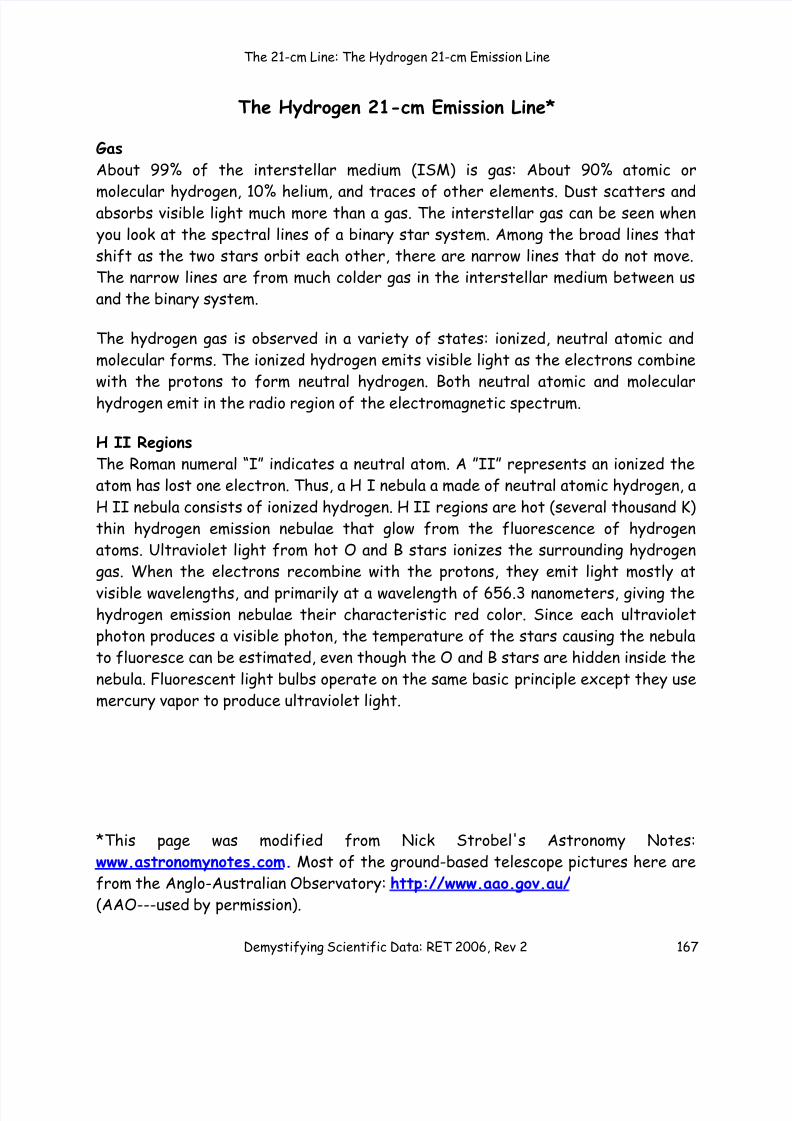
H II RegionsThe Roman numeral “I” indicates a neutral atom. A ”II” represents an ionized theatom has lost one electron. Thus, a H I nebula a made of neutral atomic hydrogen, aH II nebula consists of ionized hydrogen. H II regions are hot (several thousand K)thin hydrogen emission nebulae that glow from the fluorescence of hydrogenatoms. Ultraviolet light from hot O and B stars ionizes the surrounding hydrogengas. When the electrons recombine with the protons, they emit light mostly atvisible wavelengths, and primarily at a wavelength of 656.3 nanometers, giving thehydrogen emission nebulae their characteristic red color. Since each ultravioletphoton produces a visible photon, the temperature of the stars causing the nebulato fluoresce can be estimated, even though the O and B stars are hidden inside thenebula. Fluorescent light bulbs operate on the same basic principle except they usemercury vapor to produce ultraviolet light.
*This page was modified from Nick Strobel's Astronomy Notes:www.astronomynotes.com. Most of the ground-based telescope pictures here arefrom the Anglo-Australian Observatory: http://www.aao.gov.au/ (AAO---used by permission).
8/8/2019 Hydrogen 21-Cm Emission Line-final
http://slidepdf.com/reader/full/hydrogen-21-cm-emission-line-final 2/10
The 21-cm Line: The Hydrogen 21-cm Emission Line
Demystifying Scientific Data: RET 2006, Rev 2 168
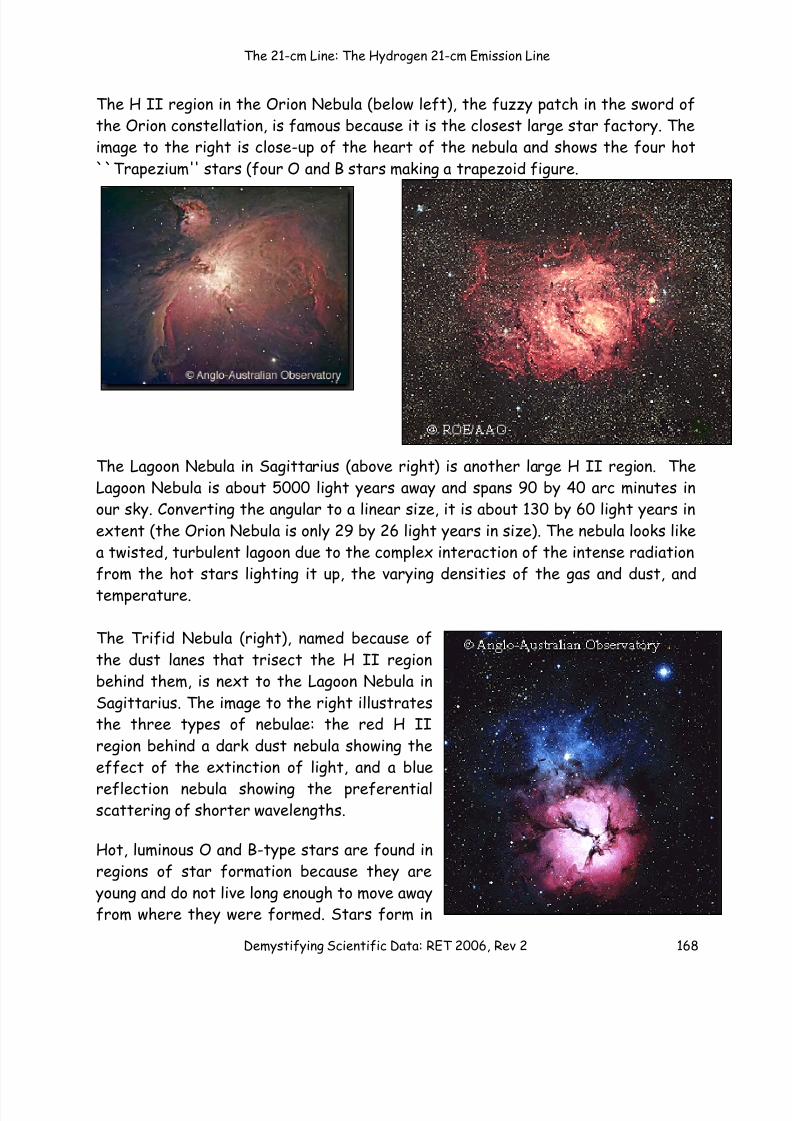
The H II region in the Orion Nebula (below left), the fuzzy patch in the sword ofthe Orion constellation, is famous because it is the closest large star factory. Theimage to the right is close-up of the heart of the nebula and shows the four hot``Trapezium'' stars (four O and B stars making a trapezoid figure.
The Lagoon Nebula in Sagittarius (above right) is another large H II region. TheLagoon Nebula is about 5000 light years away and spans 90 by 40 arc minutes inour sky. Converting the angular to a linear size, it is about 130 by 60 light years inextent (the Orion Nebula is only 29 by 26 light years in size). The nebula looks likea twisted, turbulent lagoon due to the complex interaction of the intense radiationfrom the hot stars lighting it up, the varying densities of the gas and dust, andtemperature.
The Trifid Nebula (right), named because ofthe dust lanes that trisect the H II regionbehind them, is next to the Lagoon Nebula inSagittarius. The image to the right illustratesthe three types of nebulae: the red H IIregion behind a dark dust nebula showing theeffect of the extinction of light, and a bluereflection nebula showing the preferentialscattering of shorter wavelengths.
Hot, luminous O and B-type stars are found inregions of star formation because they are
young and do not live long enough to move awayfrom where they were formed. Stars form in
8/8/2019 Hydrogen 21-Cm Emission Line-final
http://slidepdf.com/reader/full/hydrogen-21-cm-emission-line-final 3/10
The 21-cm Line: The Hydrogen 21-cm Emission Line
Demystifying Scientific Data: RET 2006, Rev 2 169
clusters, and where O and B stars are found, there are smaller, lower-mass starsstill forming. The spectra of H II regions are much simpler than star spectra sothey are easier to decipher. The composition and conditions inside the H II regionsare also easier to determine and understand than for stars. So H II regions
provide a valuable tool for understanding the history of star formation in a galaxy.H II regions also provide a convenient way to map the structure of a galaxybecause they are so large and luminous. In our galaxy the H II regions aredistributed in a spiral pattern. The best wavelengths to use to map the distributionof hydrogen, however, are in the radio region and not the red emission line ofhydrogen which is absorbed by dust. Most of the hydrogen gas is not ionizedbecause O and B stars are rare, but radio waves pass easily through dust.
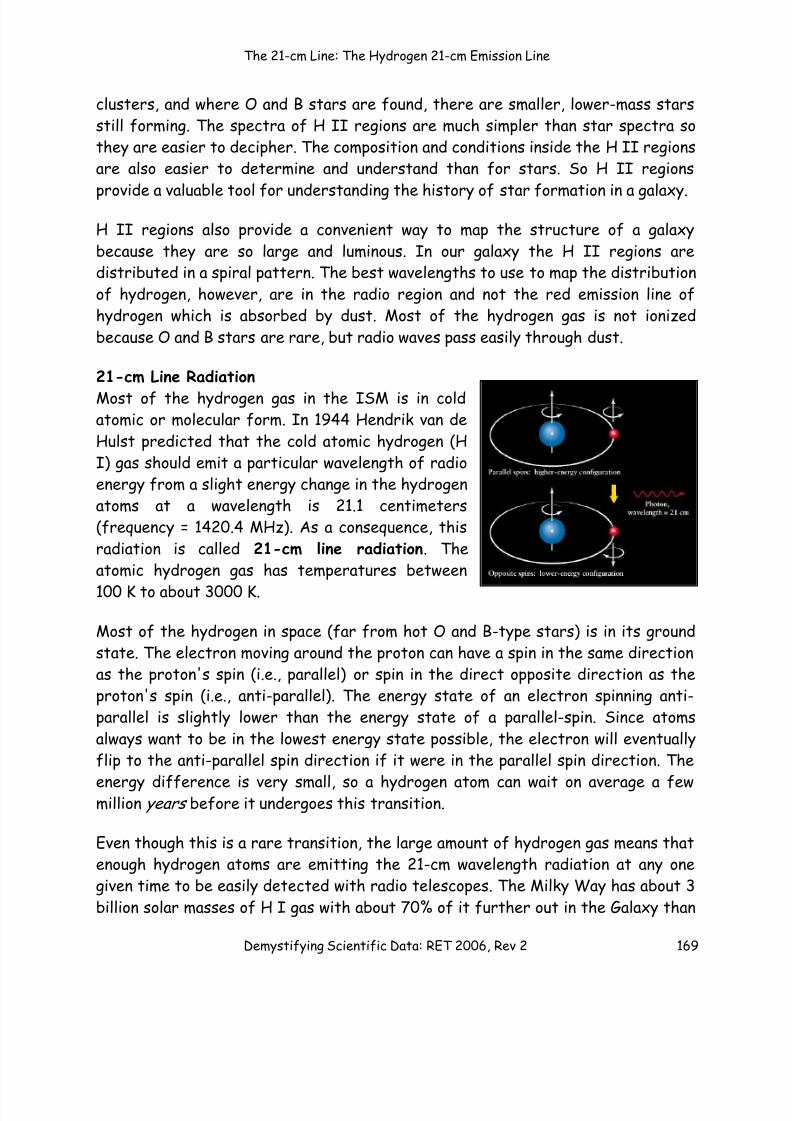
21-cm Line RadiationMost of the hydrogen gas in the ISM is in coldatomic or molecular form. In 1944 Hendrik van deHulst predicted that the cold atomic hydrogen (HI) gas should emit a particular wavelength of radioenergy from a slight energy change in the hydrogenatoms at a wavelength is 21.1 centimeters(frequency = 1420.4 MHz). As a consequence, thisradiation is called 21-cm line radiation . Theatomic hydrogen gas has temperatures between100 K to about 3000 K.
Most of the hydrogen in space (far from hot O and B-type stars) is in its groundstate. The electron moving around the proton can have a spin in the same directionas the proton's spin (i.e., parallel) or spin in the direct opposite direction as theproton's spin (i.e., anti-parallel). The energy state of an electron spinning anti-parallel is slightly lower than the energy state of a parallel-spin. Since atomsalways want to be in the lowest energy state possible, the electron will eventuallyflip to the anti-parallel spin direction if it were in the parallel spin direction. The
energy difference is very small, so a hydrogen atom can wait on average a fewmillionyears before it undergoes this transition.
Even though this is a rare transition, the large amount of hydrogen gas means thatenough hydrogen atoms are emitting the 21-cm wavelength radiation at any onegiven time to be easily detected with radio telescopes. The Milky Way has about 3billion solar masses of H I gas with about 70% of it further out in the Galaxy than
8/8/2019 Hydrogen 21-Cm Emission Line-final
http://slidepdf.com/reader/full/hydrogen-21-cm-emission-line-final 4/10
The 21-cm Line: The Hydrogen 21-cm Emission Line
Demystifying Scientific Data: RET 2006, Rev 2 170
the Sun. Most of the H I gas is in disk component of our galaxy and is locatedwithin 720 light years from the midplane of the disk. What's nice is that 21-cmline radiation is not blocked by dust! The 21-cm line radiation provides the bestway to map the structure of the Galaxy.
Using 21-cm line radiation to Map the GalaxyThe intensity of the 21-cm emission line depends on the density of the neutralatomic hydrogen along your line of sight. Atomic hydrogen all along the line of sightwill contribute to the energy received. You will need a way to determine thedistance to each clump of hydrogen gas. Then when you observe the Galaxy indifferent directions, you can get a three-dimensional picture of the Galaxy.
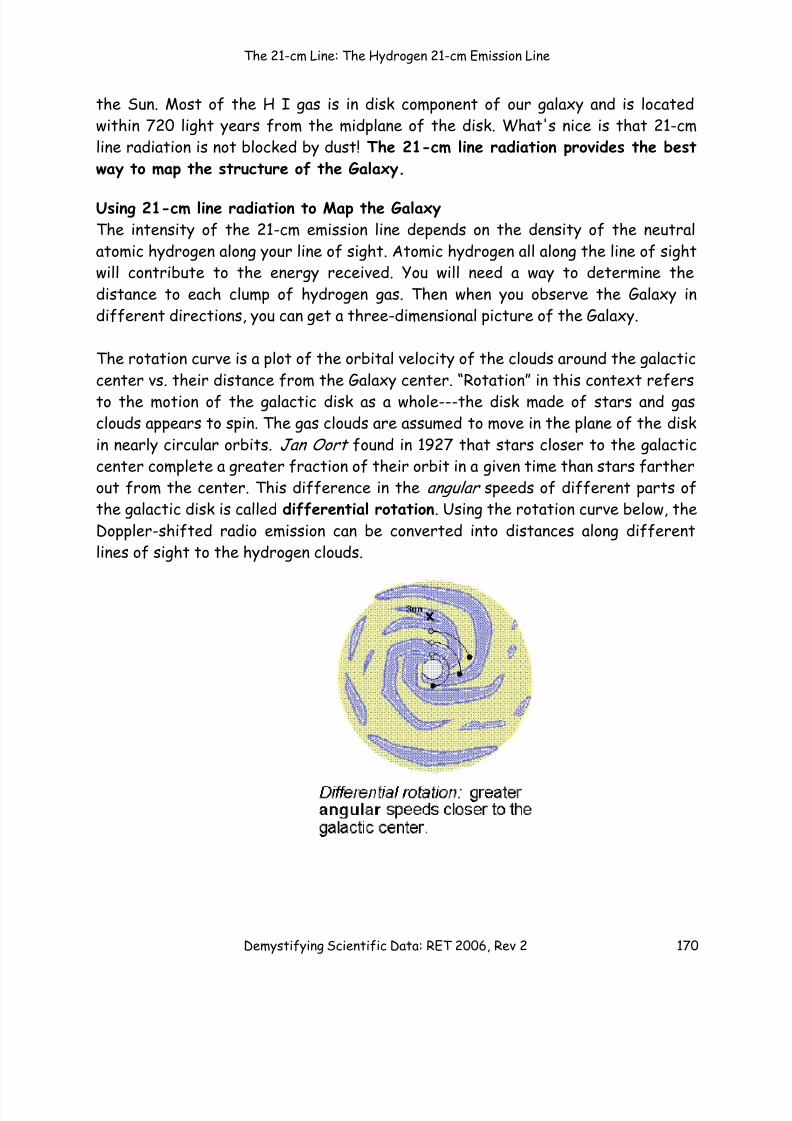
The rotation curve is a plot of the orbital velocity of the clouds around the galacticcenter vs. their distance from the Galaxy center. “Rotation” in this context refersto the motion of the galactic disk as a whole---the disk made of stars and gasclouds appears to spin. The gas clouds are assumed to move in the plane of the diskin nearly circular orbits. Jan Oort found in 1927 that stars closer to the galacticcenter complete a greater fraction of their orbit in a given time than stars fartherout from the center. This difference in the angular speeds of different parts ofthe galactic disk is called differential rotation . Using the rotation curve below, theDoppler-shifted radio emission can be converted into distances along differentlines of sight to the hydrogen clouds.
8/8/2019 Hydrogen 21-Cm Emission Line-final
http://slidepdf.com/reader/full/hydrogen-21-cm-emission-line-final 5/10
The 21-cm Line: The Hydrogen 21-cm Emission Line
Demystifying Scientific Data: RET 2006, Rev 2 171
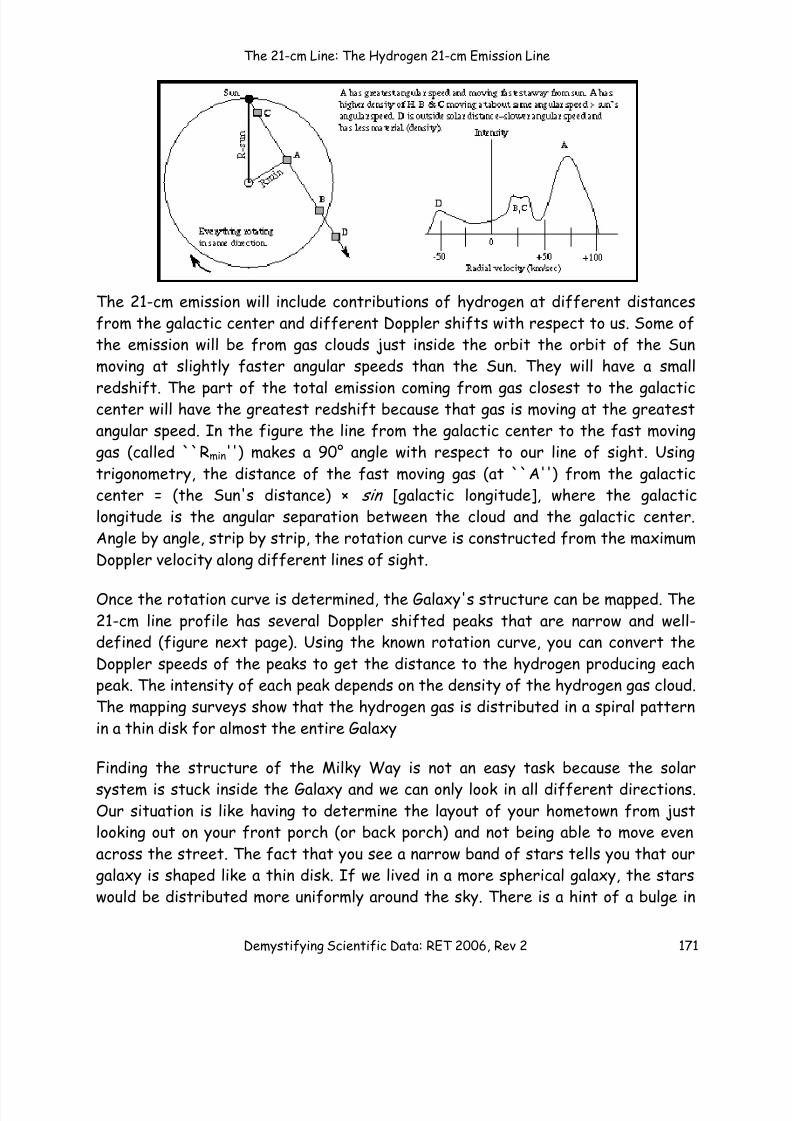
The 21-cm emission will include contributions of hydrogen at different distancesfrom the galactic center and different Doppler shifts with respect to us. Some ofthe emission will be from gas clouds just inside the orbit the orbit of the Sunmoving at slightly faster angular speeds than the Sun. They will have a small
redshift. The part of the total emission coming from gas closest to the galacticcenter will have the greatest redshift because that gas is moving at the greatestangular speed. In the figure the line from the galactic center to the fast movinggas (called ``R min'') makes a 90° angle with respect to our line of sight. Usingtrigonometry, the distance of the fast moving gas (at ``A'') from the galacticcenter = (the Sun's distance) × sin [galactic longitude], where the galacticlongitude is the angular separation between the cloud and the galactic center.Angle by angle, strip by strip, the rotation curve is constructed from the maximumDoppler velocity along different lines of sight.
Once the rotation curve is determined, the Galaxy's structure can be mapped. The21-cm line profile has several Doppler shifted peaks that are narrow and well-defined (figure next page). Using the known rotation curve, you can convert theDoppler speeds of the peaks to get the distance to the hydrogen producing eachpeak. The intensity of each peak depends on the density of the hydrogen gas cloud.The mapping surveys show that the hydrogen gas is distributed in a spiral patternin a thin disk for almost the entire Galaxy
Finding the structure of the Milky Way is not an easy task because the solarsystem is stuck inside the Galaxy and we can only look in all different directions.Our situation is like having to determine the layout of your hometown from justlooking out on your front porch (or back porch) and not being able to move evenacross the street. The fact that you see a narrow band of stars tells you that ourgalaxy is shaped like a thin disk. If we lived in a more spherical galaxy, the starswould be distributed more uniformly around the sky. There is a hint of a bulge in
8/8/2019 Hydrogen 21-Cm Emission Line-final
http://slidepdf.com/reader/full/hydrogen-21-cm-emission-line-final 6/10
The 21-cm Line: The Hydrogen 21-cm Emission Line
Demystifying Scientific Data: RET 2006, Rev 2 172
the direction of the Sagittarius constellation. Careful star counts and determiningtheir distances shows hints of a spiral pattern in the disk. The interstellar dustlimits our view a small section of the Galaxy. However, clear evidence of the spiralstructure in the disk comes from the 21-cm line radiation.
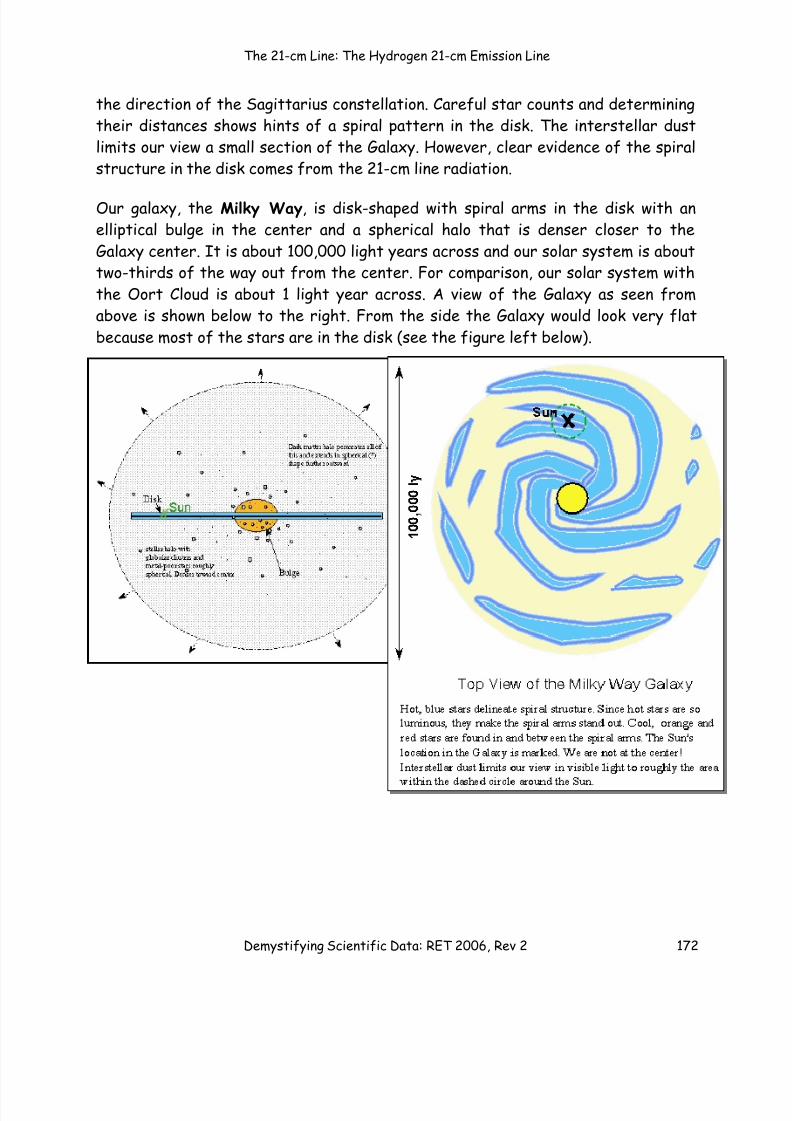
Our galaxy, the Milky Way , is disk-shaped with spiral arms in the disk with anelliptical bulge in the center and a spherical halo that is denser closer to theGalaxy center. It is about 100,000 light years across and our solar system is abouttwo-thirds of the way out from the center. For comparison, our solar system withthe Oort Cloud is about 1 light year across. A view of the Galaxy as seen fromabove is shown below to the right. From the side the Galaxy would look very flatbecause most of the stars are in the disk (see the figure left below).
8/8/2019 Hydrogen 21-Cm Emission Line-final
http://slidepdf.com/reader/full/hydrogen-21-cm-emission-line-final 7/10
The 21-cm Line: The Hydrogen 21-cm Emission Line
Demystifying Scientific Data: RET 2006, Rev 2 173
You can make a rough guess of the number of stars in our galaxy by dividing theGalaxy's total mass by the mass of a typical star (e.g., 1 solar mass). The result isabout 200 billion stars! The actual number of stars could be several tens of billionsless or more than this approximation. Recently, astronomers have discovered that
most of the mass of galaxies is not in the form of stars, gas, or dust. It is made ofsome unknown material and is given the descriptive name “dark matter.” Darkmatter affects your guess of the number of stars in the galaxy! Does it increasethe number or decrease it?
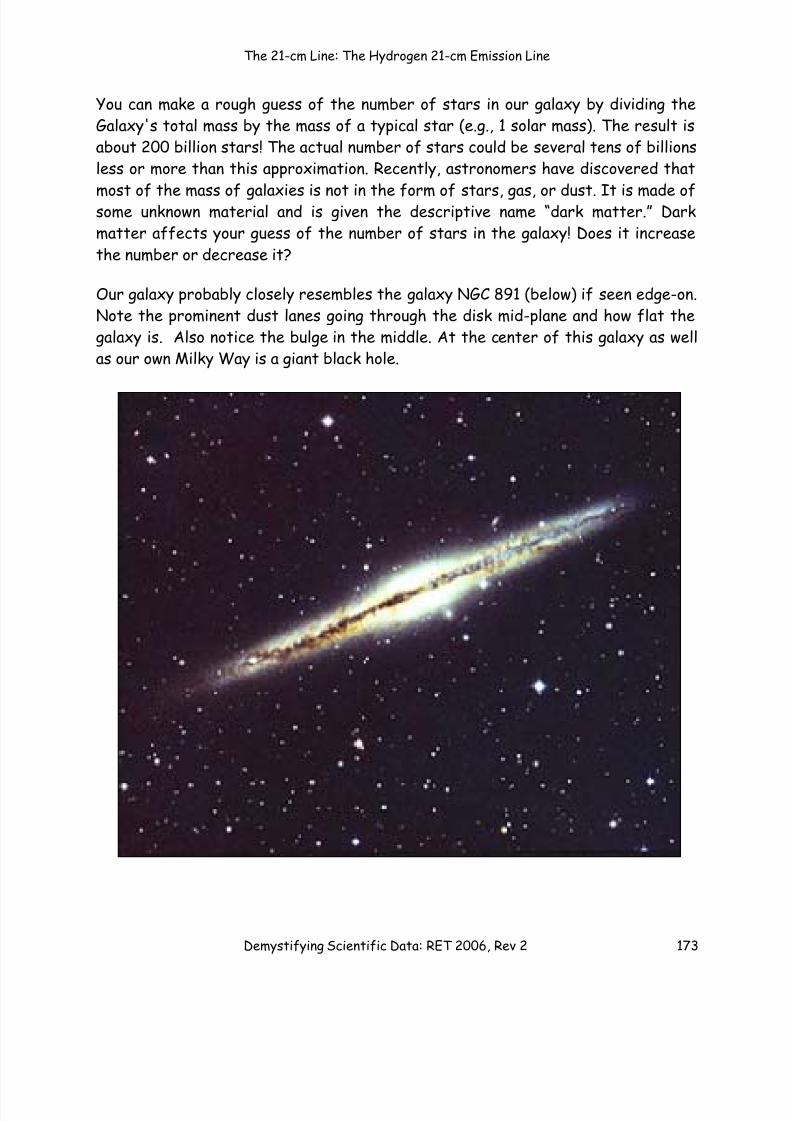
Our galaxy probably closely resembles the galaxy NGC 891 (below) if seen edge-on.Note the prominent dust lanes going through the disk mid-plane and how flat thegalaxy is. Also notice the bulge in the middle. At the center of this galaxy as wellas our own Milky Way is a giant black hole.
8/8/2019 Hydrogen 21-Cm Emission Line-final
http://slidepdf.com/reader/full/hydrogen-21-cm-emission-line-final 8/10
The 21-cm Line: The Hydrogen 21-cm Emission Line
Demystifying Scientific Data: RET 2006, Rev 2 174
Name__________________ Period ________ Date______________
Worksheet on the Hydrogen 21-cm Line
1.
Define the following:• differential rotation:
• H II region:
• rotation curve:
• 21-cm line radiation:
2. What are the characteristics of the gaseous part of the ISM? Is the gas all atthe same temperature and density? How do you know?
3. What are H II regions and how are they produced? What is going on at theatomic level?
8/8/2019 Hydrogen 21-Cm Emission Line-final
http://slidepdf.com/reader/full/hydrogen-21-cm-emission-line-final 9/10
The 21-cm Line: The Hydrogen 21-cm Emission Line
Demystifying Scientific Data: RET 2006, Rev 2 175
4. Why would the presence of a H II region indicate the site of star formation?
5. How does the gas far from any star make its presence seen in the opticalwavelengths and radio wavelengths?
6. How is the 21-cm line radiation produced?
7. Why is the 21-cm line radiation so important for determining galactic structureand mass?
8. How is the 21-cm line radiation used to determine galactic structure and mass?
9. Which part of the Galaxy has greater angular speed? How do you determine therotation curve of the Galaxy from the Doppler shifts of the gas?
8/8/2019 Hydrogen 21-Cm Emission Line-final
http://slidepdf.com/reader/full/hydrogen-21-cm-emission-line-final 10/10
The 21-cm Line: The Hydrogen 21-cm Emission Line
Demystifying Scientific Data: RET 2006, Rev 2 176
10. Where are most of the interstellar molecules found and how are theydetected?
11. What is the importance of the discovery of organic molecules in the interstellarmedium?
12. If the hydrogen molecules produce no radio emission, how do you map itsdistribution over the entire galaxy?