evidence of chromospheric molecular hydrogen emission in
TRANSCRIPT
Evidence of chromospheric molecular hydrogenemission in an IRIS flare
Dr. Sargam Mulay1, Prof. Lyndsay Fletcher1,2
1School of Physics and Astronomy, University of Glasgow, UK
2Rosseland Centre for Solar Physics, University of Oslo, P.O.Box 1029 Blindern, NO-0315 Oslo, Norway
(Mulay S. M., Fletcher L., 2021, MNRAS, 504, 2842)
Dr. Sargam Mulay (email: [email protected]) University of Glasgow, UK (ORCID iD: 0000-0002-9242-2643)
Overview
Dr. Sargam Mulay (email: [email protected]) University of Glasgow, UK (ORCID iD: 0000-0002-9242-2643)
• Formation of molecular hydrogen H2 emission
• Chromospheric H2 emission observed in an IRIS flare
• Summary
• Future research plan
Emission from molecular hydrogen H2 in solar atmosphere
H2 emission
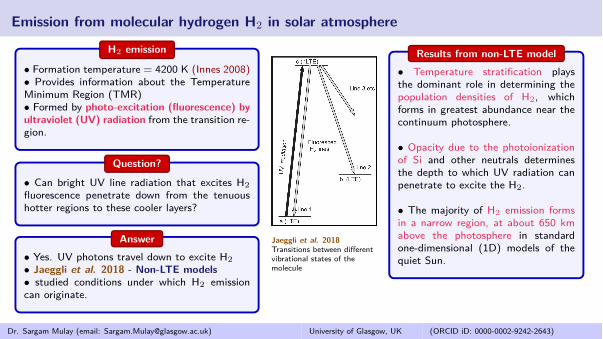
• Formation temperature = 4200 K (Innes 2008)• Provides information about the TemperatureMinimum Region (TMR)• Formed by photo-excitation (fluorescence) byultraviolet (UV) radiation from the transition re-gion.
Question?
• Can bright UV line radiation that excites H2fluorescence penetrate down from the tenuoushotter regions to these cooler layers?
Answer• Yes. UV photons travel down to excite H2• Jaeggli et al. 2018 - Non-LTE models• studied conditions under which H2 emissioncan originate.
Dr. Sargam Mulay (email: [email protected]) University of Glasgow, UK (ORCID iD: 0000-0002-9242-2643)
Jaeggli et al. 2018Transitions between differentvibrational states of themolecule
Results from non-LTE model• Temperature stratification playsthe dominant role in determining thepopulation densities of H2, whichforms in greatest abundance near thecontinuum photosphere.
• Opacity due to the photoionizationof Si and other neutrals determinesthe depth to which UV radiation canpenetrate to excite the H2.
• The majority of H2 emission formsin a narrow region, at about 650 kmabove the photosphere in standardone-dimensional (1D) models of thequiet Sun.
Details of H2 emission lines observed by IRIS in C II and Si IV windows
Dr. Sargam Mulay (email: [email protected]) University of Glasgow, UK (ORCID iD: 0000-0002-9242-2643)
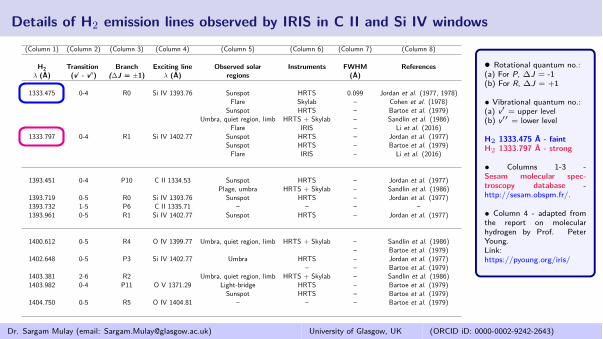
(Column 1) (Column 2) (Column 3) (Column 4) (Column 5) (Column 6) (Column 7) (Column 8)
H2 Transition Branch Exciting line Observed solar Instruments FWHM Referencesλ (A) (v� - v��) (ΔJ = ±1) λ (A) regions (A)
1333.475 0-4 R0 Si IV 1393.76 Sunspot HRTS 0.099 Jordan et al. (1977, 1978)Flare Skylab – Cohen et al. (1978)
Sunspot HRTS – Bartoe et al. (1979)Umbra, quiet region, limb HRTS + Skylab – Sandlin et al. (1986)
Flare IRIS – Li et al. (2016)1333.797 0-4 R1 Si IV 1402.77 Sunspot HRTS – Jordan et al. (1977)
Sunspot HRTS – Bartoe et al. (1979)Flare IRIS – Li et al. (2016)
1393.451 0-4 P10 C II 1334.53 Sunspot HRTS – Jordan et al. (1977)Plage, umbra HRTS + Skylab – Sandlin et al. (1986)
1393.719 0-5 R0 Si IV 1393.76 Sunspot HRTS – Jordan et al. (1977)1393.732 1-5 P6 C II 1335.71 – – – –1393.961 0-5 R1 Si IV 1402.77 Sunspot HRTS – Jordan et al. (1977)
1400.612 0-5 R4 O IV 1399.77 Umbra, quiet region, limb HRTS + Skylab – Sandlin et al. (1986)– Bartoe et al. (1979)
1402.648 0-5 P3 Si IV 1402.77 Umbra HRTS – Jordan et al. (1977)– – Bartoe et al. (1979)
1403.381 2-6 R2 Umbra, quiet region, limb HRTS + Skylab – Sandlin et al. (1986)1403.982 0-4 P11 O V 1371.29 Light-bridge HRTS – Bartoe et al. (1979)
Sunspot HRTS – Bartoe et al. (1979)1404.750 0-5 R5 O IV 1404.81 – – – Bartoe et al. (1979)
• Rotational quantum no.:(a) For P, ΔJ = -1(b) For R, ΔJ = +1
• Vibrational quantum no.:(a) v� = upper level(b) v�� = lower level
H2 1333.475 A - faintH2 1333.797 A - strong
• Columns 1-3 -Sesam molecular spec-troscopy database -http://sesam.obspm.fr/.
• Column 4 - adapted fromthe report on molecularhydrogen by Prof. PeterYoung.Link:https://pyoung.org/iris/
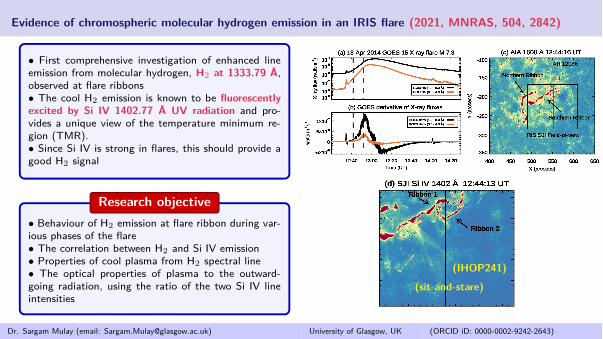
Evidence of chromospheric molecular hydrogen emission in an IRIS flare (2021, MNRAS, 504, 2842)
Dr. Sargam Mulay (email: [email protected]) University of Glasgow, UK (ORCID iD: 0000-0002-9242-2643)
• First comprehensive investigation of enhanced lineemission from molecular hydrogen, H2 at 1333.79 A,observed at flare ribbons• The cool H2 emission is known to be fluorescentlyexcited by Si IV 1402.77 A UV radiation and pro-vides a unique view of the temperature minimum re-gion (TMR).• Since Si IV is strong in flares, this should provide agood H2 signal
Research objective• Behaviour of H2 emission at flare ribbon during var-ious phases of the flare• The correlation between H2 and Si IV emission• Properties of cool plasma from H2 spectral line• The optical properties of plasma to the outward-going radiation, using the ratio of the two Si IV lineintensities
(IHOP241)(sit-and-stare)
Evidence of chromospheric molecular hydrogen emission in an IRIS flare
Dr. Sargam Mulay (email: [email protected]) University of Glasgow, UK (ORCID iD: 0000-0002-9242-2643)
SJI Si IV 1400 A movie of M7.3 flare
(IHOP241)(sit-and-stare)
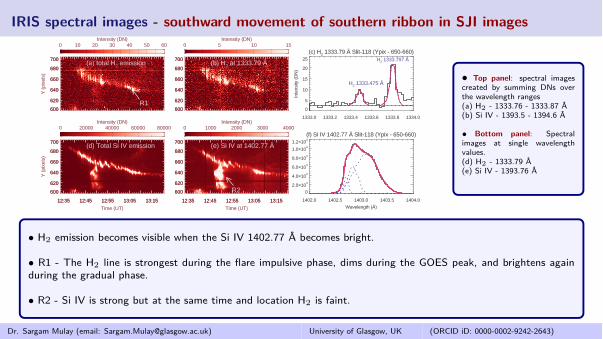
IRIS spectral images - southward movement of southern ribbon in SJI images
Dr. Sargam Mulay (email: [email protected]) University of Glasgow, UK (ORCID iD: 0000-0002-9242-2643)
• H2 emission becomes visible when the Si IV 1402.77 A becomes bright.
• R1 - The H2 line is strongest during the flare impulsive phase, dims during the GOES peak, and brightens againduring the gradual phase.
• R2 - Si IV is strong but at the same time and location H2 is faint.
• Top panel: spectral imagescreated by summing DNs overthe wavelength ranges(a) H2 - 1333.76 - 1333.87 A(b) Si IV - 1393.5 - 1394.6 A
• Bottom panel: Spectralimages at single wavelengthvalues.(d) H2 - 1333.79 A(e) Si IV - 1393.76 A
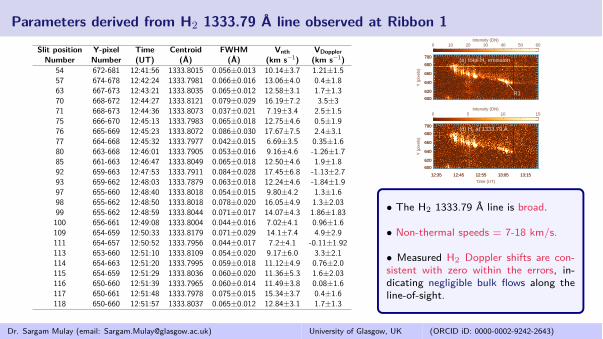
Parameters derived from H2 1333.79 A line observed at Ribbon 1
Dr. Sargam Mulay (email: [email protected]) University of Glasgow, UK (ORCID iD: 0000-0002-9242-2643)
Slit position Y-pixel Time Centroid FWHM Vnth VDopplerNumber Number (UT) (A) (A) (km s−1) (km s−1)
54 672-681 12:41:56 1333.8015 0.056±0.013 10.14±3.7 1.21±1.557 674-678 12:42:24 1333.7981 0.066±0.016 13.06±4.0 0.4±1.863 667-673 12:43:21 1333.8035 0.065±0.012 12.58±3.1 1.7±1.370 668-672 12:44:27 1333.8121 0.079±0.029 16.19±7.2 3.5±371 668-673 12:44:36 1333.8073 0.037±0.021 7.19±3.4 2.5±1.575 666-670 12:45:13 1333.7983 0.065±0.018 12.75±4.6 0.5±1.976 665-669 12:45:23 1333.8072 0.086±0.030 17.67±7.5 2.4±3.177 664-668 12:45:32 1333.7977 0.042±0.015 6.69±3.5 0.35±1.680 663-668 12:46:01 1333.7905 0.053±0.016 9.16±4.6 -1.26±1.785 661-663 12:46:47 1333.8049 0.065±0.018 12.50±4.6 1.9±1.892 659-663 12:47:53 1333.7911 0.084±0.028 17.45±6.8 -1.13±2.793 659-662 12:48:03 1333.7879 0.063±0.018 12.24±4.6 -1.84±1.997 655-660 12:48:40 1333.8018 0.054±0.015 9.80±4.2 1.3±1.698 655-662 12:48:50 1333.8018 0.078±0.020 16.05±4.9 1.3±2.0399 655-662 12:48:59 1333.8044 0.071±0.017 14.07±4.3 1.86±1.83100 656-661 12:49:08 1333.8004 0.044±0.016 7.02±4.1 0.96±1.6109 654-659 12:50:33 1333.8179 0.071±0.029 14.1±7.4 4.9±2.9111 654-657 12:50:52 1333.7956 0.044±0.017 7.2±4.1 -0.11±1.92113 653-660 12:51:10 1333.8109 0.054±0.020 9.17±6.0 3.3±2.1114 654-663 12:51:20 1333.7995 0.059±0.018 11.12±4.9 0.76±2.0115 654-659 12:51:29 1333.8036 0.060±0.020 11.36±5.3 1.6±2.03116 650-660 12:51:39 1333.7965 0.060±0.014 11.49±3.8 0.08±1.6117 650-661 12:51:48 1333.7978 0.075±0.015 15.34±3.7 0.4±1.6118 650-660 12:51:57 1333.8037 0.065±0.012 12.84±3.1 1.7±1.3
• The H2 1333.79 A line is broad.
• Non-thermal speeds = 7-18 km/s.
• Measured H2 Doppler shifts are con-sistent with zero within the errors, in-dicating negligible bulk flows along theline-of-sight.
Correlations between the exciter wavelength and the fluorescent emission
Dr. Sargam Mulay (email: [email protected]) University of Glasgow, UK (ORCID iD: 0000-0002-9242-2643)
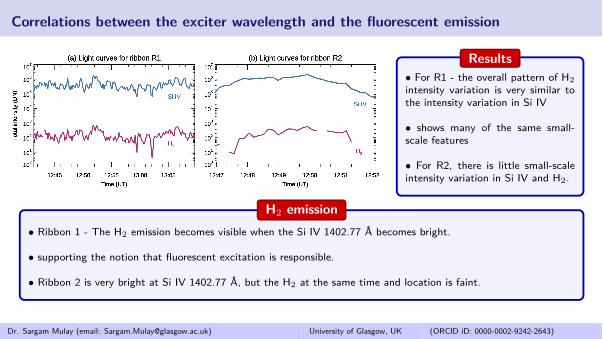
H2 emission• Ribbon 1 - The H2 emission becomes visible when the Si IV 1402.77 A becomes bright.
• supporting the notion that fluorescent excitation is responsible.
• Ribbon 2 is very bright at Si IV 1402.77 A, but the H2 at the same time and location is faint.
Results• For R1 - the overall pattern of H2intensity variation is very similar tothe intensity variation in Si IV
• shows many of the same small-scale features
• For R2, there is little small-scaleintensity variation in Si IV and H2.
Correlations between the exciter wavelength and the fluorescent emission
Dr. Sargam Mulay (email: [email protected]) University of Glasgow, UK (ORCID iD: 0000-0002-9242-2643)
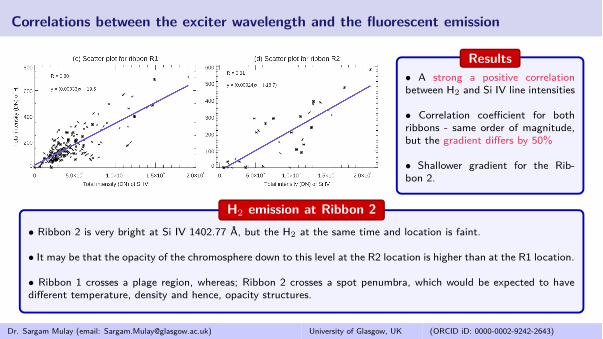
H2 emission at Ribbon 2• Ribbon 2 is very bright at Si IV 1402.77 A, but the H2 at the same time and location is faint.
• It may be that the opacity of the chromosphere down to this level at the R2 location is higher than at the R1 location.
• Ribbon 1 crosses a plage region, whereas; Ribbon 2 crosses a spot penumbra, which would be expected to havedifferent temperature, density and hence, opacity structures.
Results• A strong a positive correlationbetween H2 and Si IV line intensities
• Correlation coefficient for bothribbons - same order of magnitude,but the gradient differs by 50%
• Shallower gradient for the Rib-bon 2.
Optical properties of plasma - the ratio of the two Si IV line intensities
Dr. Sargam Mulay (email: [email protected]) University of Glasgow, UK (ORCID iD: 0000-0002-9242-2643)
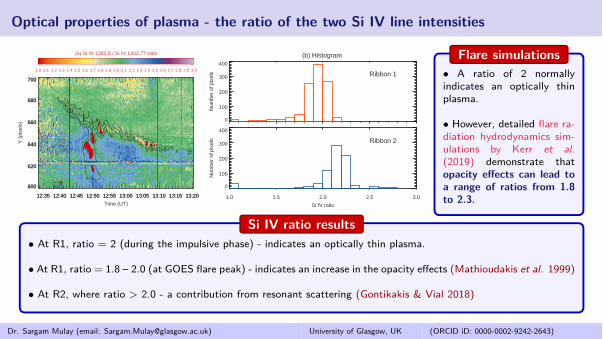
Si IV ratio results• At R1, ratio = 2 (during the impulsive phase) - indicates an optically thin plasma.
• At R1, ratio = 1.8 – 2.0 (at GOES flare peak) - indicates an increase in the opacity effects (Mathioudakis et al. 1999)
• At R2, where ratio > 2.0 - a contribution from resonant scattering (Gontikakis & Vial 2018)
Flare simulations• A ratio of 2 normallyindicates an optically thinplasma.
• However, detailed flare ra-diation hydrodynamics sim-ulations by Kerr et al.(2019) demonstrate thatopacity effects can lead toa range of ratios from 1.8to 2.3.
Summary - Mulay S. M., Fletcher L., 2021, MNRAS, 504, 2842
Dr. Sargam Mulay (email: [email protected]) University of Glasgow, UK (ORCID iD: 0000-0002-9242-2643)
H2 emission was observed in flare ribbons - GOES M7.3 X-ray flareH2 line is strongest during the flare impulsive phase, dims during the GOES peak, and brightens againduring the gradual decay phase.
The H2 line is broadened,
corresponding to non-thermal speeds in the range 7-18 km/s.
H2 Doppler shifts are consistent with zero within the errors, indicating negligible bulk flows along theline-of-sight.
From the ratio of Si IV (1393.76/1402.77), we deduce thatthe plasma is optically thin to Si IV (where the ratio = 2) during the impulsive phase of the flare inlocations where strong H2 emission was observed.
In contrast, the ratio differs from optically thin value of 2 in parts of ribbons, indicating a role foropacity effects.
Dr. Sargam Mulay (email: [email protected]) University of Glasgow, UK (ORCID iD: 0000-0002-9242-2643)
Conclusions
• A strong spatial and temporal correlationbetween H2 and Si IV emission was evidentsupporting the notion that fluorescent excitationis responsible.
• H2 emission gave a new view of conditions in thetemperature minimum region (TMR) during flare.
• Our study is useful for constraining further modelsof the chromosphere and TMR during flares.
Future research plans
• IRIS H2 emission in various C, M andX-class flares and relationship with Si IVemission.
• Jaeggli et al. 2018 - UV opacity isdominated by the photoionisation of neutralC and S.
• Investigation of IRIS C I 1354.29 A and S I1401.51 A and relation with H2.
References and Acknowledgements
Dr. Sargam Mulay (email: [email protected]) University of Glasgow, UK (ORCID iD: 0000-0002-9242-2643)
Key references
• Abgrall H., et al., 1993a, A&AS, 101, 273• Abgrall H., et al., 1993b, A&AS, 101, 323• Bartoe J. D. F., et al., 1979, MNRAS, 187, 463• Cohen L., et al., 1978, ApJS, 37, 393• Innes D. E., 2008, A&A, 481, L41• Jaeggli S. A., et al., 2018, ApJ, 855, 134• Jordan C., et al., Nature, 270, 326• Jordan C., et al., 1978, ApJ, 226, 687• Sandlin G. D., et al., 1986, ApJS, 61, 801• Schuehle U., et al. eds, ESA Special PublicationVol. 446, 8th SOHO Workshop: Plasma Dynamicsand Diagnostics in the Solar Transition Region andCorona. p. 617
Acknowledgements
• We acknowledge support from the UKResearch and Innovationas Science andTechnology Facilities Council (STFC) undergrant award numbers ST/P000533/1 andST/T000422/1.
• We would like to thank Dr. Peter Young(NASA), Dr. Giulio Del Zanna, and Dr.Helen Mason (University of Cambridge, UK)for the discussion and valuable comments.
• IRIS is a NASA small explorer mission de-veloped and operated by LMSAL with missionoperations executed at NASA Ames Researchcenter and major contributions to downlinkcommunications funded by ESA and the Nor-wegian Space Centre.