hydrocarbon reserves as of december 31, 2007
TRANSCRIPT

Corporate Finance Office Investor Relations
(5255) 1944 9700 [email protected]
Hydrocarbon reserves as of December 31, 2007 1/24
March 26, 2008
Hydrocarbon reserves as of December 31, 2007
Estimation
Proved reserves at the end of 2007
As of December 31, 2007, PEMEX estimates proved reserves of 14.717 billion barrels of oil equivalent (MMMboe), of which 71% consists of crude oil, 12% consists of condensates and liquids from plants and the remaining 17% is dry gas equivalent to liquid. Proved developed reserves are 10.005 MMMboe or 68% of total proved reserves. Developed reserves are expected to be recovered from existing wells, including those reserves that can be recovered using the current facilities through additional works that required low investment. The Marine region contains 62% of these reserves. The most important fields, which contain 69% of developed reserves, are Akal, Ku-Maloob-Zaap, Jujo-Tecominoacán, Samaria, Iride, Cunduacán, Caan and May. Proved undeveloped reserves represent 32% of total proved reserves, or 4.712 MMMboe, and required additional infrastructure and wells in order to produce them. The offshore regions contain 52% of undeveloped reserves, while the remaining 48% are located in the onshore regions. The most important fields include Maloob, Jujo-Tecominoacán, Sihil, Iride, Samaria, May, Oxiacaque, Zaap y Tajín, which contain 51% of proved undeveloped reserves.
Figure 1
10.04.7
14.7
Proved(1P)
Deve-loped
Un-developed
Proved Reserves 2007
Reserves as of December 31, 2007Billion barrels of crude oil equivalent (MMMboe)
Crude:
Dry gas:
Condensates and plant liquids:
71%
17%
12%
74%
16%
10%
65%
20%
15%
Clasification100% = 14.7
Developed
Undeveloped
Note: Numbers may not total due to rounding.
32%
68%
www.pemex.com
PEMEX Investor Relations
Probable and possible reserves at the end of 2007
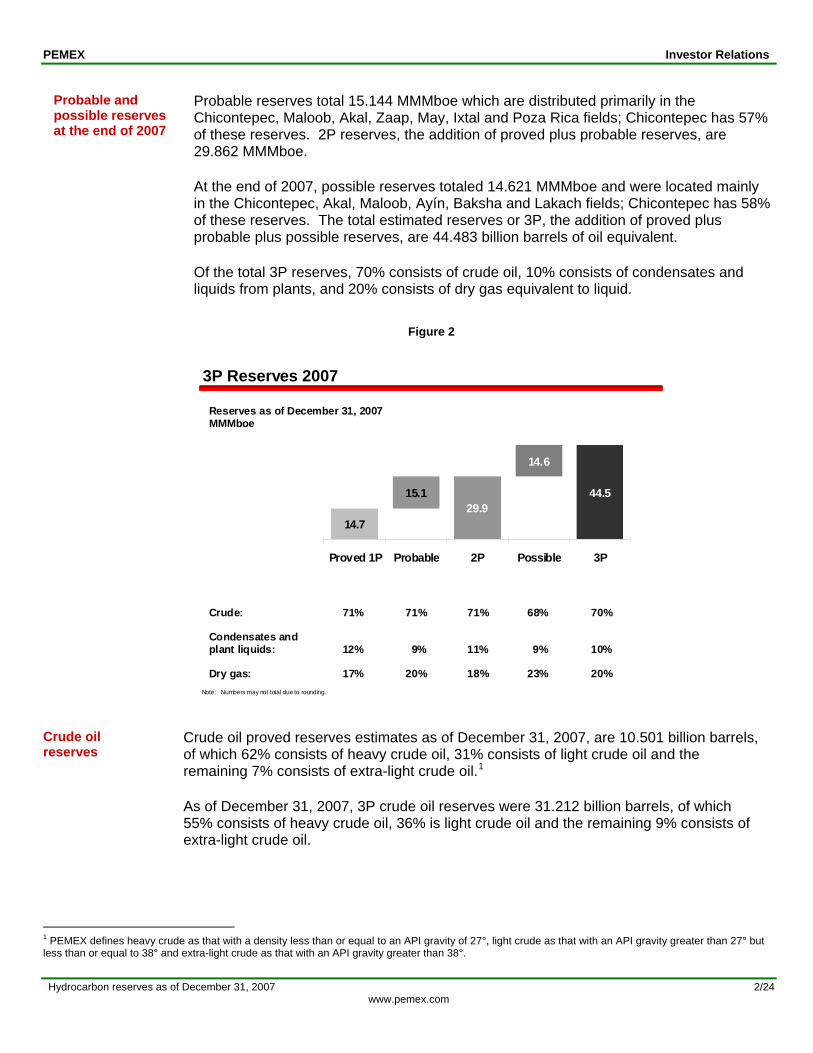
Probable reserves total 15.144 MMMboe which are distributed primarily in the Chicontepec, Maloob, Akal, Zaap, May, Ixtal and Poza Rica fields; Chicontepec has 57% of these reserves. 2P reserves, the addition of proved plus probable reserves, are 29.862 MMMboe. At the end of 2007, possible reserves totaled 14.621 MMMboe and were located mainly in the Chicontepec, Akal, Maloob, Ayín, Baksha and Lakach fields; Chicontepec has 58% of these reserves. The total estimated reserves or 3P, the addition of proved plus probable plus possible reserves, are 44.483 billion barrels of oil equivalent. Of the total 3P reserves, 70% consists of crude oil, 10% consists of condensates and liquids from plants, and 20% consists of dry gas equivalent to liquid.
Figure 2
3P Reserves 2007
Reserves as of December 31, 2007MMMboe
Crude: 71% 71% 71% 68% 70%
Dry gas: 17% 20% 18% 23% 20%
Condensates and plant liquids: 12% 9% 11% 9% 10%
Note: Numbers may not total due to rounding.
29.9
14.6
44.515.1
14.7
Proved 1P Probable 2P Possible 3P
Crude oil reserves
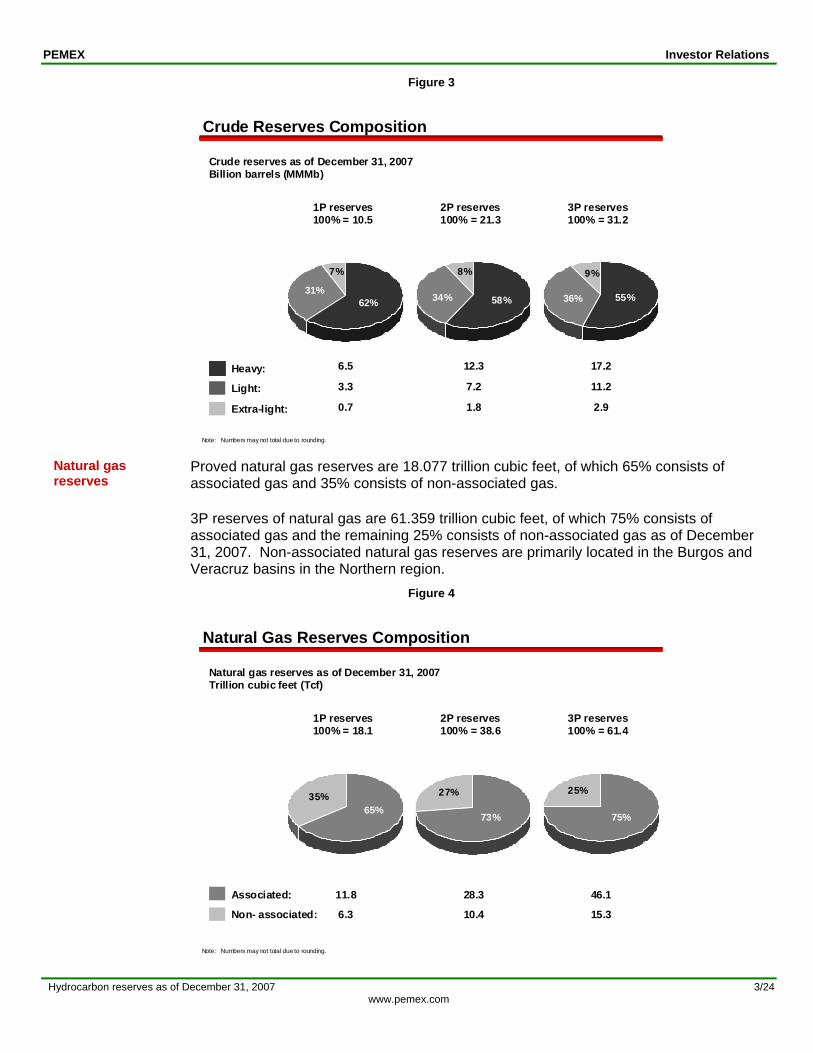
Crude oil proved reserves estimates as of December 31, 2007, are 10.501 billion barrels, of which 62% consists of heavy crude oil, 31% consists of light crude oil and the remaining 7% consists of extra-light crude oil.1
As of December 31, 2007, 3P crude oil reserves were 31.212 billion barrels, of which 55% consists of heavy crude oil, 36% is light crude oil and the remaining 9% consists of extra-light crude oil.
1 PEMEX defines heavy crude as that with a density less than or equal to an API gravity of 27°, light crude as that with an API gravity greater than 27° but less than or equal to 38° and extra-light crude as that with an API gravity greater than 38°. Hydrocarbon reserves as of December 31, 2007 2/24
www.pemex.com
PEMEX Investor Relations
Figure 3
9%
36% 55%
7%
31%62% 58%34%
8%
Crude Reserves Composition
Crude reserves as of December 31, 2007Billion barrels (MMMb)
1P reserves100% = 10.5
Heavy:
Light:
Extra-light:
2P reserves100% = 21.3
3P reserves100% = 31.2
Note: Numbers may not total due to rounding.
6.5
3.3
0.7
12.3
7.2
1.8
17.2
11.2
2.9
Natural gas reserves
Proved natural gas reserves are 18.077 trillion cubic feet, of which 65% consists of associated gas and 35% consists of non-associated gas. 3P reserves of natural gas are 61.359 trillion cubic feet, of which 75% consists of associated gas and the remaining 25% consists of non-associated gas as of December 31, 2007. Non-associated natural gas reserves are primarily located in the Burgos and Veracruz basins in the Northern region.
Figure 4
27%
73%
35%65%
25%
75%
Natural Gas Reserves Composition
Natural gas reserves as of December 31, 2007Trillion cubic feet (Tcf)
1P reserves100% = 18.1
Associated:
Non- associated:
2P reserves100% = 38.6
3P reserves100% = 61.4
11.8
6.3
28.3
10.4
46.1
15.3
Note: Numbers may not total due to rounding.
Hydrocarbon reserves as of December 31, 2007 3/24 www.pemex.com

PEMEX Investor Relations
Onshore and offshore reserves
As of December 31, 2007 proved onshore reserves contain 32% of total proved crude reserves, and the remaining 68% are located offshore, while 62% of proved natural gas reserves are located onshore and the remaining 38% are located offshore. As of December 31, 2007, 3P onshore reserves contain 52% of the 3P crude oil reserves; the remaining 48% is located offshore. While 76% of the 3P natural gas reserves are contained onshore; the remaining 24% are located offshore.
Figure 5
68% 53% 48%
32% 47% 52%
1P 2P 3P
38% 27% 24%
62% 73% 76%
1P 2P 3P
BurgosTampico – MisantlaVeracruzSoutheastDeep watersYucatán platform
BasinsSabinas
Crude reserves (MMMb)Reserves as of December 31, 2007:
100% =
Type of reserve:
Natural gas reserves (Tcf)
Off-shore
On-shore
Geographical Distribution of Reserves
Note: Numbers may not total due to rounding.
10.5 21.3 31.2 18.1 38.6 61.4
Reserve-production ratio
The reserve-production ratio, which results from dividing the estimated remaining reserves as of December 31, 2007 by the total production of hydrocarbons in 2007, is equivalent to 27.7 years for the 3P reserves, 18.6 years for the 2P reserves and 9.2 years for the proved reserves. Each of the 1P, 2P and 3P reserve-production ratios is slightly lower than the comparable ratios for 2006 by 4%, 2% and 1%, respectively.
Hydrocarbon reserves as of December 31, 2007 4/24 www.pemex.com

PEMEX Investor Relations
Figure 6
1P
2P
3P
YearProduction(MMboe)
Reserves-ProductionRatio (years)
Reserves-production ratio
ReservesProduction
=
Reserves-Production Ratio
Note: Numbers may not total due to rounding.
27.7
18.6
9.21,6032007
28.9
20.1
10.31,6042005
28.0
19.0
9.61,6182006
Evolution of reserves
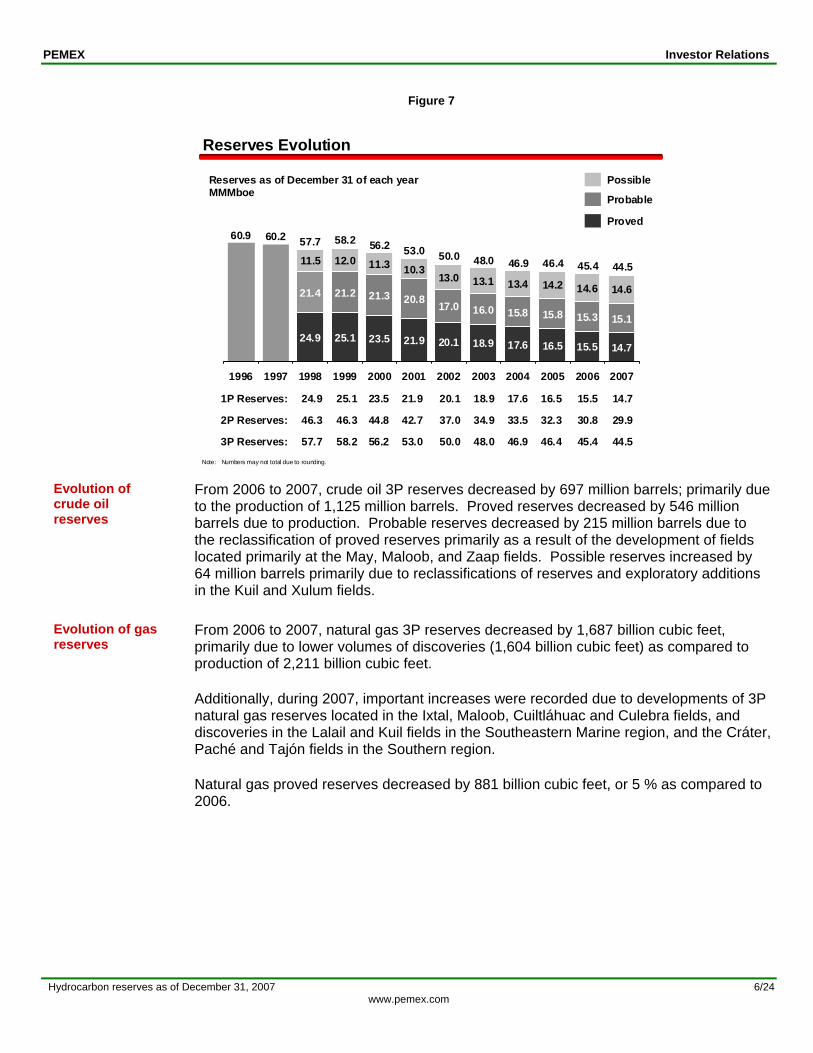
The variation in 3P reserves is explained by the exploratory activity. Since 2005, the annual rate of decline in 3P reserves has remained stable at 2%, due to the discovery of 3P reserves by exploration activities. The average annual rate of decline in 1P reserves has decreased from 6% during the 2005-2006 period, to 5% during 2006-2007.
Hydrocarbon reserves as of December 31, 2007 5/24 www.pemex.com
PEMEX Investor Relations
Figure 7
24.9 25.1 23.5 21.9 20.1 18.9 17.6 16.5 15.5 14.7
21.4 21.2 21.3 20.8 17.0 16.0 15.8 15.8 15.3 15.1
11.3 10.313.0 13.1 13.4 14.2 14.6 14.6
12.011.5
1996 1997 1998 1999 2000 2001 2002 2003 2004 2005 2006 2007
Reserves as of December 31 of each yearMMMboe
Possible
Probable
Proved
1P Reserves:
2P Reserves:
3P Reserves:
Reserves Evolution
Note: Numbers may not total due to rounding.
58.2 56.2 53.0 50.057.7
48.0 46.9 44.5
60.9 60.2
46.4 45.4
24.9
46.3
57.7
25.1
46.3
58.2
23.5
44.8
56.2
21.9
42.7
53.0
20.1
37.0
50.0
18.9
34.9
48.0
17.6
33.5
46.9
16.5
32.3
46.4
15.5
30.8
45.4
14.7
29.9
44.5
Evolution of crude oil reserves
From 2006 to 2007, crude oil 3P reserves decreased by 697 million barrels; primarily due to the production of 1,125 million barrels. Proved reserves decreased by 546 million barrels due to production. Probable reserves decreased by 215 million barrels due to the reclassification of proved reserves primarily as a result of the development of fields located primarily at the May, Maloob, and Zaap fields. Possible reserves increased by 64 million barrels primarily due to reclassifications of reserves and exploratory additions in the Kuil and Xulum fields.
Evolution of gas reserves
From 2006 to 2007, natural gas 3P reserves decreased by 1,687 billion cubic feet, primarily due to lower volumes of discoveries (1,604 billion cubic feet) as compared to production of 2,211 billion cubic feet. Additionally, during 2007, important increases were recorded due to developments of 3P natural gas reserves located in the Ixtal, Maloob, Cuiltláhuac and Culebra fields, and discoveries in the Lalail and Kuil fields in the Southeastern Marine region, and the Cráter, Paché and Tajón fields in the Southern region. Natural gas proved reserves decreased by 881 billion cubic feet, or 5 % as compared to 2006.
Hydrocarbon reserves as of December 31, 2007 6/24 www.pemex.com

PEMEX Investor Relations
Figure 8
Possible
Probable
Proved
Reserves as of December 31 of each year
Natural gas reservesTcf
Reserves 1P:
Reserves 2P:
Reserves 3P:
Crude reservesMMMb
Crude and Natural Gas Reserves Evolution
Note: Numbers may not total due to rounding.
11.8 11.0 10.5
10.8
9.6 9.8 9.9
11.011.6
2005 2006 2007
20.0 19.0 18.1
20.1 20.5 20.6
22.3 23.6 22.7
2005 2006 2007
11.0
22.1
31.9
19.0
39.4
63.0
18.1
38.6
61.4
61.4
33.1
11.8
23.5
33.1
20.0
40.0
62.4
62.431.9
63.031.2
10.5
21.3
31.2
Variation in reserves 2006-2007
In 2007, proved reserves decreased by 797 MMboe as compared to 2006, 2P reserves decreased by 910 MMboe and 3P reserves decreased by 893 MMboe. These variations were primarily the result of a production level of 1,603 MMboe, which was partially compensated by discoveries, revisions and developments.
Figure 9
MMboe
Discoveries Developments, revisions and delineations
Production
Reserves Evolution 2006 - 2007
Note: Numbers may not total due to rounding.
1P Reserves
2PReserves
3P Reserves
15,514 183 623 -1,60314,717
30,772 675 18 -1,60329,862
2006 2007
45,3761,053 -344 -1,603
44,483
Hydrocarbon reserves as of December 31, 2007 7/24 www.pemex.com
PEMEX Investor Relations
Main discoveries
Discoveries 2003-2007
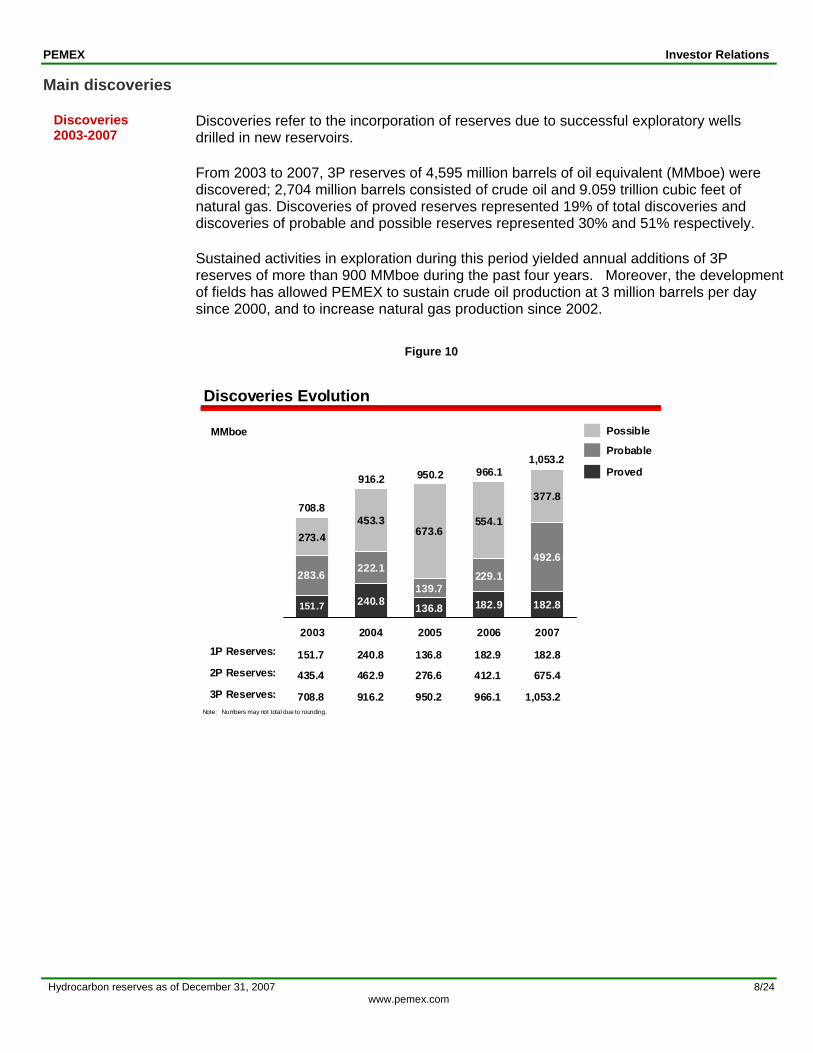
Discoveries refer to the incorporation of reserves due to successful exploratory wells drilled in new reservoirs. From 2003 to 2007, 3P reserves of 4,595 million barrels of oil equivalent (MMboe) were discovered; 2,704 million barrels consisted of crude oil and 9.059 trillion cubic feet of natural gas. Discoveries of proved reserves represented 19% of total discoveries and discoveries of probable and possible reserves represented 30% and 51% respectively. Sustained activities in exploration during this period yielded annual additions of 3P reserves of more than 900 MMboe during the past four years. Moreover, the development of fields has allowed PEMEX to sustain crude oil production at 3 million barrels per day since 2000, and to increase natural gas production since 2002.
Figure 10
MMboe Possible
Probable
Proved
1P Reserves:
2P Reserves:
3P Reserves:
Discoveries Evolution
Note: Numbers may not total due to rounding.
240.8 136.8 182.9 182.8
222.1
139.7229.1
492.6
453.3673.6
554.1
377.8
151.7
283.6
273.4
2003 2004 2005 2006 2007
1,053.2
708.8
916.2
136.8
276.6
950.2
151.7
435.4
708.8
240.8
462.9
916.2
950.2 966.1
182.9
412.1
966.1
182.8
675.4
1,053.2
Hydrocarbon reserves as of December 31, 2007 8/24 www.pemex.com

PEMEX Investor Relations
Discoveries in 2007
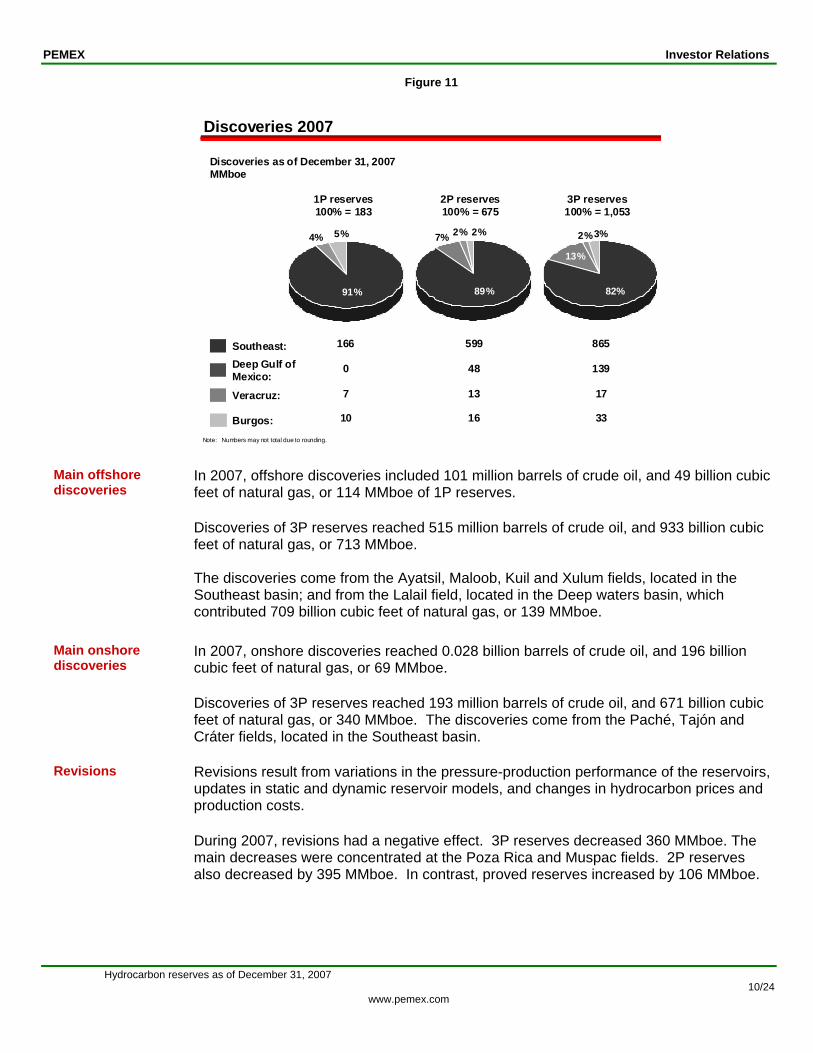
Discoveries refer to the addition of reserves due to successful exploratory wells drilled in new reservoirs. In 2007, discoveries of proved, or 1P, reserves totaled 183 MMboe, 2P discoveries totaled 675 MMboe and 3P discoveries totaled 1,053 MMboe. Reserves by basin due to new discoveries is as follows: • Southeast with 166 MMboe of 1P reserves, and 865 MMboe of 3P reserves; • Deep waters with 48 MMboe of 2P reserves and 139 MMboe of 3P reserves; • Veracruz with 7 MMboe of 1P reserves and 17 MMboe of 3P reserves, and • Burgos with 10 MMboe of 1P reserves and 33 MMboe of 3P reserves.
The results demonstrate the volumetric relevance of each basin. Although the contribution of the Southeast basin, by 8 exploratory wells, is significant, the deep water section of the Gulf of Mexico is strategic. Discoveries of proved reserves represented 17% of total reserves. This percentage will increase as PEMEX reclassifies probable and possible reserves to proved reserves, through the delineation and development of fields. In 2007, crude oil discoveries represented 77% of 3P reserves (809 MMboe), while non–associated gas reservoirs accounted for 244 MMboe (1,142 billion cubic feet). These discoveries are aligned with the following strategic exploratory initiatives: • Intensify exploratory activity in the Deep waters of the Gulf of Mexico, and maintain
current activity in other basins; • strengthen the exploratory opportunities portfolio, increasing the number and the
average size of locations; and • improve performance of key finding cost drivers.
Hydrocarbon reserves as of December 31, 2007 9/24 www.pemex.com
PEMEX Investor Relations
Figure 11
Discoveries 2007
Discoveries as of December 31, 2007MMboe
1P reserves100% = 183
2P reserves100% = 675
3P reserves100% = 1,053
Southeast:Deep Gulf of Mexico:
Veracruz:
Burgos:Note: Numbers may not total due to rounding.
166 599 865
0 48 139
7 13 17
10 16 33
4%
91%
5% 7% 2%
89%
2% 3%2%
13%
82%
Main offshore discoveries
In 2007, offshore discoveries included 101 million barrels of crude oil, and 49 billion cubic feet of natural gas, or 114 MMboe of 1P reserves. Discoveries of 3P reserves reached 515 million barrels of crude oil, and 933 billion cubic feet of natural gas, or 713 MMboe. The discoveries come from the Ayatsil, Maloob, Kuil and Xulum fields, located in the Southeast basin; and from the Lalail field, located in the Deep waters basin, which contributed 709 billion cubic feet of natural gas, or 139 MMboe.
Main onshore discoveries
In 2007, onshore discoveries reached 0.028 billion barrels of crude oil, and 196 billion cubic feet of natural gas, or 69 MMboe. Discoveries of 3P reserves reached 193 million barrels of crude oil, and 671 billion cubic feet of natural gas, or 340 MMboe. The discoveries come from the Paché, Tajón and Cráter fields, located in the Southeast basin.
Revisions Revisions result from variations in the pressure-production performance of the reservoirs,
updates in static and dynamic reservoir models, and changes in hydrocarbon prices and production costs. During 2007, revisions had a negative effect. 3P reserves decreased 360 MMboe. The main decreases were concentrated at the Poza Rica and Muspac fields. 2P reserves also decreased by 395 MMboe. In contrast, proved reserves increased by 106 MMboe.
Hydrocarbon reserves as of December 31, 2007 10/24
www.pemex.com

PEMEX Investor Relations
Hydrocarbon reserves as of December 31, 2007 11/24
www.pemex.com
Developments Developments refer to increases or reductions in reserves due to the drilling of development wells. During 2007, developments had a positive effect on all categories of reserves. 3P reserves increased 17 MMboe, primarily due to the Ek and Ixtal fields. 2P reserves and 1P reserves increased 414 and 517 MMboe, respectively. The proved reserves increase of 529 MMboe, was primarily the result of developments at Ku, Maloob, and May fields. The strategic initiatives for development and production of reserves are to: • Strengthen the execution capabilities of development projects to increase the
recovery factor and develop new reserves; and • implement the operating and commercial strategies for extra-heavy crude oil.
Production In 2007, production totaled 1,603 MMboe; as a result of an average daily production of
3,082 thousand barrels of crude oil and 6,058 million cubic feet of natural gas. Proved reserves balance at the end of 2007
The variation of proved reserves demonstrates a stable performance. On one hand there are increases attributable to discoveries and developments in existing fields. On the other, there have been some negative revisions. The variation recorded in 2007 is the lowest decrease since the adoption of the guidelines of the Securities and Exchange Commission (SEC).
Reserves replacement rate
The reserves replacement rate due to discoveries is defined as the ratio resulting from dividing the discovered reserves (1P, 2P or 3P) by the production in a given period without taking into account developments, delineations and revisions. In 2007, 3P discoveries totaled 1,053 MMboe. Considering 3P discoveries and 2007 production of 1,603 MMboe, 3P reserves replacement rate due to discoveries reached 65.7%. The comparable replacement rate was 59.7% in 2006. In terms of natural gas, the 3P reserves replacement rate increased 72.5%.
Integrated reserves replacement rate
The integrated reserves replacement rate is the quotient of total discoveries, developments, delineations and revisions divided by the period’s total production. The integrated proved reserves replacement rate totaled 50.3% in 2007, while the integrated 3P reserves replacement rate totaled 44.3%.
Reserves replacement objectives
PEMEX’s objective is to increase gradually the 3P replacement rate to reach the goal of 100% in 2012, based on an increase in exploration activities. In addition, 1P integrated reserves replacement rate is forecasted to reach 100% by 2012, based on the development of probable reserves. In the following years, there will be reclassification of probable reserves into proved reserves primarily because of the development of the projects Ku-Maloob-Zaap, Crudo Ligero Marino and Chicontepec, as well as delineation activities.

PEMEX Investor Relations
These objectives were developed on the basis of expected values as of December 31, 2007, and are subject to uncertainty and risks associated with hydrocarbon exploration and production activities as well as authorized exploration and exploitation investment levels. Accordingly, no assurance can be given that these objectives will be realized.
Figure 12
Historical and Future Trend of the Reserves Replacement Rate
MMboe
* Only discoveries** Includes: delineations, developments and revisions (integrated)Source: Pemex-Exploration and Production
Replacement rate of reserves
Total% Proved%
-500
0
500
1,000
1,500
2,000
01 02 03 04 05 06 07 08 09 10 11 12
66%
50%59%
26%26%
45%
14%
-19%
100%
60%
41%
SEC guidelines adoption
Future exploration strategy
The emphasis in exploration efforts has been on reservoirs located in mature basins to take advantage of existing infrastructure to develop future discoveries. Exploration in under-explored basins will increase, especially in the Deep waters basin, where most of the prospective resources are located, 55%. PEMEX’s exploration strategy reflects a balanced portfolio with locations of moderate risk in developed basins and higher risk in underexplored basins, which volume to incorporate and economic value are significant. This strategy aims to maintain a competitive finding cost, by combining lower size opportunities in lower risk mature basins with larger size opportunities in higher risk exploratory basins and plays (collection of reservoirs with similar characteristics).
CAPEX in exploration
From 2000 to 2007, annual exploration investment averaged approximately US$1.1 billion.
Hydrocarbon reserves as of December 31, 2007 12/24
www.pemex.com
PEMEX Investor Relations
Hydrocarbon reserves as of December 31, 2007 13/24
www.pemex.com
Other relevant topics
Deep water wells From 2004 to 2007, PEMEX acquired 288 km of 2D seismic information and 13,038 km2 of 3D seismic information. This information will contribute to a higher degree of certainty in the existing prospective resources in deep waters the Gulf de Mexico. Likewise, during this period 5 exploratory locations were drilled and 4 discovered hydrocarbon reserves.
Drilling In 2007, 659 wells were drilled and completed; of which 49 were exploratory wells. Lifting costs In 2007, PEMEX’s lifting cost was US$4.36 per barrel oil equivalent (boe), representing a
2.6% increase as compared to the 2006 cost of US$4.25 per boe. This decrease was mainly due to higher purchases of nitrogen and natural gas for gas lift.
Annex Measurement of hydrocarbon reserves
Institutional measuring system
With the objective of standardizing the estimation of reserves and classification processes, PEMEX has since 1996 measured its hydrocarbon reserves based on international definitions established by the Society of Petroleum Engineers (SPE) and the World Petroleum Council (WPC). PEMEX estimates proved reserves in compliance with the definition of proved reserves established by the United States Securities and Exchange Commission (SEC). Additionally, PEMEX has a central group that allows the entity to internally certify the reserves and to sanction, technically and economically, the restatements and discoveries done during each year; independently from the evaluations done by Pemex - Exploration and Production’s business units and according to a process established and known in the whole organization.
Adoption of the SEC criteria for proved reserves
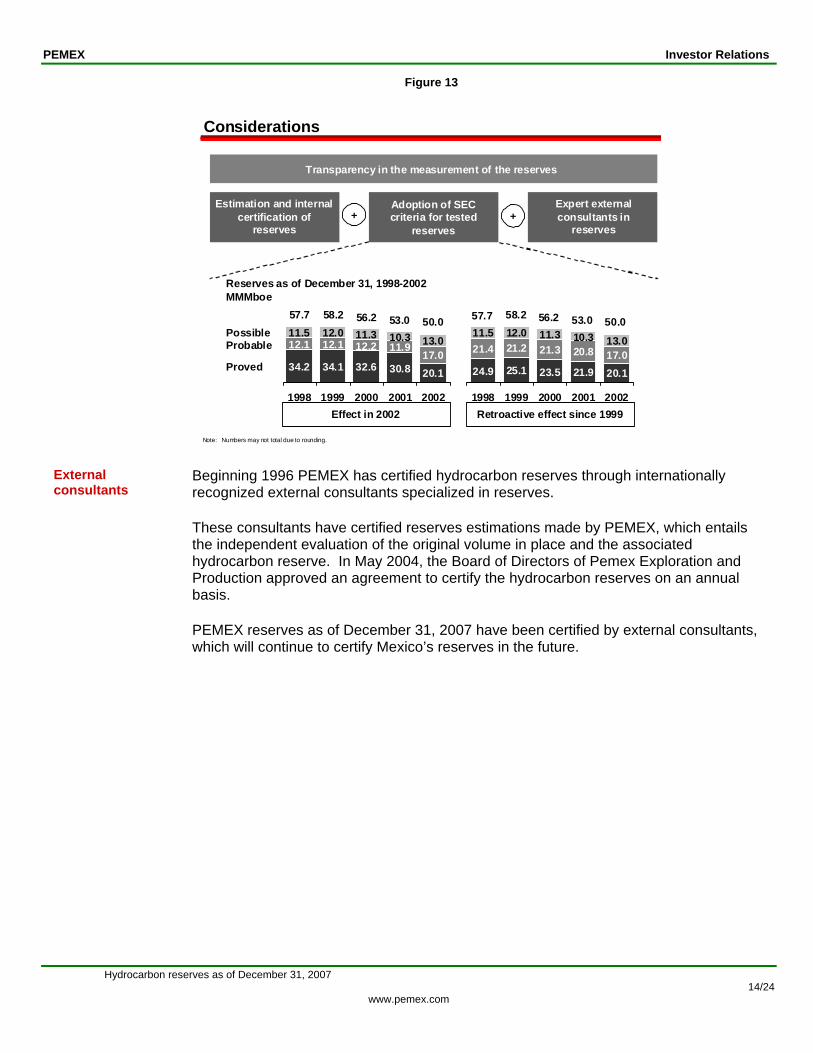
In 2002, PEMEX adopted the criteria of the SEC for the definition of proved reserves and the estimation was applied retroactively back to 1998. The application of these criteria did not modify total or 3P reserves; it modified only its composition, decreasing proved reserves and increasing probable and possible reserves.
PEMEX Investor Relations
Figure 13
34.2 34.1 32.6 30.8 20.1
12.1 12.2 11.917.0
11.5 12.0 11.3 10.3 13.012.1
1998 1999 2000 2001 2002
Adoption of SEC criteria for tested
reserves
Estimation and internal certification of
reserves
Transparency in the measurement of the reserves
Expert external consultants in
reserves+ +
Reserves as of December 31, 1998-2002MMMboe
Proved
Possible
Effect in 2002 Retroactive effect since 1999
Probable
Considerations
Note: Numbers may not total due to rounding.
24.9 25.1 23.5 21.9 20.1
21.4 21.2 21.3 20.8 17.0
11.5 12.0 11.3 10.3 13.0
1998 1999 2000 2001 2002
58.2 56.2 53.0 50.057.7 58.2 56.2 53.0 50.057.7
External consultants
Beginning 1996 PEMEX has certified hydrocarbon reserves through internationally recognized external consultants specialized in reserves. These consultants have certified reserves estimations made by PEMEX, which entails the independent evaluation of the original volume in place and the associated hydrocarbon reserve. In May 2004, the Board of Directors of Pemex Exploration and Production approved an agreement to certify the hydrocarbon reserves on an annual basis. PEMEX reserves as of December 31, 2007 have been certified by external consultants, which will continue to certify Mexico’s reserves in the future.
Hydrocarbon reserves as of December 31, 2007 14/24
www.pemex.com
PEMEX Investor Relations
Basic definitions
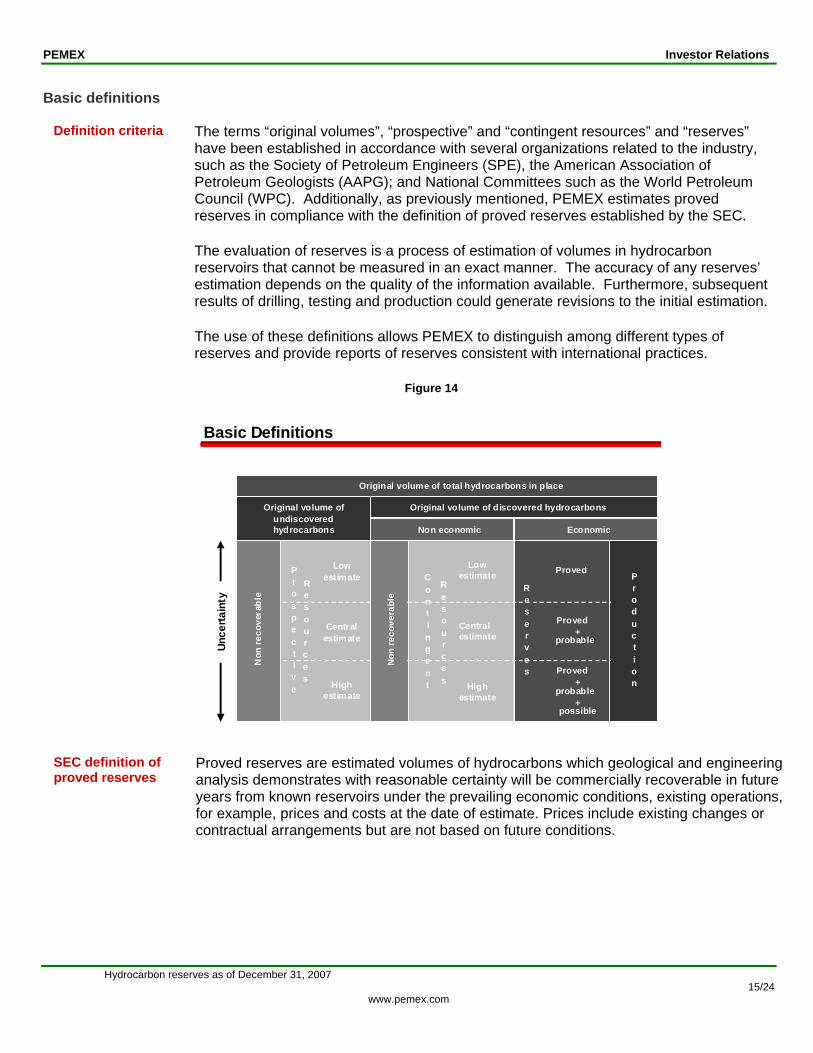
Definition criteria The terms “original volumes”, “prospective” and “contingent resources” and “reserves” have been established in accordance with several organizations related to the industry, such as the Society of Petroleum Engineers (SPE), the American Association of Petroleum Geologists (AAPG); and National Committees such as the World Petroleum Council (WPC). Additionally, as previously mentioned, PEMEX estimates proved reserves in compliance with the definition of proved reserves established by the SEC. The evaluation of reserves is a process of estimation of volumes in hydrocarbon reservoirs that cannot be measured in an exact manner. The accuracy of any reserves’ estimation depends on the quality of the information available. Furthermore, subsequent results of drilling, testing and production could generate revisions to the initial estimation. The use of these definitions allows PEMEX to distinguish among different types of reserves and provide reports of reserves consistent with international practices.
Figure 14
Original volume of discovered hydrocarbons
Unce
rtain
ty
Proved
Proved+
probable
Proved+
probable+
possible
Non
rec
over
able
EconomicNon economic
Original volume of undiscovered hydrocarbons
Original volume of total hydrocarbons in place
R
serv
s
Lowestimate
Centralestimate
Highestimate
Non
rec
over
able
Lowestimate
Centralestimate
Highestimate
Basic Definitions
e
e
Prospective
Resources
Contingent
Resources
Production
SEC definition of proved reserves
Proved reserves are estimated volumes of hydrocarbons which geological and engineering analysis demonstrates with reasonable certainty will be commercially recoverable in future years from known reservoirs under the prevailing economic conditions, existing operations, for example, prices and costs at the date of estimate. Prices include existing changes or contractual arrangements but are not based on future conditions.
Hydrocarbon reserves as of December 31, 2007 15/24
www.pemex.com
PEMEX Investor Relations
Hydrocarbon reserves as of December 31, 2007 16/24
www.pemex.com
Definition of probable and possible reserves
In addition to proved reserves, PEMEX considers probable and possible reserves to constitute total reserves, also called 3P reserves. Probable reserves are those reserves which analysis of geological and engineering data suggests are more likely than not to be recoverable. If probabilistic methods are employed for evaluation, there is a probability of at least 50% that the amounts to be recovered will be equal to or greater than the sum of proved plus probable reserves, also called 2P reserves. Possible reserves are those hydrocarbon reserves which analysis of geological and engineering data suggests are less likely to be recoverable than probable reserves. According to this definition, when probabilistic methods are employed, there is a probability of at least 10% that the amounts actually recovered will be equal to or greater than the sum of proved, probable and possible reserves, or 3P reserves.
PEMEX Investor Relations
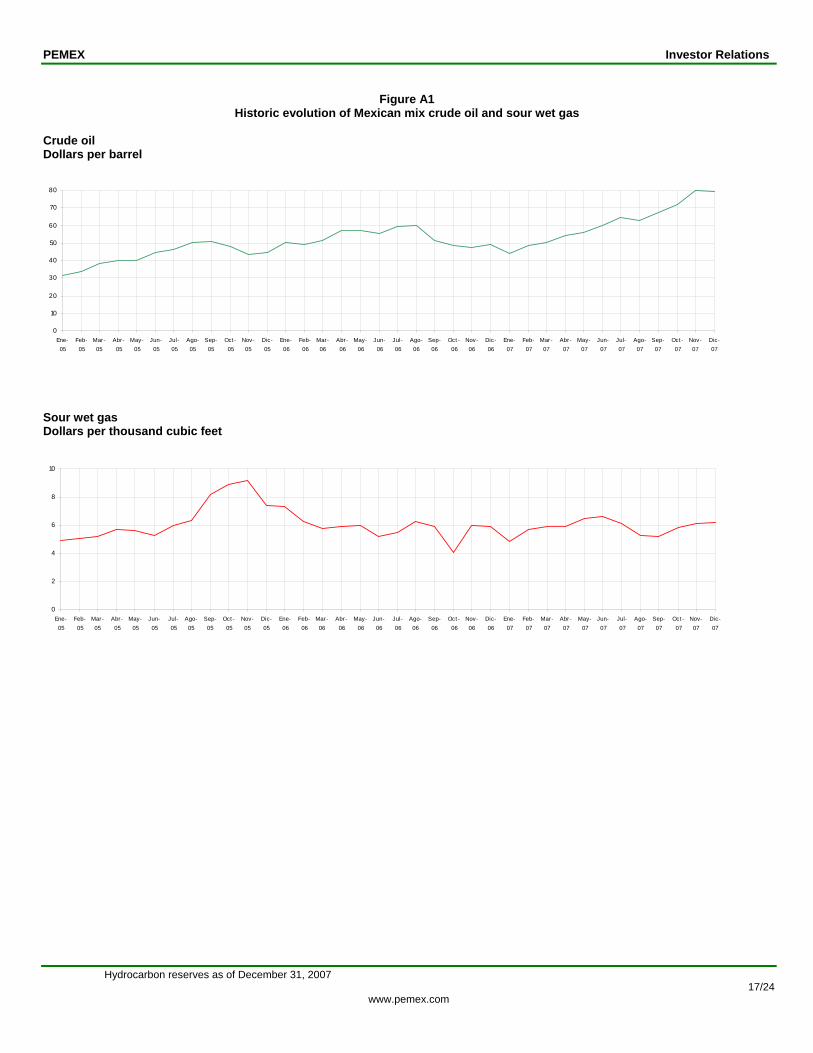
Figure A1
Historic evolution of Mexican mix crude oil and sour wet gas Crude oil Dollars per barrel
0
10
20
30
40
50
60
70
80
Ene-05
Feb-05
Mar-05
Abr-05
May-05
Jun-05
Jul-05
Ago-05
Sep-05
Oct -05
Nov-05
Dic-05
Ene-06
Feb-06
Mar-06
Abr-06
May-06
Jun-06
Jul-06
Ago-06
Sep-06
Oct -06
Nov-06
Dic-06
Ene-07
Feb-07
Mar-07
Abr-07
May-07
Jun-07
Jul-07
Ago-07
Sep-07
Oct -07
Nov-07
Dic-07
Sour wet gas Dollars per thousand cubic feet
0
2
4
6
8
10
Ene-05
Feb-05
Mar-05
Abr-05
May-05
Jun-05
Jul-05
Ago-05
Sep-05
Oct -05
Nov-05
Dic-05
Ene-06
Feb-06
Mar-06
Abr-06
May-06
Jun-06
Jul-06
Ago-06
Sep-06
Oct -06
Nov-06
Dic-06
Ene-07
Feb-07
Mar-07
Abr-07
May-07
Jun-07
Jul-07
Ago-07
Sep-07
Oct -07
Nov-07
Dic-07
Hydrocarbon reserves as of December 31, 2007 17/24
www.pemex.com

PEMEX Investor Relations
Table A1 Petróleos Mexicanos, Subsidiary Entities and Subsidiary CompaniesHydrocarbon reserves composition of the fields discovered in 2007
Basin Well Crude oil Gas Crude oil Gas Crude oil Gas CoeField (MMb) (MMMcf) (MMb) (MMMcf) (MMb) (MMMcf) (MMb)
Total 129.1 244.3 467.5 944.8 708.3 1,604.0 1,053.2
Golfo de México Profundo 0.0 0.0 0.0 242.6 0.0 708.8 138.9Lalail Lalail-1 0.0 0.0 0.0 242.6 0.0 708.8 138.9
Burgos 0.0 49.4 0.0 80.4 0.0 168.4 32.6Axón Axón-1 0.0 1.1 0.0 1.1 0.0 8.1 1.4Bato Bato-1 0.0 10.2 0.0 19.9 0.0 37.0 7.9Bonanza Bonanza-1 0.0 8.4 0.0 15.5 0.0 27.1 4.8Cabeza Aceitero-1 0.0 0.4 0.0 0.4 0.0 5.8 1.2Calibrador Calibrador-1 0.0 11.0 0.0 17.6 0.0 43.0 7.6Oasis Oasis-401 0.0 6.9 0.0 7.5 0.0 7.5 1.4
Oasis-1001 0.0 2.2 0.0 2.2 0.0 2.2 0.4Torrecillas Fémur-1 0.0 7.2 0.0 14.2 0.0 28.2 6.0Vigilante Vigilante-1 0.0 2.0 0.0 2.0 0.0 9.5 1.7
Sureste 128.8 160.6 466.7 556.2 706.1 650.6 865.2Ayatsil Ayatsil-1 0.0 0.0 0.0 0.0 111.0 13.1 118.6Maloob Maloob-DL3 85.0 39.3 168.0 77.6 194.0 89.6 218.8Kuil Kuil-1 9.0 8.6 93.6 89.4 114.9 109.9 138.8Xulum Xulum-101A 7.1 0.9 17.3 2.1 95.0 11.4 97.6Paché Paché-1 7.9 21.6 58.6 160.5 58.6 160.5 96.9Tajón Tajón-101 13.4 8.7 116.9 76.0 116.9 76.0 135.8Gaucho Gaucho-301 0.9 16.1 0.9 16.1 0.9 16.1 2.8Cráter Cráter-1 5.6 65.4 11.5 134.5 14.8 174.0 55.8
Veracruz 0.3 34.3 0.8 65.6 2.2 76.2 16.5Perdiz Quetzalli-1 0.3 0.3 0.8 1.1 2.2 1.8 2.2Barajas Barajas-1 0.0 3.4 0.0 10.8 0.0 10.8 2.1Castell Castell-1 0.0 8.9 0.0 8.9 0.0 8.9 1.7Jaf Jaf-1 0.0 14.2 0.0 14.2 0.0 14.2 2.7Kibo Kibo-1 0.0 0.0 0.0 7.7 0.0 9.9 1.9Obertura Obertura-1 0.0 7.4 0.0 22.8 0.0 30.5 5.9
1P 2P 3P
Hydrocarbon reserves as of December 31, 2007 18/24
www.pemex.com

PEMEX Investor Relations
Hydrocarbon reserves as of December 31, 2007
Table A2 Petróleos Mexicanos, Subsidiary Entities and Subsidiary Companies
Hydrocarbon reserves as of December 31, 2007
Crude oil Natural gas Crude oil equivalent Crude oil Condensate Plant
liquids*Dry gas
equivalent** Natural gas Dry gas
(MMb) (MMMcf) (MMboe) (MMb) (MMb) (MMb) (MMboe) (MMMcf) (MMMcf)
Total (3P) 295,167.5 253,245.2 44,482.7 31,211.6 879.0 3,574.7 8,817.4 61,358.5 45,858.8Proved 148,695.2 177,925.5 14,717.2 10,501.2 559.6 1,125.7 2,530.7 18,076.7 13,161.8Probable 84,913.6 42,269.8 15,144.4 10,819.4 155.6 1,198.4 2,971.0 20,562.1 15,452.02P 233,608.8 220,195.4 29,861.6 21,320.6 715.1 2,324.2 5,501.7 38,638.8 28,613.8Possible 61,558.6 33,049.9 14,621.2 9,891.1 163.9 1,250.5 3,315.8 22,719.7 17,245.0* Gas liquids from processing plants.** The liquid obtained assumes a heat value equivalent to the Maya crude oil and an average mixture of the dry gas obtained at Cactus, Ciudad PEMEX and Nuevo PEMEX.Note: All the units are expressed at atmospheric conditions and assume 15.6° C and 14.7 lb of pressure per square inch..
Remaining hydrocarbon reserves Remaining gas reservesOriginal volume
Table A3
Region Crude oil Natural gas Crude oil Natural gas Crude oil Natural gas Crude oil Natural gas(MMb) (MMMcf) (MMb) (MMMcf) (MMb) (MMMcf) (MMb) (MMMcf)
1,216.3 1,758.6 1,188.3 1,955.0 1,124.8 2,211.3 35,875.5 59,124.7Northeastern Marine 860.3 338.6 804.7 335.9 738.7 422.4 15,280.1 6,587.3
Cantarell 742.9 277.6 657.3 262.0 546.2 344.9 12,879.2 5,350.6Ku-Maloob-Zaap 117.4 61.0 147.4 73.9 192.4 77.5 2,400.9 1,236.7
Southwestern Marine 144.6 239.0 173.4 312.5 184.6 362.3 5,469.9 6,325.4Abkatún-Pol-Chuc 109.4 157.6 121.2 187.1 114.0 198.6 5,105.0 5,512.9Litoral de Tabasco 35.2 81.4 52.2 125.4 70.7 163.6 364.9 812.5
Northern 30.2 669.9 30.8 813.1 31.7 932.9 5,636.7 19,533.7Burgos 0.0 444.3 0.0 485.5 0.0 515.3 33.3 9,947.7Poza Rica-Altamira 29.8 43.4 30.3 63.5 31.0 81.2 5,528.4 7,587.2Veracruz 0.4 182.2 0.5 264.0 0.7 336.4 75.1 1,998.7
Southern 181.2 511.1 179.3 493.5 169.8 493.8 9,488.8 26,678.3Bellota-Jujo 81.8 102.9 80.0 99.1 69.4 87.5 2,856.9 4,347.8Cinco Presidentes 14.2 22.9 14.4 20.7 16.3 22.4 1,720.1 2,093.2Macuspana 1.8 61.1 2.4 70.4 3.8 81.4 23.0 5,555.9Muspac 12.1 164.0 12.2 134.5 12.3 113.5 1,672.9 9,158.1Samaria-Luna 71.3 160.2 70.3 168.9 68.1 188.9 3,215.9 5,523.3
Note: All the units are expressed at atmospheric conditions and assume 15.6° C and 14.7 lb of pressure per square inch..
Petróleos Mexicanos, Subsidiary Entities and Subsidiary CompaniesHydrocarbon production by region
2005 2006 December 31, 20072007Cumulative as of
19/24 www.pemex.com

PEMEX Investor Relations
Hydrocarbon reserves as of December 31, 2007
Table A4
(MMb) (MMMcf) (MMboe) (MMb) (MMb) (MMb) (MMboe) (MMMcf) (MMMcf)
295,167.5 253,245.2 44,482.7 31,211.6 879.0 3,574.7 8,817.4 61,358.5 45,858.8Northeastern Marine 64,920.2 26,410.4 13,357.7 11,936.8 616.4 283.5 521.0 5,382.7 2,709.7Southwestern Marine 24,163.4 31,161.6 4,759.9 2,927.8 147.3 422.3 1,262.5 8,269.3 6,566.2Northern 165,934.0 123,418.8 20,149.0 12,546.0 19.4 1,970.5 5,613.0 37,546.1 29,193.0Southern 40,149.8 72,254.5 6,216.1 3,801.0 95.8 898.4 1,420.9 10,160.4 7,389.9
148,695.2 177,925.5 14,717.2 10,501.2 559.6 1,125.7 2,530.7 18,076.7 13,161.8Northeastern Marine 54,029.8 24,321.0 7,024.6 6,052.8 407.5 200.7 363.6 3,635.6 1,891.2Southwestern Marine 16,625.7 19,652.2 1,630.1 994.9 61.2 176.7 397.3 2,787.4 2,066.4Northern 41,176.5 66,792.6 1,721.5 840.7 8.2 102.4 770.2 4,479.7 4,005.7Southern 36,863.3 67,159.8 4,341.1 2,612.8 82.8 645.9 999.5 7,174.0 5,198.5
84,913.6 42,269.8 15,144.4 10,819.4 155.6 1,198.4 2,971.0 20,562.1 15,452.0Northeastern Marine 2,851.8 684.0 3,290.2 3,085.0 98.6 37.9 68.6 784.7 357.0Southwestern Marine 3,328.2 4,621.8 1,404.7 911.9 40.9 115.3 336.6 2,214.3 1,750.5Northern 76,576.8 33,279.3 9,234.1 6,056.7 5.0 883.0 2,289.5 15,624.9 11,907.7Southern 2,156.9 3,684.7 1,215.3 765.8 11.0 162.3 276.2 1,938.2 1,436.7
2P 233,608.8 220,195.4 29,861.6 21,320.6 715.1 2,324.2 5,501.7 38,638.8 28,613.8Northeastern Marine 56,881.5 25,005.0 10,314.8 9,137.8 506.1 238.6 432.3 4,420.3 2,248.2Southwestern Marine 19,953.9 24,274.0 3,034.8 1,906.8 102.1 292.0 733.9 5,001.7 3,816.9Northern 117,753.3 100,071.9 10,955.6 6,897.3 13.1 985.4 3,059.7 20,104.6 15,913.4Southern 39,020.2 70,844.5 5,556.4 3,378.6 93.8 808.2 1,275.8 9,112.2 6,635.1
61,558.6 33,049.9 14,621.2 9,891.1 163.9 1,250.5 3,315.8 22,719.7 17,245.0Northeastern Marine 8,038.7 1,405.3 3,042.9 2,799.0 110.3 44.8 88.7 962.4 461.4Southwestern Marine 4,209.6 6,887.6 1,725.1 1,020.9 45.2 130.4 528.6 3,267.6 2,749.2Northern 48,180.7 23,346.9 9,193.4 5,648.7 6.3 985.1 2,553.3 17,441.5 13,279.6Southern 1,129.6 1,410.0 659.8 422.4 2.0 90.2 145.1 1,048.2 754.8
* Gas liquids from processing plants.** The liquid obtained assumes a heat value equivalent to the Maya crude oil and an average mixture of the dry gas obtained at Cactus, Ciudad PEMEX and Nuevo PEMEX.Note: All the units are expressed at atmospheric conditions and assume 15.6° C and 14.7 lb of pressure per square inch..
Possible
Proved
Probable
Natural gas Dry gas
Total (3P)
Condensate Plant liquids* Dry gas equivalent **Crude oil Natural gas Crude oil
equivalent Crude oilRegion
Remaining hydrocarbon reserves Remaining gas reservesOriginal volume
Petróleos Mexicanos, Subsidiary Entities and Subsidiary CompaniesHydrocarbon reserves in 2007
Table A5
(MMb) (MMMcf) (MMboe) (MMb) (MMb) (MMb) (MMboe) (MMMcf) (MMMcf)
64,920.2 26,410.4 13,357.7 11,936.8 616.4 283.5 521.0 5,382.7 2,709.7Cantarell 39,054.0 18,198.3 7,139.4 6,276.7 320.7 189.7 352.3 3,245.0 1,832.2Ku-Maloob-Zaap 25,866.3 8,212.0 6,218.2 5,660.1 295.7 93.8 168.7 2,137.8 877.5
54,029.8 24,321.0 7,024.6 6,052.8 407.5 200.7 363.6 3,635.6 1,891.2Cantarell 38,248.5 17,964.3 4,218.2 3,603.3 230.9 136.3 247.7 2,307.7 1,288.3Ku-Maloob-Zaap 15,781.3 6,356.7 2,806.4 2,449.4 176.6 64.5 115.9 1,327.9 603.0
2,851.8 684.0 3,290.2 3,085.0 98.6 37.9 68.6 784.7 357.0Cantarell 264.4 25.2 1,162.2 1,082.5 29.2 17.9 32.6 300.5 169.7Ku-Maloob-Zaap 2,587.3 658.8 2,128.0 2,002.5 69.5 20.0 36.0 484.3 187.3
2P 56,881.5 25,005.0 10,314.8 9,137.8 506.1 238.6 432.3 4,420.3 2,248.2Cantarell 38,512.9 17,989.6 5,380.4 4,685.9 260.0 154.2 280.3 2,608.1 1,458.0Ku-Maloob-Zaap 18,368.6 7,015.4 4,934.4 4,451.9 246.1 84.5 151.9 1,812.1 790.2
8,038.7 1,405.3 3,042.9 2,799.0 110.3 44.8 88.7 962.4 461.4Cantarell 541.1 208.7 1,759.0 1,590.8 60.7 35.5 72.0 636.8 374.2Ku-Maloob-Zaap 7,497.6 1,196.6 1,283.8 1,208.2 49.6 9.3 16.8 325.6 87.2
* Gas liquids from processing plants.** The liquid obtained assumes a heat value equivalent to the Maya crude oil and an average mixture of the dry gas obtained at Cactus, Ciudad PEMEX and Nuevo PEMEX.Note: All the units are expressed at atmospheric conditions and assume 15.6° C and 14.7 lb of pressure per square inch..
Possible
Proved
Probable
Natural gas Dry gas
Total (3P)
Condensate Plant liquids* Dry gas equivalent **Crude oil Natural gas Crude oil
equivalent Crude oilField
Remaining hydrocarbon reserves Remaining gas reservesOriginal volume
Petróleos Mexicanos, Subsidiary Entities and Subsidiary CompaniesHydrocarbon reserves of the Northeastern Marine Region in 2007
20/24 www.pemex.com
PEMEX Investor Relations
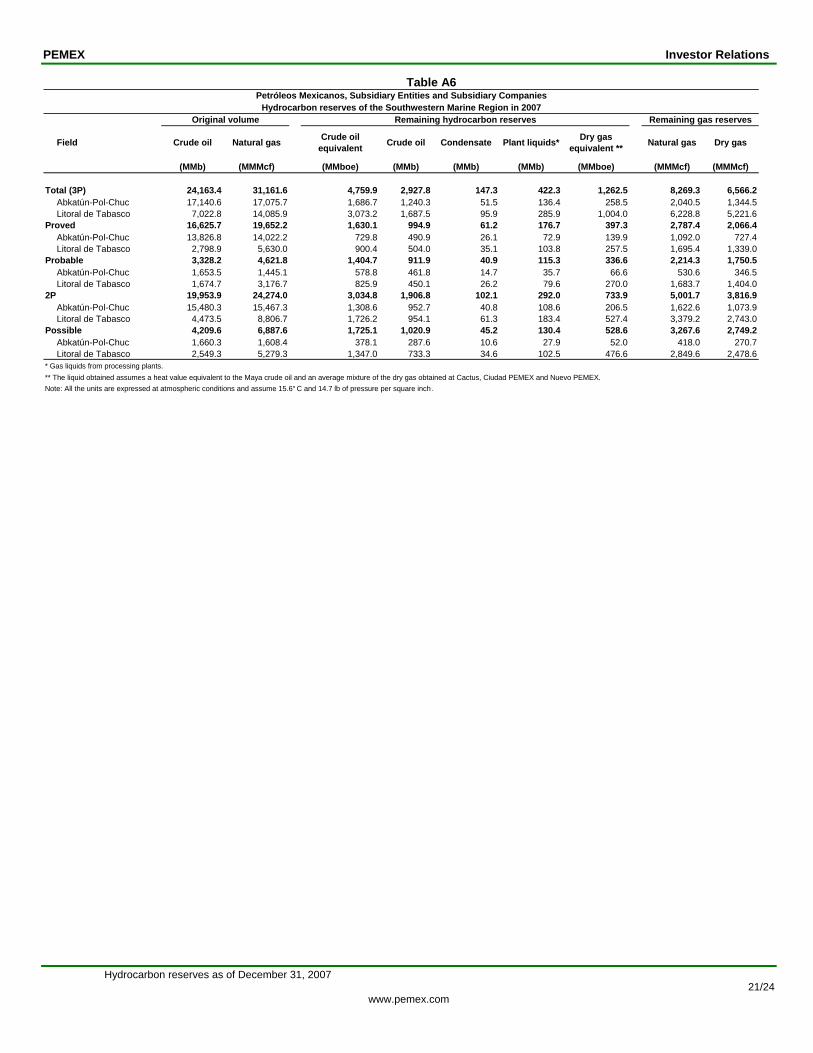
Table A6
(MMb) (MMMcf) (MMboe) (MMb) (MMb) (MMb) (MMboe) (MMMcf) (MMMcf)
24,163.4 31,161.6 4,759.9 2,927.8 147.3 422.3 1,262.5 8,269.3 6,566.2Abkatún-Pol-Chuc 17,140.6 17,075.7 1,686.7 1,240.3 51.5 136.4 258.5 2,040.5 1,344.5Litoral de Tabasco 7,022.8 14,085.9 3,073.2 1,687.5 95.9 285.9 1,004.0 6,228.8 5,221.6
16,625.7 19,652.2 1,630.1 994.9 61.2 176.7 397.3 2,787.4 2,066.4Abkatún-Pol-Chuc 13,826.8 14,022.2 729.8 490.9 26.1 72.9 139.9 1,092.0 727.4Litoral de Tabasco 2,798.9 5,630.0 900.4 504.0 35.1 103.8 257.5 1,695.4 1,339.0
3,328.2 4,621.8 1,404.7 911.9 40.9 115.3 336.6 2,214.3 1,750.5Abkatún-Pol-Chuc 1,653.5 1,445.1 578.8 461.8 14.7 35.7 66.6 530.6 346.5Litoral de Tabasco 1,674.7 3,176.7 825.9 450.1 26.2 79.6 270.0 1,683.7 1,404.0
2P 19,953.9 24,274.0 3,034.8 1,906.8 102.1 292.0 733.9 5,001.7 3,816.9Abkatún-Pol-Chuc 15,480.3 15,467.3 1,308.6 952.7 40.8 108.6 206.5 1,622.6 1,073.9Litoral de Tabasco 4,473.5 8,806.7 1,726.2 954.1 61.3 183.4 527.4 3,379.2 2,743.0
4,209.6 6,887.6 1,725.1 1,020.9 45.2 130.4 528.6 3,267.6 2,749.2Abkatún-Pol-Chuc 1,660.3 1,608.4 378.1 287.6 10.6 27.9 52.0 418.0 270.7Litoral de Tabasco 2,549.3 5,279.3 1,347.0 733.3 34.6 102.5 476.6 2,849.6 2,478.6
* Gas liquids from processing plants.** The liquid obtained assumes a heat value equivalent to the Maya crude oil and an average mixture of the dry gas obtained at Cactus, Ciudad PEMEX and Nuevo PEMEX.Note: All the units are expressed at atmospheric conditions and assume 15.6° C and 14.7 lb of pressure per square inch..
Possible
Proved
Probable
Natural gas Dry gas
Total (3P)
Condensate Plant liquids* Dry gas equivalent **Crude oil Natural gas Crude oil
equivalent Crude oilField
Remaining hydrocarbon reserves Remaining gas reservesOriginal volume
Petróleos Mexicanos, Subsidiary Entities and Subsidiary CompaniesHydrocarbon reserves of the Southwestern Marine Region in 2007
Hydrocarbon reserves as of December 31, 2007 21/24
www.pemex.com

PEMEX Investor Relations
Table A7
(MMb) (MMMcf) (MMboe) (MMb) (MMb) (MMb) (MMboe) (MMMcf) (MMMcf)
165,934.0 123,418.8 20,149.0 12,546.0 19.4 1,970.5 5,613.0 37,546.1 29,193.0Burgos 142.3 21,882.1 1,006.4 0.0 17.4 77.3 911.7 4,946.3 4,741.7Poza Rica-Altamira 164,937.8 95,582.0 18,874.9 12,512.3 0.0 1,887.5 4,475.1 31,391.9 23,274.7Veracruz 854.0 5,954.7 267.7 33.7 2.0 5.7 226.2 1,207.9 1,176.6
41,176.5 66,792.6 1,721.5 840.7 8.2 102.4 770.2 4,479.7 4,005.7Burgos 130.0 16,712.2 410.0 0.0 7.3 32.8 369.9 2,008.2 1,923.7Poza Rica-Altamira 40,235.8 44,249.2 1,096.9 829.1 0.0 67.1 200.6 1,421.6 1,043.2Veracruz 810.7 5,831.1 214.6 11.5 0.9 2.5 199.7 1,049.9 1,038.8
76,576.8 33,279.3 9,234.1 6,056.7 5.0 883.0 2,289.5 15,624.9 11,907.7Burgos 8.6 2,189.1 242.7 0.0 4.5 20.1 218.1 1,183.6 1,134.2Poza Rica-Altamira 76,568.2 31,089.2 8,972.5 6,050.1 0.0 861.6 2,060.7 14,379.1 10,717.8Veracruz 0.0 1.0 18.9 6.5 0.4 1.2 10.7 62.2 55.7
2P 117,753.3 100,071.9 10,955.6 6,897.3 13.1 985.4 3,059.7 20,104.6 15,913.4Burgos 138.6 18,901.3 652.7 0.0 11.8 52.9 588.0 3,191.8 3,057.9Poza Rica-Altamira 116,804.0 75,338.4 10,069.4 6,879.3 0.0 928.7 2,261.3 15,800.7 11,761.0Veracruz 810.7 5,832.1 233.5 18.1 1.3 3.7 210.4 1,112.1 1,094.5
48,180.7 23,346.9 9,193.4 5,648.7 6.3 985.1 2,553.3 17,441.5 13,279.6Burgos 3.7 2,980.7 353.7 0.0 5.6 24.3 323.8 1,754.5 1,683.8Poza Rica-Altamira 48,133.7 20,243.6 8,805.6 5,633.1 0.0 958.8 2,213.8 15,591.2 11,513.6Veracruz 43.3 122.6 34.2 15.6 0.7 2.0 15.8 95.8 82.1
* Gas liquids from processing plants.** The liquid obtained assumes a heat value equivalent to the Maya crude oil and an average mixture of the dry gas obtained at Cactus, Ciudad PEMEX and Nuevo PEMEX.Note: All the units are expressed at atmospheric conditions and assume 15.6° C and 14.7 lb of pressure per square inch..
Possible
Proved
Probable
Natural gas Dry gas
Total (3P)
Condensate Plant liquids* Dry gas equivalent **Crude oil Natural gas Crude oil
equivalent Crude oilField
Remaining hydrocarbon reserves Remaining gas reservesOriginal volume
Petróleos Mexicanos, Subsidiary Entities and Subsidiary CompaniesHydrocarbon reserves of the Northern Region in 2007
Table A8
(MMb) (MMMcf) (MMboe) (MMb) (MMb) (MMb) (MMboe) (MMMcf) (MMMcf)
40,149.8 72,254.5 6,216.1 3,801.0 95.8 898.4 1,420.9 10,160.4 7,389.9Bellota-Jujo 12,170.0 15,433.1 1,954.5 1,290.5 58.6 249.4 356.0 2,718.6 1,851.7Cinco Presidentes 6,956.7 6,705.3 482.8 376.1 0.0 40.8 65.9 526.4 342.6Macuspana 384.1 9,030.8 392.0 79.2 0.6 77.8 234.4 1,441.1 1,218.9Muspac 7,051.0 23,847.3 715.5 265.1 8.7 178.2 263.5 1,922.8 1,370.6Samaria-Luna 13,587.9 17,237.9 2,671.4 1,790.1 28.0 352.1 501.1 3,551.5 2,606.1
36,863.3 67,159.8 4,341.1 2,612.8 82.8 645.9 999.5 7,174.0 5,198.5Bellota-Jujo 11,038.8 13,914.8 1,550.9 998.9 52.3 206.2 293.6 2,250.2 1,526.9Cinco Presidentes 6,676.7 6,242.3 273.6 212.1 0.0 23.5 38.0 298.0 197.4Macuspana 204.3 7,600.0 139.1 20.8 0.5 17.3 100.4 574.7 522.2Muspac 6,767.4 23,074.0 415.0 109.6 6.5 123.3 175.6 1,277.9 913.3Samaria-Luna 12,176.1 16,328.6 1,962.5 1,271.5 23.5 275.5 392.0 2,773.2 2,038.7
2,156.9 3,684.7 1,215.3 765.8 11.0 162.3 276.2 1,938.2 1,436.7Bellota-Jujo 1,079.9 1,473.8 375.9 278.7 5.6 37.8 53.8 403.8 279.6Cinco Presidentes 160.5 267.0 84.6 64.0 0.0 7.9 12.7 92.2 66.1Macuspana 118.9 894.5 148.8 32.2 0.0 32.0 84.6 529.1 439.8Muspac 191.5 580.7 115.2 48.7 1.2 25.1 40.3 309.1 209.7Samaria-Luna 606.0 468.8 490.8 342.2 4.2 59.6 84.9 603.9 441.4
2P 39,020.2 70,844.5 5,556.4 3,378.6 93.8 808.2 1,275.8 9,112.2 6,635.1Bellota-Jujo 12,118.7 15,388.6 1,926.8 1,277.6 57.9 244.0 347.3 2,654.1 1,806.5Cinco Presidentes 6,837.2 6,509.3 358.1 276.1 0.0 31.4 50.7 390.2 263.5Macuspana 323.2 8,494.5 287.9 53.0 0.6 49.3 185.0 1,103.9 962.0Muspac 6,958.9 23,654.7 530.2 158.3 7.7 148.4 215.9 1,587.0 1,123.0Samaria-Luna 12,782.1 16,797.4 2,453.3 1,613.7 27.7 335.1 476.9 3,377.1 2,480.1
1,129.6 1,410.0 659.8 422.4 2.0 90.2 145.1 1,048.2 754.8Bellota-Jujo 51.3 44.5 27.7 12.9 0.7 5.4 8.7 64.5 45.2Cinco Presidentes 119.5 196.0 124.7 100.0 0.0 9.4 15.2 136.2 79.1Macuspana 60.9 536.3 104.1 26.2 0.0 28.5 49.4 337.2 256.9Muspac 92.1 192.6 185.3 106.8 1.1 29.8 47.6 335.8 247.6Samaria-Luna 805.8 440.5 218.0 176.5 0.3 17.0 24.2 174.4 126.0
* Gas liquids from processing plants.** The liquid obtained assumes a heat value equivalent to the Maya crude oil and an average mixture of the dry gas obtained at Cactus, Ciudad PEMEX and Nuevo PEMEX.Note: All the units are expressed at atmospheric conditions and assume 15.6° C and 14.7 lb of pressure per square inch..
Total (3P)
Proved
Probable
Possible
Dry gas equivalent ** Natural gas Dry gas
Petróleos Mexicanos, Subsidiary Entities and Subsidiary CompaniesHydrocarbon reserves of the Southern Region in 2007
Original volume Remaining hydrocarbon reserves Remaining gas reserves
Crude oil CondensateField Crude oil Natural gas Plant liquids*Crude oil equivalent
Hydrocarbon reserves as of December 31, 2007
22/24 www.pemex.com

PEMEX Investor Relations
Hydrocarbon reserves as of December 31, 2007 23/24
www.pemex.com
If you need to contact Investor Relations or to be included in the distribution list, please call or send an e-mail to: Telephone: (52 55) 1944 9700 Voice mail: (52 55) 1944 2500 ext. 59412 [email protected] Celina Torres Andrés Brügmann [email protected] [email protected] Eduardo Ruíz-Healy Rebeca González [email protected] [email protected] Guillermo Regalado [email protected] PEMEX is Mexico’s national oil and gas company. Created in 1938, it is the exclusive producer of Mexico’s oil and gas resources. The operating subsidiary entities are Pemex-Exploration and Production, Pemex-Refining, Pemex-Gas and Basic Petrochemicals and Pemex-Petrochemicals. The principal subsidiary company is PMI, its international trading arm. Amounts in US dollars are translated at the Discoveries 2003-2007 Discoveries refer to the incorporation of reserves due to successful exploratory wells drilled in new reservoirs. From 2003 to 2007, 3P reserves of 4,595 million barrels of oil equivalent (MMboe) were discovered; 2,704 million barrels consisted of crude oil and 9.059 trillion cubic feet of natural gas. Discoveries of proved reserves represented 19% of total discoveries and discoveries of probable and possible reserves represented 30% and 51% respectively. Sustained activities in exploration during this period yielded annual additions of 3P reserves of more than 900 MMboe during the past four years. Moreover, the development of fields has allowed PEMEX to sustain crude oil production at 3 million barrels per day since 2000, and to increase natural gas production since 2002. exchange rate of Ps. 10.8662 per US dollar. This report contains forward-looking statements. We may also make written or oral forward-looking statements in our periodic reports to the Mexican National Banking and Securities Commission (CNBV) and the Securities and Exchange Commission (SEC), in our annual report, in our offering circulars and prospectuses, in press releases and other written materials and in oral statements made by our officers, directors or employees to third parties. We may include forward-looking statements that address, among other things, our:
drilling and exploration activities; import and export activities; projected investment and other costs, commitments and revenues and liquidity.
Actual results could differ materially from those projected in such forward-looking statements as a result of factors beyond our control. These factors include, but are not limited to:
changes in international crude oil and natural gas prices; effects on us from competition; limitations on our access to sources of financing on competitive terms; significant economic or political developments in Mexico; developments affecting the energy sector; and changes in our regulatory environment.
Accordingly, you should not place undue reliance on these forward-looking statements. In any event, these statements speak only as of their dates, and we undertake no obligation to update or revise any of them, whether as a result of new information, future events or

PEMEX Investor Relations
Hydrocarbon reserves as of December 31, 2007 24/24
www.pemex.com
otherwise. These risks and uncertainties are more fully detailed in PEMEX’s most recent Form 20-F filing, as amended, with the SEC (www.sec.gov) and the PEMEX prospectus filed with the CNBV and available through the Mexican Stock Exchange (www.bmv.com.mx). These factors could cause actual results to differ materially from those contained in any forward-looking statement. The SEC permits oil and gas companies, in their filings, to disclose only proved reserves that a company has demonstrated by actual production or conclusive formation tests to be economically and legally producible under existing economic and operating conditions. We use certain terms in this document, such as total reserves, probable reserves and possible reserves, that the SEC's guidelines strictly prohibit us from including in filings. Investors are urged to consider closely the disclosure in our Form 20-F, as amended, “File No. 0-99”, available from us at www.pemex.com or Marina Nacional 329, Floor 38, Col. Huasteca, Mexico City 11311 or at (52 55) 1944 9700. You can also obtain this form directly from the SEC by calling 1-800-SEC-0330.. EBITDA and free cash-flow are non-US GAAP measures.