hydrocarbon and by-product reserves in british …
TRANSCRIPT

HYDROCARBON AND BY-PRODUCTRESERVES IN BRITISH COLUMBIA2011
what why when where
We are the BC Oil and Gas Commission.
who

The BC Oil and Gas Commission (Commission) is a single window regulatory agency with responsibilities for regulating oil and gas operations in British Columbia, including exploration, development, pipeline transportation and reclamation.
The Commission’s core roles include reviewing and assessing applications for industry activity, consulting with First Nations, ensuring industry complies with provincial legislation and cooperating with partner agencies. The public interest is protected through the objectives of ensuring public safety, protecting the environment, conserving petroleum resources and ensuring equitable participation in production.
The Commission works with communities, industry and First Nations to minimize the surface area and effects of oil and gas development. The Commission plays a role as a steward of the environment and the goal is to deepen the understanding of interplay between surface and subsurface resource development.
Mission We regulate oil and gas activities for the benefit of British Columbians.
We achieve this by:• Protecting public safety,• Respecting those affected by oil and gas activities,• Conserving the environment, and• Supporting resource development.
Through the active engagement of our stakeholders and partners, we provide fair and timely decisions within our regulatory framework.
We support opportunities for employee growth, recognize individual and group contributions, demonstrate accountability at all levels, and instill pride and confidence in our organization.
We serve with a passion for excellence.
Vision
To be the leading oil and gas regulator in Canada.
Values
Respectful Efficient
Accountable Responsive
Effective Transparent
About the
BC Oil and Gas Commission
Fort St. John Fort NelsonDawson Creek KelownaVictoriawww.bcogc.ca

4
571922
56699101114141516171718181920212832
2323242627292930313233
3434
Table of Contents
Summary ....................................................................................................................................................................................
Discussion A. Oil Reserves ................................................................................................................................................. B. Gas Reserves ............................................................................................................................................... C. By-Product Reserves .................................................................................................................................... D. Additional Information ................................................................................................................................... Figures 1. Historical Remaining Oil Reserves Versus R/P Ratio ................................................................................... 2. Historical Remaining Oil Reserves Versus Annual Production ..................................................................... 3. Oil Reserves – Reserve Additions per Well Drilled ....................................................................................... 4. Approximate Producing Well Count at Various Stages of Resource Play Development ............................... 5. Recommended Maximum Number of PUD Offsets at Various Stages of Resource Development ............... 6. Example Cumulative Distribution 1................................................................................................................ 7. Regional Northern Montney Pools ................................................................................................................ 8. Historical Remaining Gas Reserves Versus R/P Ratio ................................................................................. 9. Historical Remaining Gas Reserves Versus Annual Production ................................................................... 10. Gas Reserves - Reserve Additons Per Well Drilled ...................................................................................... 11. Conventional Versus Unconventional Gas in NEBC ..................................................................................... 12. Conventional Versus Unconventional 2011 Remaining Recoverable Raw Gas Reserves TCF ................... 13. Conventional Versus Unconventional 2011 Initial Recoverable Raw Gas Reserves .................................... 14. Horn River Basin ........................................................................................................................................... 15. Montney ........................................................................................................................................................ 16. Sour Gas Map of Northeast British Columbia ............................................................................................... 17. Annual Condensate, NGL and Oil Production .............................................................................................. 18. Annual Oil Versus Total Condensate Production .......................................................................................... 19. Initial Oil and Raw Gas Reserves by Geolgoical Period ............................................................................... 20. Unconnected Gas Reserves by Plant Area ..................................................................................................
Tables I Established Hydrocarbon Reserves (SI Units) ............................................................................................. II Established Hydrocarbon Reserves (Imperial Units) .................................................................................... III Historical Record of Established Reserves .................................................................................................. IV Established Oil Reserve Changes ................................................................................................................ V Established Raw Gas Reserve Changes ...................................................................................................... VI(a) Initial Recoverable Oil Reserves by Geological Period ................................................................................ VI(b) Initial Recoverable Raw Gas Reserves by Geological Period ...................................................................... VII Oil Pools Under Waterflood .......................................................................................................................... VIII Oil Pools Under Gas Injection ...................................................................................................................... IX Unconnected Gas Reserves by Plant Area .................................................................................................. X Project/Unit Cross-Reference Listing ............................................................................................................
Reserves Terminology....................................................................................................................................................................Definitions ...................................................................................................................................................................................

4Hydrocarbon and By-Product Reserves in British Columbia 2011
This report presents estimates of British Columbia’s oil, natural gas and associated by-product reserves as of Dec. 31, 2011. The estimates have been prepared by the BC Oil and Gas Commission (Commission) utilizing the most currently available geologic and reservoir interpretations. The reserve estimates represent established reserves and are based on accepted geological and engineering practices.
British Columbia’s Remaining Established Reserves as of Dec. 31, 2011, together with a comparison of the Dec. 31, 2010 reserves, are summarized below.
OIL
Remaining Established Reserves
2010 2011
GAS
BY-PRODUCTS
18.7 106 m3
(117.7 MMSTB)
Total, raw
Unconnected Gas22.3 109 m3
(0.792 TCF)22.4 109 m3
(0.795 TCF)
974.9 109 m3
(34.6 TCF)932.0 109 m3
(33.1 TCF)
Raw
LPG 28.9 106 m3
(168.0 MMSTB)30.5 106 m3
(192.2 MMSTB)
Pentanes+ 11.1 106 m3
(69.9 MMSTB)11.3 106 m3
(71.1 MMSTB)
Sulphur 14.4 106 tonnes(14.2 MMLT)
13.7 106 tonnes(13.5 MMLT)
18.2 106 m3
(114.5 MMSTB)
Summary

5Hydrocarbon and By-Product Reserves in British Columbia 2011
DISCUSSION
A. Oil Reserves
The province’s oil production for the 2011 calendar year was 1,154 103 m3, which is a slight decrease of 2010’s volume of 1,270 103 m3*.
There were 52 oil wells (Figure 3) drilled during 2011, predominantly in the Hay River Bluesky A oil pool. This development activity was the major contributor to supporting remaining oil reserves.
The largest positive revision resulted from a performance review of the Lower Halfway A pool within the Fireweed area. This revision accounted for 364.8 103 m3 or 77 per cent of the total revisions that took place during 2011. Overall changes to oil reserves yielded an increase of 475 103 m3.
Drilling activity resulted in four new oil pools being discovered: Flatrock-Halfway O, Cache Creek-Doig CC, Helmet-Tetcho C and Monias-Charlie Lake B. These new pools increased the Initial Reserves by 99 103 m3.
The overall increase to the Initial Oil Reserve elevated the remaining reserves to production ratio (R/P ratio) from 14.7 years in 2010 to 15.5 years in 2011 (Figures 1 and 2).
This increase in oil well drilling, however, did not increase the reserves added per well. There was a decrease going from 47 103 m3 in 2010 to 11 103 m3 in 2011 (Figure 3).
British Columbia’s oil reserves continue to be dominated by secondary recovery schemes. Waterflood pools account for 47 per cent of remaining oil reserves (Table VII) with Hay River and Boundary Lake still being the dominant contributors.
Gas injection is currently occurring in four pools (Table VIII) and contributes about one per cent to the provincial remaining reserves.
*Note: 2010 oil production figures have been adjusted to actual figures from the Ministry of Finance.
Figure 1: Historical Remaining Oil Reserves Versus R/P Ratio
Rem
aini
ng R
eser
ves
(Milli
ons
of C
ubic
Met
res)
R/P
Rat
io (Y
ears
)
R/P Ratio
Remaining Reserves
Year 1987 1989 1991 1993 1995 1997 1999 2001 2003 2005 2007 2009 2011

6Hydrocarbon and By-Product Reserves in British Columbia 2011
DISCUSSIONR
emai
ning
Res
erve
s (M
illion
s of
Cub
ic M
etre
s)
Figure 3: Oil Reserves - Reserve Additions Per Well Drilled
Annu
al Pr
oduc
tion (
Millio
ns of
Cub
ic Me
tres)
Annual Production
Remaining Reserves
Res
erve
Add
ition
s (T
hous
ands
of C
ubic
Met
res)
Well
s Drill
ed
Figure 2: Historical Remaining Oil Reserves Versus Annual Production
Year 1991 1992 1993 1994 1995 1996 1997 1998 1999 2000 2001 2002 2003 2004 2005 2006 2007 2008 2009 2010 2011
Wells Drilled
Reserve Additions/Wells
Year 1987 1989 1991 1993 1995 1997 1999 2001 2003 2005 2007 2009 2011

7Hydrocarbon and By-Product Reserves in British Columbia 2011
DISCUSSIONB. Gas Reserves
The province’s established Remaining Reserves of Raw Gas were 975 109 m3 as at Dec. 31, 2011, an increase of five per cent over the 2010 year-end reserves. Once again this represents the highest level of established Remaining Raw Gas reserves, which is due in part to shale gas exploration in north-east B.C.
Raw natural gas production for the year was 40.5 109 m3. This was a 22 per cent increase over the preceding year’s published production. The raw gas production for the year 2011 as reported by the Mineral, Oil and Gas Revenue Branch of the Ministry of Finance was 41.6 109 m3, an 18 per cent increase
over last year’s reported production. The discrepancy in reported raw gas production between agencies is due to the fact the Commission only reports raw natural gas production for wells associated with gas pools that have been assigned established reserves.
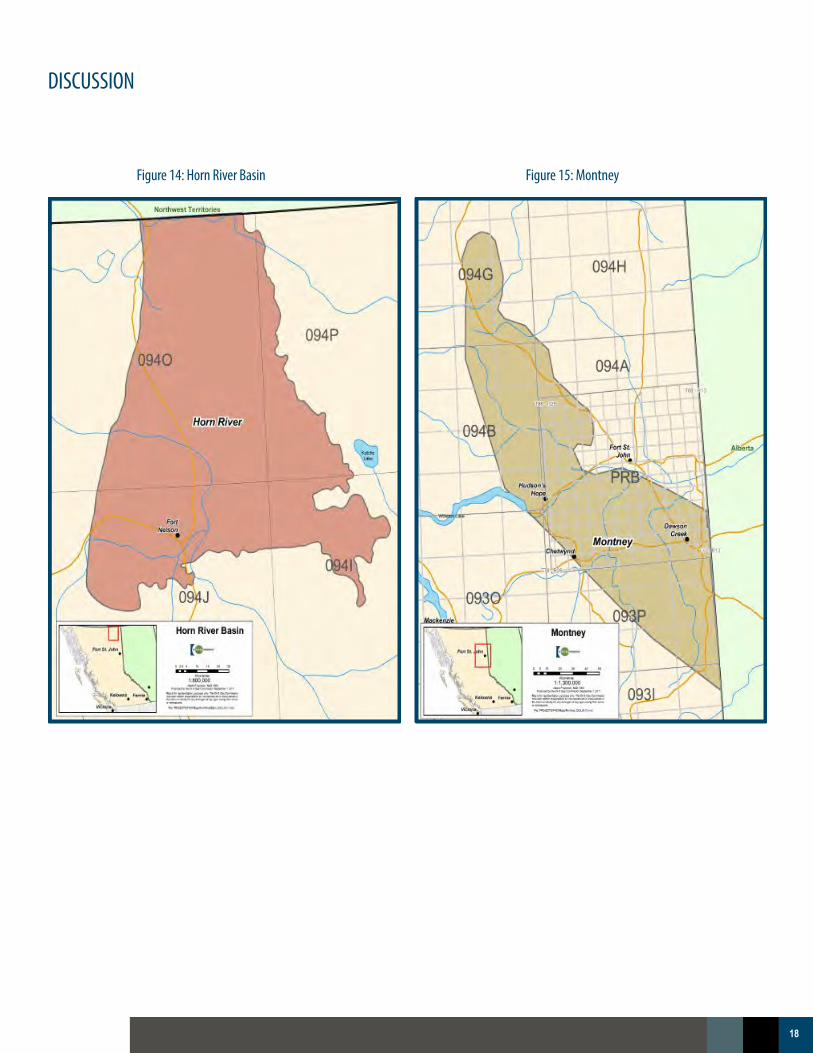
The development of B.C.’s unconventional gas deposits continue to contribute the bulk of the reserves additions for 2011. For this reporting period, a review of the mapping within the Horn River Basin shale gas play has resulted in an increase in initial raw gas reserves of 44.5 109 m3.
As of December 2011, there were a total of 159 producing shale gas wells in the Horn River Basin, with many still held in confidential status under the terms of Innovative Technology approvals. Production from the Horn River group of formations accounted for just over 9.7 per cent of 2011 total production in the province.
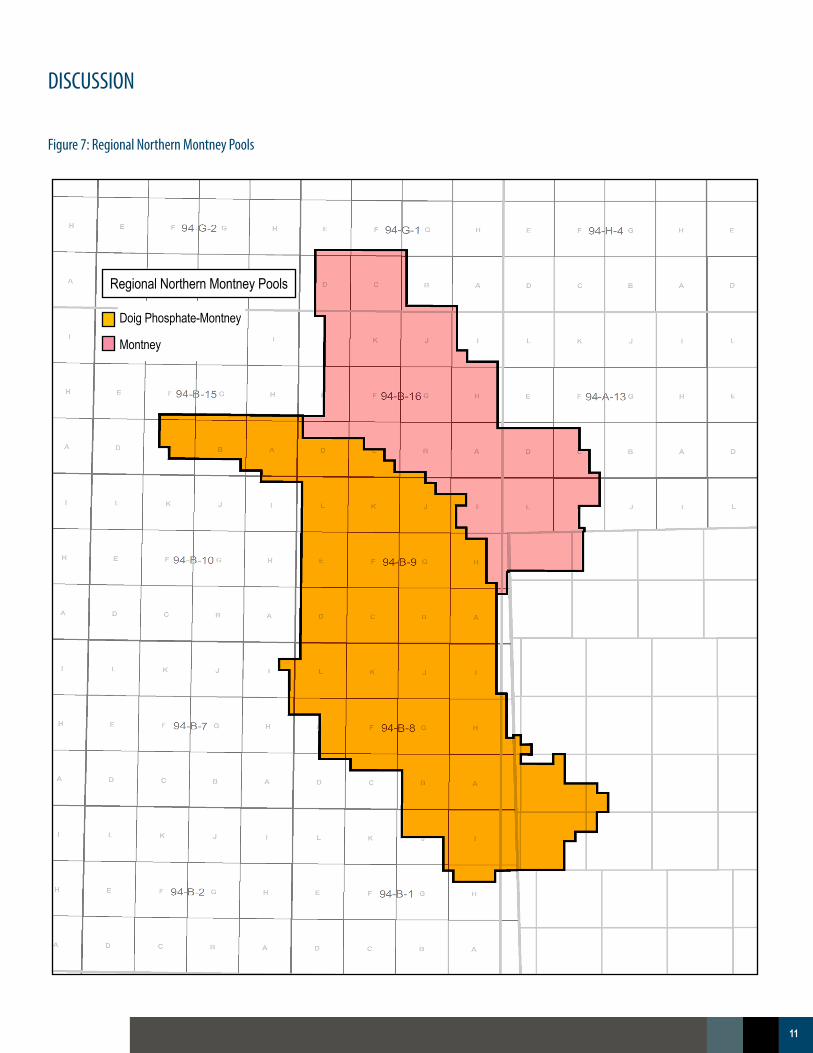
The Montney tight gas trend continued to be the most active natural gas play in British Columbia with 372 wells targeting the Montneyformation. These accounted for 62 per cent of all wells drilled in 2011 and extended the play to the northwest into the Altares and Town fields (Figure 7). This northwest trend enabled the creation of another Regional Field called the Northern Montney, which is comprised of the following: Doig Phosphate Montney pools from the fields of Altares, Chowade, Cypress, Kobes, Graham along with the Montney pools from Beg, Blueberry, Bernadet, Kobes, Town, Townsend, and single well pools formerly noted as Other Areas.
Montney production accounted for a little over 31 per cent of the total production within the province for 2011. Review and new mapping, primarily of the Northern Montney Regional Field, Doig Phosphate-Montney “A” and Montney “A” pools, added an additional 15.9 109 m3 to the Initial Gas Reserves.
Horn River 2010 2011
Producing wells 98 159
Cumulative Gas Prod (BCF) 74 237
Gas Trend Daily rate (MMCF/D) 392 382
Montney 2010 2011
Producing wells 603 981
Cumulative Gas Prod (BCF) 577 1,005
Gas Trend Daily rate (MMCF/D) 918 1,234

8Hydrocarbon and By-Product Reserves in British Columbia 2011
DISCUSSIONNorthern Montney Reserves
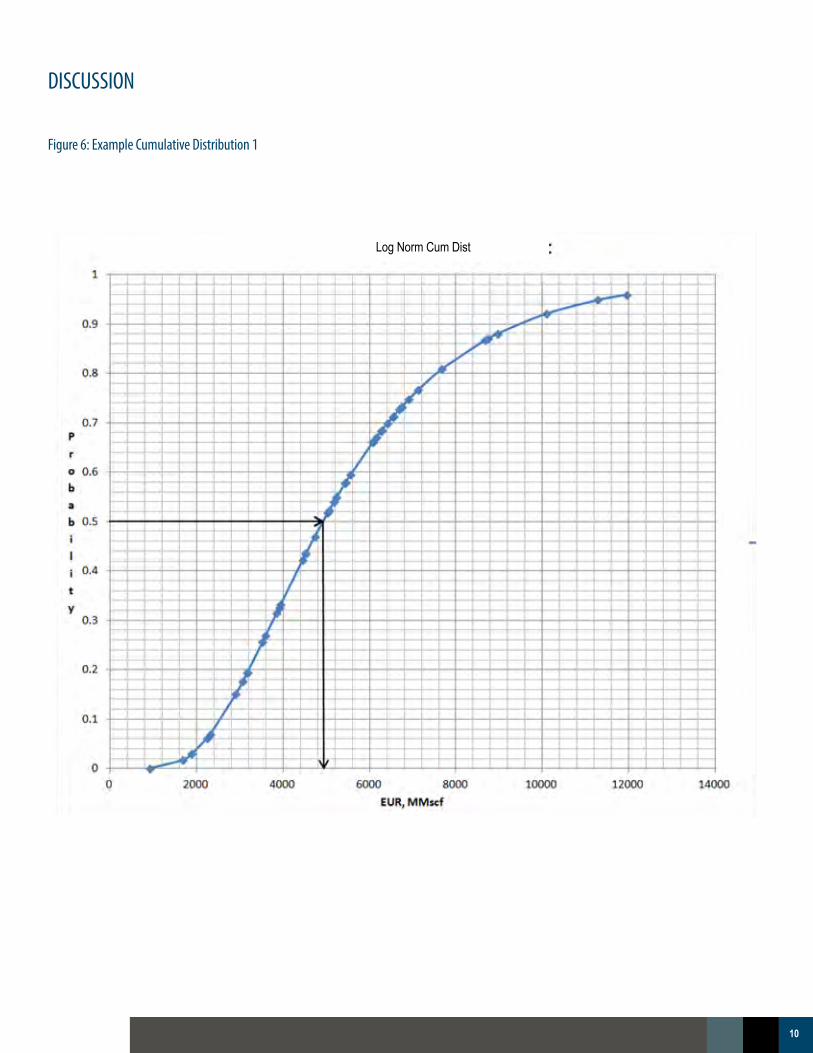
Determination of recoverable reserves for the Northern Montney Regional Field combined the statistical analysis methodology of Society of Petroleum Evaluation Engineers (SPEE) Monograph 3, “Guidelines for the Practical Evaluation of Undeveloped Reserves in Resource Plays” and decline curve analysis. The cumulative probability distribution of Estimated Ultimate Recovery (EUR) of wells in a pool was used to assign reserve volumes to developed and undeveloped gas spacing areas. P50 values were assigned to the current producing wells and P90 values were assigned to wells in undeveloped gas spacing areas (Figures 4 and 5).
1. Wells within the Northern Regional Montney Field, Doig Phosphate - Montney “A” pool and the Montney “A” pool were divided into sub-groups of vertical and horizontal wells.
2. Production data for all wells was utilized to create type curves and identify wells with analogous characteristics.
3. Production profiles of wells of the same vintage identified variations from group representative wells.
4. A power slope was applied to a plot of production versus time on log-log scale. The negative reciprocal of that slope is representative of the exponent used in decline analysis.
a. The decline exponent (either “b” or “N”) is segmented into transient and pseudo steady state dominated flow regimes. The time for transient flow is still unknown in most tight plays, specifically the Montney because of its relatively short production periods and extremely low permeability. As a result a period time of six years was used for the transient flow period based on industry consultations and analogy research.
5. EUR was determined for all the wells: an N value of 2.3 was used for the Doig Phosphate Montney “A” pool and an N value of 2.4 used for the Montney “A” pool. After six years an N value of 0.5 was applied to the curve and extended to an economic limit of 100mcf/d (2.8e3m3/d).
a. Due to variations in horizontal length, fracture stimulation and production practices, the value for decline percentage was left variable, but with restraints. The forecasted line was fit to the actual production data providing a more accurate description of early time data.
6. A lognormal distribution was assigned to each set of EUR data to develop cumulative probability curves, histograms and probability distributions (Figure 6).
a. The P90 and P50 were noted for the four data sets.
7. Referencing the PUD guidelines described in SPEE Monograph 3 a simple equation was derived to calculate reserves. a. Reserves = (Producing wells x P50 EUR) + (Producing wells x 2 x P90 EUR) b. This was applied to vertical and horizontal well groups and then summed.
Steps for Reserve Determination:

9Hydrocarbon and By-Product Reserves in British Columbia 2011
DISCUSSION
Figure 4: Approximate Producing Well Count at Various Stages of Resource Play Development
Phase of Resource Play Development
Early Intermediate Statistical Mature
Ratio of Analogous Producing Wells To Recommended Minimum Sample Size < 1 1 to 4 > 3 Very Large
P10/P90 <4, Approximate Well Count < 50 100 150 > 500
P10/P90 4 to 10, Approximate Well Count < 50 - 200 100 - 400 150 - 600 > 1,000
P10/P90 10 to 30, Approximate Well Count < 200 - 700 200 - 1,400 600 - 2,100 > 4,500
Figure 5: Recommended Maximum Number of PUD Offsets at Various Stages of Resource Play Development
Phase of Resource Play Development
Early Intermediate Statistical Mature
Recommended Maximum Number of PUD Offsets Per Producing Well (Vertical Wells) 4 8 Statistical Statistical
Recommended Maximum Number of PUD Offsets Per Producing Well (Horizontal Wells) 2 - 4 4 - 8 Statistical Statistical
10Hydrocarbon and By-Product Reserves in British Columbia 2011
DISCUSSION
Figure 6: Example Cumulative Distribution 1
Log Norm Cum Dist
11Hydrocarbon and By-Product Reserves in British Columbia 2011
DISCUSSION
Figure 7: Regional Northern Montney Pools
Regional Northern Montney Pools
Doig Phosphate-Montney
Montney

12Hydrocarbon and By-Product Reserves in British Columbia 2011
DISCUSSIONConventional Reserves
Conventional production and reserve additions have been in decline over the past decade. In 2011, 116 wells were drilled for conventional targets with initial raw gas reserve additions totaling 4.3 109 m3, a significant decrease from 2010’s figures. A notable revision to conventional gas reserves during 2011 was the Engineering pools Ojay Cretaceous A, B and C, which amalgamated a number of smaller commingling pools. This revision increased Initial Reserves by 8.5 109 m3. The discussion below outlines “Engineering pools” and their use in the valuation of hydrocarbon reserves.
Engineering Pools
Engineering Pools are created to accommodate both reserves and production volume allocation when production volumes cannot be allocated to individual pools due to commingling production, in some cases under Area Commingling approval Orders. An Engineering Pool, specific to an individual field, may be comprised of differing geological formations or stacked pools within the same formation.Creation of an engineering pool does not replace the geologically evaluated pools used for well classification.
Fourteen engineering pools are currently identified: Boundary Lake/Halfway, Boundary Lake/Basal Kiskatinaw, Desa/ Pekisko, Eagle/Belloy-Kiskatinaw, Hay River/Bluesky, Kobes/Charlie Lake A, B, C, & D, Monias/Halfway, Muskrat/Halfway, Peejay/Halfway, Weasel/Halfway, Zaremba/Charlie Lake.
Ojay Engineering Pools
Three Engineering Pools have been created within the Ojay field due to commingling Cretaceous pools. The Ojay field is located within the “Outer Foothills” Area Commingling Production approval.
Cretaceous A
Cadotte pools B, C, D, E, F, GNotikewin pools A, B, C, D, EFalher pools A-A, C-B, C-C, C-D, C-E, C-FGething pools B, C, D, GCadomin pools A, C, E, F, GNikinassin pools A, C, D, E, F
Cretaceous B
Cadotte pools I, J, K, L, M, NNotikewin pools F, GFalher pools A-C, C-H, D-A, G-ABluesky pools B, C, DGething pools L, M, NCadomin pools J, K, L, M, P, Q, R, S, T, YNikinassin pools J, K, L, M, P, Q, S, T, U, W
Cretaceous C
Cadotte pools A, O, QFalher pools A, A-B, C-A, C-G, D-B, F-A, F-B, F-C, F-DBluesky pools A, EGething pools A, E, H, I, O, P, Q, R, S, T, UCadomin pools B, D, I, N, O, U, V, W, XNikinassin pools B, G, I, N, R, O, X, Y, Z

13Hydrocarbon and By-Product Reserves in British Columbia 2011
Hiding Creek - Cretaceous A Gas Pool
This engineering pool was created in April 2012 to accommodate commingling production from overlapping Cretaceous formations/pools. The Hiding Creek field is located within the “Outer Foothills” Area Commingling Production approval. Hiding Creek – Cretaceous A pool includes the following 44 geological pools in Hiding Creek field:
Paddy: ACadotte: A, E, G, I, L, Nothing (WA14740)Notikewin: B, D, E, F, G, H, J, K, Nothing (WA14740)Falher A: A, BFalher C: D, F, H, I, J, K, L Falher G: ABluesky: A, B, C, D, E, F, Nothing (WA 26182)Gething: A, B, D, E, F, GCadomin: B, E, J, K, LNikanassin: D, E, H, K
DISCUSSIONDISCUSSION

14Hydrocarbon and By-Product Reserves in British Columbia 2011
R/P Ratio
Remaining Reserves
Figure 8: Historical Remaining Gas Reserves Versus R/P Ratio
Rem
aini
ng R
eser
ves
(Billi
ons
of C
ubic
Met
res)
R/P
Rat
io (Y
ears
)
Year 1987 1989 1991 1993 1995 1997 1999 2001 2003 2005 2007 2009 2011
Figure 9: Historical Remaining Gas Reserves Versus Annual Production
Year 1987 1989 1991 1993 1995 1997 1999 2001 2003 2005 2007 2009 2011
Annu
al Pr
oduc
tion (
Billio
ns of
Cub
ic Me
tres)
Rem
aini
ng R
eser
ves
(Billi
ons
of C
ubic
Met
res)
Remaining Reserves
1200
1000
800
600
400
200
0
45
40
35
30
25
20
15
10
5
0
DISCUSSION
Annual Production

15Hydrocarbon and By-Product Reserves in British Columbia 2011
Res
erve
Add
ition
s (M
illion
s of
Cub
ic M
etre
s)
Wells Drilled
Reserve Additions/Wells
Well
s Drill
ed
Year 1991 1992 1993 1994 1995 1996 1997 1998 1999 2000 2001 2002 2003 2004 2005 2006 2007 2008 2009 2010 2011
DISCUSSION
800
700
600
500
400
300
200
100
0
1400
1200
1000
800
600
400
200
0
Figure 10: Gas Reserves - Reserve Additions Per Well Drilled

16Hydrocarbon and By-Product Reserves in British Columbia 2011
0
500000
1000000
1500000
2000000
2500000
3000000
3500000
4000000
4500000
2005-01 2006-01 2007-01 2008-01 2009-01 2010-01 2011-01
Mon
tnly
Pro
duct
ion
e3m
3
Conventional Versus Unconventional Gas in NEBC to December 2011
Jean Marie Monthly Gas e3m3
Montney Monthly Gas e3m3
Cadomin/Nik Monthly Gas e3m3
HRB Monthly Gas e3m3
NEBC Total Monthly Gas e3m3
NEBC Unconventional Monthly Gas e3m3
NEBC Conventional Monthly Gas e3m3
DISCUSSIONDISCUSSION
Figure 11: Conventional Versus Unconventional Gas Production in NEBC
Mon
thly
Pro
duct
ion
e3m
3

17Hydrocarbon and By-Product Reserves in British Columbia 2011
DISCUSSION
Figure 12: Conventional Versus Unconventional 2011 Remaining Recoverable Raw Gas Reserves TCF
Figure 13: Conventional Versus Unconventional 2011 Initial Recoverable Raw Gas Reserves
Montney 22% - 7.7 TCF
Horn River32% - 11.2 TCF
Jean Marie5% - 1.6 TCF
DB Cadomin4% - 1.5 TCF
Conventional 37% - 12.6 TCF
Horn River18% - 11.5 TCF
Montney13% - 8.7 TCF
DB Cadomin3% - 1.9 TCF
Jean Marie6% - 3.7 TCF
Conventional60% - 38.2 TCF
18Hydrocarbon and By-Product Reserves in British Columbia 2011
DISCUSSION
Figure 14: Horn River Basin Figure 15: Montney

19Hydrocarbon and By-Product Reserves in British Columbia 2011
DISCUSSIONC. By-Product Reserves
Established remaining reserves of liquefied petroleum gases (LPG) increased for the fifth year to 30.5 106 m3, as compared to28.9 106 m3 at year-end 2010. Established remaining reserves of pentanes plus (C5+) increased for the third year to 11.3 106 m3 from 11.1 106 m3. Established remaining reserves of sulphur decreased slightly to 13.7 106t from 14.4 106t in 2009. Figure 16 shows the distribution of sour gas (H2S percentage) throughout northeast British Columbia.
For gas pools on production, the by-products reserves are estimated on the basis of the yield from raw gas reserves achieved at the plant to which the gas is delivered. For pools yet to be connected to a plant, the yields are estimated based on gas composition and capacity of the plant to which the pool is expected to be connected.
Figure 16: Sour Gas Map of NE BC

20Hydrocarbon and By-Product Reserves in British Columbia 2011
DISCUSSIONNGL and Condensate Outlook 2011
Annual oil production in B.C. peaked in 1998 at about 2.7 106 m3 and has been in steady decline since 2001. Over the past five years annual oil production fell from 1.52 106 m3 in 2007 to 1.15 106 m3 in 2011. In contrast to the decline in produced oil, B.C.’s annual production of condensate and natural gas liquids has displayed robust growth over the past five years. This increase is largely due to the development of the liquids rich unconventional Montney play (Figure 17).
Focused development of the Montney wet gas trend began about 2009-2010, as natural gas commodity prices fell and it was recognized that significant associated natural gas liquids and condensate production enhanced economic returns. Over the 2007-2011 period, total condensate (combined field, plant and pentanes + volumes) increased 28 per cent from 0.9 106 m3 to 1.2 106 m3 (Figure 18). This increase in tandem with the decline in oil production, led 2011 annual condensate production volumes to surpass annual oil volumes. The future outlook is for these respective trends to continue and for NGL and condensate production to increase in importance to the province.
Annu
al P
rodu
ctio
n m
3
2007-2011
Field Condensate Plant LPG Plant Pentanes Plant Condensate Oil
Figure 17: Annual Condensate, NGL and Oil Production

21Hydrocarbon and By-Product Reserves in British Columbia 2011
DISCUSSIONAn
nual
Pro
duct
ion
m3
2007-2011
Figure 18: Annual Oil Versus Total Condensate Production

22Hydrocarbon and By-Product Reserves in British Columbia 2011
DISCUSSIOND. Additional Information
The Hydrocarbon and By-Product Reserves in British Columbia statistical information will continue to be offered to industry at www.bcogc.ca under Web Applications/Data Downloads. In an effort to reduce paper waste, hardcopies are not available.
For additional information on the content of this report, contact:Glynis Farr
Reservoir EngineeringOil and Gas Commission
300, 398 Harbour RdVictoria, British Columbia V9A 0B7
PHONE: 250-419-4427 FAX: [email protected]
www.bcogc.ca

23Hydrocarbon and By-Product Reserves in British Columbia 2011
ESTABLISHED HYDROCARBON RESERVES
December 31, 2011 (SI Units)Table I
1 Crude Oil and Raw Gas figures are taken from current and previous Hydrocarbon Reserves Reports. Any discrepancies in balancing are attributed to system rounding and production history reconciliation.
NOTE: Gas volumes measured at 101.325 kPa and 15oC.
Actual plant and refinery recoveries of propane, butanes, pentanes+ and sulphur for 2011 were 468 103m3, 375 103m3, 485 103m3 and 831 103 t, respectively.
Oil1 Raw Gas1
(103m3) (106m3)
Initial Reserves, Current Estimate 132,414 1,809,591Drilling 2011 +99 +7,909Revisions 2011 +475 +76,934Production 2011 -1,154 -40,519Cumulative Production Dec. 31, 2011 -114,253 -834,715Remaining Reserves Estimate Dec. 31, 2011 18,161 974,876
December 31, 2011 (Imperial Units)Table II
1 Crude Oil and Raw Gas figures are taken from current and previous Hydrocarbon Reserves Reports. Any discrepancies in balancing are attributed to system rounding and production history reconciliation.
NOTE: Gas volumes measured at 14.65 psi and 60oF.
Actual plant and refinery recoveries of propane, butanes, pentanes+ and sulphur for 2011 were 2950 MSTB, 2360 MSTB, 3052 MSTB and 818 MLT, respectively.
Oil1 Raw Gas1
(MSTB) (BSF)
Initial Reserves, Current Estimate 833,268 64,229Drilling 2011 +620 +281 Revisions 2011 +2,992 +2,731Production 2011 -7,262 -1,438Cumulative Production Dec. 31, 2011 -718,983 -29,627Remaining Reserves Estimate Dec. 31, 2011 114,285 34,602

24Hydrocarbon and By-Product Reserves in British Columbia 2011
1. OIL RESERVES
Historical Record of Established Reserves1 (103 m3)Table III(a)
1 These values are taken from previously published ministry reserve estimates. This compilation is provided for historical value and to aid in statistical analysis only. Values shown for any given year may not
balance due to changes in production and estimates over time.
19771978197919801981198219831984198519861987198819891990199119921993199419951996199719981999200020012002200320042005200620072008200920102011
72,841 77,826 78,882 80,043 79,968 80,760 82,149 79,551 82,887 83,501 84,201 85,839 89,899 90,650 91,606 94,030 96,663 99,619102,823106,009110,765116,294118,840122,363123,048122,245124,660125,953126,941125,845128,971129,117131,172131,840132,414
4,1592,650
427234143126661781
1,767456631
1,2382,306
569233823803
1,4772,8871,3063,199
81534550410642742415424722226616228964399
(84)2,376
629927
(218)666727
(3,378)1,569
14468
(50)2,402
181630
1,5961,8301,482
2901,8781,5614,7172,2013,018
582 (1,233)
1,990947636
(1,322)2,859
251,766
28475
188110
2,2012,0042,1402,0022,0602,0952,0792,1131,9442,0102,0841,9371,9781,9541,9742,0171,9761,9291,9972,2052,5252,6702,3382,5682,5692,4262,2032,0151,7501,6311,5201,3411,2821,2701,154
46,318 48,280 50,397 52,399 54,459 56,554 58,634 60,747 62,691 64,701 66,793 68,759 70,737 72,714 74,689 76,750 78,726 80,664 82,658 84,856 87,401 90,105 92,453 95,031 97,591 99,977102,234104,104106,086107,603109,283110,632111,924113,197114,253
26,52329,54628,48527,64425,50924,20623,51518,80520,19618,78617,36116,62319,12917,82316,91117,27317,92518,95620,16721,15323,36426,18926,38827,35725,47822,31322,42621,87320,85718,24419,69218,48519,25218,65318,161
YearInitial Reserve
Current EstimateYearlyDrilling
YearlyRevisions
YearlyOther
Productionin Year
CumulativeProductionat Year-End
RemainingReserves
at Year-End
1. OIL RESERVES1. OIL RESERVES

25Hydrocarbon and By-Product Reserves in British Columbia 2011
2. RAW GAS RESERVES
Historical Record of Established Reserves1 (106 m3)Table III(b)
19771978197919801981198219831984198519861987198819891990199119921993199419951996199719981999200020012002200320042005200620072008200920102011
376,960399,535424,805462,596478,689488,316490,733496,703505,233501,468497,466500,738513,662547,058574,575591,356617,379635,774657,931677,769688,202712,677743,816772,221811,146843,612889,488973,7711,065,2881,114,5621,172,1361,328,7291,415,1721,724,7691,809,591
18,11921,19026,14228,90913,8427,7652,5501,7982,7074,8221,9866,083
12,19327,68324,7086,377
22,90122,00421,06516,08312,835 9,957
13,27913,8327,199
19,00419,3176,4128,974
15,35621,4686,559
30,331275,942
7,909
(14,107)1,386(872)8,8822,2511,862(133)4,1725,823
(8,463)(5,940)(1,661)
(2)5,8883,812
10,4043,122
(3,301)1,0513,852
(2,394)14,50217,82414,57131,69013,46226,28265,14963,26833,91236,109
150,16756,13333,69176,934
12,89719,104
11,039 9,94311,394 8,968 8,293 7,995 7,845 8,264 8,799 8,506 9,81010,27513,27613,22615,16216,51018,20219,06921,15721,43522,81123,37523,56623,89426,46328,34826,63926,43027,85428,05629,36230,34630,84633,20240,519
143,958153,900165,294174,262182,555190,550198,395206,659215,458223,964233,794244,249257,862271,344285,965302,916321,090339,861361,106382,332405,157428,822453,000477,381504,620533,548562,560584,033620,696652,137689,209722,769757,291792,798834,715
233,002245,635259,511288,334296,134297,766292,338290,044289,775277,628263,777256,483255,782275,685288,582288,408296,246295,885296,825295,437283,045283,855290,816294,800306,526310,064326,928389,738444,592462,425482,927605,280657,881931,971974,876
YearInitial Reserve
Current EstimateYearlyDrilling
YearlyRevisions
YearlyOther
Productionin Year
CumulativeProductionat Year-End
RemainingReserves
at Year-End
1 These values are taken from previously published ministry reserve estimates. This compilation is provided for historical value and to aid in statistical analysis only. Values shown for any given year may not
balance due to changes in production and estimates over time.
2. RAW GAS RESERVES2. RAW GAS RESERVES

26Hydrocarbon and By-Product Reserves in British Columbia 2011
Field Pool Amount of I.R. Change(103 m3) Reason for Change
REVISION 2011 Fireweed Lower Halfway A + 365 Performance review Oak Cecil C + 182 Rigel Cecil G - 62
* Others + 89SUBTOTAL REVISIONS + 475
DRILLING 2011 Flatrock Halfway O + 42 New Drilling Monias Charlie Lake B + 3
*Others + 54SUBTOTAL DRILLING + 99
TOTAL + 574
ESTABLISHED OIL RESERVE CHANGES
Established Oil Reserve Changes (103 m3)Table IV
*Others – includes all additional changes both positive and negative.

27Hydrocarbon and By-Product Reserves in British Columbia 2011
ESTABLISHED RAW GAS RESERVE CHANGES
Established Raw Gas Reserve Changes (106 m3)Table V
Field Pool Amount of I.R. Change(106 m3) Reason for Change
REVISION 2011 Northern Montney Doig Phosphate-Montney A + 10,372 Re-mapping Ojay Cretaceous C + 6,803 Engineering Pool Northern Montney Montney A + 5,569 Re-mapping Hiding Creek Cretaceous A - 5,321 Engineering Pool Milo Pine Point D - 943 Pool Depleted
*Others + 60,454 SUBTOTAL REVISIONS + 76,934
DRILLING 2010 Grizzly North Nikanassin D + 961 Mapping Noel Nikanassin J + 866 Mapping Horn River Evie E + 704 Mapping Horn River Muskwa-Otter Park D + 692 Mapping Noel Nikanassin I + 566 Mapping Grizzly North Baldonnel B + 375 Mapping
*Others + 3,745 Mapping **SUBTOTAL DRILLING + 7,909
TOTAL + 309,633
*Others – includes all additional changes both positive and negative.
28Hydrocarbon and By-Product Reserves in British Columbia 2011
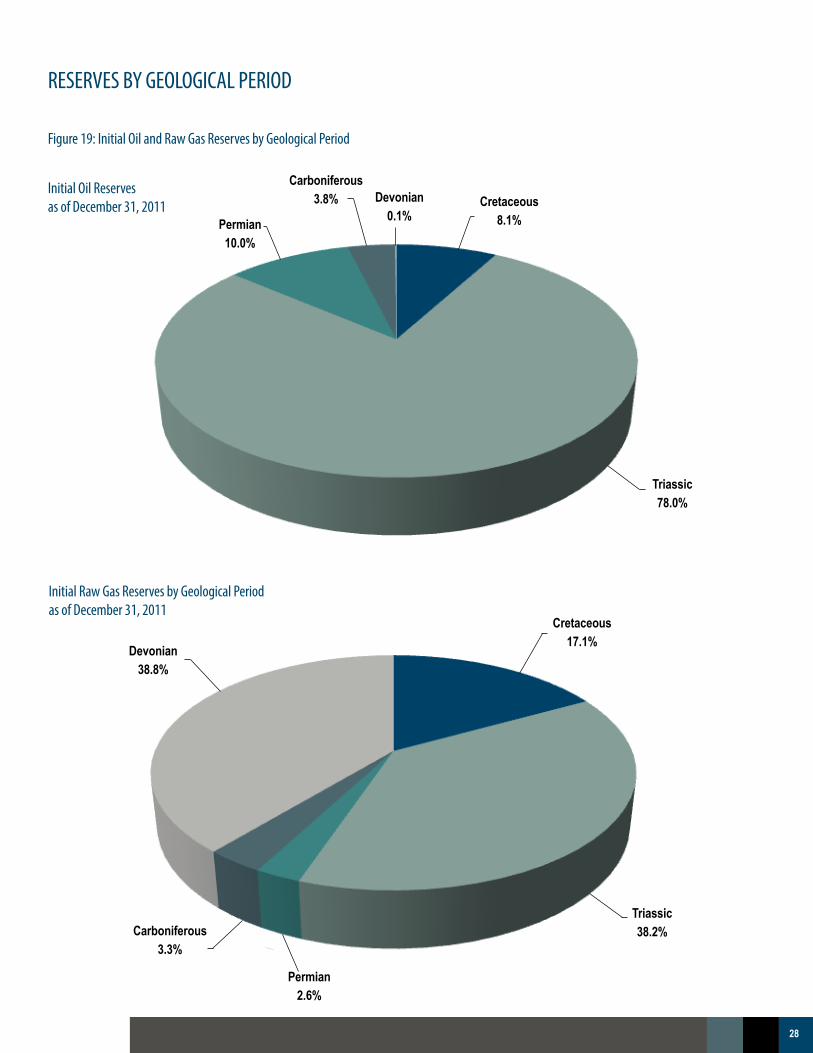
RESERVES BY GEOLOGICAL PERIOD
Figure 19: Initial Oil and Raw Gas Reserves by Geological Period
Triassic78.0%
Permian10.0%
Cretaceous8.1%
Initial Raw Gas Reserves by Geological Periodas of December 31, 2011
Initial Oil Reservesas of December 31, 2011
Carboniferous3.8% Devonian
0.1%
Devonian38.8%
Cretaceous17.1%
Carboniferous3.3%
Permian2.6%
Triassic38.2%

29Hydrocarbon and By-Product Reserves in British Columbia 2011
RESERVES BY GEOLOGICAL PERIOD
Initial Recoverable Oil Reserves by Geological Period (106 m3)Table VI(a)
GEOLOGICAL PERIOD OIL RESERVES PERCENTAGE%
Cretaceous 10.7 8.1
Triassic 103.2 77.9
Permian 13.3 10.0
Carboniferous 5.0 3.8
Devonian 0.2 0.2
Total 132.4
Initial Recoverable Raw Gas Reserves by Geological Period (109 m3)Table VI(b)
GEOLOGICAL PERIOD GAS RESERVES PERCENTAGE%
Cretaceous 309.6 17.1
Triassic 692.1 38.3
Permian 46.6 2.6
Carboniferous 59.4 3.3
Devonian 701.8 38.8
Total 1,809.6

30Hydrocarbon and By-Product Reserves in British Columbia 2011
OIL POOLS UNDER WATER FLOOD
Oil Pools Under Waterflood (103 m3)Table VII
FIELD POOL Initial Reserve Remaining Reserve
Beatton River Halfway A 1,617 1Beatton River Halfway G 470 47Beatton River West Bluesky A 1,117 34Beavertail Halfway B 91 5Beavertail Halfway H 182 20Birch Baldonnel C 215 64Boundary Lake Boundary Lake A 38,099 2,802Bubbles North Coplin A 58 21Crush Halfway A 510 7Crush Halfway B 56 6Currant Halfway D 24 16Desan Pekisko 784 137Eagle Belloy-Kiskatinaw 2,772 274Eagle West Belloy A 6,569 381Elm Gething B 133 7Hay River Bluesky A 6,207 2,365Inga Inga A 7,266 417Lapp Halfway C 457 26Lapp Halfway D 166 14Milligan Creek Halfway A 7,440 60Muskrat Boundary Lake A 401 104Muskrat Lower Halfway A 116 10Oak Cecil B 127 29Oak Cecil C 545 231Oak Cecil E 631 40Oak Cecil I 267 43Owl Cecil A 353 39Peejay Halfway 10,578 154Peejay West Halfway A 525 92Red Creek Doig C 218 71

31Hydrocarbon and By-Product Reserves in British Columbia 2011
OIL POOLS UNDER WATER FLOOD
Oil Pools Under Waterflood(103 m3) (continued)Table VII
FIELD POOL Initial Reserve Remaining Reserve
Rigel Cecil B 637 72Rigel Cecil G 429 16Rigel Cecil H 910 47Rigel Cecil I 858 115Rigel Halfway C 495 7Rigel Halfway Z 21 14Squirrel North Pine C 413 4Stoddart North Pine C 156 96Stoddart West Bear Flat D 155 4Stoddart West Belloy C 1,446 124Stoddart West North Pine D 38 17Sunset Prairie Cecil A 353 24Sunset Prairie Cecil C 147 27Sunset Prairie Cecil D 152 147Two Rivers Siphon A 274 61Weasel Halfway 3,439 133Wildmint Halfway A 1,554 16
Total 99,471 8,441
% of Total British Columbia Reserves 75.1 46.5
Oil Pools Under Gas Injection (103 m3) Table VIII
FIELD POOL Initial Reserve Remaining Reserve
Brassey Artex A 15 1Brassey Artex G 150 1Bulrush Halfway A 369 58Cecil Lake Cecil D 357 40Rigel Halfway H 105 14Stoddart West Belloy C 425 50
Total 1,421 164
% of Total British Columbia Reserves 1.1 0.9

32Hydrocarbon and By-Product Reserves in British Columbia 2011
UNCONNECTED GAS RESERVES BY PLANT AREA
Figure 20: Unconnected Gas Reserves by Plant Area (109 m3)Remaining Reserves (Raw)
Fort Nelson15.8%
North Foothills7.8%
Other6.0%
Pine River26.3%
McMahon44.1%
Unconnected Gas Reserves by Plant Area (109 m3) Table IX
* Totals may not add up due to rounding.1
Includes BRC Elmworth (4-8-70-11-W6) and Burlington Noel (b-59-D/093-P-8).2
Includes WGSI Buckinghorse (a-81-H/094-G-6), Anadarko Cypress (b-99-C/094-B-16) and WEI Sikanni (b-41-I/094-G-3).
Plant Name Initial Remaining Raw Gas (109 m3)
1 Pine River (c-85-d/93-P-12) 5.9
McMahon (5-31-82-17) 9.9
Fort Nelson (b-84-G/94-J-10) 3.5
2 North Foothills 1.7
Other 1.4
Total 22.4

33Hydrocarbon and By-Product Reserves in British Columbia 2011
PROJECT/UNIT CROSS REFERENCE LISTING
Project Type
CONC ............................................ EOR ............................................... GEPG ............................................GEPO ............................................PMGI .............................................PMWF ...........................................UNIT ..............................................
Concurrent ProductionEnhanced Oil RecoveryGood Engineering Practice - GasGood Engineering Practice - OilPressure Maintenance - Gas InjectionPressure Maintenance - Water FloodUnitization
Description
Definitions: SI Units
British Columbia’s reserves of oil, natural gas liquids and sulphur are presented in the International System of Units (SI). The provincial totals and a few other major totals are shown in both SI units and the Imperial equivalents in the various tables. Conversion factors used in calculating the Imperial equivalents are listed below:
1 cubic metre of gas (101.325 kilopascals and 15° Celsius)
1 cubic metre of ethane(equilibrium pressure and 15° Celsius)
1 cubic metre of propane(equilibrium pressure and 15° Celsius)
1 cubic metre of butanes(equilibrium pressure and 15° Celsius)
1 cubic metre of oil or pentanes plus(equilibrium pressure and 15° Celsius)
1 cubic metre of water(equilibrium pressure and 15° Celsius)
1 tonne
1 tonne
1 kilojoule
35.493 73 cubic feet of gas(14.65 psia and 60° Fahrenheit) 6.330 0 Canadian barrels of ethane(equilibrium pressure and 60° Fahrenheit) 6.300 0 Canadian barrels of propane(equilibrium pressure and 60° Fahrenheit) 6.296 8 Canadian barrels of butanes(equilibrium pressure and 60° Fahrenheit) 6.292 9 Canadian barrels of oil or pentanes plus (equilibrium pressure and 60° Fahrenheit) 6.290 1 Canadian barrels of water(equilibrium pressure and 60° Fahrenheit) 0.984 206 4 (U.K.) long tons (2,240 pounds) 1.102 311 short tons (2,000 pounds) 0.948 213 3 British thermal units (Btu as definedin the federal Gas Inspection Act [60°- 61° Fahrenheit])
=
=
=
=
=
=
=
=
=
For a complete project/unit cross-reference listing, please visit our website: www.bcogc.caAccess Web Applications/Data Downloads
Table X

34Hydrocarbon and By-Product Reserves in British Columbia 2011
DEFINITIONS
Original Gas and Original Oil in PlaceThe volume of oil, or raw natural gas calculated or interpreted to exist in a reservoir before any volume has been produced.
Established ReservesReserves recoverable under current technology and present and anticipated economic conditions, specifically proved by drilling, testing, or production, plus that judgment portion of contiguous recoverable reserves that are interpreted from geological, geophysical, or similar information, with reasonable certainty to exist.
Initial ReservesEstablished reserves prior to the deduction of any production.
Remaining ReservesInitial established reserves less cumulative production.
Unconnected ReservesGas reserves that have not been tied-in to gathering facilities and therefore do not contribute to the provincial supply without further investment.
AreaThe area used to determine the adjusted bulk rock volume of the oil, or gas-bearing reservoir, usually the area of the zero isopach or the assigned area of a pool or deposit.
ButaneIn addition to its normal scientific meaning, a mixture mainly of butanes which ordinarily may contain some propane or pentanes plus.
Compressibility FactorA correction factor for non-ideal gas determined for gas from a pool at its initial reservoir pressure and temperature and, where necessary, including factors to correct for acid gases.
CondensateA mixture mainly of pentanes and heavier hydrocarbons that may be contaminated with sulphur compounds that is recovered or is recoverable at a well from an underground reservoir and that may be gaseous in its virgin reservoir state but is liquid at the conditions under which its volume is measured or estimated.
DensityThe mass or amount of matter per unit volume.
Density, Relative (Raw Gas)The density, relative to air, of raw gas upon discovery, determined by an analysis of a gas sample representative of a pool under atmospheric conditions.
Discovery YearThe year in which the well that discovered the oil or gas pool finished drilling.
RESERVES TERMINOLOGY

35Hydrocarbon and By-Product Reserves in British Columbia 2011
Formation Volume FactorThe volume occupied by one cubic metre of oil and dissolved gas at reservoir pressure and temperature, divided by the volume occupied by the oil measured at standard conditions.
Gas (Non-associated)Gas that is not in communication in a reservoir with an accumulation of liquid hydrocarbons at initial reservoir conditions.
Gas Cap (Associated)Gas in a free state in communication in a reservoir with crude oil, under initial reservoir conditions.
Gas (Solution)Gas that is dissolved in oil under reservoir conditions and evolves as a result of pressure and temperature changes.
Gas (Raw)A mixture containing methane, other paraffinic hydrocarbons, nitrogen, carbon dioxide, hydrogen sulphide, helium, and minor impurities, or some of them, which is recovered or is recoverable at a well from an underground reservoir and which is gaseous at the conditions under which its volume is measured or estimated.
Gas (Marketable)A mixture mainly of methane originating from raw gas, if necessary, through the processing of the raw gas for the removal or partial removal of some constituents, and which meets specifications for use as a domestic, commercial, or industrial fuel or as an industrial raw material.
Gas-Oil Ratio (Initial Solution)The volume of gas (in thousand cubic metres, measured under standard conditions) contained in one stock-tank cubic metre of oil under initial reservoir conditions.
Gross Heating Value (of dry gas)The heat liberated by burning moisture-free gas at standard conditions and condensing the water vapour to a liquid state.
Liquid Petroleum Gases (LPG)A hydrocarbon mixture comprised primarily of propane and butanes. Some ethanes may be present.
Mean Formation DepthThe approximate average depth below kelly bushing of the mid-point of an oil or gas productive zone for the wells in a pool.
MethaneIn addition to its normal scientific meaning, a mixture mainly of methane which ordinarily may contain some ethane, nitrogen, helium or carbon dioxide.
Natural Gas Liquids (NGL)Propane, butanes, or pentanes plus, or a combination of them, obtained from the processing of raw gas or condensate.
OilA mixture mainly of pentanes and heavier hydrocarbons, which may be contaminated with sulphur compounds, that is recovered or is recoverable at a well from an underground reservoir. This mixture is liquid at the conditions under which its volume is measured or estimated and includes all other hydrocarbon mixtures, except raw gas or condensate, recovered or recoverable from an underground reservoir.
DEFINITIONSDEFINITIONS

36Hydrocarbon and By-Product Reserves in British Columbia 2011
Pay Thickness (Average)The bulk rock volume of a reservoir of oil or gas, divided by its area.
Pentanes PlusA mixture mainly of pentanes and heavier hydrocarbons which ordinarily may contain some butanes and which is obtained from the processing of raw gas, condensate, or oil.
PoolA natural underground reservoir containing or appearing to contain an accumulation of liquid hydrocarbons or gas or both separated or appearing to be separated from any other such accumulation.
PorosityThe effective pore space of the rock volume determined from core analysis and well log data, measured as a fraction of rock volume.
Pressure (Initial)The reservoir pressure at the reference elevation of a pool upon discovery.
Project/UnitsA scheme by which a pool or part of a pool is produced by a method approved by the Commission.
PropaneIn addition to its normal scientific meaning, a mixture mainly of propane, which ordinarily may contain some ethane or butanes.
RecoveryRecovery of oil, gas or natural gas liquids by natural depletion processes or by the implementation of an artificially improved depletion process over a part or the whole of a pool, measured as a volume or a fraction of the in-place hydrocarbons so recovered.
Saturation (Water)The fraction of pore space in the reservoir rock occupied by water upon discovery.
Surface LossA summation of the fractions of recoverable gas that are removed as acid gas and liquid hydrocarbons, used as lease or plant fuel, or flared.
TemperatureThe initial reservoir temperature upon discovery at the reference elevation of a pool.
Underbalanced DrillingA technique in which the hydrostatic pressure in the circulating downhole fluid system is maintained at some pressure less than the pressure of the target formation.
ZoneAny stratum or sequence of strata that is designated by the Commission as a zone.
DEFINITIONS