hunger and food insecurity on the rise€¦ · hunger and food insecurity on the rise in san...
TRANSCRIPT

Hunger and Food Insecurity
ON THE RISEin San Francisco
San Francisco Food Security Task ForceAnnual Report
November, 2010

2
AcknowledgementsAuthors:
Danielle Boulé (Intern to the Food Security Task Force), MS Student, Community Development Graduate Group, UC DavisPaula Jones, Director of Food Systems at the San Francisco Department of Public Health
Graphic Design: Kyle Smith, Owner of Fresh Brew Creative Design, LLC., St. Louis, MO
Funding for this report was provided by Campaign for Better Nutrition, Glide Foundation, Episcopal Community Services, San Francisco Food Systems, San Francisco Food Bank, St. Anthony Foundation and the Center for Vulnerable Populations at San Francisco General Hospital.
A special thanks to the following people for their invaluable support with this report:• All members of the San Francisco Food Security Task Force and their organizations• Maurita Dunphy, Department of Children, Youth and Their Families• Nancy Hahn, Food Runners • Katie Helwig, Children’s Council of San Francisco• Magdalene Louie, San Francisco Department of Public Health• Bruce McKinney, Glide Foundation• Jennifer McLaughlin, San Francisco Department of Public Health• John Murray, San Francisco Human Services Agency• Amy Portello Nelson, Department of Children, Youth and their Families• Hilary Kessler Seligman, MD, UCSF/ SF General Hospital Vulnerable Populations Center• Office of the Supervisor Sophie Maxwell
San Francisco Food Security Task Force Members:Jean Cooper, Glide FoundationGina Fromer, Bayview Hunters Point YMCAKaren Gruneisen (nominated), Episcopal Community ServicesPaula Jones, San Francisco Department of Public Health, Office of Food SystemsLinda Lau, San Francisco Department of Aging and Adult ServicesMaria LeClair, San Francisco Department of Public Health, Nutrition ServicesDeloris McGee, Community Living CampaignLeo O’Farrell, Human Services Agency, Food Stamp ProgramGail Priestley, Chair, St. Anthony FoundationAnne Quaintaince, Meals on Wheels of San FranciscoZetta Reicker (nominated), Student Nutrition Services, San Francisco Unified School DistrictMax Rocha, San Francisco Department of Children, Youth and their FamiliesDan Schuman, Project Open HandMeredith Terrell, Co-Chair, San Francisco Food Bank

3
Table of ContentsPoverty in San Francisco
The Costs of Hunger
Food insecurity, dietary intake, weight gain, and chronic disease The Impact of food insecurity and hunger on children Food insecurity among seniors and the disabled Food insecurity among residents of formerly homeless and the homeless The financial impact of hunger
The Status of Food Programs in San Francisco
Supplemental Nutrition Assistance Program Women, Infants and Children School mealsChildcare food, summer meals, and afterschool snackMeals programs for seniors and adults with disabilitiesCommunity based food programsFood Recovery & Production
The Future of Hunger in San Francisco
What Should Be Done?
References
List of Figures:
Figure 1: Map – Proportion of Population in PovertyFigure 2: Table - San Francisco Food Bank Food ProgramsFigure 3: Table – Supplemental Nutrition Assistance Program (SNAP)Figure 4: Table – Food Stamp AllotmentsFigure 5: Table – School Meal Participation Figure 6: Table - Snapshot of Summer Lunch ProgramFigure 7: Table – Meals Served to Seniors (60+) Figure 8: Table – Meals Served to Adults with DisabilitiesFigure 9: Table – DAAS Nutrition Program FundingFigure 10: Table - Four free meal programs
4
6
7 7
8
10 10
11
11
12 13
14
15 17 18
18
19
21
4
6
11 12
14
15
16 16 17 17

4
Poverty in San FranciscoOver the past several years the City has witnessed a dramatic increase in the demand for food and nutrition services provided by both federally funded nutrition programs and community based food programs. This report looks at the current state of food insecurity in San Francisco, examines why it exists and some of its implications. It also explores the future of food insecurity and hunger in San Francisco and discusses the actions the City and the general public can take in order to impact and reduce this serious problem.
Food security is defined as access by all people at all times to enough nutritious food for an active, healthy life. Food insecurity exists whenever the availability of nutritionally adequate and safe foods or the ability to acquire foods in socially acceptable ways is limited or uncertain.I Food insecurity has a wide range of manifestations, including worrying that food will run out, buying cheaper and nutritionally inadequate food, rationing meals, or skipping meals completely.
The number of Americans found to be food insecure in 2008 rose to 49 million individuals (including 16.7 million children), a 36% increase from 2007. Food insecurity in America is most common in households with incomes below the official federal poverty line, households with children headed by a single woman, and African-American and Hispanic households.II
The San Francisco Food Bank estimates that 1 in 5 adults in San Francisco struggle each day to feed themselves and their families. Food often becomes a “nonessential” item—if a person with a limited income must choose between paying a fixed expense, like rent, and buying food, he or she will likely pay the fixed expense. The map below shows the percentage of the population in poverty by neighborhood.
Figure 1
5
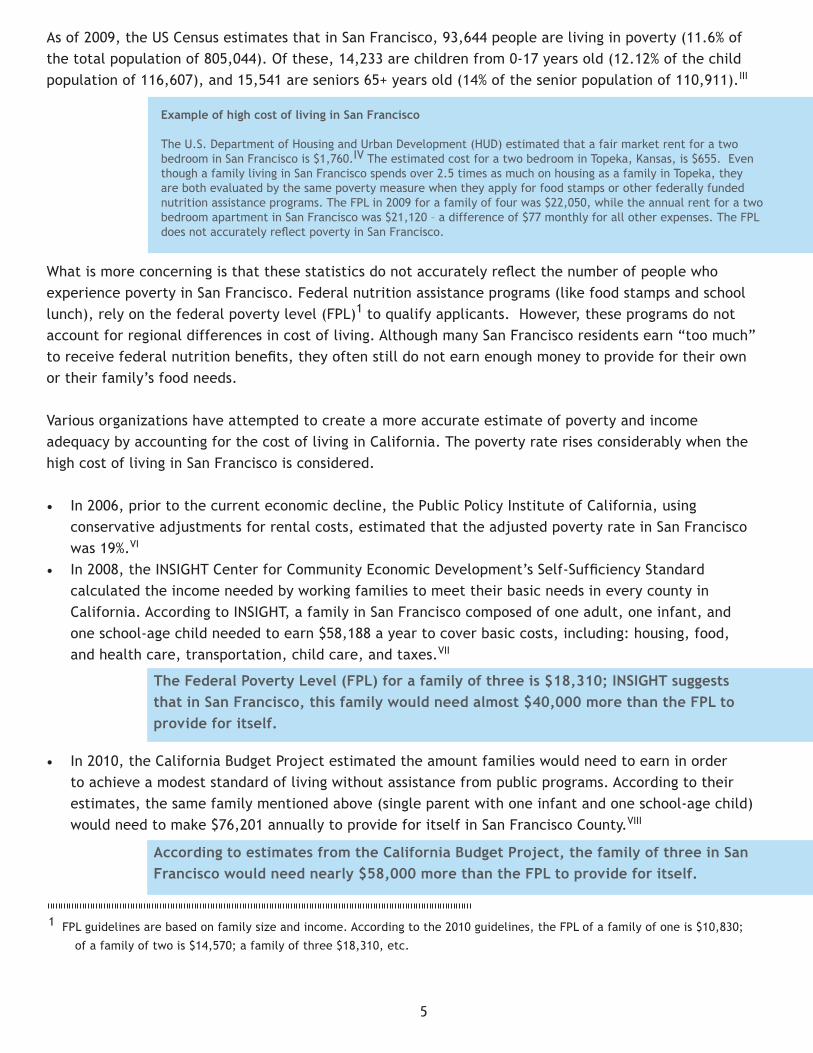
As of 2009, the US Census estimates that in San Francisco, 93,644 people are living in poverty (11.6% of the total population of 805,044). Of these, 14,233 are children from 0-17 years old (12.12% of the child population of 116,607), and 15,541 are seniors 65+ years old (14% of the senior population of 110,911).III
What is more concerning is that these statistics do not accurately reflect the number of people who experience poverty in San Francisco. Federal nutrition assistance programs (like food stamps and school lunch), rely on the federal poverty level (FPL)1 to qualify applicants. However, these programs do not account for regional differences in cost of living. Although many San Francisco residents earn “too much” to receive federal nutrition benefits, they often still do not earn enough money to provide for their own or their family’s food needs.
Various organizations have attempted to create a more accurate estimate of poverty and income adequacy by accounting for the cost of living in California. The poverty rate rises considerably when the high cost of living in San Francisco is considered.
• In 2006, prior to the current economic decline, the Public Policy Institute of California, using conservative adjustments for rental costs, estimated that the adjusted poverty rate in San Francisco was 19%.VI
• In 2008, the INSIGHT Center for Community Economic Development’s Self-Sufficiency Standard calculated the income needed by working families to meet their basic needs in every county in California. According to INSIGHT, a family in San Francisco composed of one adult, one infant, and one school-age child needed to earn $58,188 a year to cover basic costs, including: housing, food, and health care, transportation, child care, and taxes.VII
• In 2010, the California Budget Project estimated the amount families would need to earn in order to achieve a modest standard of living without assistance from public programs. According to their estimates, the same family mentioned above (single parent with one infant and one school-age child) would need to make $76,201 annually to provide for itself in San Francisco County.VIII
The Federal Poverty Level (FPL) for a family of three is $18,310; INSIGHT suggests that in San Francisco, this family would need almost $40,000 more than the FPL to provide for itself.
According to estimates from the California Budget Project, the family of three in San Francisco would need nearly $58,000 more than the FPL to provide for itself.
Example of high cost of living in San Francisco
The U.S. Department of Housing and Urban Development (HUD) estimated that a fair market rent for a two bedroom in San Francisco is $1,760.IV The estimated cost for a two bedroom in Topeka, Kansas, is $655. Even though a family living in San Francisco spends over 2.5 times as much on housing as a family in Topeka, they are both evaluated by the same poverty measure when they apply for food stamps or other federally funded nutrition assistance programs. The FPL in 2009 for a family of four was $22,050, while the annual rent for a two bedroom apartment in San Francisco was $21,120 – a difference of $77 monthly for all other expenses. The FPL does not accurately reflect poverty in San Francisco.
1 FPL guidelines are based on family size and income. According to the 2010 guidelines, the FPL of a family of one is $10,830;
of a family of two is $14,570; a family of three $18,310, etc.

6
These examples illustrate the significant gap between the federal poverty measurement and the income that is actually required to live in San Francisco. As a result, there are thousands of people in San Francisco who do not officially qualify for federal benefits yet need food assistance.
Rising unemployment related to the economic downturn has led to an increase in hunger. The unemployment rate in San Francisco had been trending upwards since 2008 and peaked at a high of 10.4% in January of 2010.IX
However, having a job does not ensure food security—70% of families with food-insecure children contain at least one full-time worker, according to a study completed by the USDA.X In San Francisco, 39% of the households that receive weekly groceries through the SF Food Bank include at least one working adult. Only 18% of clients are homeless.XI
Figure 2 The San Francisco Food Bank
Indicator 2006 2007 2008 2009 2010*
Average # of pantries/month 148 168 190 205 206Average lbs. of food/month 2,247,435 2,442,538 2,645,964 3,091,597 3,201,331Average meals/day 57,627 62,269 67,845 79,272 82,085Average households served/month 52,100 60,940 70,043 86,955 100,500
Data source: San Francisco Food Bank
The Costs of HUNGER Even though the sensation of hunger is not physically felt by all, food insecurity has a negative impact on every person in San Francisco. This section looks at food insecurity’s impact on health, including dietary intake and chronic disease, impact on vulnerable populations—children, seniors and the disabled, and the economic cost associated with food insecurity and hunger.
“The current recession and the rise in unemployment is having a profound effect on residents of San Francisco and the San Francisco Food Bank. We have seen a dramatic increase in the number of those turning to the SF Food Bank for assistance,” says Paul Ash, Executive Director of the San Francisco Food Bank.
The San Francisco Food Bank (Food Bank) is the hub for community based food assistance in San Francisco. Over 350 nonprofit agencies shop at the SF Food Bank on a weekly basis. Clients who visit the SF Food Bank pantries directly are either ineligible for federal assistance or still cannot survive on the assistance they receive.
^The number of households currently served has nearly doubled since 2006.^There was a drastic increase in all indicators between 2008 and 2009. Both the average pounds of food served per month and average meals per day by 17%, while the average number of households served per month by 24%.*2010 data includes January through June 2010

7
Food insecurity, dietary intake, weight gain, and chronic disease
The cost differential of healthy versus unhealthy food has increased significantly over the past few decades with energy dense foods that are high in added fat, refined carbohydrates and added sugar costing significantly less than foods high in nutrients such as fruits and vegetables.XII Therefore, residents with limited resources may therefore be more susceptible to diet-sensitive chronic diseases, such as obesity, hypertension, and diabetes.
Food insecurity is:
• Linked to dietary decisions. Research shows that food insecurity impacts the foods adults choose to eat—variety decreases and consumption of low-cost, energy-dense, and nutritionally poor foods increases (more refined carbohydrates and foods with added sugars, fats, and sodium).XII
• Linked to weight gain and obesity. Research suggests that when food is available, individuals in food insecure houses may overeat, causing weight gain. Further, physiological adaption can occur in response to food shortage; the body compensates for nutrition and food shortages by becoming more efficient at storing more calories as fat.XIII
• Associated with diabetes and poor control of blood sugar. “Adults living with severe levels of food insecurity have more than twice the risk of diabetes than adults who have access to healthy food.”XIII
• Associated with higher rates of hypertension, cardiovascular disease, peripheral vascular disease, stroke, and poor health (these results were self-reported by food insecure adults).XVI
• Associated with an increase in doctor visits and hospitalizations. Since many cases of food security occur in low-income households with little or no private health insurance, taxpayers may end up paying for the cost of the treatment. XIV
The impact of food insecurity and hunger on children
The adverse effects of food insecurity begin before a child is born. Fetal growth and birthweight are significantly impacted by a mother’s nutrient intake. Low birthweight not only has a negative impact on infant health, but it is also associated with poor long-term outcomes in adult height, IQ, and educational attainment.XIV Among infants and toddlers, food insecurity dramatically increases the chances of nutrient deficiencies like iron-deficiency anemia (IDA). Compared to their food-secure peers, children living in food insecure households are 140% more likely to have IDA.XIV IDA slows a child’s ability to process information, increases anti-social behavior, decreases attention to caregiver reactions, makes it more difficult for a child to be soothed, and delays crawling.XVIII
Children with low birthweight and family food insufficiency are 27.8 times more likely to
be obese than their peers. XIV
“Adults with diabetes are 40% more likely to have poor control of blood sugar if they have
inadequate money for food than if they can afford a healthy diet.” XV
“Adults with diabetes who cannot afford an adequate diet have five more physician
encounters per year than their peers who can afford adequate food.” XVII

8
Food insecurity also has a negative impact on the cognitive development of a child, ultimately impairing his or her productivity and economic potential. Research has shown that the learning deficits experienced by food-insecure children follow them during their school years and beyond. In contrast, one study demonstrated the positive and corrective effect of federal nutrition programs: girls who entered the Food Stamp Program between kindergarten and third grade had higher gains in reading and math scores than girls who left the program during that period.XIV
The effects of food insecurity also may influence children’s emotions and behavior. Data shows that hungry children are “four times more likely to need mental health counseling; seven times more likely to be classified as clinically dysfunctional; seven times more likely to get into fights frequently; and twelve times more likely to steal.”XIV
The negative impacts of food insecurity on children are not only damaging to the child and his or her family, but also to society as a whole. In addition to increasing taxpayer burdens, an unhealthy child represents a loss of human capital in the employment market and a continuation of the vicious cycle of poverty.
Understanding the importance of proper child nutrition, the San Francisco Unified School District (SFUSD) and the Department of Children, Youth, and their Families (DCYF), along with other City agencies and community partners, provide children in San Francisco with adequate and nutritious meals and snacks through several different programs. Data on these programs are provided in the next section.
Food insecurity among seniors and the disabled
Low-income seniors and disabled are two highly vulnerable populations in San Francisco due to their special needs, inadequate incomes, rules governing the Supplemental Security Income (SSI) program in California, and a lack of dedicated public funds. In San Francisco, there are over 107,000 seniors aged 65+.
Seniors and people with disabilities are some of the poorest residents in San Francisco; many live on less than $1,000 a month. San Francisco’s Supplemental Security Income (SSI)2 population illustrates how many seniors and disabled are in need. The SSI population in San Francisco is particularly vulnerable to food insecurity because California is the only state in the country where SSI recipients are not eligible for food stamps; the state added a small amount money for food instead (State Supplemental Payment), when the program was redesigned in the 1960’s. Unfortunately, the additional money added has not risen with inflation, so most recipients experience food insecurity.
San Francisco has an inordinately high number of residents who are elderly, low-income and/or blind and disabled - over 47,000 residents receive SSI. Statewide, approximately 35 people out of 1,000 are receiving SSI. For San Francisco, roughly 58 out of 1000 residents receive SSI – 65% higher than the average rate in California.XIX
2 SSI is a federal income supplement program designed to help aged, blind, and disabled people who have little or no income.

9
Even though money is the principal barrier to eating nutritious meals for food insecure disabled adults and seniors, a study found that food insecure seniors sometimes had enough money to purchase food but did not have the resources to access or prepare food due to lack of transportation, functional limitations, or health problems.XX A study looking at CalWORKS and SSI benefit recipients found that physically disabled households in California were especially likely to have gone hungry because they utilized the local food bank less than recipients whose disability was mental.XXI For both seniors and the disabled, the physical difficulties in being able to access food may contribute to their inability to provide food for themselves and their families.
Another aspect of vulnerability for the senior population is funding; there are few dedicated sources of food and nutrition funding for seniors in California. A needs assessment conducted in 2006 by the San Francisco Department of Aging and Adult Services (DAAS) provides evidence of the need for additional senior nutrition programs in San Francisco. The analysis showed that although San Francisco’s seniors received approximately 12.2 million free meals through all of the programs in the City including food pantries, free dining rooms, congregate and home delivered meals, the gap between the number of meals served and the number of meals needed was somewhere between 6 and 9 million meals annually.XXII It is critical that the annual funding levels for senior meals address the needs of San Francisco’s senior population.
In order to avoid institutionalization of vulnerable seniors when possible, a network of community supportive services must be in place to ensure seniors are supported to live at home. Home delivered meals are provided to seniors and disabled adults who are physically or mentally unable to leave their home. Each year, the demand for home delivered meals exceeds the allocated funding for this program.
In-Home Supportive Services (IHSS) is a publicly funded statewide program that provides personal assistance to low-income elderly and/or disabled adults living at home. Services are approved based on the resident’s specific needs including assistance with shopping/errands and nutrition services. In April 2010 in San Francisco, 21,240 residents received IHSS assistance for nutrition-related functions. For shopping services and meal preparation, over 77% of San Francisco’s IHSS recipients were not able to perform this function at all or needed a lot of human assistance to prepare meals. This data points to a large number of homebound San Franciscans that depend on IHSS and complementary programs like Meals On Wheels and Project Open Hand for their health and nutrition.
Whether the food insecurity results from inadequate funds or special needs that are unmet, seniors’ health is frequently compromised when food security is an issue. A study found that when compared to their food-secure peers, food-insecure seniors had significantly lower intakes of energy, protein, carbohydrate, saturated fat, niacin, riboflavin, vitamins B-6 and B-12, magnesium, iron and zinc, as well as lower skinfold thickness. Seniors in food insecure households also had higher nutritional risk and were 2.33 times more likely to report fair/poor health status. XXIII
The data and research findings mentioned above are particularly troublesome in light of the fact that seniors are the largest and fastest growing group of residents. By 2030, 1 in 5 San Francisco residents will be 65 or older and the number of residents 85 and older will nearly double (from 2000).XXIV

10
In response to the growing need for food assistance at home, members of the FSTF researched all existing food service programs for seniors in 2005 and recommended the City create a program to provide home delivered groceries to older adults who can cook but have limited mobility. In 2010, the SF Food Bank, Meals on Wheels and Self Help for the Elderly, with support from San Francisco’s Department of Aging and Adult Services piloted a Home Delivered Groceries program. Preliminary results indicate that participants’ food security has improved.
The Department of Aging and Adult Services provides funding for meals for seniors and adults with disabilities through congregate meal sites and home delivered meals. Program data are provided in the next section.
Food insecurity among the formerly homeless and the homeless
The living conditions, type of housing and homeless status affects food security. Residential hotel units (known as Single Room Occupancy or SROs) typically are rented to lower income persons, often those who are homeless or at risk of becoming homeless. There are over 500 residential hotels in San Francisco containing about 16,000 rooms contributing to the affordable housing stock.XXV
There are an estimated 18,000 to 30,000 people, including overcrowded families, living in SROs in San Francisco. SROs house the working poor, the disabled, the underemployed and the homeless, as well as retirees, new immigrants and families. Most of these units have no cooking facilities, forcing residents to eat out or cook in microwave ovens. Access to fresh produce and other nutritional options are compromised by the unavailability and cost because of the dearth of grocery stores in the neighborhoods where most of the SROs are located. In a recent survey of 126 families living in SROs, almost 3 in 10 cite “nutritional deficiencies due to lack of access to a kitchen” as a way their current living situation negatively impacts their children.XXVI
San Francisco’s 2009 Homeless Count and Survey documented that about 40% of homeless respondents are food insecure. (19.5% said they sometimes get enough to eat on a daily basis and an additional 19.1% said they did not usually get enough to eat on a daily basis). Over three in four (78%) respondents reported relying on free meals to feed themselves; 13.9% said they access a food pantry.XXVII Similarly, in a July 2009 study of 250 poor San Franciscans living with HIV/AIDS recruited through The Research on Access to Care in the Homeless (REACH), more than half (53.6%) experienced food insecurity, which the authors note correlates with poor nutritional status, higher rates of heart disease, hypertension, diabetes, and other health problems.XXVIII
The financial impact of hunger
Along with the social and personal cost of hunger, there is an economic cost that reaches far beyond those who are hungry. According to a study that examined the annual cost burden of hunger, the U.S. pays more than $90 billion annually for the direct and indirect costs of hunger-related charities, illness and psychosocial dysfunction, and the impact of less education and lower productivity. This means that on average, every U.S. resident pays about $300 (roughly $800 per household) annually for the hunger bill. Calculated on a lifetime basis, each individual pays nearly $22,000 for hunger in America.XXIX

11
The U.S. budget for all food, nutrition, and consumer services in 2010 is $93.3 billion, a 13.5% increase from the 2009 budget and a 55.4% increase from 2008.XXX This budget includes spending for discretionary programs (WIC, commodity assistance programs, and administration) and mandatory programs (SNAP-Food Stamp Program, Child Nutrition programs, etc.) programs. The Recovery Act added an additional $13 billion to the 2009 budget and $14 billion to the 2010 budget.
Status of food programs in San FranciscoThe following section provides information on some of the largest food programs in San Francisco.
Supplemental Nutrition Assistance Program (formerly Food Stamps)
SNAP (Supplemental Nutrition Assistance Program) is the largest federally funded nutrition program that helps feed over 44,000 people in San Francisco each month. In California, this program was recently named CalFresh.There has been a dramatic increase of people on SNAP in San Francisco over the past few years, especially amongst children.
Figure 3: Supplemental Nutrition Assistance Program data (2007-2010)
2007 2008 2009 2010*
% change from 07-08
% change from 08-09
% change from 09-10
Average # of individuals per month
28,354 29,008 36,034 44,185 2% 24% 23%
Average # of cases per month
18,767 19,355 23,378 27,607 3% 21% 18%
Average number of cases with children per month
6,096 6,488 8,216 10,344 6% 27% 26%
Data source: San Francisco Human Service Agency*2010 data includes January through June 2010

12
To make SNAP more accessible, San Francisco modernized the enrollment process. At www.benefitssf.org, residents can find out if they are eligible and also apply for Food Stamps 24 hours a day, seven days a week. Since the website became active in June 2009, online enrollment increased by 459%; 100 people enrolled online in June 2009 and 559 people enrolled online in June 2010. Numerous counties in California are now replicating this practical and successful innovation.
Under city ordinance, all farmers’ markets in San Francisco must accept EBT cards/food stamps. With the goal of getting more SNAP participants to purchase healthy food at farmers markets, San Francisco recently piloted a new program.XXXI For every $10 a person spends with their EBT card at a farmers market, they receive $5 in additional funding to purchase produce. The Alemany, Fillmore, and Divisadero farmers markets are participants. Since the program started in June, combined SNAP transactions at these three farmers markets are up over 500% with the greatest increases at the Alemany Farmers Market. The success of this incentive program is twofold; it not only encourages low-income residents to eat healthy and fresh food, but it also supports the local farm economy.
Figure 4
Supplemental Nutrition Program for Women, Infants and Children (WIC)
The WIC program helps provide families with healthy food, nutrition education, breastfeeding education and support and assistance with finding healthcare and other community services. It has improved children’s health, growth, and development for nearly 35 years. WIC is federally funded and serves

13
those at 185% of the federal poverty level. Since the program is discretionary (subject to annual budget approval by the federal government), it is vital that WIC funding keeps up with food inflation and sustains a high quality of nutrition, health, and community services. In San Francisco, each month WIC serves: 1,470 pregnant women, 2,300 postpartum women, 3,050 infants, and 8,400 children.
School Meals
The SFUSD Student Nutrition Services operates (SNS) the largest public meal program in San Francisco, serving over 34,000 meals and snacks each day. Through the National School Lunch Program and the School Breakfast Program, students from low-income households can access meals for free.
SFUSD, in partnership with the FSTF, SF Department of Public Health and DCYF, has worked diligently over the past decade to improve the nutritional quality of meals provided. SFUSD has added salad bars to 37 schools in the district; as of Fall 2010, all lunches served in the SFUSD will meet the Gold Standard of the USDA’s HealthierUS School Challenge. Meals will include a greater variety of fruits and vegetables, whole grains, and leaner proteins. In addition, through a new program called MealpayPlus, SFUSD families can prepay for students’ cafeteria meals online, by phone, by mail, or at the school. This will speed up the cafeteria service and students will no longer need to carry lunch money to school. All families will be able to view their students’ history of cafeteria purchases.
With such advances in providing healthy food for children and teens, it is important that students who are eligible for free or reduced meals access the program. In the 2009-2010 school year, the average number of children eating school lunch daily was approximately 22,500, and breakfast was over 7,500, while a over 30,000 are eligible for free and reduced-priced lunches.
In order to increase participation, SNS implemented a new model for lunch at all middle and high schools at the beginning of the 2010 school year. The new model features expanded meal choices and points of service to speed up lines. All food is sold as balanced meals including entree, fruit, vegetables and milk. The model was pilot tested in three schools during the 2009-2010 school year and was supported by technical assistance and funding from the San Francisco Department of Public Health. The pilots increased participation in the school lunch program at all three schools and increased federal reimbursements to the school meals program. With the new model, the competitive à la carte food program was eliminated. This competitive food program was cash based, provided different food choices, was available in separate locations, was not eligible for federal reimbursements, and created stigma for students eating from the National School Lunch Program.
Another challenge for the school district is skyrocketing food, supply, labor and transportation costs, along with minimal increases in reimbursement rates from the federal government. SNS ended 2009-2010 with over a $3 million deficit, further adding to the financial strain on the school district. Below is data that tracks participation in the school meals program since 2007.

14
Figure 5 – SFUSD Meal Participation
Data source: San Francisco Unified School District
Child Care Food, Summer Meals and Afterschool Snack
When children are not in school, there are many who no longer have access to healthy food to fuel their growth and development. The USDA funds several programs that aim to meet this need by offering reimbursement to agencies that provide approved meals during these times and oversee administrative requirements. The Child and Adult Care Food Program (CACFP) provides funding for meals to childcare providers, child development centers, and adult assisted-care facilities. DCYF currently funds two agencies--Children’s Council of SF and Wu Yee Children’s Services—to act as the administrative sponsor to these programs for day care homes. In 08-09, these two agencies served over 1.8 million meals to youth in 438 day care homes around the city.
The Summer Food Service Program (SFSP) is another USDA program that funds free meals to prevent hunger among children during times when school is not in session. This includes providing meals during summer, holiday breaks, and after school hours. DCYF provides sponsorship and administrative oversight of two SFSP programs—the Summer Lunch Program and the Afterschool Snack Program. They contract with SFUSD Student Nutrition Services for lunches and the SF Food Bank for snacks to service these programs. DCYF currently invests approximately $250,000 to manage these programs that brings approximately $850,000 of additional federal reimbursement to sustain them. DCYF is in a unique position among City agencies to have the capacity to fund and staff these programs.
During the summer, the Summer Lunch Program organizes multiple sites around the city that are open to anyone 18 and under to receive a free meal during specified times. In general, summer food sites are located in almost every neighborhood; however there are not enough sites in the Richmond, Sunset, Excelsior and SOMA. In 2009, DCYF was able to provide over 120,000 snacks and over 160,000 lunches at 91 sites during the 8-week summer program. In 2010, the number of sites increased over 40%, there was a 24% increase in lunches (over 200,000) and a 43% increase in snacks available (over 134,000).
Consumption of meals also increased slightly from 2009 to 2010, but the difficult fiscal situation of the City and County of San Francisco made it difficult to fully support this growth. Without an increased budget to serve additional youth, the quality of meals suffered and the distribution system was stretched beyond capacity. The number of administrative staff also did not increase, which made it challenging to do effective outreach to the community, manage the administrative requirements and assure quality monitoring of the sites. Future efforts for this program will focus on food quality and community outreach to ensure that the main objective, feeding nutritious meals to children, is met.
Average Daily Participation 2007-2008 2008-2009 2009-2010
Breakfast 5,086 6,000 7,568
Lunch 21,352 22,000 22,525
Snack 5,221 7,000 7,500

15
The DCYF Afterschool Snack Program is very similar in its qualifications for sites. DCYF typically sponsors 30-40 sites around the city. In 2009-2010, this program had an average of approximately 800 snacks total available at sites each day of the school year, for a total of over 192,000 snacks distributed. The main challenge of this program is that more afterschool programs need it and DCYF does not have the capacity to allow more agencies to become distribution sites. The USDA requires that a greater number of administrative staff is available to complete all the program requirements if DCYF is to add more sites. Until this can happen or an additional City sponsor can be found, DCYF will work to ensure that the limited numbers of sites are located in most areas of the City and each serve a large amount of youth. During both summer and the school year, it has been a challenge to make the community aware of the food that is available and to make it appealing enough for people to seek out the healthy meal instead of fast food or junk food.
Figure 6 - Snapshot of Summer Lunch Program
Data source: Department of Children, Youth & Their Families
Meals for Seniors and Adults with Disabilities
The figure below shows the amount of meals for seniors funded through DAAS, and the total number of meals served by the programs. Each year, approximately 15,000 seniors are served by congregate meals and 2,800 by home-delivered meals. The total number of meals served to seniors continues to increase each year, with home-delivered meals served exceeding the city funding by 2-10% each year, while congregate meals are slowly declining as seniors get more frail and unable to attend a dining meal site. Although the number of meals contracted for 2010-2011 increased by 5%, funding for the program decreased by 3.7%. Organizations that serve meals must raise additional funds to support their existing meal programs, and to serve the growing number of residents needing them.
July 2007 July 2008 July 2009 July 2010Summer Snack - average daily # of snacks served
2,057 2,576 1,667 2,173
# of sites serving snack 69 50 46 82
Summer Lunch - average daily # of lunches claimed
4,977 5,164 4,085 4,220
# of sites operating lunch 98 89 91 105
Total # of meals served 7,034 7,740 5,752 6,393

16
Figure 7 Meals Served to Seniors (age 60+):
Data source: Department of Aging and Adult Services
Funding for senior programs include federal, state and local funds, while adults with disabilities meals are funded solely through local funds. The figure below shows the amount of meals for adults with disabilities funded through DAAS, and the total number of meals served by the programs. The 2009-2010 budget for this program was reduced by 19%, and was cut an additional 8.8% in the 2010-2011 budget, although the number of meals contracted for 2010-2011 increased by 3.9%. Organizations that contract with DAAS to serve these meals must raise additional funds to support the programs.
Figure 8 Meals Served to Adults with Disabilities (age 18-59):
Data source: Department of Aging and Adult Services
2007-08 2008-09 2009-102010-11 Meals
ContractedCongregate Meals 10,345 11,470 13,362 11,939
Home-Delivered Meals 98,750 118,741 113,002 99,429
Total SENIOR Meals Served 109,095 130,211 126,364 n/a
Total Meals Contracted 98,426 121,072 125,896 111,368
#Meals Over or Under Contract 10,669 9,139 468 n/a
% Over Contract 11% 8% 0% n/a
Total DAAS funding $851,944 $863,595 $698,652 $637,338
% Change from previous year 1.4% -19.1% -8.8%
2006-07 2007-08 2008-09 2009-102010-11 Meals
ContractedCongregate Meals 771,742 808,115 730,893 720,881 750,453
Home-Delivered Meals 939,843 1,006,202 1,025,585 1,064,692 987,861
Total SENIOR Meals Served 1,711,585 1,814,317 1,756,478 1,785,573 n/a
Total Meals Contracted 1,675,431 1,734,440 1,733,326 1,650,584 1,738,314
#Meals Over or Under Contract 36,154 79,877 23,152 134,989 n/a
% Over Contract 2% 5% 1% 8% n/a
Total DAAS funding $8,258,484 $8,861,528 $8,823,334 $8,479,737 $8,166,171
% Change from previous year 7.3% -0.4% -3.9% -3.7%

17
The figure below shows the change in funding from DAAS. Unfortunately since the fiscal year 2007-2008, as the need for meals has grown, the DAAS budget for meals for seniors and adults with disabilities has declined by over 9%.
Figure 9
Data source: Department of Aging and Adult Services
Growing Demand for Community Based Programs
San Francisco’s vulnerable residents rely on a network of food programs that are often supported by both public and private funds. This public/private model remains extremely effective and efficient, and provides the foundation for a sustainable community based food system serving the needy. However, as the need for food resources increases, community based food programs are extremely challenged to be able to meet the growing needs. As local public funds for food programs decline, community based organizations increasingly rely on private donations to fund a larger portion of these programs. Some of the largest community based food programs rely up to 100% on private donations to fund their food programs.
Figure 10 Snapshot of Four Free Meals Programs:
DAAS Nutrition Program Funding
$0
$2,000,000
$4,000,000$6,000,000
$8,000,000
$10,000,000
2006-07
2007-08
2008-09
2009-10
2010-11
Fiscal Year
Dol
lar A
mou
nt
Senior Meals
Meals to Adultsw/Disabilities
2007 2008 2009 2010*Average # of meals served per month 244,001 250,431 259,193 264,921
Dozens of organizations provide free meals in San Francisco on a daily, weekly, or monthly basis. The table above offers a snapshot of the growing demand by synthesizing data from four members of the Tenderloin Hunger Task Force: Glide Foundation, Meals on Wheels, Project Open Hand, and St. Anthony’s Foundation. Together, they represent a majority of hot meals served throughout the City.
* 2010 data includes January through June 2010

18
Another example of the growing cost of operating free meal programs comes from the City’s largest CBO provider of emergency shelter beds, Episcopal Community Services of San Francisco (ECS). ECS provides shelter beds and offers breakfast and dinner meals to approximately 530 single adults each day. To meet the cost of providing nutritional meals, ECS must supplement its City funding by covering 45% of its shelter food product budget with private donations.
Food Recovery and Food Production
Many organizations and individuals in San Francisco are contributing to improving the food security and nutrition of vulnerable residents.
Food Runners is a volunteer run program that ensures edible food is recovered and redistributed to needy San Franciscans. Each week volunteers pick up and deliver approximately two tons of food. This program serves 200 agencies (shelters/food programs) on a rotating basis, and relies on 95 businesses that donate food one or more time per week, and over 225 volunteers.
The thriving urban agriculture community in San Francisco has also contributed over 17,000 lbs of fresh produce and honey to needy San Franciscans in 2010. Since this sector is growing, we anticipate that the amount of food grown in San Francisco will increase in the years to come.
The future of hunger in San FranciscoThe following trends will impact the future of food insecurity and hunger in San Francisco.
• An aging senior population. Given that this population is highly vulnerable to poverty and hunger, growth of this group will put heavy strain on the local support system.
• High current and projected unemployment. A study forecasted that the metro area of San Francisco, Oakland, and Fremont will have lost approximately 119,000 jobs by the end of the recession and will not return to pre-recession job levels until after 2012.XXXII As long as a steady income is absent, many San Franciscans will have less or no money for food.
• Large Supplemental Security Income (SSI) population. SSI recipients in California do not receive food stamps, which makes them more susceptible to food insecurity. In addition, since the SSI population in San Francisco is comprised mainly of the city’s growing senior population, the SSI-reliant population will grow.
• Growing budget deficit at the local level. As budget deficits continue to grow every year, it is increasingly challenging to preserve and expand funding for nutrition services and other resources necessary to address food insecurity in San Francisco.
• Growing budget deficit at the state level. Similarly, with state funding reductions, organizations and institutions are facing mounting deficits. The noteworthy achievements the school district has made with providing healthy meals and snacks to children may be threatened by the district’s fiscal challenges.

19
• Large immigrant population. Poverty is high among families of recent immigrants because immigrants tend to have lower incomes. Also, immigrants without documentation do not qualify for many benefits and, although many American-born children do qualify, their parents are often reluctant to apply.
• Growing Income Inequality. Higher poverty rates in California are linked to growth in income inequality.VI The Bay Area, and San Francisco County in particular, has some of the highest income disparities in the state of California. The San Francisco household with earnings at the 80th percentile earns over 5.4 times more than the household at the 20th percentile. ($114,119 vs. $21,175).XXXIII If low-income families’ financial growth remains lower than middle and high-income families, a larger population will be susceptible to food insecurity.
• Increased costs for food, transportation and housing. As these costs increase, the already high cost of living in San Francisco will continue to swell and put additional stress on low-income residents.
All of the trends mentioned above will put additional strain on publicly funded programs and community based organizations, all of which are already well over capacity. It is crucial to prepare for the future by examining imminent need, leveraging available resources to their fullest potential, and thinking strategically to create solutions that will meet the rising demand.
What should be done?There are several things that can be done to address food security in San Francisco. The selected items below are considered imperative for success.
San Francisco must have:
Adequate staffing and improved processes for food assistance programs, in particular SNAP, WIC, school meals and the Summer Lunch Program. Given the immense and growing need for food assistance, it is important that people who are eligible for benefits not only receive them, but receive them as soon as possible. Publicly funded programs must have adequate staff and efficient processes to address current and future need.
Adequate senior and disabled nutrition programs. These two groups are particularly vulnerable to food insecurity; programs must be accessible and adequate for their needs. San Francisco must ensure city-wide access to food resources for the disabled and seniors. As the aging senior population continues to grow, current shortcomings could mean that more seniors go hungry. A previous assessment conducted by the San Francisco Department of Aging and Adult Services (DAAS) demonstrates the inadequacy of current programs.
Adequate funding for community based food programs. Community-based organizations must have enough funds to successfully operate their programs and meet the needs of the community. With

20
growing need, increasing food and transportation costs, and shrinking budgets, the funding gaps are increasing and there is less financial support available from private donors, corporations and foundations.
City-wide nutrition analysis and clearly defined nutrition standards. San Francisco needs to conduct a nutrition analysis of free and low-cost meals served by publicly funded programs and community-based programs. From this analysis, the City should make recommendations on what changes should be made in order to meet already defined and/or desirable nutrition goals. In addition, as there are various nutrition standards for different services (serving people with diabetes, the elderly, etc), it is important that all standards be clearly outlined and linked to the corresponding services. Standards need to be re-evaluated on a regular basis to ensure they are appropriate and up to date. Organizations require significant resources for training and monitoring to ensure the standards are followed.
Affordable housing, job creation and training, and living wages. San Francisco must continue to prioritize affordable housing and job creation, job training, local hiring and paying a living wage. Since the cost of living in San Francisco is so high, it is important that low-income residents receive both housing and job-related support. By providing people with more opportunities to live and work in San Francisco, fewer will face food insecurity.
A more accurate poverty measure for San Francisco residents. The federal poverty level (FPL) does not accurately reflect need in San Francisco because it does not account for the high cost of living in California. The City must move beyond the FPL and create a more accurate measurement in order to effectively address residents’ food insecurity and hunger.
Collaboration and sharing of resources across community based organizations and City agencies. All organizations must communicate on a regular basis to ensure alignment on food security goals and initiatives. Particularly in a time of high deficits and low funding, collaboration and efficiency across these organizations is imperative. Groups that encourage this communication, like the FSTF, the Tenderloin Hunger Task Force, the Southeast Food Access Working Group (SEFA) are critical for this collaboration.
What can you do?• Support community-based organizations providing food to San Franciscans in need through donations,
volunteering and joining advocacy efforts. Find organizations to support at www.sffood.org.
• Stay informed by signing up for the San Francisco Food Security Task Force list serve by emailing: [email protected].
• Talk to your local officials about the issues. For information on food security in your district, visit http://www.sfdph.org/dph/files/mtgsGrps/default.asp#foodsecurity
• Learn more about hunger and food insecurity at: California Food Policy Advocates (www.cfpa.org) and Food Research and Action Center (www.frac.org).

21
ReferencesI Andersen, S.A., ed. (1990). Core Indicators of Nutritional State for Difficult to Sample Populations, The Journal of Nutrition
120:1557S-1600S.
II U.S. Department of Agriculture, Economic Research Service. Food Security in the United States: Key Statistics and Graphics.
Available at http://www.ers.usda.gov/ Accessed June 5, 2010.
III U.S. Census Bureau. B17024, Age by Ratio of Income to Poverty Level in the past 12 months, San Francisco County, 2009
American Community Survey, American FactFinder. Available at: http://factfinder.census.gov/, Accessed October 28,
2010.
IV U.S. Department of Housing and Urban Development. The Final FY 2010 San Francisco, CA HUD Metro FMR Area FMRs for
All Bedroom Sizes, Final FY 2010 Fair Market Rent Documentation System. Available at http://www.huduser.org/portal/
datasets/fmr/fmrs/FY2010_code/2010summary.odn?inputname=METRO41860MM7360*San+Francisco%2C+CA+HUD+Metro+F
MR+Area&data=2010&fmrtype=Final, Accessed June 22, 2010.
V U.S. Department of Housing and Urban Development. The Final FY 2010 Topeka, KS HUD MSA FMR Area FMRs for All Bedroom
Sizes, Final FY 2010 Fair Market Rent Documentation System. Available at: http://www.huduser.org/portal/datasets/
fmr/fmrs/FY2010_code/2010summary.odn?inputname=METRO45820M45820*Topeka, KS MSA&data=2010&fmrtype=Final,
Accessed June 22 2010.
VI Reed, D. Poverty in California, Moving Beyond the Federal Measure. California Counts. Vol. 7, Number 4. May 2006.
VII Insight Center for Community Economic Development. (2008). The Self-Sufficiency Standard for San Francisco County, CA.
Available at: http://www.insightcced.org/uploads/cfes/San%20Francisco.pdf, Accessed July 21, 2010.
VIII California Budget Project. (2010, June). Making Ends Meet: How Much Does it Cost to raise a Family in California? Available
at: http://www.cbp.org/pdfs/2010/100624_Making_Ends_Meet.pdf Accessed July 21, 2010.
IX U.S. Bureau of Labor Statistics. Unemployment Rates by County, not seasonally adjusted, California January 2010. Available
at: http://data.bls.gov/map/servlet/map.servlet.MapToolServlet?state=06&datatype=unemployment&year=2010&period=
M01&survey=la&map=county&seasonal=u, Accessed June 15, 2010.
X Nord, M. (2009, September). Food Insecurity in Households with Children: Prevalence, Severity, and Household
Characteristics. U.S. Department of Agriculture, Economic Research Service. Bulletin Number 56. Available at: http://
www.ers.usda.gov/Publications/EIB56/EIB56.pdf, Accessed June 21, 2010
XI San Francisco Food Bank. About Hunger. Available at: http://www.sffoodbank.org/about_hunger/ Accessed June 8, 2010.
XII Drewnowski, A. and Darmon, N. (2005). The Economics of Obesity: Dietary Energy Density and Energy Cost. American Journal
of Clinical Nutrition 82(1 Suppl), 265S-273S.
XIII Seligman, H.K., Bindman, A.B., Vittinghoff, E., Kanaya, A.M., and Kushel, M.B. (2007a). Food Insecurity is Associated with
Diabetes Mellitus: Results from the National Health and Nutrition Examination Survey (NHANES) 1999-2002. Journal of
Internal Medicine 22(7), 1018-23.

22
XIV Murphy, C., Ettinger de Cuba, S., Cook, J. Cooper, R., and Weill, J.D. (2008) Reading, Writing, and Hungry: The
consequences of food insecurity on children, and on our nation’s economic success. Issue Paper #6. Partnership for
America’s Economic Success.
XV Seligman, H.K., and Schillinger, D. (2010) Hunger and Socioeconomic Disparities in Chronic Diseases. New England Journal of
Medicine 363;1:6-9.
XVI Seligman, H.K., Laraia, B.A., and Kushel, M.B. (2009) Food insecurity is associated with chronic disease among low-income
NHANES participants. Journal of Nutrition 140:304-10.
XVII Nelson, K., Cunningham, W., Andersen, Harrison, G., Gelberg, L.(2001) Is food insufficiency associated with health status
and health care utilization among adults with diabetes? Journal of General Internal Medicine 16:404-411.
XVIII Lozoff, B. et. al. (2003) Behavioral and developmental effects of preventing iron-deficiency anemia in healthy full-term
infants. Pediatrics. 112:846-854.
XIX San Francisco Human Services Agency (data source: Social Security Administration Supplemental Security Record, 100
percent data; IPUMS, 2008 American Community Survey)
XX Wolfe, W.S., Frongillo, E.A,, and Valois, P. (2003). Understanding the experience of food insecurity by elders suggests ways
to improve its measurement. Journal of Nutrition. 133:2762-2769.
XXI How are California’s SSI-CalWORKS Children and Families Faring? A Look at CalWORKs Children with Parents on SSI. (2010,
July). CalWORKS and SSI, An Update on Child Well-Being. Child & Family Policy Institute of California.
XXII Jensen, D. (2006, September). San Francisco Department of Aging and Adult Services Community Needs Assessment. San
Francisco Human Services Agency Planning Unit.
XXIIILee, J.S., and Frongillo, Jr. E.A. (2001). Nutritional and health consequences are associated with food insecurity among
U.S. elderly persons. Journal of Nutrition. 131: 1503-1509.
XXIVPopulation Projections for California and Its Counties 2000-2050, by Age, Gender and Race/Ethnicity. (2007, July) State of
California, Department of Finance. Available at: http://www.dof.ca.gov/research/demographic/reports/projections/p-3/
documents/SAN%20FRANCISCO.xls, Accessed August 19, 2010.
XXVSan Francisco General Plan, Housing Element, Part 1 Data and Needs Analysis (Draft 2, June, 2010). Available at: http://
housingelement2009.sfplanning.org/docs/Housing_Element_PartI_Data_Needs_Jun_10.pdf, Accessed October 4, 2010.
XXVISan Francisco SRO Task Force (2010) Families Living in SROs: 2010 Survey. Available at: http://www.sfdph.org/dph/files/
commTaskForcesDocs/SROdocs/SROmtgs/sro/uploadedfiles/sro/meetings/Full_Task_Force/supporting/2010/Families_in_
SROs_Survey_061710.pdf, Accessed October 4, 2010.
XXVIISan Francisco Human Services Agency and Applied Survey Research. (2009) San Francisco Homeless Count and Survey.
Available at: http://www.sfgov3.org/ftp/uploadedfiles/lhcb/homeless_count/SF2009HomelessCountFINALReport.pdf,
Accessed October 4, 2010.
XXVIIIWeiser SD, Frongillo EA, Ragland K, Hogg R, Riley ED, Bangsberg DR. Food Insecurity is Associated with Incomplete HIV RNA
Suppression Among Homeless and Marginally Housed HIV Infected Individuals in San Francisco. Journal of General Internal
Medicine 2009; 24: 14-20.

23
XXIXBrown, L.J., Shepard, D., Martin, T., and Orwat, J. (2007, June). The Economic Cost of Domestic Hunger: Estimated
Annual Burden to the United States. An analysis commissioned by The Sodexho Foundation, in partnership with The
Public Welfare Foundation and Spunk Fund, Inc. Available at: http://www.sodexofoundation.org/hunger_us/Images/
Executive%20Summary%20and%20Foreword_tcm150-155134.pdf, Accessed June 7, 2010.
XXX U.S. Department of Agriculture. FY2010 Budget Summary and Annual Performance Plan. (2010). Available at: http://www.
obpa.usda.gov/budsum/FY10budsum.pdf, Accessed on June 24, 2010.
XXXIThis program is coordinated by Campaign for Better Nutrition, http://www.campaignforbetternutrition.org.
XXXIIU.S. Metro Job Recovery Will Take a While. (2009, August). IHS Global Insight. Available at: http://www.ihsglobalinsight.
com/Perspective/PerspectiveDetail17524.htm, Accessed on August 4, 2010.
XXXIIIIndicator HE.3.a Income Inequality. (2000). Healthy Development Measurement Tool. Available at: http://www.thehdmt.
org/indicators/view/146, Accessed on August 4, 2010.
To access this report online, please visit http://www.sfdph.org/dph/files/mtgsGrps/default.asp#foodsecurity

For more information contact:
San Francisco Food Security Task Forcec/o San Francisco Department of Public Health (Environmental Health)1390 Market Street, #822San Francisco, CA 94102415-252-3853
About the San Francisco Food Security Task Force (FSTF)The Food Security Task Force (FSTF) was established in 2005 by the San Francisco Board of Supervisors and charged with the responsibility of creating a city-wide plan for addressing food security. The group tracks vital data regarding hunger and food security in San Francisco, including the utilization and demand for: federal food programs, community based organizations’ meal programs and programs targeting particular populations. The FSTF educates the public about city budgets and the role of food security in public health and community development. Current members of the FSTF include community based organizations and government agencies addressing hunger in San Francisco.
San Francisco Board of Supervisors
Food SecurityTask Force