food insecurity: when people must live with hunger and
TRANSCRIPT

The state of food insecurity in the world
food insecurity:when people must live with hunger
and fear starvation
1999

1999The state of food insecurity in the world
food insecurity:when people must live with hunger
and fear starvation

The state of food insecurity in the world 19992
About this report
available on progress and reversalsduring the 1990s and highlights countriesthat have achieved the greatest gains orsuffered the most severe setbacks overthe past two decades.
In addition, the report analyses some of the underlying factors that contributedmost to gains and setbacks in thesecountries and examines the impact ofshort-term “shocks”, such as war, natural disaster or financial crisis. It also looks at national efforts to identifypopulation groups particularly prone to food insecurity and malnutrition. And it probes the differences in ourunderstanding of hunger and nutritionalstatus that result from comparing data
about food access with analysis of dataabout weight and height of young children.Finally it draws lessons from what hasbeen learned thus far and offers somepointers for the way ahead.
The State of Food Insecurity in theWorld draws on FAO’s ongoing workprogramme to monitor and analyse foodinsecurity and the nutritional status ofpeople worldwide. This work representspart of FAO's contribution to the FoodInsecurity and Vulnerability Informationand Mapping Systems (FIVIMS) initiativethat is being established at global andnational levels (see box).
In order to take effective action to reduce hunger, stakeholdersand decision-makers need reliable, detailed information aboutthe extent of the problem and the people it affects. The WorldFood Summit mandated the establishment of a Food Insecurityand Vulnerability Information and Mapping Systems programmeto provide that information. The FIVIMS initiative draws on manyexisting information systems, such as crop forecasting and earlywarning systems, household food security and nutritionalinformation systems, and vulnerability assessment and mappingsystems.
FIVIMS operates on both national and global levels. Nationally,it provides a link for existing information systems that gatherand analyse relevant data, ranging from health and climate tomarkets and household food security. Globally, it is beingcoordinated by an inter-agency working group (IAWG), with FAOas its secretariat. The IAWG supports the national-level systemsand is working to establish a common database and informationexchange network. Its members include United Nationsagencies, bilateral aid agencies and international or non-governmental organizations.
The immediate objectives of FIVIMS are to:
• increase attention to food security issues; • improve the quality of food security-related data and analysis; • promote donor collaboration on food security information
systems at country level; • encourage better action programmes on poverty and hunger; • improve access to information through networking and sharing.
IAWG-FIVIMSmembership
Australian Agency for International Development (AUSAID)Canadian International Development Agency (CIDA)German Agency for Technical Cooperation (GTZ)United States Agency for International Development (USAID)Food and Agriculture Organization of the United Nations (FAO)International Fund for Agricultural Development (IFAD)International Labour Organisation (ILO)United Nations Department of Economic and Social Affairs
(UNDESA)Office of the Coordinator for Humanitarian Affairs (OCHA)United Nations Development Programme (UNDP)United Nations Environment Programme (UNEP)United Nations Children’s Fund (UNICEF)United Nations Population Fund (UNFPA)World Bank (WB)World Food Programme (WFP)World Health Organization (WHO)World Meteorological Organization (WMO)Administrative Committee on Coordination/Subcommittee
on Nutrition (ACC/SCN)International Food Policy Research Institute (IFPRI)Centro Internacional de Agricultura Tropical (CIAT)Helen Keller International (HKI)Save the Children Fund (SCF/UK)World Resources Institute (WRI)
Food Insecurity and Vulnerability Information and Mapping Systems
This is the first edition of The Stateof Food Insecurity in the World. Itprovides the latest estimates ofthe number of chronically hungry
people in the developing world andintroduces the first comparable estimatesever made of the number of people who gohungry in the industrialized countries andcountries in transition.
This and subsequent editions of TheState of Food Insecurity in the Worldwill serve as regular progress reports onglobal and national efforts to reach thegoal set by the World Food Summit in 1996– to reduce the number of undernourishedpeople in the world by half by the year2015. The report provides the first data

3
4 ForewordTowards the World Food Summit target
6 Undernourishment around the world6 Counting and locating hungry people
10 Progress and setbacks in developing countries
1 1 Nutritional status and vulnerability1 1 Well-being of young children
13 Incidence of malnutrition in vulnerable areas
15 Vulnerable people – who and why
16 Profiles of vulnerability
18 Environmental potential and constraints
20 Dynamics of change20 Factors that bring about change
2 1 Economic growth spurs improvements in food security status
for most Asian nations
22 Mixed picture of progress and setback characterizes Latin America
and the Caribbean
23 War-ravaged Afghanistan loses ground while Morocco leads
good performers
24 Several West African nations register gains but problems grow
worse elsewhere in Africa
25 Recent shocks: floods, drought, war and financial collapse
threaten progress
28 The way aheadMeeting the challenge
29 Tables
The state of food insecurity in the world 1999
Contents

The state of food insecurity in the world 19994
Towards the World Food Summit target
Three years ago, leaders from186 countries gathered inRome and made a solemncommitment – to halve the
number of hungry people by the year2015. Is the world living up to thepromise it made at the 1996 World Food Summit?
New estimates for 1995/97 showthat around 790 million people in thedeveloping world do not have enoughto eat. This is more than the totalpopulations of North America andEurope combined. The “continent” of the hungry includes men, womenand children who may never reachtheir full physical and mentalpotential because they do not haveenough to eat – many of them mayeven die because they have beendenied the basic human right to food.This state of affairs is unacceptable.
Yes, the number of undernourishedpeople has decreased by 40 millionsince 1990/92, the period to whichthe estimates of 830 to 840 millioncited at the Summit refer. But wecannot afford to be complacent. Acloser look at the data reveals that in the first half of this decade a groupof only 37 countries achievedreductions totalling 100 million.Across the rest of the developingworld, the number of hungry peopleactually increased by almost 60 million.
The current rate of progress – anaverage reduction of around 8 milliona year – falls squarely within thetrajectory of “business as usual”. Ifthe pace is not stepped up, more than600 million people will still go tosleep hungry in the developingcountries in 2015. To achieve theSummit goal, a much faster rate of
progress is required, averagingreductions of at least 20 million ayear in the developing world.
Hunger is often associated withdeveloping countries. While that istrue, this report provides statisticalevidence that the problem is notlimited to developing countries. For the first time, FAO presentsaggregate estimates of the number of undernourished in developedcountries. The resulting figure, 34 million people, confirms that evendeveloped countries are confrontedwith the challenge of overcoming foodinsecurity. Although many of these 34 million people live in countries thathave been undergoing major politicaland economic transition in the 1990s,pockets of hunger are to be found inall parts of the world.
It is my conviction that there is noreason not to have a hunger-freeworld some time in the next century.The world already produces enoughfood to feed the people who inhabit ittoday. And it could produce more.However, unless deliberate action istaken at all levels, the chances arethat hunger and malnutrition willcontinue in the foreseeable future.
But, before effective action can betaken, we need to know who thehungry and vulnerable are, wherethey live, and why they have not beenable to improve their situations. The numbers are 790 million indeveloping countries, and 34 millionin developed countries, but we mustput faces on the numbers.
Whether it is the victims of civilconflict or herders who sufferbecause their pastureland isdisappearing, whether it is the urbanpoor living on national welfare or the
geographically isolated ethnicminorities, we cannot forget that theyare human beings, with individualneeds and aspirations. In poorvillages and neighbourhoods acrossthe world, the scene is the same:people working from sunrise tosunset dealing with harsh climates,tired earth and the effects of fragileeconomies, labouring constantly toprovide for themselves and theirfamilies – striving for little more thanenough food to keep themselves alive.
That is why we must focus not only on abstract global numbers but onthe faces and places that make upthose numbers. In calculations andpredictions that use variables ofpopulation growth, output rates,declining resource bases, politicalchanges, devastation from diseasesor the effects of natural andmanmade disasters, we must alwaysremember that we are talking aboutpeople – individuals who, given thechance, have the potential to makesignificant contributions to the worldaround them. But in order to reachtheir potential, they need and deservea life free from hunger.
New technologies allow us to linknational information systems andestablish global networks, toexamine an entire ocean or one dropof water, to punch buttons and creategraphs and flow charts that show usinstantly and clearly the kind ofprogress being made. Knowledge notonly gives us power, it gives usinsight and direction. With theestablishment of the Food Insecurityand Vulnerability Information andMapping Systems (FIVIMS) initiative,we are expanding our ability togather, analyse and share knowledge
Foreword

The state of food insecurity in the world 1999 5
Number of undernourished in the developing world: observed and projected ranges compared to the World Food Summit target
that can guide future initiatives toincrease access to food for all.
The work of FIVIMS is essential aswe enter the new millennium. Wemust devise and put into actionpolicies and programmes to enablegovernments, international and non-governmental organizations,communities and individuals toovercome the obstacles that stand inthe way of what should be a birthrightfor every one of the 6 000 millionpeople on this planet – enough to eat.
As we have seen, the progressbeing made against hunger in theworld is uneven. It is clear that thereis no global formula for success. Thesuccess must come from specific
actions undertaken and goals set atthe local, national and regional levels,where individuals will be able to seethe impact of their involvement.
In the absence of new investment and policy efforts at all levels, current technological and socio-economic trends are likely to continue.The number of undernourished peoplemay continue to decline ... but onlyslowly and only in some regions of theworld. Deliberate and targetedmeasures and new investments arefundamental to improve the trend.
The reduction to 790 million hungrypeople in the developing countries is abeginning. Our stated goal is toreduce that number, at the minimum,
to around 400 million by 2015, as wellas to reduce by half or more thenumber of 34 million hungry indeveloped countries. But as we worktowards the goal, we must remainaware that we cannot stop when wereach it. Because, even that number isfar too big. Even one hungry person isone too many.
Jacques DioufDirector-GeneralFAO
700 700
900 900
800 800
600 600
500 500
400 400
300 300
1 000 1 000
1965
Millions Millions
1970 19801975 1985 1990 1995 2000 2005 2010 2015 2020
FAO estimates of the number of undernourishedpeople in the world are necessarily based onimperfect information. As better data becomeavailable the estimates are revised retrospectively.Range estimates therefore provide a more reliableillustration of the number of undernourished overtime. The estimated range for past, projected andtarget paths is based on a range of 5 percent aboveand below the past, projected and target numbersconsidered by the World Food Summit in 1996.Within these ranges, the most recently calculatedpoint estimates are shown.
Range around the point estimates reported at the World Food Summit
Range around the projected figure for 2010 reported at the World Food Summit
Range for 1996 implied by the projection for 2010
Range around the extrapolation to 2015 of the projection for 2010
World Food Summit Target
Point estimates prepared in 1999

Category % undernourished Description
1 �2.5 Extremely low
2 2.5-4 Very low
3 5-19 Moderately low
4 20-34 Moderately high
5 �35 Very high
No data
The state of food insecurity in the world 19996
Counting and locating hungry people
Almost 800 million people in thedeveloping world do not haveenough to eat. Another 34 millionpeople in the industrialized
countries and countries in transition alsosuffer from chronic food insecurity. If allthe world’s undernourished people weregathered together, the population of thecontinent of the hungry would dwarf that of every other continent except Asia.
The hunger of these people is not atransitory condition. It is chronic. It isdebilitating. Sometimes it is deadly. Itblights the lives of all who are affectedand undermines national economies anddevelopment processes where it is foundon a large scale, as is the case acrossmuch of the developing world.
The figures, tables and map in thissection depict the scale of the problemworldwide at the turn of the millennium.They also show changes that have takenplace in 98 developing countries between1990/92 and 1995/97, the most recentperiod for which information is available.
That information highlights the factthat progress has been made. On a globalscale, the gains have been sufficient tobring the total number of undernourishedpeople in the developing world below the800 million figure cited at the World FoodSummit in 1996.
The gains are encouraging, but farfrom satisfactory. More detailed analysisconfirms that the momentum is too slowand the progress too uneven to achievethe goal set by the Summit and reduce thetotal to around 400 million by the year2015. In fact, the number of hungrypeople is growing in many parts of the world.
Small increases or decreases in thenumber of undernourished people fromone year to the next may simply reflecttransitory conditions that claim ourattention but do not touch thefundamental problem. Significant, lasting change in the number is theappropriate indicator of progress orsetbacks in banishing chronic hungerfrom our world.
Chronic food insecurity is represented byestimates of the number of people whose foodintake does not provide enough calories to meettheir basic energy requirements – i.e. theundernourished. Measurements of nutritionalstatus or undernutrition, on the other hand, arebased on information about people's actualphysiological condition.
In practice, these are two distinct and usefulmeasures derived from very different analyticalapproaches.1. Undernourishment is estimated from existing
data about numbers of people and the amount of food available to them.2. Undernutrition is determined from data about people's weight, height and age. Ratios calculated from these measurementsindicate the outcome not only of inadequate food intake but also of poor health and sanitation conditions that may prevent peoplefrom deriving full nutritional benefit from what they eat.
The two approaches are complementary, asillustrated:
A note on methodology – how the numbers are calculated
Prevalence of undernourishment in both developing and developed countries
Measuring and monitoring prevalencePrevalence of undernourishment is measured by theshare of a country’s total population that isundernourished. The higher the prevalence, the morewidespread the problem. To help analyse and monitorprogress, the following five prevalence categories havebeen established:
Undernourishment around the world

The state of food insecurity in the world 1999 7
The numbers cited in this section refer toestimates of undernourishment based on a fewcommonly available types of information:■ food production, trade and stocks;■ figures for total population and distribution by
age and gender;■ data on consumption distribution.
The method is described in detail in The SixthWorld Food Survey, published by FAO in 1996.Very briefly it relies on: 1. calculating the total number of caloriesavailable from local food production, trade andstocks;2. calculating an average minimum caloriesrequirement for the total population based onthe number of calories needed by different ageand gender groups and the proportion of thepopulation each group represents;3. dividing the total number of calories availableby the number of people in the country;4. factoring in a coefficient for distribution totake account of inequality in access to food;5. combining this information to construct the
distribution of the food supply within thecountry. This gives the percentage of thepopulation whose food intake falls below theminimum requirement;6. multiplying this percentage by the size of thepopulation to obtain the number ofundernourished people.
These calculations produce an estimate of thenumber of people in each country whoseaverage calorie intake falls below the minimumrequired to keep the body going and performlight activity. Adding these numbers togetheryields a global estimate of the total number ofundernourished people.
Food intake
Physiologicalcondition
Health, sanitation and care
Undernourishment
Undernutrition

An overwhelming majority of theundernourished people indeveloping countries live in Asiaand the Pacific. This region is home
to 70 percent of the total population of thedeveloping world. And it accounts for almost two-thirds (526 million) of theundernourished people as well. India alonehas more undernourished people (204 million) than all of sub-Saharan Africacombined. With India’s neighbours added in, the South Asian subregion accounts for more than one-third of the world total (284 million). Another 30 percent (240 million) live in Southeast and East Asia,more than 164 million in China.
Sub-Saharan Africa is home to almost aquarter of the developing world’s hungrypeople. The problem varies in severityacross the continent. Although West Africahas the largest total population of any of theAfrican subregions, it has the fewestundernourished. By contrast, East Africa,with a slightly smaller total population, hasmore than twice as many undernourishedpeople. The numbers in Central andSouthern Africa are also proportionatelylarger, although both have much smallertotal populations.
As these figures suggest, in addition tolooking at the numbers of people afflicted byhunger, it is also important to consider theproportion of the population affected on anational and regional basis. This analyticalapproach spotlights areas where problemsare most severe. It also helps identify groupsof countries that may share commonproblems and common priorities for action.
Overall, more than a quarter of the world’s
The state of food insecurity in the world 19998
Counting and locating hungry people
chronically hungry people live in countrieswhere the prevalence of undernourishmentis very high (35 percent or more). And in allbut three of these countries, the proportionand number of hungry people have beenincreasing for some time.
The problem is especially severe inCentral, East and Southern Africa. Almosthalf (44 percent) of the 340 million peopleliving in the 26 countries of these subregionsare undernourished. Only six countrieselsewhere in the world have such highprevalence rates – Afghanistan,Bangladesh, Haiti, the Democratic People’sRepublic of Korea, Mongolia and Yemen.
Around 570 million undernourishedpeople – almost three-quarters of the world total – live in countries where theprevalence of hunger is neither very low(below 5 percent) nor very high (above 35 percent). While Asian countries are about equally divided between the “moderately low" (5-19 percent) and"moderately high" (20-34 percent)categories, most countries in Latin Americaand the Caribbean fall in the former. Six million undernourished people live incountries where the prevalence is very orextremely low, mainly in the Near East (see chart below).
Proportions of undernourished in developing countries, by category, 1990/92 and 1995/97
Undernourishment in developed countries
First estimates indicate that around 34 million undernourished people live in the industrializedcountries and countries in transition. More than three-quarters of them – 26 million – areconcentrated in the countries in transition of Eastern Europe and the area of the former USSR. The remaining 8 million live in industrialized countries.
The proportion of undernourished people is very low or extremely low in all industrialized countries and 12 of the 27 countries in transition. But significantly higher rates exist in 15 of the countries in transition, mainly those belonging to the area of the former USSR and the former Federal Republic of Yugoslavia. Prevalence categories for all developed countries are shown in the map on page 6.
Undernourished in developed countries, 1995/97 (millions)
REGION TOTAL UNDERNOURISHED NUMBER OF POPULATION (%) PEOPLE
Industrialized countries 876 �2.5 8Countries in transition 413 6 26
of which: Eastern Europe 121 4 4Former USSR 292 7 22
LIBY
A
TUNI
SIA
UNIT
ED A
RAB
EMIR
ATES
KORE
A, R
EP
SYRI
A
ARGE
NTIN
A
MAL
AYSI
A
LEBA
NON
TURK
EY
JORD
AN
KUW
AIT
EGYP
T
URUG
UAY
SAUD
I ARA
BIA
CHIL
E
ALGE
RIA
MOR
OCCO
ECUA
DOR
MEX
ICO
MAU
RITI
US
INDO
NESI
A
IRAN
MYA
NMAR
COST
A RI
CA
NIGE
RIA
GABO
N
SURI
NAM
E
BRAZ
IL
EL S
ALVA
DOR
JAM
AICA
GHAN
A
TRIN
IDAD
& TO
BAGO
COLO
MBI
A
PARA
GUAY
CHIN
A
MAU
RITA
NIA
SWAZ
ILAN
D
CÔTE
D’IV
OIRE
VENE
ZUEL
A
IRAQ
BENI
N
GUYA
NA
GUAT
EMAL
A
PANA
MA
SENE
GAL
VIET
NAM
PAKI
STAN
CUBA
PERU
Category 2:2.5-4% undernourished
Category 3:5-19% undernourished
Category 1:�2.5% undernourished
20
40
60
0
%
Undernourishment around the world

The state of food insecurity in the world 1999 9
Number of undernourished, by region,1995/97 (millions)
Total population and number of under-nourished, by region, 1995/97 (millions)
Number and proportion of undernourished, by region andsubregion, 1995/97
Number of undernourished by prevalence category and by region,1995/97
Category 4:20-34% undernourished
Category 5:�35% undernourished
20
SUDA
N
HOND
URAS
NEPA
L
INDI
A
PHIL
IPPI
NES
TOGO
BOLI
VIA
PAPU
A NE
W G
UINE
A
THAI
LAND
BOTS
WAN
A
GAM
BIA
SRI L
ANKA
DOM
INIC
AN R
EPUB
LIC
LESO
THO
UGAN
DA
MAL
I
NAM
IBIA
BURK
INA
FASO
NICA
RAGU
A
GUIN
EA
CAM
EROO
N
LAOS
CAM
BODI
A
CONG
O, R
EP
BANG
LADE
SH
YEM
EN
RWAN
DA
MAL
AWI
NIGE
R
ZIM
BABW
E
MAD
AGAS
CAR
TANZ
ANIA
KENY
A
LIBE
RIA
CENT
RAL
AFRI
CAN
REP
SIER
RA L
EONE
ANGO
LA
ZAM
BIA
CHAD
MON
GOLI
A
KORE
A, D
PR
ETHI
OPIA
CONG
O, D
EM R
EP
HAIT
I
AFGH
ANIS
TAN
MOZ
AMBI
QUE
BURU
NDI
ERIT
REA
SOM
ALIA
40
80
60
0
%
0 1 2001 000800600400200
China
India
Other Asia and Pacific
Latin America and Caribbean
Near East and North Africa
Sub-Saharan Africa
Grey bars:total population
Coloured bars: number undernourished
India 204
Other Asia andPacific 157
Latin Americaand Caribbean
53
Sub-SaharanAfrica 180
Near East andNorth Africa 33
China 164
200 150 50100
Number of undernourished(millions)
Proportion of undernourished(%)
*including Papua New Guinea
500 403020100China
Other East Asia*Southeast Asia
IndiaOther South AsiaNorth America
Central AmericaCaribbean
South AmericaNear East
North AfricaWest Africa
Central AfricaEast Africa
Southern Africa
Categories 1 and 2:�5%
Total: 6 million
Category 3:5-19%
Total: 287 million
Category 4:20-34%
Total: 282 million
Category 5:�35%
Total: 216 million
China
India
Other Asia and Pacific
Latin America and Caribbean
Near East and North Africa
Sub-Saharan Africa
Grey bars: 1990/92 Coloured bars: 1995/97

Undernourishment in countries where hunger is decreasing either fast enough or insufficiently to reach the WorldFood Summit Target, 1980-1996
According to the most recent dataavailable, the number ofundernourished people in thedeveloping world has been reduced
to 790 million, 40 million less than thenumber estimated at the time of the World Food Summit in 1996. The decline in the percentage of people who areundernourished is also significant – from 20 percent in the 1990/92 reference periodused at the Summit to slightly less than 18 percent in 1995/97.
These gains do not appear to be eithertransitory or anomalous. In fact, they areconsistent with a steady downward trend,as confirmed by a look at the figures for1979/81, when almost 920 million peoplewent hungry, amounting to around 30 percent of the population of thedeveloping world.
But the pace of progress has not beenfast enough to reach the goal of around 400 million by 2015 set by the Summit. Infact, if the present trend continues, withreductions of approximately 8 million a year
Undernourishment around the world
The state of food insecurity in the world 199910
Progress and setbacks in developing countries
in the ranks of the undernourished, the totalin 2015 will be 638 million. That figurewould represent no more than the"business-as-usual" outcome that wasbranded as unacceptable by the Summit.
Progress in combating hunger has alsobeen very uneven. Between 1991 and 1996,the proportion of the population goinghungry increased in 27 countries, includingmany of those where the problem wasalready most severe. In another 32 countries,the proportion either remained steady orshrank too slowly to offset growth in the totalpopulation. Only 37 countries succeeded inbringing down the proportion rapidly enoughto reduce the absolute number. Because thisgroup included several large countries, itsreduction of 97 million outweighed theincrease of 59 million among the othercountries, resulting in a net reduction ofabout 40 million for the developing world as a whole.
Over the longer period, between 1980and 1996, only 40 countries reduced hungerquickly and steadily enough to meet the
Summit target. Several of these already hadvery low or insignificant levels of chronichunger to begin with. But past performancehas not been sufficient in 56 countries.
The prospects are not all bleak, however. Many countries, including severalof the large countries that dominate global totals, have registered steadyimprovements. And some have scoredremarkable gains. Led by five countriesfrom West Africa, 13 countries decreasedthe proportion of hungry people in theirpopulations by more than one percentagepoint a year over the 16-year period.Valuable lessons can be learned from theirexperiences as well as from the hardshipsthat have beset countries where theproportion of undernourished soared overthe same period. A detailed examination offactors contributing to progress andproblems in the countries that registeredthe largest changes in each of the fourregions that make up the developing worldcan be found in the section entitledDynamics of change.
Countries in each region with the largest reductionsand increases in undernourishment, 1980-1996
Countries with the largest reductions and increases inundernourishment, 1980-1996
4428
10617
3166
22610
18751432
19 61 28
17 61 9
1141421
-50Change in the proportion of people who are undernourished, 1980-1996 (%)
30-40 -30 -20 -10 0 10 20
Asia and Pacific
Latin America and Caribbean
Near East and North Africa
Sub-Saharan Africa
Cambodia
Honduras
Morocco
Ghana
Korea, DPR
Cuba
Afghanistan
Burundi
-50Change in the proportion of people who are undernourished, 1980-1996 (%)
30-40 -30 -20 20-10 0 10
AfghanistanKorea, DPRBurundiMadagascarMongolia
GhanaBurkina Faso
GambiaNigeria
Mali
Number of countries Number of undernourished people (millions)Losing groundMaking progress
Losing groundMaking progress Losing groundMaking progress
Losing groundMaking progressAsia and Pacific
Latin America and Caribbean
Near East and North Africa
Sub-Saharan Africa
Asia and Pacific
Latin America and Caribbean
Near East and North Africa
Sub-Saharan Africa
Sufficientdecrease
Stable and low
Insufficientdecrease
Increase

That information can only be obtained byweighing and measuring childrensystematically (see note below).
Information available from countriesthat have conducted anthropometricsurveys shows that an alarmingly highproportion of children in the developingworld suffer the effects of undernutrition.According to data obtained from surveysconducted between 1987 and 1998, two outof five children in the developing world are
The state of food insecurity in the world 1999 11
Well-being of young children
Children suffering fromundernutrition, by region
The data and maps onundernourishment presentedearlier in this report tell us wherepeople have the most difficulty
obtaining sufficient food. But they do notindicate where children’s nutritional statushas been most severely damaged by acombination of inadequate food intake andother factors, such as high incidence ofdiarrhoea and other diseases that preventproper digestion of the food consumed.
Undernutrition among childrenunder five in developing countries
Measuring nutritionalstatus
As indicated in the Note on methodology(page 6), measurements of undernourishmentare based on estimates of food intake. But tomeasure malnutrition it is necessary to useanthropometric indicators that tell what ishappening to people's bodies (see panel atright for definitions).
Estimates of food intake and anthropometryhave different objectives, and each hasadvantages and limitations. Anthropometricdata are currently used primarily to measurethe nutritional status of young children. Threedifferent measures of undernutrition arecommonly used: wasting, stunting andunderweight. Nutritionally deprived childrenare those who are significantly smallercompared to commonly used uniformstandards for child growth.
By contrast, in this report prevalence ofundernourishment is measured for a totalpopulation by comparing food intake data withcountry-specific food need standards. These aredetermined on the basis of energy requirementsof each sex-age group, taking into account sex-age specific heights within the population.
Anthropometric data are obtained throughsurveys whose frequency and timing vary fromcountry to country. As a result, these data mustbe used cautiously in making comparisonsbetween countries and time periods. Foodintake measurements, on the other hand, relyon data that are more readily available, recentand fully comparable across countries. So theycan be used effectively to obtain a snapshot ofcurrent conditions, even though they do notcapture the full array of factors determiningnutritional status.
Commonly used terms
food insecurity low level of food intake, whichcan be transitory (when it occurs in times ofcrisis), seasonal, or chronic (when it occurs ona continuing basis)undernourishment chronic food insecurity, in which food intake is insufficient to meetbasic energy requirements on a continuingbasis vulnerability presence of factors that placepeople at risk of becoming food insecure ormalnourished
malnutrition physiological condition resulting from inadequacy or imbalance infood intake or from poor absorption of foodconsumed• undernutrition result of prolonged low level of food intake and/or poor absorption offood consumed. Manifestations includewasting, stunting or underweight, reducedcognitive ability, poor health status and low productivity• micronutrient deficiency lack of essentialvitamins and minerals resulting fromunbalanced food intake and specific problemsof absorption of food consumed• overnutrition result of excessive food intake
anthropometric based on human bodymeasurements• wasting low weight-for-height, generally theresult of weight loss associated with a recentperiod of starvation or severe disease• stunting low height-for-age, reflecting asustained past episode or episodes ofundernutrition• underweight low weight-for-age, reflecting a current condition resulting from eitherinadequate food intake, past episodes ofundernutrition or poor health conditions
stunted, one in three is underweight andone in ten is wasted.
The numbers vary considerably amongregions. In South Asia, half the childrenunder five are underweight, compared with33 percent in Africa and 21 percent in Eastand Southeast Asia. The incidence islowest in Latin America and the Caribbean.With the highest incidence ofundernutrition and a very large populationof children under five, South Asia accountsfor almost half of all the world’sunderweight and stunted children. Thesefigures indicate that far more children inSouth Asia than elsewhere in the world donot reach the weights and heights that areconsidered to represent healthy growth.
Percentage of children500 10 20 30
Stunted
Underweight
Wasted
40
East and Southeast Asia
South Asia
Latin America and Caribbean
Near East and North Africa
Sub-Saharan Africa
East and Southeast Asia (including China)
South Asia (including India)
Latin America and Caribbean
Near East and North Africa
Sub-Saharan Africa
29%
Stunting(199 million)
Underweight(163 million)
Wasting(52 million)
19%
5%
6%
41% 23%
21%
19%
5%
3%
50%20%
6%3%
50%
Nutritional status and vulnerability

The state of food insecurity in the world 199912
In addition to measurements ofchildren’s height and weight, otherindicators of health and sanitaryconditions can help identify and
respond to nutritional problems. Table 2(page 30) presents three indicators ofnutritional status and three indicators ofhealth conditions for developing countries,based on the most recent informationavailable. The nutritional indicators usedare percentage of children under five yearsold who were wasted, stunted orunderweight at the time of the most recentsurvey. The health indicators are lifeexpectancy at birth, the mortality rate forchildren under five and the percentage ofthe population with access to adequatesanitation.
The occurrence of high levels of allthese indicators together obviouslyindicates severe health and nutritionalproblems. Conversely, when all indicators
Well-being of young children
are low, the situation is much more benign.And, indeed, the performance of individualcountries bears this out. Among theapproximately 80 countries that have beenexamined, nine achieved excellent scoresfor all indicators. In all nine countries, theprevalence of undernourishment, asestimated based on food availability andaccess, was also moderately or very low. Atthe other end of the scale, 16 countriesscored very badly on all six indicators. All 16also suffered from moderately high or veryhigh prevalence of undernourishment.
In general, the impact of food intake,health conditions and care practices onchildren’s nutritional status can beunderstood best by analysing levels andchanges in relevant indicators for individualcountries over time. This is not possiblehowever, since the in-depth surveysrequired to monitor nutritional status,health and sanitary conditions are
conducted infrequently. Therefore, theresults presented here are necessarilylimited to cross-country comparisons thatsuggest how factors such as food intake andhealth conditions affect nutritional status.
The graphs on this page show how thenutritional status of children is associatedwith indicators for food intake, healthstatus and sanitary conditions of thepopulation as a whole. The percentage ofchildren younger than five who areunderweight has been selected as theindicator of nutritional status. Prevalenceof undernourishment has been used as theindicator of food intake, life expectancy asthe indicator of overall health status, andpercentage with access to adequatesanitation as the indicator of sanitaryconditions.
For each graph, countries have beengrouped according to categories indicatingwhether prevalence of undernourishmentor occurrence of adverse health conditionsis low, medium, high or very high (alongthe horizontal axis). The highest level,lowest level and average for thepercentage of children under five who areunderweight are shown vertically for thecountries in each category. For example,the graph comparing the prevalence ofundernourishment with that ofunderweight children shows that amongcountries where 35 percent or more of thepopulation are undernourished, onaverage, one-third (33 percent) of thechildren are underweight, with levels forindividual countries ranging from a low of12 percent to a high of 56 percent.
As might be expected, the graphs showthat children’s nutritional status tends tobe better in countries where people getmore to eat, live longer and have bettersanitary facilities. The fact that highpercentages of children are underweighteven in some countries where prevalenceof undernourishment is low or access tosanitary facilities is very high confirms thatnutritional status is determined by acombination of many different factors.Improved understanding of the interplayamong these factors requires moresystematic data collection and moresophisticated analysis. Developing thesetools represents a high priority challengefor FIVIMS.
Undernourishment and underweight children, 1995/97
Life expectancy and underweight children, 1995
Sanitation and underweight children, 1990/97
Nutritional status and vulnerability
0 0
60 60
50 50
40 40
30 30
20 20
10 10
�5% 5-19% �35% 20-34% Prevalence of undernourishment
Highest
Average
LowestHighest
AverageLowest
% u
nder
wei
ght %
underweight
0 0
60 60
50 50
40 40
30 30
20 20
10 10
�50 50-59 �70 60-69 Life expectancy at birth (years)
Highest
Average
Lowest
Highest
Average
Lowest% u
nder
wei
ght %
underweight
0 0
60 60
50 50
40 40
30 30
20 20
10 10
�25% 25-49% �80% 50-79% Access to sanitation
Highest
Average
Lowest
Highest
Average
Lowest
% u
nder
wei
ght %
underweight

Venezuela – widespread poverty despite oil income
With substantial income from oil production, Venezuela is a highlyurbanized country with enough food available to meet requirements. Butpoverty remains widespread, affecting almost half the population. And upto one-third of the children in some impoverished rural states show signsof repeated or prolonged periods of undernutrition.
On a national scale, a moderately low 15 percent of Venezuela’s populationare undernourished and rates of stunting, wasting and underweightamong children are all low. As the map indicates, however, between 20 and 36 percent of children suffer from stunting in several states in thesouth and east of the country where around two-thirds of the populationfall below the poverty line.
Rising unemployment and high inflation have exacerbated the nutritionalproblems of the rural poor and especially indigenous people. More in-depth analysis is needed to identify pockets of poverty and malnutrition inthe cities where around 85 percent of Venezuela’s population live.
Bangladesh – food insecurity in an agrarian nation
Poverty and malnutrition remain endemic in Bangladesh, anoverwhelmingly agrarian country where most rural households do not own land and few other opportunities to earn an income exist. At barely 2 000 calories per person per day, food availability falls short of meeting basic requirements. Some areas of the country still face the risk of famine.
Overall, the rate of undernourishment is very high (37 percent), as is theprevalence of underweight, stunting and wasting among children. Ratesare high throughout the rural areas that are home to 80 percent of theBangladeshi population. More than 60 percent of rural households arefunctionally landless and there is very little income diversification. Thelevel of vulnerability is aggravated by floods during the annual monsoonseason, cyclones and drought.
The state of food insecurity in the world 1999 13
% of wasting
% of stunting
Source: BARC-GIS Project, BGD/95/006, Bangladesh Agricultural Research Council/UNDP/FAO, 1999 Source: INN-SISVAN, 1996; MINFAMILIA, 1995
Most hungry and malnourishedpeople around the world are likelyto be found in vulnerable areas –locations where environmental,
economic and other factors expose them to ahigh risk of impoverishment and foodinsecurity. But the specific factors thatdetermine vulnerability vary from onelocation to another. In order to understand
these differences and adopt suitableresponses, vulnerable areas must beanalysed at national and subnational levels.With advances in technology that make itpossible to map information at the level ofstates, counties or districts, an increasingnumber of countries are undertaking thiswork. Results for four countries that haveused different criteria to determine their
vulnerable areas are shown in the maps on these pages. The maps also presentinformation about the incidence of severestunting among children under five. Thestrong association between vulnerability and child malnutrition shows up very clearly,as do the differences between countries with different levels of undernourishmentnationwide.
Incidence of malnutrition in vulnerable areas
% of population livingin poverty
30.0 - 39.940.0 - 49.950.0 - 59.9
60.0 - 70.0
% of stunting
35.8
22.4
20.3
AMAZONAS
APURE
PORTUGUESA DELTA AMACURO
SUCRE
17.5
17.5 46.5
13.5 59.9
21.3 54.4
RAJSHAHI DHAKA
CHITTAGONG
BARISAL
KHULNA
53.4 15.5 55.8
Famine freeSlightly famine-prone areaModerately famine-prone areaSeverely famine-prone area
* Based on flood-erosion hazards and economically depressed areas
Level of famine risk*

Senegal – adequate food supply, but some areas at risk
Although Senegal is one of the most urbanized countries in Africa, three-quarters of the population still depend on agriculture for their livelihoods.For the nation as a whole, undernourishment is moderately low and foodavailability is adequate to meet requirements. But medium to high levelsof underweight, stunting and wasting still prevail among childrennationwide. In some rural areas characterized by poor health conditions,declining agricultural productivity, widespread poverty and low incomediversification, one-third or more of all children under five suffer fromstunting.
The highest prevalence of stunting is found in several highly rural andremote districts of the country. Two other rural districts – Podor andMatam in the northeast – exhibit significantly lower levels of stunting,despite being high risk areas for drought and health problems. Improvedchild nutrition is explained in part by the use of irrigated perimeters tocushion against drought, as well as remittances from family membersliving outside the district. Similarly, despite a high poverty rate, semi-nomadic herders in Linguère district achieve a relatively food securesituation through use of livestock products and millet production.
Mozambique – signs of hope despite high malnutrition
Despite signs of recovery since the end of decades of war, Mozambiqueremains one of the world’s poorest countries. Its endemic poverty isreflected in very high levels of undernourishment (63 percent of thepopulation) and food availability that falls far below requirements at under1 800 calories per person per day. Proportions of children who are stuntedand underweight are also high.
Mozambique remains overwhelmingly rural and agricultural, with two-thirds of the population living in the countryside and three-quartersdepending on agriculture for their livelihoods. Measures to decreasevulnerability have focused on rural areas and have been coupled withshort-term assistance to displaced people and other vulnerable groups.
Although levels of stunting are above 30 percent in 8 of Mozambique’s 10provinces, the map reveals significant differences between the north andsouth of the country. Curiously, the northern region, where more food isavailable, shows the highest levels of stunting. At least in part, this reflectsthe lingering effects of the warfare that ravaged these regions inparticular. In the semi-arid south, where self-sufficiency in foodproduction is chronically low, coping mechanisms based on incomediversification, animal production and remittances have contributed tolower levels of stunting.
The state of food insecurity in the world 199914
46
57
39
37
39
41
30
55
% of stunting
High food availability
Moderately low food availability
Low food availability
Very low food availability
*Number of months of self-sufficiency:High: › 12 monthsModerately low: 9-12 monthsLow: 6-9 monthsVery low: ‹ 6 months
Level of self-sufficiency*
TETE
NASA
NAMPULA
ZAMBÉZIA
SOFALAMANICA
GAZA
CABO DELGADO
Incidence of malnutrition in vulnerable areas
Nutritional status and vulnerability
KEDOUGOU
KOLDA
KAFFRINE
PODOR
LINGUÈREBAMBEY MATAM
SEDIHOU
�30�30
�30
�30
�30
Vulnerability patterns – risk factors
Low health risk/low-moderate poverty risk/high incomediversification/highly urban
Low health risk/high-very high poverty risk/good copingmechanisms
Low health risk/low-moderate poverty risk/high marketrisk
High health risk/low-moderate poverty risk/good copingmechanisms
High health risk/high poverty risk/low income sourcediversification/highly rural
% of stunting
Source: WFP/VAM, 1997-98; IDSM, 1997 Source: UNICEF, 1996; WFP/VAM, 1996

The state of food insecurity in the world 1999 15
Vulnerable people – who and why
Monitoring the number ofundernourished peopleprovides a way to gauge howmuch progress has been
made and how much remains to beaccomplished. It keeps attention focused on the target. But knowing the number is not enough to guideaction. For that, more specificinformation is needed about the groups of people who are at high risk of food insecurity and the factors thatcreate this risk.
Empirical vulnerability analysis hasevolved substantially in the past decade.Much of the effort to date has focused on finding ways to identify specificgeographic areas where vulnerable
Vulnerable groups identified through the FIVIMS process
and food-insecure people are most likely to be found. The maps displayed on the previous two pages are examplesof results that can be obtained by using country-specific criteria tohighlight zones requiring specialattention.
But in the end it is the condition ofpeople that counts. To find out who isvulnerable, and why, the FIVIMSsecretariat has begun to compile adatabase on vulnerable groups, based ona thorough review of recent literature andresults from intensive, interdisciplinarybrainstorming sessions carried out byparticipating countries. A summary ofresults obtained as of mid-1999 is givenbelow and on the following page.
Victims of conflict• internally displaced people• refugees• landless returnees• landmine disabled• war invalids• war widows and orphans
Migrant workers and their families• migrant herders tending herds of others• migrant labourers seeking seasonal work• female-headed households left behind by
migrant male labourers
Marginal populations in urban areas• school dropouts• unemployed• rickshaw and motorcycle taxi drivers• recently arrived migrants• people living in slums in urban periphery• dockworkers and porters• construction workers• workers in the informal sector• homeless people• orphans• street children• people living alone on small fixed incomes or
without support (elderly, pensioners, widowsand widowers, divorcees, invalids, handicappedpeople)
• beggars
People belonging to at-risk social groups• indigenous people• ethnic minorities• illiterate households
Some or all members of low-incomehouseholds within vulnerable livelihoodsystems• subsistence or small-scale farmers• female-headed farming households• landless peasants • agricultural labourers• fishers• nomadic pastoralists• sedentary herders, small-scale livestock
producers and agro-pastoralists • forest dwellers• peri-urban small-scale agricultural
producers and market gardeners• day or contract labourers
Dependent people living alone or in low-incomehouseholds with large family size• elderly• women of childbearing age, especially
pregnant and nursing mothers• children under five years old, especially
infants• disabled and ill
Survey finds severehunger in 800 000 US households
National and subnational surveys can gather useful details about who theundernourished and vulnerable are, wherethey live, and what factors are contributing totheir condition. The United States of Americawas one of the first developed countries toconduct such a survey.
The United States Government attached aFood Security Supplement to the CurrentPopulation Survey that it carries outannually. The Supplement asked questionssuch as: "In the last 12 months did you orother adults in your household ever not eatfor a whole day because there wasn't enoughmoney for food?" The results showed that 4.2 million American households sufferedfrom some hunger for at least part of theyear. Households suffering from severehunger where children were involved oradults were more seriously affectednumbered around 800 000.
Because the survey focused on households rather than individuals, it did not yield an estimate of the number of undernourished people in the United States. But it did help identify the followingvulnerable groups:• the homeless; • poor children;• some female-headed households,
African-American and Hispanichouseholds, and those living in central city areas;
• the working poor;• some legal immigrants subject to eligibility
restrictions on assistance;• some single-person households,
e.g. able-bodied adults withoutdependants who may lose eligibility forbenefits;
• some elderly and HIV-infected individuals;
• some residents in rural areas andcommunities;
• American Indians, Alaska Natives and others who live in remote areas;
• migrant and seasonal farm workers.

The state of food insecurity in the world 1999
Profiles of vulnerability
In a country just emerging from decades of civil conflict, refugees and internally displaced people are now returning to areas theyhad been forced to abandon. Some returnees received food andother assistance. But many received no support and found theirhouses destroyed and their land occupied. They had to start fromscratch and were unable to obtain sufficient food to meet theirminimum daily needs.
The regions they returned to are characterized by slash-and-burnagriculture on small parcels of land that are increasinglyoverexploited. Land tenure is a major issue and basic services arealmost non-existent. Productivity is low and declining as the landbecomes more and more degraded. Residents and returnees alikenow belong to a highly vulnerable group.
Pensioners and invalids in Azerbaijan's capital city, Baku, dependmainly on monthly stipends for survival. The purchasing power ofalready modest pensions has been shrinking steadily because ofinflation, and payments are often delayed. Many able-bodiedpensioners have taken on low-paying work or turned to begging to supplement their pensions.
With meagre incomes and high levels of health expenditure, thisgroup is at high risk of undernourishment and malnutrition. Forinvalids with no relatives, isolation and lack of mobility maycompound the risk. In addition, many elderly people suffer from a lack of interest in food that may further increase theirvulnerability.
Pacific Island immigrants, Maori and other poor people in NewZealand's largest city, Auckland, have been identified as one of thecountry’s significant vulnerable groups. They rely mainly on the nationalwelfare system for their basic livelihood, although many supplementthis with income from the black market or other illegal sources. Manyof them live in crowded conditions, with two or more extended familiesoften occupying a single home. With little money available for food, theytend to consume unbalanced diets that are high in calories but lackingother essential nutrients. So their nutritional status is generally poor,even when the quantities of food consumed are adequate.
Migration from the islands has been spurred by degraded land,repeated flooding, lack of disaster insurance and efforts to eliminatecultivation of illegal crops. But recent changes in urban rentalsubsidies and a crackdown on the black market economy are makingconditions even more difficult for those who flee to the city.
Victims of conflict: Returnees in Guatemala
Dependent people in large, low-income households: Urban poor in Auckland, New Zealand
Marginal urban population groups: Pensioners in Baku, Azerbaijan
Nutritional status and vulnerability
16
GUATEMALA
G u l f o fH o n d u r a sMEXICO
BELIZE
HONDURAS
EL SALVADOR
P a c i f i cO c e a n
NEW ZEALAND
Auckland
T a s m a nS e a
200 km
NorthIsland
SouthIsland
P a c i f i cO c e a n
Wellington
Fiji Samoa
AZERBAIJAN
C a s p i a nS e a
ARMENIABaku
Naxcivan
RUSSIAGEORGIA
IRAN
Returnees’ place of origin

The state of food insecurity in the world 1999 17
The environment in the arid Sahel region of West Africa has alwaysbeen harsh. As populations grow, pastoral people who havetraditionally managed to eke out a living with their herds are finding it increasingly difficult to obtain an adequate supply of food. Theirvulnerability is partly the result of environmental factors, includinginsufficient or erratic rainfall, lack of water points and encroachmentof the desert, and partly of human factors, such as environmentaldegradation, declining quality of pastures and lawlessness.
The combination of population pressure and environmental constraintsleaves little to cushion people against hunger when severe drought orflooding hits or when food reserves are depleted by consecutive seasons of bad harvests. Although often seen as a sign of vulnerability,rural exodus may also represent the most important coping strategyavailable to people living in this highly stressed part of the world.
Minorities living in remote mountainous regions of Viet Nam areconsidered particularly vulnerable. They are geographicallyisolated and live in areas where productivity is limited by erosion, environmental degradation, and forest fires and othernatural disasters.
Because of their isolation, these mountain people are also cut offfrom knowledge of more advanced technologies and end upworking with very limited tools and techniques. Not surprisingly,they have difficulty producing adequate food to meet their needsand frequently must depend on government supportprogrammes. Their high birth rate is also putting increasingpressure on their limited resources and fragile environment.
Households headed by women because the men migrateseasonally in search of work constitute an important vulnerablegroup throughout much of Africa. In Benin, many northern menmigrate south during the cropping season to work as agriculturallabourers. The women who remain behind produce food aroundthe home and engage in petty trading, raise small livestock andproduce local beer. The land they farm is often degraded, and theylack the knowledge and technologies to reclaim it.
Although they act as heads of households while the men areabsent, the women generally have limited decision-makingauthority. In addition, household resources are often divertedfrom food to other uses. Priority is often given to making beerfrom sorghum and money brought back by migrant husbands isoften spent on prestige purchases. This can result in some familymembers not getting enough to eat.
Poor households in vulnerable livelihood systems: Pastoralists in Sahelian zones
Migrant workers and their families: Seasonal migrants in Benin
At-risk social groups: Isolated minorities in Viet Nam
MAURITANIA
Moderate to great risk
Acute risk of desertification
True desert
MALI NIGERCHAD
BENIN
GHANA
BURKINA FASO
TOGONIGERIA
VIET
CHINA
Hanoi
S o u t hC h i n a
S e a
THAILAND
LAOS
Haiphong
Vinh
HainanIsland
NAM
Affected area
Affected area

The state of food insecurity in the world 199918
Environmental potential and constraints
Many environmental factors – some natural, some theconsequence of humanactivities – can limit
agricultural potential and createvulnerability. Those shown on the mapinclude extremely dry or cold climates,poor soil, erratic rainfall, steep slopes andsevere land degradation. A full analysis would also need to incorporate otherhuman factors such as pollution andlandmines.
Interestingly, zones where rainfall is erratic typically have good agricultural potential. This is because the highestvariability in rainfall occurs in high rainfall areas, which are often conducive toagriculture. In fact, worldwide, many of the most fertile soils andfavourable climates are located inareas subject to environmentalextremes, such as tropical cyclones. In such areas, storms and floods canwash away a season’s harvest, alongwith the fertile topsoil, unlessprecautions are taken.
People have naturally tended toconcentrate in the areas with highproduction potential, characterized bybeneficial climate and soils. Often thisconcentration of people has led tooverexploitation of natural resources,which, combined with the inherentrainfall variability of high-potentialareas, has resulted in landdegradation. Indeed, many areaswhere land is severely degraded today,such as the East African highlands,were once highly suitable foragricultural activity.
So environmental risks exist even inareas shown on the map as havingmedium or high potential foragricultural production. In many partsof the world, most often industrializedcountries, these risks are beingsuccessfully managed throughinvestment and use of appropriatetechnologies. Where this is not thecase, people’s livelihoods may beadversely affected, leading tovulnerability and food insecurity.
Major environmental constraints and opportunities for agricultural production
Nutritional status and vulnerability
Too cold/dry
Low suitability
Unreliable rain
Slope � 30
Degraded
Medium/low rainfed potential
High rainfed potential
The existence of a constraint does not necessarily indicate lowagricultural productivity, sincetechnology can overcome manyconstraints.

The state of food insecurity in the world 1999 19

Key indicators in countries with the largest decreases in proportion of undernourished in each region, 1980-1996
Key indicators in countries with the largest increases in proportion of undernourished in each region, 1980-1996
The state of food insecurity in the world 199920
Factors that bring about change
up to the World Food Summit, considerableeffort has gone into developing effectivemethods and indicators to monitor thesefactors. Some preliminary results of thiseffort are presented in this section byfocusing on eight countries that haveregistered particularly significant changes inprevalence of undernourishment since 1980.
The data in the tables below and the casestudies on the next four pages highlight twocountries in each of the four regions in thedeveloping world – the country where theprevalence of hunger has been reducedmost rapidly and the one that has sufferedthe worst setbacks. Graphs accompanyingeach country profile compare the averagedaily food supply in 1980 with that in 1996and show how much of what people ate eachyear came from domestic production, tradeand drawdowns from food stocks.
The tables below present several other
indicators that provide insight into theconditions and trends that affect foodsecurity in each of the eight countries.Annual population growth rates and thedegree of urbanization show demographictrends. Amount of degraded land indicatesthe environmental condition of an importantproductive resource, while cropped area andgrowth in yields show what people have donewith this resource. The food production indexand the growth in GDP indicate how theeconomy has performed and give a firstindication of the ease or difficulty that peopleare likely to face in obtaining access to thefood they need. Within a country, access tomarkets is strongly affected by access topaved roads. Share of the main food group inthe diet is an indicator of dietary diversity andnutritional well-being, while access to safewater and the rate of illiteracy suggest theextent to which basic needs are being met.
Analysis of progress in reducinghunger rarely reveals startlingchanges from one year to the next.Occasionally a major shock of
nature or history – such as a cyclone,economic slump or war – may trigger a foodsecurity crisis (see pages 25-27). But theimpact of such events tends to be transitory,reflected in a sharp spike in the numbersthat does not alter the long-term trajectory.Reaching the World Food Summit targetwill require successful efforts to change thelong-term trends and to understand themany factors that determine them.
Conditions vary considerably from oneplace to another and so do the combinationsof factors that leave particular populationgroups vulnerable to poverty and hunger.Usually many different demographic,environmental, economic, social andpolitical elements are involved. In the follow-
CAMBODIA HONDURAS MOROCCO GHANAPopulation growth, 1980-1996 (% per annum) 3 3.1 1.9 3.3Urban population, 1996 (%) 21 44 53 36Cropped area, 1980 / 1996 (% of total area) 11.4 / 21.0 15.7 / 18.2 17.7 / 21.5 15.2 / 19.1Severely degraded land, 1990/92 (% of total area) 49.8 89.1 61.1 8.5Cereal yields, change per hectare, 1980-1997 (% per annum) 2.4 0.8 0.6 4.3Principal staple food yields, change per hectare, 1980-1997 (%) (rice) 64 (maize) 25 (wheat) 25 (cassava) 39Food production index 1980 (1989/91 average = 100) 58 90.5 59.4 74.3Food production index 1996 (1989/91 average = 100) 128.7 115.8 114 149.8GDP increase, 1980-1996 (% per annum) 5.99 2.67 3.91 2.27Major food group as % of diet, 1995/97 78 48 62 48Paved roads, 1994/96 (% of total) 7.5 20.3 50.7 24.5Access to safe water, 1990/96 (% of population) 13 87 52 65Illiteracy rate, 1996 (% of population) ... 30 56 36
KOREA, DPR CUBA AFGHANISTAN BURUNDIPopulation growth, 1980-1996 (% per annum) 1.6 0.8 1.7 2.7Urban population, 1996 (%) 62 76 20 8Cropped area, 1980 / 1996 (% of total area) 15.8 / 16.6 30.0 / 40.1 12.3 / 12.4 42.4 / 39.5Severely degraded land, 1990/92 (% of total area) 17.2 48.3 12.5 80.1Cereal yields, change per hectare, 1980-1997 (% per annum) -2.2 -2.6 0 1.5Principal staple food yields, change per hectare, 1980-1997 (%) (maize) -56 (rice) -19 (wheat) 4 (cassava) -7Food production index 1980 (1989/91 average = 100) 68.7 84.9 127.3 79.3Food production index 1996 (1989/91 average = 100) 59.1 61.7 109.3 98.4GDP increase, 1980-1996 (% per annum) ... ... ... 1.63Major food group as % of diet, 1995/97 62 38 81 30Paved roads, 1994/96 (% of total) 6.4 53.6 13.3 7.1Access to safe water, 1990/96 (% of population) 13 95 15 52Illiteracy rate, 1996 (% of population) 63 4 69 58
Dynamics of change

The state of food insecurity in the world 1999 21
Economic growth spurs improvements in food securitystatus for most Asian nations
1996, led the way. Many other countries inthe region also showed strong reductions,including China, India, Indonesia,Myanmar, Nepal, Pakistan and Viet Nam.
Undernourishment increased in onlytwo countries – Mongolia and the
Democratic People’s Republic of Korea. Inthe latter, it rose from 16 to 48 percent.The financial crisis may have bluntedprogress in some countries (see page 27)but the overall trend remains positive.
Aperiod of rapid economic growthhas resulted in major gains in foodsecurity across most of Asia andthe Pacific. Cambodia, where the
proportion of undernourished droppedfrom 62 to 33 percent between 1980 and
Share of consumption derived from:
DES* per person
21%
Rice yields
64%
Cropped area
69%
production
trade
stocks
2 000
1980
1996
1 5001 0005000DES per person
(calories)
* dietary energy supply
Cambodia – reaping the dividends of peace
More land is being farmed, more food is being produced and manyfewer people are going hungry in Cambodia, as the countryrebounds from decades of conflict. Between 1980 and 1996,farmers almost doubled the area on which they were growingcrops. Yields of rice, Cambodia’s main staple food, shot up by64 percent. Pork, beef and poultry production expanded rapidly.Because of the gains in food production, Cambodians are eatingsubstantially better, even though the population has continued togrow rapidly and food imports have declined.
Despite this recent progress, however, Cambodia remains a verypoor country, and many of its people still suffer from foodinsecurity. Even after a 21 percent jump since 1980, Cambodians’average food intake in 1996 is scarcely enough to meet theminimum daily requirement. More than one-third of all householdsfall below the poverty line. The country’s poverty is reflected in thelack of diversity in people’s diets. Almost 80 percent of the averagedaily calorie intake comes from rice.
Decades of war and civil strife left traditional irrigation systems inruins. Many fields had been abandoned to landmines. The peacesettlement in 1979 opened the door for recovery; an economicreform programme introduced in 1992 brought inflation undercontrol. Farmers responded by increasing the area cultivated,expanding rice production and diversifying into crops and animalproducts for export.
Programmes to remove landmines and rehabilitate irrigationsystems are continuing. A programme has also been put in placeto reduce poverty by creating jobs for vulnerable groups.
Key indicators, 1980-1996
DPR Korea – a bitter harvest
The Democratic People’s Republic of Korea has been hit hardduring the 1990s by floods, drought and the collapse of its specialtrading relationships with China and the former USSR. Theimpact has been devastating both to food production and to thenutritional status of the population. Total cereal productionplummeted to less than half its 1980 level, while the proportion ofundernourished people soared to almost half the population.
Rapid economic deterioration left the country without either thecash or creditworthiness to finance needed food imports. Massivefood aid was provided, but logistical problems made it difficult toreach all people in need. The crisis strained the national PublicDistribution System to the breaking point. The System sells fixedrations of rice and maize to city residents and to people who workon state-run farms and enterprises in the countryside. As cropsfailed and imports dwindled, reserve stocks held by the Systemproved far from sufficient to fill the gap. Rations were cutdrastically and many people reduced consumption significantly.
The country’s collapse came on the heels of a period of rapideconomic growth. With limited arable land and a short growingseason, gains in food production had been achieved through high-input agriculture. When the country was suddenly cut off fromaccess to spare parts, fertilizers, pesticides and pumped water,yields started to fall sharply. Then, starting in 1995, two years ofheavy storms and flooding, followed by a severe drought,devastated large tracts of agricultural land.
The country is now trying to revive agricultural production byintroducing improved seed varieties and double-cropping methods,rehabilitating irrigation systems, and improving soil fertility.
Key indicators, 1980-1996
1 000
Share of consumption derived from:
DES per person Maize yields Cropped area
5%
production
trade
stocks
2 500
1980
1996
2 0001 5005000DES per person
(calories)
21% 56%

The state of food insecurity in the world 199922
Mixed picture of progress and setback characterizesLatin America and the Caribbean
Both the levels and the trends of undernourishment varyconsiderably in Latin America and the Caribbean. In most South
American countries, levels are already lowor rapidly declining. In Central America,
on the other hand, levels are increasing inseveral countries, although Honduras did register the strongest gains in theregion by bringing its prevalence ofundernourishment down from 31 percent to 21 percent. In the Caribbean, Cuba’s
setback, with the share undernourishedrising from 3 to 19 percent, was in manyways typical of several of its islandneighbours, which have experiencedincreases in undernourishment since 1980.
1 000
Share of consumption derived from:
DES per person Maize yields Cropped area
14%
production
trade
stocks
2 500
1980
1996
2 0001 5005000DES per person
(calories)
25%11%
2 0001 000
Share of consumption derived from:
DES per person Rice yields Cropped area
33%
production
trade
stocks
3 000
1980
1996
2 5001 5005000DES per person
(calories)
19% 19%
Honduras – economic growth helps reduce hunger
Steady economic growth, coupled with an effective aid programmefor its poorest citizens, has helped Honduras reduce by almostone-third the proportion of its population suffering fromundernourishment. Increases in food production, imports andstock drawdowns all contributed to putting more food on Hondurantables. Maize production nearly doubled between 1980 and 1996.Much of the increase was consumed not by people but as feed forthe booming cattle industry. Maize consumption by people actuallydeclined slightly. Vegetable oils and sugar accounted for most ofthe increase in food intake, with consumption of meat and beansalso increasing somewhat.
Since Honduras adopted a far-reaching structural adjustmentprogramme in 1988, the country’s economy has been growing at anannual rate of 2.7 percent. The increased prosperity has helpedbring safe water to 87 percent of the population and raise theliteracy rate to 70 percent. Direct aid to the poor is providedthrough the Honduran Social Investment Fund, which has reachedmany of the most deprived. A ration programme supplies couponsto help schoolchildren, mothers and elderly people buy food andother necessities.
Despite its recent gains, Honduras faces difficult challenges.Economic growth has not eliminated wide disparities in wealth andincome. Poverty and food insecurity remain relatively widespread.About half of the Honduran population is rural. And in thecountryside, nearly 40 percent live in extreme poverty, with manyworking as agricultural labourers on large estates. Commercialagriculture offers good possibilities for growth, but the challengeof achieving a more equitable distribution of the benefits remains.
Key indicators, 1980-1996
Cuba – loss of trading partner erodes food security
Cuba has seen its economy shrink and levels of undernourishmentrise since losing its most important trading partner with thebreak-up of the former USSR. With much of its agriculture gearedto producing commodities for export (primarily sugar andtobacco), Cuba had succeeded in reducing undernourishment tovery low levels while relying on trade for more than half of its food.
With the end of Cuba’s special trading relationship with the USSR,daily food intake dropped by more than 500 calories per person,mainly because of a steep decline in food imports. Yields formajor food crops also dropped because of a lack of importedfertilizer, but Cuba managed to produce nearly comparablequantities by growing food on more land.
The economic decline has increased the number of people relyingon subsidies while reducing productivity and food intake for manyworkers and their families. Continued restrictions on trade withthe United States of America add to the country’s economicdifficulties.
Despite its recent problems, Cuba remains relatively prosperousand well-fed compared to other countries in the Caribbean andCentral America. More than half the country’s roads are pavedand 95 percent of the population have access to safe water.
Since 1993, the Cuban Government has given priority toincreasing food production and restructuring industry. Signs havebegun to emerge that the new economic model is taking hold andlabour markets are recovering. But the transition process is farfrom complete.
Key indicators, 1980-1996
Dynamics of change

The state of food insecurity in the world 1999 23
War-ravaged Afghanistan loses ground while Moroccoleads good performers
undernourishment affects less than 5 percent of the population. Morocco’sdecline, from 10 to 5 percent, representedthe best progress among this group of good performers. Significant increasesoccurred only in Afghanistan, where
the proportion of people who areundernourished shot up from 33 percent in 1980 to 62 percent in 1996, and in Iraq,where the share rose from 4 to 15 percentover the same period.
Afghanistan – war leaves little ground for crops
Food production and food security have both fallen victim todecades of warfare in Afghanistan. Production of cereals fellslightly while returning refugees helped swell the population by25 percent between 1980 and 1996. As a result, average daily foodintake fell from 2 186 calories to 1 710 calories, significantlybelow minimum requirements. Two-thirds of the country’sprovinces are now food-deficit areas; but the war-torn economycannot generate imports to fill the gap.
Afghanistan’s problems are unusual in a region where levels ofundernourishment are generally low. But they are typical of manywar-torn countries facing complex humanitarian emergencies.More than 40 percent of the country’s arable land is riddled withlandmines and cannot be farmed. Thousands of people who usedto make their living from farming have migrated to towns andcities, joining the ranks of a new, impoverished urban underclass. Only 15 percent of the population have access to safe water and some 70 percent are illiterate. Intermittent fighting and restrictionson movement continue to disrupt efforts to rebuild the country.
One in every 50 Afghans has been a landmine casualty. Every day,mine blasts kill or maim another 10 people, a third of themwomen and children. Many who have been disabled by warinjuries or mines are no longer able to work. Their dependentstatus puts additional pressures on other family members whomust feed and care for them.
Large volumes of food aid remain far from sufficient to satisfy theminimum needs of such a large number of undernourished. Untilpeace is restored, there can be little hope of any lasting solutions.
Key indicators, 1980-1996
Most countries in the Near East and North Africa havealready achieved very low levels of undernourishment.
Indeed the region accounts for 10 of the 14 developing countries where
3 0002 0001 000
Share of consumption derived from:
DES per person Wheat yields Cropped area
21%
production
trade
stocks
3 500
1980
1996
2 5001 5005000DES per person
(calories)
25%17%
1 000
Share of consumption derived from:
DES per person Wheat yields Cropped area
1%
production
trade
stocks
2 500
1980
1996
2 0001 5005000DES per person
(calories)
22%4%
Morocco – thriving economy boosts food security
With substantial mineral wealth and an established position as acentre for trade and commerce, Morocco has enjoyed steadyeconomic growth that has reduced undernourishment to very lowlevels. Between 1980 and 1996 daily food intake increased from 2 723 to 3 186 calories, reaching levels comparable with someindustrialized countries. The gains came almost equally fromincreases in food production and in trade. Production of cerealsand potatoes more than doubled, spurred by substantial increasesin both crop yields and the area under cultivation. Much of theincreased production was used for feed, while imports grew tomeet rising demand for food.
With the economy growing at almost 4 percent per year, Moroccohas become increasingly urban. Improvements in transportation,sanitation and education have been particularly marked in thecities.
However, almost half the population remains in rural areas, where poverty and vulnerability persist, particularly amongtraditional small-scale farmers and herders. Barely half thepopulation has access to safe water and 56 percent remainilliterate. Environmental problems also loom. Water foragriculture and grazing lands is scarce and 61 percent of the land is severely degraded.
To eradicate remaining pockets of hunger, action will need to betaken to introduce more sustainable agricultural practices and togenerate jobs and income in urban areas.
Key indicators, 1980-1996
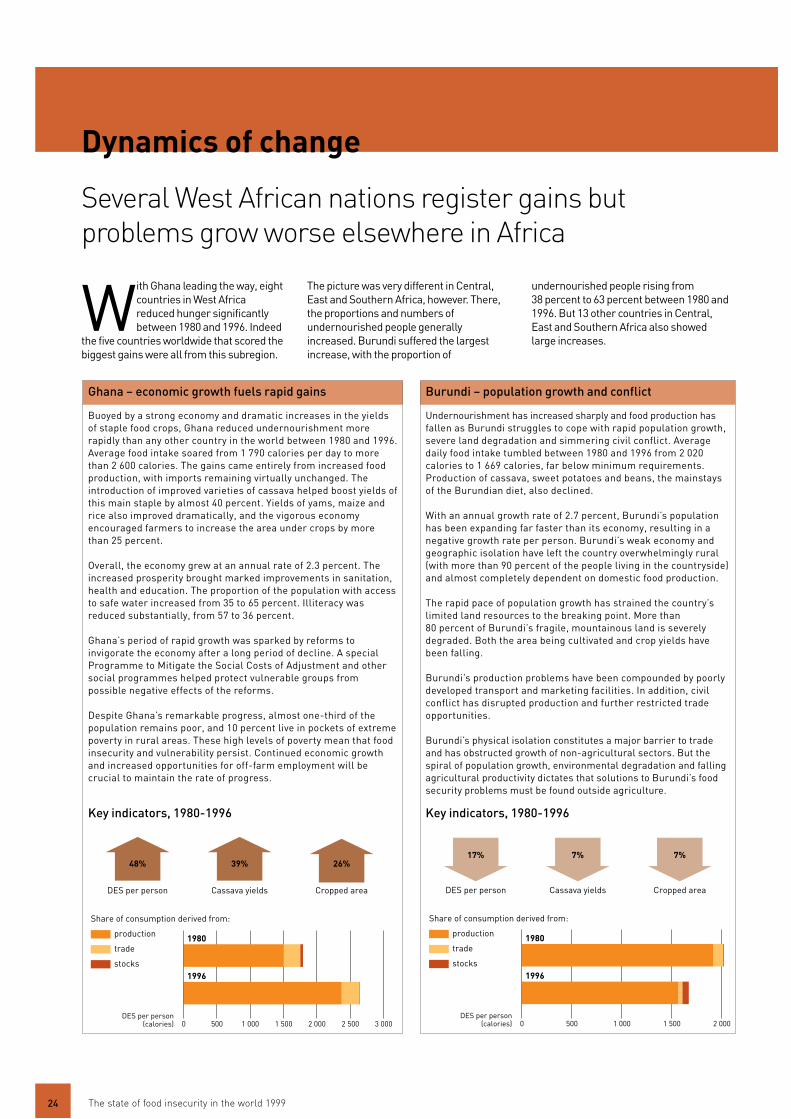
The state of food insecurity in the world 199924
Several West African nations register gains butproblems grow worse elsewhere in Africa
With Ghana leading the way, eightcountries in West Africareduced hunger significantlybetween 1980 and 1996. Indeed
the five countries worldwide that scored thebiggest gains were all from this subregion.
The picture was very different in Central,East and Southern Africa, however. There,the proportions and numbers ofundernourished people generallyincreased. Burundi suffered the largestincrease, with the proportion of
undernourished people rising from 38 percent to 63 percent between 1980 and1996. But 13 other countries in Central, East and Southern Africa also showed large increases.
2 0001 000
Share of consumption derived from:
DES per person Cassava yields Cropped area
26%
production
trade
stocks
3 000
1980
1996
2 5001 5005000DES per person
(calories)
39%48%
1 5001 000
Share of consumption derived from:
DES per person Cassava yields Cropped area
production
trade
stocks
2 000
1980
1996
5000DES per person
(calories)
17% 7% 7%
Burundi – population growth and conflict
Undernourishment has increased sharply and food production hasfallen as Burundi struggles to cope with rapid population growth,severe land degradation and simmering civil conflict. Averagedaily food intake tumbled between 1980 and 1996 from 2 020calories to 1 669 calories, far below minimum requirements.Production of cassava, sweet potatoes and beans, the mainstaysof the Burundian diet, also declined.
With an annual growth rate of 2.7 percent, Burundi’s populationhas been expanding far faster than its economy, resulting in anegative growth rate per person. Burundi’s weak economy andgeographic isolation have left the country overwhelmingly rural(with more than 90 percent of the people living in the countryside)and almost completely dependent on domestic food production.
The rapid pace of population growth has strained the country’slimited land resources to the breaking point. More than80 percent of Burundi’s fragile, mountainous land is severelydegraded. Both the area being cultivated and crop yields havebeen falling.
Burundi’s production problems have been compounded by poorlydeveloped transport and marketing facilities. In addition, civilconflict has disrupted production and further restricted tradeopportunities.
Burundi’s physical isolation constitutes a major barrier to tradeand has obstructed growth of non-agricultural sectors. But thespiral of population growth, environmental degradation and fallingagricultural productivity dictates that solutions to Burundi’s foodsecurity problems must be found outside agriculture.
Key indicators, 1980-1996
Ghana – economic growth fuels rapid gains
Buoyed by a strong economy and dramatic increases in the yieldsof staple food crops, Ghana reduced undernourishment morerapidly than any other country in the world between 1980 and 1996.Average food intake soared from 1 790 calories per day to morethan 2 600 calories. The gains came entirely from increased foodproduction, with imports remaining virtually unchanged. Theintroduction of improved varieties of cassava helped boost yields ofthis main staple by almost 40 percent. Yields of yams, maize andrice also improved dramatically, and the vigorous economyencouraged farmers to increase the area under crops by morethan 25 percent.
Overall, the economy grew at an annual rate of 2.3 percent. Theincreased prosperity brought marked improvements in sanitation,health and education. The proportion of the population with accessto safe water increased from 35 to 65 percent. Illiteracy wasreduced substantially, from 57 to 36 percent.
Ghana’s period of rapid growth was sparked by reforms toinvigorate the economy after a long period of decline. A specialProgramme to Mitigate the Social Costs of Adjustment and othersocial programmes helped protect vulnerable groups frompossible negative effects of the reforms.
Despite Ghana’s remarkable progress, almost one-third of thepopulation remains poor, and 10 percent live in pockets of extremepoverty in rural areas. These high levels of poverty mean that foodinsecurity and vulnerability persist. Continued economic growthand increased opportunities for off-farm employment will becrucial to maintain the rate of progress.
Key indicators, 1980-1996
Dynamics of change

The state of food insecurity in the world 1999
Recent shocks: floods, drought, war and financialcollapse threaten progress
The most recent global estimatesfor the number of hungry peoplein the world are based on datathrough the end of 1997. Since
then, a series of environmental,economic and political shocks havedisrupted agricultural production,driven millions of people from theirhomes and fields and swelled the ranksof the poor in places as farflung asHonduras, Indonesia and Kosovo.
FLOODS AND DROUGHT TAKE TOLL ONLIVES AND CROPSIn 1998, weather patterns associatedwith El Niño parched crops in someregions, drowned them in others, and hammered Central America with the devastating winds and rain ofHurricane Mitch.
More than 9 000 people died andnearly 3 million were left homelesswhen Mitch cut across Central America between 26 October and 1 November. Floodwaters andmudslides swept away buildings androads. Fields of maize, beans andsorghum were laid waste. Hondurasand Nicaragua were hardest hit, withHonduras losing more than half itsstaple maize crop. Losses in coffee andother export crops added up to anestimated US$ 480 million. The regionfaced both an immediate humanitarian
crisis and a long-term threat to foodsecurity.
The international response was swift and effective. The UN Office forthe Coordination of HumanitarianAffairs (OCHA) sought US$ 150 millionfor relief and rehabilitation. The WorldFood Programme (WFP) respondedimmediately with food aid. FAOorganized the distribution of seeds,fertilizers and hand tools to helpfarmers in the hardest-hit ruralcommunities feed their families as soon as possible.
Work has now begun on rebuildingthe agricultural sector. Improvedfarming practices are being introducedthat will reduce environmentaldegradation and vulnerability to futuredisasters. Hurricane Mitch could nothave been avoided. But manmadefactors greatly increased its destructiveimpact. The most deadly mudslidesswept down slopes denuded bydeforestation and cultivation of marginal lands. Flooding wasaggravated by poor watershedmanagement. The most affectedcountries are attempting to addressstructural problems that contributed to the disaster by examining landtenure practices, supportingreforestation projects and providingtraining in watershed management.
International financial institutionshave made commitments to provideup to US$ 5 300 million over the nextfour years. While more deeply rootedeconomic problems are likely topersist, the recovery programmeshould prevent increases in foodinsecurity and vulnerabilitythroughout the region.
Even as hope takes root in CentralAmerica, however, severe flooding in several countries of East andSoutheast Asia and a witheringdrought in the Near East havethreatened to set back recentprogress toward the World FoodSummit goals.
For the Near East region as awhole, production of cereals in 1999is expected to fall 16 percent belowthe previous harvest. But the lossesfrom the worst drought in decadeswill be far greater in Iran, Iraq,Jordan and Syria.
Several thousand farmers, small-scale herders and landless ruralhouseholds who have lost theirmeans of livelihood will requireassistance to tide them over untilnext year. As in Central America,however, there is currently noevidence to suggest that thesesetbacks will be more than transitoryin either Asia or the Near East.
HONDURAS
GUATEMALAEL SALVADOR
NICARAGUA
COSTA RICA PANAMACOLOMBIA
BELIZEMEXICO
BAHAMAS
CUBA
HAITI
JAMAICA
Cayman Is.
Swan Is.
Isla de Providencia
Islasdel Maíz
CayosMiskitos
Isla deSan Andrés
Isla de laJuventud
Path ofHurricane
Mitch
500 km
C a r i b b e a n S e a
P a c i f i c O c e a n
G u l f o f M e x i c oHONDURASDead: 5 657Percentage of population affected: 24Damage as % of GDP: 80
NICARAGUADead: 3 045Percentage of population affected: 20Damage as % of GDP: 49
GUATEMALADead: 268Percentage of population affected: 6Damage as % of GDP: 4
EL SALVADORDead: 240Percentage of population affected: 6Damage as % of GDP: 2
Countries hardest hit by Hurricane Mitch
25
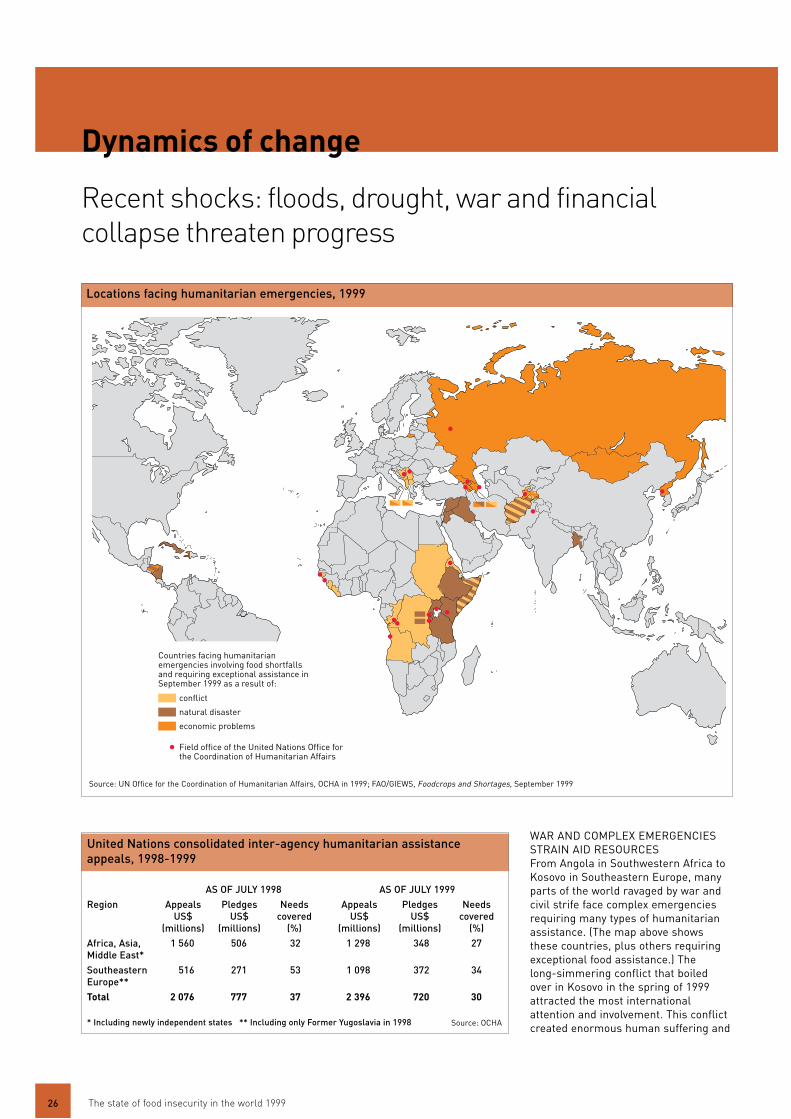
The state of food insecurity in the world 1999
Recent shocks: floods, drought, war and financialcollapse threaten progress
WAR AND COMPLEX EMERGENCIESSTRAIN AID RESOURCESFrom Angola in Southwestern Africa toKosovo in Southeastern Europe, manyparts of the world ravaged by war andcivil strife face complex emergenciesrequiring many types of humanitarianassistance. (The map above showsthese countries, plus others requiringexceptional food assistance.) The long-simmering conflict that boiled over in Kosovo in the spring of 1999attracted the most internationalattention and involvement. This conflictcreated enormous human suffering and
United Nations consolidated inter-agency humanitarian assistanceappeals, 1998-1999
AS OF JULY 1998 AS OF JULY 1999Region Appeals Pledges Needs Appeals Pledges Needs
US$ US$ covered US$ US$ covered (millions) (millions) (%) (millions) (millions) (%)
Africa, Asia, 1 560 506 32 1 298 348 27Middle East*Southeastern 516 271 53 1 098 372 34Europe**Total 2 076 777 37 2 396 720 30
* Including newly independent states ** Including only Former Yugoslavia in 1998
Dynamics of change
26
Locations facing humanitarian emergencies, 1999
conflict
natural disaster
economic problems
Countries facing humanitarianemergencies involving food shortfallsand requiring exceptional assistance inSeptember 1999 as a result of:
Field office of the United Nations Office forthe Coordination of Humanitarian Affairs
Source: UN Office for the Coordination of Humanitarian Affairs, OCHA in 1999; FAO/GIEWS, Foodcrops and Shortages, September 1999
Source: OCHA

The state of food insecurity in the world 1999
laid waste much of the province’sproductive infrastructure. But theoutpouring of humanitarian aid hasbeen more than sufficient to stave offhunger for at least a year. Whetherlevels of undernourishment willincrease after the aid is withdrawn willdepend on the success of rehabilitationand recovery programmes currentlybeing designed and put into operation.
The situation in Angola is much moretroubling. There, renewed fighting hasdriven nearly 2 million people fromtheir homes. Many have fled from thecountryside into besieged cities andtowns where they must depend onairlifts of food aid for survival. As ofmid-year, food distributions were ableto meet only 60 percent of the needsand FAO experts warned of acatastrophe, with the threat of massstarvation among displaced people.
Not counting Southeastern Europe, 14 countries and one sub-region faced complex humanitarianemergencies in 1999. The totalrequested under OCHA appeals for suchemergencies increased by 20 percentover 1998. But the total amount ofhumanitarian aid pledged as of July1999 has declined slightly and a farhigher percentage is going toSoutheastern Europe. Inevitably, thatmeans less is available to meetessential human needs elsewhere.Afghanistan, Angola, Guinea-Bissau,Sierra Leone, Somalia, Sudan andUganda are all countries wheresubstantially lower percentages of totalneeds have been covered this year thanin 1998. In these countries, the spreadof undernourishment is inevitable.
FINANCIAL CRISIS UNDERMINESASIAN PROGRESSWhen several Asian banking systemscollapsed in 1997 there were fears thatpoverty and food insecurity would soarin Indonesia, Malaysia, the Philippines,the Republic of Korea and Thailand andthat their “tiger economies” would takeyears to recover. These countries hadachieved impressive economic successand succeeded in reducing povertysubstantially over two decades. When
financial systems collapsed throughoutthe region, many of these gains werereversed. Businesses closed and largenumbers of office and shop workerslost their jobs.
The shock waves proved lessdestructive than first feared, however.By the beginning of 1998, after dramatic falls in their exchange ratesand purchasing power, most of theaffected countries started to showsigns of at least partial recovery.Although poverty and hungerundoubtedly increased somewhatthroughout the region, for mostcountries the crisis was short-lived.
Indonesia has been the exception. In just one year, the fourth mostpopulous country in the world saw itscurrency fall to one-fifth its previousvalue. The inflation rate soared to50 percent and food prices rocketed. Atthe same time, the worst drought in50 years was followed by excessiverains during the dry season. Badweather and reduced use of importedfertilizers and pesticides caused aslump in local rice production. Importsincreased, but not enough to make upthe shortfall.
Job losses and inflation hit urbanresidents particularly hard. Ahousehold survey conducted by theWorld Bank and the Ford Foundationfound that urban households spent34 percent less per person in 1998than they had in 1997. In ruralhouseholds, expenditures declined byonly 13 percent. In many cases,families that had been poor before thecrisis actually benefited from increasedbusiness in the informal sector. But thenewly unemployed had to sell offassets and deplete their savings inorder to cope. As the crisis deepened,many hard-hit families turned torelatives in the countryside for help,particularly in Java. This increased thepressure on those who still had jobsand assets, but now had to feed agrowing number of dependants.
The impact of the economic collapseon nutritional status showed upquickly. Most households continued toconsume normal quantities of rice, but
cut back on more expensive foods,such as meat, fish and eggs. Reducedconsumption of foods rich in proteinand micronutrients led to sharpincreases in the numbers of wastedchildren and anaemic mothers.
Current estimates suggest that theproportion of Indonesians who areundernourished almost certainlydoubled from 6 percent of thepopulation in 1995/97 to 12 percent in1999. And the current figure could beas high as 18 percent. This means thatthe economic crisis has added 10 to20 million people to the ranks of theundernourished in Indonesia alone.
Recovery has begun. But it will take time for Indonesia to create the conditions needed to bringundernourishment back to the levelsof before the crisis and continue onthe path of progress towards theSummit target. The task has been complicated by events in East Timor, where tens of thousandsof people were driven from theirhomes following the referendum onindependence. Humanitarianassistance was mobilized, but if theconflict exacerbates political andeconomic instability in Indonesia,there is a grave risk that the foodsecurity situation could get worsebefore it gets better.
Changes in household spending inIndonesia, 1997-1998
27
Urbanresidents
’000
of r
eal r
upia
hs p
er p
erso
n pe
r m
onth
350
Ruralresidents
Allresidents
50
100
150
200
250
300
0
1997 1998
Source: World Bank Social Monitoring and Early ResponseUnit, Jakarta, Report on Social Impact of the Crisis inIndonesia (S Sumarto, A Wetterberg, L Pritchett), 1999

The state of food insecurity in the world 199928
It is clear that there is no singleprescription for combating hunger.Policies and strategies mustaddress both the causes and
effects of food insecurity in order tobuild an appropriate framework forconcrete action. In societies at peace,poverty and marginalization are theroot causes of hunger. Where there is no peace, physical destruction andthe displacement of people areadditional causes.
Action is needed most urgently incountries where chronic foodinsecurity is most prevalent or isincreasing. These are very poorcountries whose populations arepredominantly rural and largelydependent on agriculture for a living.They require economic and technicalinnovations to improve theiragricultural productivity as well asspecific policies to ensure that food is more affordable for the entirepopulation.
However, these measures alonewill not suffice. In a world where 4 400 million people live in developingcountries and one-third survive onless than US$ 1 a day, other basichuman needs must be fulfilled.Concerted efforts are required toensure that everyone has access tohealth and education services, safedrinking water, basic sanitationfacilities and adequate housing.
At the other end of the spectrum, incountries where the percentage ofhungry people is already low, thechallenge is to find effective ways to
benefit the most destitute. These peopleare usually marginal participants in themainstream market economy. They canonly be reached by carefully targetedpoverty alleviation programmes,supported by the judicious use of socialsafety nets.
In all cases, it is imperative thatefforts concentrate on improving the health and nutrition of children.Investments in children are known to produce the highest returns over time in both economic andhumanitarian terms. It is often thechildren in food-insecure householdswho suffer the most from hunger. Therecent improvement seen in Asia isencouraging, but we should also beaware of the deterioration in manyAfrican countries where undernutritionof children is increasing.
While the main focus of action mustbe chronically hungry and vulnerablepeople, immediate humanitarianassistance is needed for those whosefood security and basic livelihood havebeen affected by unexpected shocksfrom social, economic or naturaldisasters, to prevent them from fallinginto chronic food insecurity.
Until now, individual countries havedealt with these challenges in differentways and some have had more successthan others. Now it is important tofocus on practical country experiences,to analyse the reasons for the successof some and the failure of others, and todraw lessons from these cases.
As this report emphasizes, many ofour estimates, while based on the best
available data, are still too imprecise to ensure successful actionprogrammes. In order to better targetpolicies and resources towards thehungry and the most vulnerablemembers of society, countries andlocal organizations are encouraged touse the inter-agency Food Insecurityand Vulnerability Information andMapping Systems (FIVIMS) to improvetheir own systems for collecting andanalysing food security information.
One of the purposes of this, the firstedition of The State of Food Insecurityin the World, is to encourage greateruse of tools such as FIVIMS. Thisreport is also meant to focus theattention of the world’s leaders andopinion makers on the problem ofundernourishment around the worldand to spur development of innovativeapproaches to tackle it.
We have the tools to achieve the World Food Summit target ofhalving the number of undernourishedglobally by 2015. The next step istranslating the goal into concreteobjectives at the local, national andregional levels where people and theirleaders can take action.
In the spirit of the Summit's call forthe elimination of food insecurityaround the world, it is not enough tomeet the numerical target simply as aresult of rapid progress in a few verylarge countries. This would be unfair tothose living in many other countries.They also have the right to be free fromthe diminished lives and prematuredeath that come from food insecurity.
The way ahead
Meeting the challenge

The state of food insecurity in the world 1999 29
Region, subregion, Total UNDERNOURISHED IN TOTAL POPULATION
country population Number Proportion Proportion Proportionof people population population population
1996 1995/97 1979/81 1990/92 1995/97(millions) (millions) (%) (%) (%)
DEVELOPING WORLD 4 428.2 791.5 29 20 18
ASIA AND PACIFIC 3 047.8 525.5 32 21 17
EASTASIA 1 309.2 176.8 29 17 14 China (3) 1 238.8 164.4 30 17 13
Korea, DPR (5) 22.6 10.8 19 16 48 Korea, Rep (1) 45.3 0.4 1 1 1
Mongolia (5) 2.5 1.2 27 34 48
OCEANIA 4.4 1.1 31 27 24Papua New Guinea (4) 4.4 1.1 31 27 24
SOUTHEAST ASIA 483.6 63.7 27 17 13 Cambodia (4) 10.2 3.4 62 41 33 Indonesia (3) 200.4 11.5 26 10 6
Laos (4) 4.9 1.6 32 31 33Malaysia (1) 20.5 0.4 4 3 2Myanmar (3) 43.4 2.8 19 9 7
Philippines (4) 69.9 15.6 27 21 22
Thailand (4) 59.2 14.3 28 27 24
Viet Nam (3) 75.1 14.1 33 28 19
SOUTH ASIA 1 250.6 283.9 38 26 23Bangladesh (5) 120.6 44.0 42 34 37
India (4) 950.0 204.4 38 26 22
Nepal (4) 21.8 4.6 46 21 21Pakistan (3) 140.1 26.3 31 20 19
Sri Lanka (4) 18.1 4.6 22 29 25
LATIN AMERICA ANDCARIBBEAN 481.3 53.4 13 13 11
NORTH AMERICA 92.7 5.1 5 5 6Mexico (3) 92.7 5.1 5 5 6
CARIBBEAN 30.5 9.3 19 25 31Cuba (3) 11.0 2.1 3 3 19Dominican Rep (4) 8.0 2.1 25 28 26Haiti (5) 7.7 4.7 47 63 61Jamaica (3) 2.5 0.3 8 12 11Trinidad & Tobago (3) 1.3 0.1 5 12 11
CENTRAL AMERICA 32.8 5.6 20 17 17Costa Rica (3) 3.7 0.2 8 6 7El Salvador (3) 5.8 0.6 17 12 10Guatemala (3) 10.2 1.7 17 14 17Honduras (4) 5.8 1.2 31 23 21Nicaragua (4) 4.6 1.4 26 29 31
Panama (3) 2.7 0.5 22 18 17
SOUTH AMERICA 325.3 33.3 14 14 10Argentina (1) 35.2 0.5 1 2 1Bolivia (4) 7.6 1.8 26 25 23Brazil (3) 161.5 16.2 15 13 10
Chile (3) 14.4 0.7 7 8 5Colombia (3) 39.3 4.9 22 17 12Ecuador (3) 11.7 0.6 12 8 5Guyana (3) 0.8 0.1 13 24 16Paraguay (3) 5.0 0.6 13 18 13Peru (3) 23.9 4.6 28 40 19Suriname (3) 0.4 0.0 17 11 9Uruguay (2) 3.2 0.1 3 7 4Venezuela (3) 22.3 3.3 4 11 15
NEAR EAST AND NORTH AFRICA 360.2 32.9 9 8 9
NEAR EAST 227.4 27.5 10 10 12Afghanistan (5) 20.3 12.7 33 57 62Iran (3) 63.5 3.7 9 6 6
Iraq (3) 20.6 3.2 4 9 15Jordan (2) 4.4 0.1 6 4 3Kuwait (2) 1.7 0.1 4 27 3Lebanon (1) 3.1 0.1 8 2 2Saudi Arabia (2) 18.9 0.7 3 3 4Syrian Arab Rep (1) 14.6 0.2 3 2 1Turkey (1) 62.3 1.0 2 2 2
United Arab Emirates (1) 2.3 0.0 1 2 1Yemen (5) 15.7 5.7 40 37 37
NORTH AFRICA 132.8 5.4 8 4 4Algeria (3) 28.7 1.5 9 5 5Egypt (2) 63.5 2.5 8 4 4
Libyan Arab Jamahiriya (1) 5.1 0.0 0 1 1Morocco (3) 26.4 1.4 10 5 5Tunisia (1) 9.1 0.1 2 1 1
SUB-SAHARAN AFRICA 539.3 179.6 37 35 33
CENTRAL AFRICA 74.3 35.6 36 37 48Cameroon (4) 13.6 4.3 20 30 32Cent Afr Rep (5) 3.4 1.4 22 45 42Chad (5) 6.9 3.1 69 58 46Congo, Dem Rep (5) 46.7 25.8 37 36 55
Congo, Rep (4) 2.6 0.9 29 32 34Gabon (3) 1.1 0.1 13 11 8
Table 1: PREVALENCE OF UNDERNOURISHMENT in developing countries
NOTES: GENERAL
Figure in brackets ( ) denotes prevalence category, i.e. proportion of the populationundernourished in 1995/97Category (1) <2.5% undernourished
(2) 2.5 - 4% undernourished(3) 5 - 19% undernourished(4) 20 - 34% undernourished(5) ³ 35% undernourished
Countries in boldare those with a population of 40 million people or more
NOTE: TABLE 1
NA Separated figures for Eritrea and Ethiopia are not available prior to 1995/97
SOURCES: TABLE1
Total population UN World Population Prospects, 1998 RevisionUndernourished in total population FAO estimates
Region, subregion, Total UNDERNOURISHED IN TOTAL POPULATION
country population Number Proportion Proportion Proportionof people population population population
1996 1995/97 1979/81 1990/92 1995/97(millions) (millions) (%) (%) (%)
Tables

EAST AFRICA 185.7 77.9 35 45 42Burundi (5) 6.3 4.0 38 44 63Eritrea (5) 3.3 2.2 NA NA 67Ethiopia (5) 56.8 28.7 NA NA 51
Kenya (5) 27.8 11.4 25 47 41Rwanda (5) 5.6 2.1 24 40 37Somalia (5) 8.5 6.2 55 70 73Sudan (4) 27.2 5.5 24 31 20Tanzania, United Rep (5) 30.7 12.3 23 30 40Uganda (4) 19.5 5.5 31 23 28
SOUTHERN AFRICA 79.8 35.0 32 45 44Angola (5) 11.3 4.9 29 50 43Botswana (4) 1.5 0.4 28 19 25Lesotho (4) 2.0 0.6 26 31 28Madagascar (5) 14.2 5.6 18 34 39Malawi (5) 9.9 3.7 26 45 37Mauritius (3) 1.1 0.1 10 6 6Mozambique (5) 17.9 11.3 54 66 63Namibia (4) 1.6 0.5 25 26 30
Swaziland (3) 0.9 0.1 14 9 14Zambia (5) 8.4 3.7 30 39 45Zimbabwe (5) 11.0 4.3 30 40 39
WEST AFRICA 199.5 31.1 40 21 16Benin (3) 5.5 0.8 36 21 15Burkina Faso (4) 10.7 3.2 64 32 30Côte d'Ivoire (3) 13.8 2.0 7 14 15Gambia (4) 1.2 0.3 57 17 25Ghana (3) 18.2 2.0 61 29 11Guinea (4) 7.3 2.3 30 37 31Liberia (5) 2.2 0.9 22 49 42Mali (4) 10.2 2.9 59 30 29Mauritania (3) 2.4 0.3 35 15 13Niger (5) 9.5 3.6 32 41 39Nigeria (3) 101.4 8.3 40 13 8
Senegal (3) 8.6 1.5 19 19 17Sierra Leone (5) 4.3 1.8 40 44 43Togo (4) 4.2 1.0 31 29 23
The state of food insecurity in the world 199930
Region, subregion, FOOD AVAILABILITY AND DIET COMPOSITION HEALTH AND SANITATION NUTRITIONAL STATUS OF CHILDREN UNDER FIVE
country Dietary Share of main Main cereal Access Life Under 5 Underweight Stunted Wastedenergy supply food group or starchy root to adequate expectancy mortality
(DES) per person in total DES (a) consumed (b) sanitation at birth rate1995/97 1995/97 1995/97 1990/97 1995 1995 around 1995 (d) around 1995 (d) around 1995 (d)
(calories per day ) (%) (%) (years) (per '000) (%) (%) (%)
ASIA AND PACIFIC
EAST ASIA
China (3) 2 840 59 rice 24 69 47 17 34 5
Korea, DPR (5) 1 980 62 maize/rice … 72 30 … … …Korea, Rep (1) 3 160 50 rice 100 72 9 … … …
Mongolia (5) 1 920 48 wheat 86 65 74 12 26 2
OCEANIA … … … 30 43 6Papua New Guinea (4) 2 230 31 rice/wheat 83 (c) 57 (c) 95 (c) 30 43 6
SOUTHEAST ASIA
Cambodia (4) 2 050 78 rice 19 53 174 52 56 13Indonesia (3) 2 900 64 rice 59 64 75 34 42 13
Laos (4) 2 060 78 rice 18 52 134 40 47 11Malaysia (1) 2 940 41 rice 94 71 13 20 … …Myanmar (3) 2 850 78 rice 43 59 150 31 45 8
Philippines (4) 2 360 49 rice 75 67 53 30 33 8
Table 2: FOOD AVAILABILITY, HEALTH CONDITIONS AND NUTRITIONAL STATUS in developing countries
Region, subregion, Total UNDERNOURISHED IN TOTAL POPULATION
country population Number Proportion Proportion Proportionof people population population population
1996 1995/97 1979/81 1990/92 1995/97(millions) (millions) (%) (%) (%)
Region, subregion, Total UNDERNOURISHED IN TOTAL POPULATION
country population Number Proportion Proportion Proportionof people population population population
1996 1995/97 1979/81 1990/92 1995/97(millions) (millions) (%) (%) (%)
NOTES: TABLE 2
(a) Main food group is usually cereals or starchy roots and only exceptionally a different one.Figures refer to the contribution of the entire cereal, starchy root or other food group.High value indicates low diet diversification and vice versa
(b) Most important cereal(s) or starchy root(s) in total dietary energy supply in 1995/97(c) Period other than the one specified in the column heading (d) Refers to results of national surveys conducted from 1987 to 1998
… Data unavailable
SOURCES: TABLE 2
Food availability and diet composition FAO estimates Health and sanitation UNICEF, The State of the World's Children, 1997 and 1999 Nutritional status of childrenunder five Results of surveys compiled by WHO (GlobalDatabase on Child Growth and Malnutrition) and FAO (NutriDat)
Table 1, cont.: PREVALENCE OF UNDERNOURISHMENT in developing countries
Tables

The state of food insecurity in the world 1999 31
Thailand (4) 2 350 48 rice 96 69 32 25 22 5
Viet Nam (3) 2 470 73 rice 21 66 45 40 36 10
SOUTH ASIA
Bangladesh (5) 2 080 81 rice 43 57 115 56 55 18
India (4) 2 470 64 rice 29 62 115 53 52 18
Nepal (4) 2 320 77 rice 16 55 114 47 49 11Pakistan (3) 2 460 55 wheat 56 63 137 40 50 9
Sri Lanka (4) 2 290 55 rice 63 73 19 33 20 13
LATIN AMERICA AND CARIBBEAN
NORTHAMERICA
Mexico (3) 3 110 46 maize 72 71 32 14 23 6
CARIBBEAN
Cuba (3) 2 420 38 wheat/rice 66 76 10 … … 1Dominican Rep (4) 2 280 30 rice 78 70 44 6 11 1Haiti (5) 1 840 45 rice/maize 25 58 124 28 32 8Jamaica (3) 2 600 30 rice/wheat 89 74 13 10 10 4Trinidad & Tobago (3) 2 710 36 wheat 79 72 18 7 5 4
CENTRALAMERICA
Costa Rica (3) 2 690 33 rice/wheat 84 77 16 5 6 2El Salvador (3) 2 550 56 maize 90 67 40 11 23 1Guatemala (3) 2 340 59 maize 83 66 67 27 50 3Honduras (4) 2 370 48 maize 74 69 38 25 39 1Nicaragua (4) 2 180 54 maize/rice 35 68 60 12 25 2Panama (3) 2 420 38 rice 83 73 20 7 9 1
SOUTH AMERICA
Argentina (1) 3 110 31 wheat 68 73 27 2 5 1Bolivia (4) 2 200 41 wheat/maize 58 60 105 8 27 1Brazil (3) 2 930 31 rice/wheat 70 67 60 6 11 2
Chile (3) 2 770 39 wheat … 74 15 1 2 0Colombia (3) 2 590 33 maize/rice 85 70 36 8 15 1Ecuador (3) 2 660 35 rice 76 69 40 17 (c) 34 (c) 2 (c)Guyana (3) 2 490 49 rice 88 … … 18 … …Paraguay (3) 2 570 28 maize/cassava 41 71 34 4 14 0Peru (3) 2 360 39 rice/wheat 72 67 55 8 26 1Suriname (3) 2 670 48 rice … … … … … …Uruguay (2) 2 800 31 wheat … 73 21 4 10 1Venezuela (3) 2 390 37 maize/wheat 58 72 24 5 15 3
NEAR EAST AND NORTH AFRICA
NEAR EAST
Afghanistan (5) 1 730 81 wheat 8 45 257 49 48 16Iran (3) 2 830 54 wheat 81 69 40 16 19 7
Iraq (3) 2 370 55 wheat 75 67 71 12 22 3Jordan (2) 2 910 50 wheat 77 69 25 6 16 3Kuwait (2) 3 060 37 wheat … 75 14 2 3 1Lebanon (1) 3 270 35 wheat 63 69 40 3 12 3Saudi Arabia (2) 2 800 49 wheat 86 (c) 71 34 … … …Syrian Arab Rep (1) 3 330 55 wheat 67 68 36 13 21 9Turkey (1) 3 520 49 wheat 80 68 50 10 21 3
United Arab Emirates (1) 3 360 34 rice/wheat 92 74 19 … … …Yemen (5) 2 032 68 wheat 24 51 110 30 44 13
Table 2, cont.: FOOD AVAILABILITY, HEALTH CONDITIONS AND NUTRITIONAL STATUS in developing countries
Region, subregion, FOOD AVAILABILITY AND DIET COMPOSITION HEALTH AND SANITATION NUTRITIONAL STATUS OF CHILDREN UNDER FIVE
country Dietary Share of main Main cereal Access Life Under 5 Underweight Stunted Wastedenergy supply food group or starchy root to adequate expectancy mortality
(DES) per person in total DES (a) consumed (b) sanitation at birth rate1995/97 1995/97 1995/97 1990/97 1995 1995 around 1995 (d) around 1995 (d) around 1995 (d)
(calories per day ) (%) (%) (years) (per '000) (%) (%) (%)

The state of food insecurity in the world 199932
NORTH AFRICA
Algeria (3) 2 953 60 wheat 91 68 61 13 18 9Egypt (2) 3 276 66 wheat 88 65 51 12 25 6
Libyan Arab Jamahiriya (1) 3 259 47 wheat 98 64 63 5 15 3Morocco (3) 3 141 62 wheat 58 65 75 10 24 2Tunisia (1) 3 258 54 wheat 80 69 37 9 23 4
SUB-SAHARAN AFRICA
CENTRAL AFRICA
Cameroon (4) 2 140 37 maize/cassava 50 57 106 15 26 3Cent Afr Rep (5) 1 980 35 cassava 27 50 165 23 28 6Chad (5) 1 960 53 sorghum 21 49 152 39 40 14Congo, Dem Rep (5) 1 820 57 cassava 69 51 108 24 28 6
Congo, Rep (4) 2 130 42 cassava 18 52 185 34 45 10Gabon (3) 2 530 30 rice/wheat … 55 148 … … …
EAST AFRICA
Burundi (5) 1 690 30 cassava/sweet 51 51 176 38 47 6potatoes/maize
Eritrea (5) 1 630 72 wheat 13 52 195 44 38 16Ethiopia (5) 1 820 65 maize 19 49 195 48 64 8
Kenya (5) 1 980 52 maize 77 55 90 23 34 8Rwanda (5) 2 050 28 sweet potatoes … 47 139 26 56 4Somalia (5) 1 570 34 sorghum … 48 211 … … …Sudan (4) 2 380 57 sorghum 51 54 115 34 34 13Tanzania, United Rep (5) 2 000 49 maize 86 52 160 31 43 7Uganda (4) 2 170 28 sweet potatoes/ 57 44 185 26 38 5
maizeSOUTHERN AFRICA
Angola (5) 1 900 35 cassava 40 48 292 … … …Botswana (4) 2 230 49 maize/ 55 66 52 … … …
sorghum/wheatLesotho (4) 2 240 75 maize 38 62 154 16 33 2Madagascar (5) 2 020 53 rice 40 58 164 40 48 7Malawi (5) 2 070 68 maize 3 45 219 30 48 7Mauritius (3) 2 920 44 wheat/rice 100 71 23 15 10 14Mozambique (5) 1 780 41 cassava 54 47 275 26 36 8Namibia (4) 2 140 49 maize/millet 62 60 78 26 29 9Swaziland (3) 2 480 51 maize 59 … … 10 (c) 30 (c) 1 (c)Zambia (5) 1 960 66 maize 71 48 203 24 42 4Zimbabwe (5) 2 100 62 maize 52 52 74 16 21 6
WEST AFRICA
Benin (3) 2 470 37 cassava/maize 27 48 142 29 25 14Burkina Faso (4) 2 180 75 sorghum 37 47 164 33 33 13Côte d'Ivoire (3) 2 570 39 rice 39 50 150 24 24 8Gambia (4) 2 300 54 rice 37 46 110 15 14 6Ghana (3) 2 620 48 cassava 55 57 130 27 26 11Guinea (4) 2 250 45 rice 31 46 219 … … …Liberia (5) 2 040 42 wheat/rice 30 56 216 … 33 9Mali (4) 2 210 74 millet/sorghum 6 47 210 40 30 23Mauritania (3) 2 620 54 wheat/rice 32 53 195 23 44 7Niger (5) 2 050 69 millet 17 48 320 50 41 21Nigeria (3) 2 750 44 sorghum/ 41 51 191 39 39 21
maize/ millet
Senegal (3) 2 400 55 rice 39 50 110 22 23 7Sierra Leone (5) 2 050 52 rice 11 40 284 28 35 8Togo (4) 2 340 44 maize/cassava 41 56 128 25 22 12
Region, subregion, FOOD AVAILABILITY AND DIET COMPOSITION HEALTH AND SANITATION NUTRITIONAL STATUS OF CHILDREN UNDER FIVE
country Dietary Share of main Main cereal Access Life Under 5 Underweight Stunted Wastedenergy supply food group or starchy root to adequate expectancy mortality
(DES) per person in total DES (a) consumed (b) sanitation at birth rate1995/97 1995/97 1995/97 1990/97 1995 1995 around 1995 (d) around 1995 (d) around 1995 (d)
(calories per day ) (%) (%) (years) (per '000) (%) (%) (%)
Table 2, cont.: FOOD AVAILABILITY, HEALTH CONDITIONS AND NUTRITIONAL STATUS in developing countries
Tables

This first edition of The State of FoodInsecurity in the World was prepared by FAOto provide information about the number ofhungry people in the world, who they are,where they live, why they find themselves inthis condition and what can be done toimprove their lives. Its aim is to focusattention on both progress and challenges inthe ongoing effort to reduce the number ofundernourished.
A collaborative effort between the Economicand Social Department (ES) and theInformation Division of the General Affairs andInformation Department (GI), the publicationwas prepared by an interdepartmental TaskForce comprised of the Global Information andEarly Warning Service (ESCG), the NutritionPlanning, Assessment and Evaluation Service(ESNA), the Statistical Analysis Service (ESSA)
and the Environment and Natural ResourcesService of the Sustainable DevelopmentDepartment (SDRN), with the participation ofthe FIVIMS secretariat.
Overall leadership was provided by Hartwig de Haen, Assistant Director-General, ES, and technical leadership by Barbara Huddleston, Chief, Food Security andAgricultural Projects Analysis Service (ESAF).
Substantive technical contributions wereprovided by Ergin Ataman, GeographicalInformation System Manager and ReneGommes, Senior Officer, SDRN; Jean-PierreCotier, Chief, Barbara Burlingame, SeniorOfficer and Simon Chevassus, NutritionOfficer, ESNA; Loganaden Naiken, Chief andJorge Mernies, Senior Officer, ESSA; andDavid Wilcock, FIVIMS Coordinator.
Conceptual and editorial guidance wasprovided by Shalini Dewan, Chief of thePublishing and Multimedia Service andAndrew Marx, Chief of the Multimedia Groupof the Information Division, GI. Languageediting services were provided by the EditorialGroup, GI.
Gillian Bunting and Fulvia Petrassi (SDRN),Josilien Edouard and Jenny Riches (ESAF),Cinzia Cerri and Francesco Vizioli de Meo(ESSA) and Rafaella Siano (ESNA) gaveinvaluable assistance at various stages of thework.
FAO extends special thanks to the team atBanson, London, for design, layout andproduction.
Published in 1999 by the Food and Agriculture Organization of the United NationsViale delle Terme di Caracalla, 00100 Rome, Italy
The designations employed and the presentation of material in thispublication do not imply the expression of any opinion whatsoeveron the part of the Food and Agriculture Organization of the UnitedNations concerning the legal status of any country, territory, city orarea or its authorities, or concerning the delimitation of its frontiersor boundaries. The designations “developed” and “developing” areintended for statistical convenience and do not necessarily expressa judgement about the stage reached by a particular country,territory or area in the development process.
All rights reserved. No part of this publication may be reproduced,stored in a retrieval system, or transmitted in any form or by anymeans, electronic, mechanical, photocopying or otherwise, withoutthe prior permission of the copyright owner. Applications for suchpermission, with a statement of the purpose and extent of thereproduction, should be addressed to the Director, InformationDivision, Food and Agriculture Organization of the United Nations,Viale delle Terme di Caracalla, 00100 Rome, Italy.
© FAO 1999
ISBN 92-5-104328-0
Printed in the UK
PhotographsAs cover, from left to right: Banson; Paiboon Pattanasitubol/UNEP/Topham; Peter Beard/The Time is Always Now.
Acknowledgements

The state of food insecurity in the world In the developing world, 790 million people do not have enough to eat, according to the most recent estimates (1995/97). Thatrepresents a decline of 40 million compared to 1990/92.
At the World Food Summit in 1996, world leaders pledged toreduce the number of hungry people to around 400 million by2015. At the current rate of progress, a reduction of 8 millionundernourished people a year, there is no hope of meeting that goal.
According to The State of Food Insecurity in the World 1999, thecurrent reduction does not indicate uniform progress throughoutthe world. Indeed the data reveal that, in the first half of thisdecade, just 37 countries achieved a reduction in the number ofundernourished, totalling 100 million people. Across the rest ofthe developing world, the number of hungry people actuallyincreased by almost 60 million.
This first edition of The State of Food Insecurity in the Worldalso points out that hunger is not limited to the developing nations. It presents the first assessment of the number ofundernourished people in the developed world, finding 8 million in the industrialized countries and 26 million in the countries in transition.
There is no single prescription for action to combat hunger. Whatis needed, says the report, is to translate the goal into concreteobjectives at local, national and regional levels where people andtheir leaders can take action that will guarantee the birthright ofeveryone on this planet – enough to eat.