food insecurity & chronic disease: connecting hunger …€¦ · food insecurity & chronic...
TRANSCRIPT

Food Insecurity & Chronic Disease: Connecting Hunger &
Health
Hilary Seligman MD MAS
Associate Professor
Division of General Internal Medicine
University of California San Francisco

Objectives
• Diabetes 101
– What is diabetes and how is it managed?
• Linkages between diabetes and food insecurity
• Community-based diabetes care

What is Diabetes?
• Every cell in your body needs energy (in the form of sugar) to survive
• Your body has a finely tuned system (insulin) for moving surgar from your intestines into your cells
• Insulin rapidly goes up and down depending on how much sugar is in your blood – Keeps your blood sugar in a precisely controlled
range

How It Works Normally
You eat sugar (or glucose)
Your intestines absorb the sugar into your blood (blood glucose ↑)
Insulin acts as a key that allows the sugar to move from the blood into
the cells (blood glucose ↓)
The cells use the sugar for energy

How It Works Normally
You eat sugar (or glucose)
Your intestines absorb the sugar into your blood (blood glucose ↑)
Insulin SHOULD act as a key to move the sugar into your cells
Type 1: There is no insulin Type 2: Your body starts needing more and more insulin to do the same job, and your
pancreas can’t keep up
The sugar stays in your blood and doesn’t get into the cells where it is needed (blood
glucose does not ↓ like it should)
In Diabetes

Our Conversation Focuses on Type 2 Diabetes
• Most common type of diabetes, especially in adults – 29.1 million Americans (9.3% of US population)
has diabetes
– 95% of adults with diabetes have type 2 diabetes
• Rates have been rapidly rising and have now reached epidemic proportions
• Obesity is a major risk factor
• It is increasingly a disease of the poor

Diabetes is Increasingly a Disease of the Poor

Diabetes is Increasingly a Disease of the Poor
0
4
8
12
16
<HS degree HS graduate Attendedcollege/technical
school
College grad
Dia
bet
es
Pre
vale
nce
, %
Ever told have diabetes (excluding pregnancy)
BRFSS Data, 2010

Diabetes is Increasingly a Disease of the Poor
0
4
8
12
16
Dia
bet
es
Pre
vale
nce
, %
Annual Household Income
Ever told have diabetes (excluding pregnancy)
BRFSS Data, 2010

ALL=entire US population; NHW=non-Hispanic White; NHB=non-Hispanic Black; H=Hispanic; API=Asian/Pacific Islander; AIAN=American Indian/Alaska Native

Why Do We Care about Diabetes?
• Symptoms: very thirsty, very hungry, pee too much, blurred vision, fatigue, increased risk of infection – Or you may feel like exactly the same as you always do – Some people unaware they have diabetes
• Over time, high blood sugar poisons your: – Heart attacks, strokes, peripheral arterial disease
• Heart attack is most common cause of death
– Nerves (ulcers and amputations) – Eyes (blindness) – Kidneys (kidney failure & dialysis)

Factors Driving Blood Sugar Up and Down
Food (carbohydrates: sugars & starches)
Diabetes medicine (pills or insulin injections) Physical Activity
Hyperglycemia Hypoglycemia

Food Insecurity & Diabetes (US Low-Income Population, NHANES 1999-2004)
7.4%
10.2%
0
2
4
6
8
10
12
Food secure Food insecure
Seligman, Jl Nutr, 2010. p=0.03 after adjusting for age, gender, race/ethnicity; p=0.09 after adjusting for above + education + income as continuous variable + income as ordinal variable

Coping Strategies to Avoid Hunger
• Eating low-cost foods
– Fewer F&V
– More fats/carbs
• Eating highly filling foods
• Small variety of foods
• Avoiding food waste
• Binging when food is available
• Higher risk of obesity & diabetes
• Once you have obesity or diabetes, poorer ability to manage it effectively

Obesity and Diabetes
Bandwidth
Eating Behaviors
Nutrition
Food Insecurity
Food Affordability Episodic
Food Availability
Stress

Food Insecurity & Diabetes
Adapted from Seligman & Schillinger
Food Insecurity
-Affordability of healthy foods
-Episodic food availability
-Stress
Poor Diabetes Control
Increased Diabetes Complications
Increased Health Care Utilization &
Expenses
Worsening of Competing Demands

Obesity-Hunger Paradox
• Food affordability
• Episodic food availability
• Bandwidth
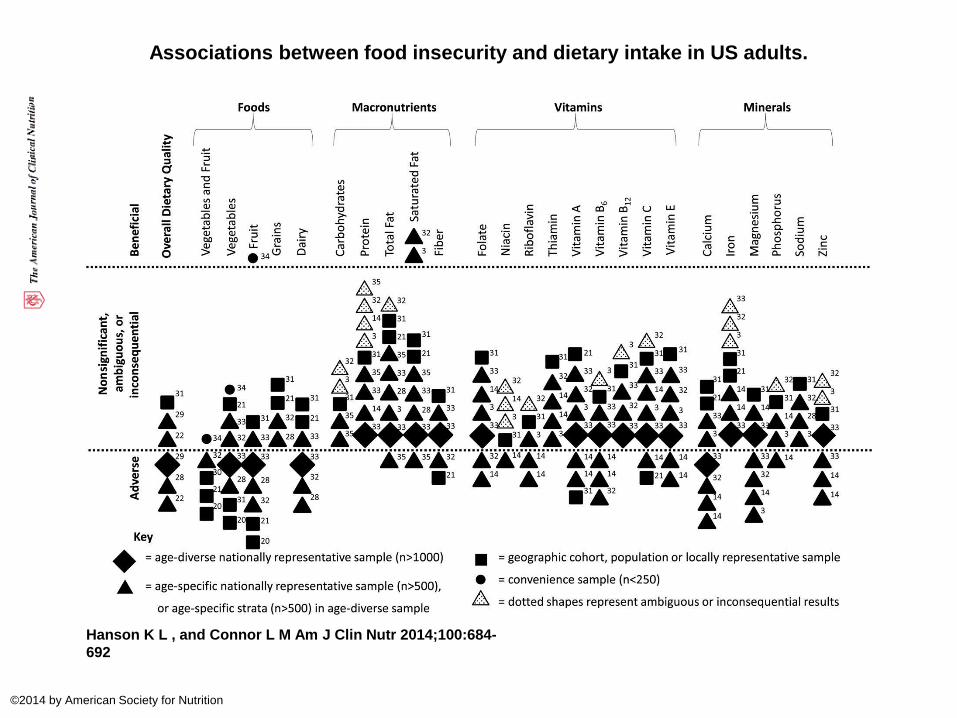
Associations between food insecurity and dietary intake in US adults.
Hanson K L , and Connor L M Am J Clin Nutr 2014;100:684-
692
©2014 by American Society for Nutrition

Bhattacharya, 2004; Kendall, 1996; Olson, 1999; Tarasuk, 2001; Tarasuk, 1999; Dixon, 2001; Lee, 2001
Weight Gain/ Obesity
Increased consumption of calorically-dense foods (refined grains, added sugars/fats)
X
Reduced intake of fruits & vegetables X
Food Costs, Dietary Intake, & Weight Gain

Diabetes and Dietary Intake
Food Insecure Food Secure
Fruit, Daily Servings 0.8 1.1
Vegetables, Daily Servings 1.8 2.1
Difficulty Following a Diabetic Diet 64% 49%
Seligman, Diabetes Care 2012; Lyles, Diabetes Care 2013

Obesity-Hunger Paradox
• Food affordability
• Episodic food availability
• Stress

Disordered Eating Practices
• Binge eating
• Hoarding
• Food obsessions
• Extreme avoidance of food waste
• Strong preferences for highly filling foods

Cycles of Food Adequacy and Shortage
Seligman HK, Schillinger D. N Engl J Med 2010;363:6-9.
High Blood Sugar Low Blood Sugar

Low Blood Sugar & Food Access
• Pre-recession: Patients with diabetes in an urban, safety net hospital – 1/3 of those who reported low blood sugar attributed it to
the inability to afford food
• Post-recession: Primary care patients with diabetes
at community health centers (38% food insecure) • Blood sugar ever gotten too low because you couldn’t
afford food (33% FI vs 5% FS) • Ever been to the Emergency Room because your blood
sugar was too low (28% FI vs 5% FS)
Nelson, JAMA, 1998; Seligman, JHCPU, 2010.

Food Insecurity and Low Blood Sugar
0
5
10
15
20
1-3 4-6 7-11 12+
%
Number of Severe Low Blood Sugar Episodes
Secure
Insecure
Of the 711 participants, 197 (28%) reported at least one significant episode of low blood sugar in the previous year.
90% higher odds of repeated (4+) episodes of low blood sugar if you are food insecure (adjusted)
*Adjusted model includes age, race/ethnicity, tobacco use, English proficiency, income, educational attainment, body weight, insulin, renal disease, adherence to medication and blood glucose testing, comorbid conditions, and alcohol abuse.
Seligman, Arch Int Med, 2011.

Food Insecurity is the Strongest Risk Factor for Severe Low Blood Sugar Noted in Safety Net Clinics
Odds Ratio (Adjusted)
Food Insecurity 3.0 (1.5-5.9)
Alcohol abuse 2.2 (1.1-4.5)
Comorbid illnesses 1.5 (1.1-2.0)
Obesity 0.3 (0.1-0.7)
Not significant: renal disease, insulin use, hypoglycemia knowledge, English proficiency, age, race/ethnicity, education, income, tobacco use, glucose monitoring, and medication adherence
Seligman, Arch Int Med, 2011.

Admissions Attributable To Low Blood Sugar Among Patients Ages 19 And Older To
Accredited California Hospitals On Each Day Of The Month, By Income Level, 2000–08.
Seligman H K et al. Health Aff 2014;33:116-123
©2014 by Project HOPE - The People-to-People Health Foundation, Inc.
27% increase in low blood sugar admissions during 4th week of month (compared to 1st week of month) for low-income group only, p<0.01

Cycles of Food Adequacy and Inadequacy
Seligman HK, Schillinger D. N Engl J Med 2010;363:6-9.
Hyperglycemia Hypoglycemia

Food Insecure Adults with Diabetes Have Higher Average Blood Sugars
0
5
10
15
20
25
30
35
40
<=7.0 7.1-8.0 8.1-9.0 9.1-10.0 10.1-11.0 >11
%
HbA1c
Food secure (n=354)
Food insecure (n=296)
Seligman, Diabetes Care, 2012.

Food Insecure Adults with Diabetes Have Higher Average Blood Sugars
Food Secure
Food Insecure
HbA1c >7%
(NHANES, known diabetics <200% FPL) 49% 70%
Mean HbA1c (ICHC, n=711) 8.1% 8.5%
Mean HbA1c (MFFH, n=621) 8.0% 8.4%
Seligman, Jl Nutrition, 2010; Seligman, Diabetes Care, 2012; Lyles, Diabetes
Care, 2013.

Obesity-Hunger Paradox
• Food affordability
• Episodic food availability
• Bandwidth

Hunger Takes Up a Lot of Brain Space
• Less space left over for:
– Registering/re-registering for benefits
– Applying for/maintaining employment
– Parenting children
– Taking care of health needs

Diabetes Adds Additional Stress to the Experience of Food Insecurity
“A diabetic is supposed to eat three meals a day and something before going to bed but sometimes I don’t have the three meals and that makes me worry.”
“The end of the month, I start getting out of food…but I have to eat something, ‘cause if I don’t eat behind my [insulin] shot, that shot will make you so sick. I just eat anything I can find during that time just to keep me from getting sick.”
Hamelin, 2002; Wolfe, 1998; Wolfe, 2003;

Patient-Related Factors Related to Higher Blood Sugar
Food Insecure (n=325)
Food Secure (n=386)
Confidence in ability to manage their diabetes, mean score 7.1 7.7
Emotional distress related to diabetes, mean score 3.9 3.0
Seligman, Diabetes Care, 2012.

Increased Health Care Utilization
• Food insecure adults with diabetes
– more physician encounters
– more frequently in the ED
– admitted more frequently to the hospital
Seligman, JHCPU, 2010
Biros; Kushel; Nelson;

Food Insecurity
-Affordability of Healthy Foods -Episodic food
availability -Stress
Poor Diabetes Control
Increased Diabetes
Complications
Increased Health Care Utilization &
Expenses
Worsening of Competing Demands
Food Insecurity & Diabetes
Adapted from Seligman & Schillinger.
Traditional intervention (clinic)
Novel access point (clinic or community)

Community-Based Diabetes Programs
• ***Key Point: Clinics have had a challenging time engaging many people with diabetes, especially the most vulnerable
– Food pantries offer another point of engagement: friendly, familiar, neighborhood oriented, and already associated with food

Components of a Community-Based Diabetes Program
1. Access to diabetes appropriate foods
- Fruits and vegetables, whole grains, and lean protein
2. Screening for diabetes and/or monitoring diabetes control
- Reaching clients who the clinics have a challenging time reaching
3. Diabetes education
4. Coordinating/partnering with primary care clinics
What is NOT on this list: PROVIDING DIABETES CARE
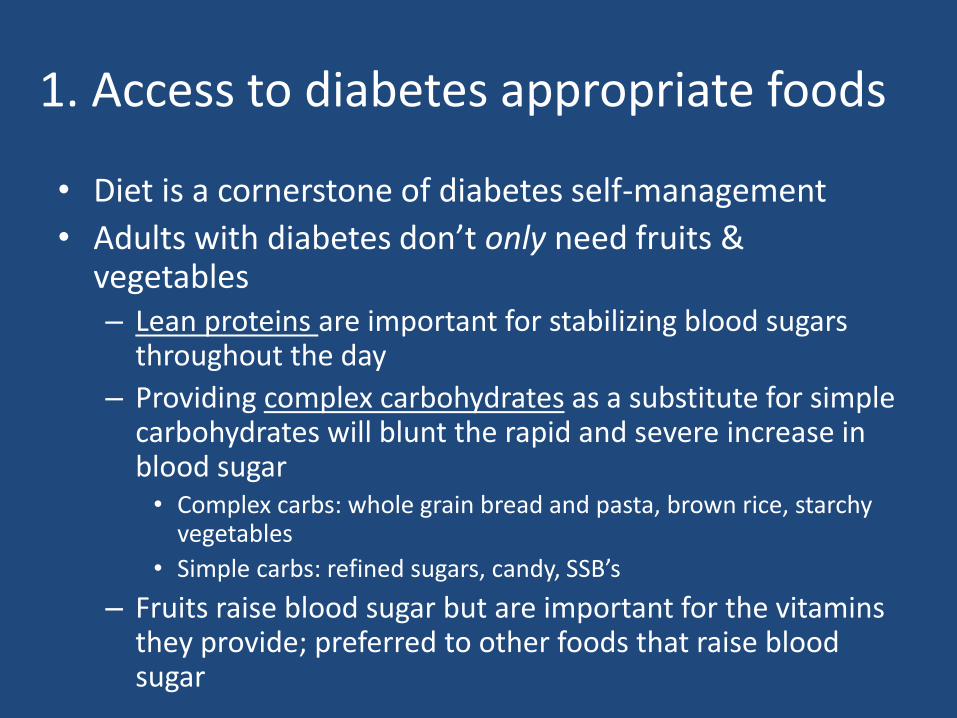
1. Access to diabetes appropriate foods
• Diet is a cornerstone of diabetes self-management
• Adults with diabetes don’t only need fruits & vegetables – Lean proteins are important for stabilizing blood sugars
throughout the day
– Providing complex carbohydrates as a substitute for simple carbohydrates will blunt the rapid and severe increase in blood sugar
• Complex carbs: whole grain bread and pasta, brown rice, starchy vegetables
• Simple carbs: refined sugars, candy, SSB’s
– Fruits raise blood sugar but are important for the vitamins they provide; preferred to other foods that raise blood sugar
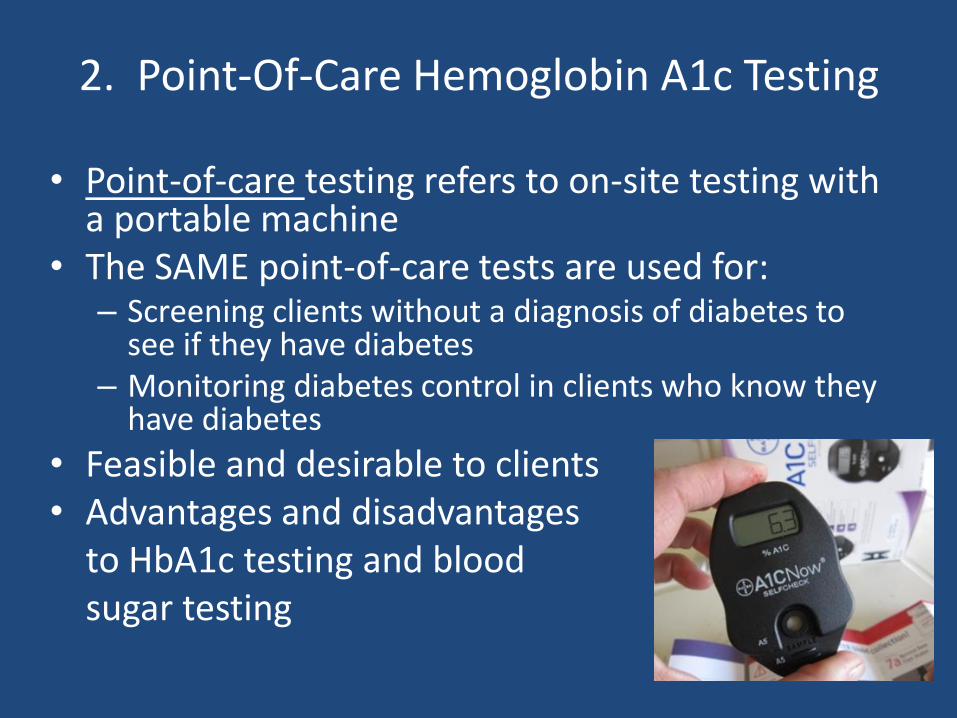
2. Point-Of-Care Hemoglobin A1c Testing
• Point-of-care testing refers to on-site testing with a portable machine
• The SAME point-of-care tests are used for: – Screening clients without a diagnosis of diabetes to
see if they have diabetes – Monitoring diabetes control in clients who know they
have diabetes
• Feasible and desirable to clients • Advantages and disadvantages to HbA1c testing and blood sugar testing

3. Diabetes Education
• Must be tailored to this patient population
– Cultural competency
– Health literacy and health numeracy
– Language concordance
• Partnering with existing education providers
– Advantages: it’s already there
– Disadvantages: may not be adequately tailored, may be limited in where/when it can be provided (negating a key advantage of providing food pantry support)

Partners Providing Diabetes Education Should Be Familiar Working With Food
Insecure Population
• Nutrition counseling strategies that are budget-neutral (when possible)
• A “sick day” applies to both not eating because you are sick, and not eating because you have no access to food
• Smoking cessation

4. Coordinating/Partnering with Primary Care
• Diabetes self-management support and education alone will not treat the majority of diabetes
– Medications are usually critical
• Wide variability in community capacity for primary care for underserved populations
– Partner with the safety net system if there is one—they are experts in working with this population

Opening Conversations with Clinics
• Health care providers are often (but not always) aware of food insecurity among their patients
• Clinics are often excited about – Providing their patients with better food access, especially
if it is tailored to diabetes – Providing diabetes education
• Clinics vary greatly in their capacity
• Clinics do not generally get excited about monitoring HbA1c at a pantry – Is not of great benefit to the clinic (clinic has to recheck it
anyway), but may be to the client
• Referrals in both directions must have minimal impact on work flow – Clinics #1 priority is time

Opening Conversations with Clinics
• Identify the appropriate clinics in your area
– Federally qualified health centers
– Clinics in low-income neighborhoods
• Clinics associated with academic medical centers may or may not be interested, depending on the population they target
• Find a clinical champion

Feeding America Pilot Diabetes Initiative: 2011-2014
Funded by Bristol-Myers Squibb Foundation
3 FOOD BANKS CA, TX, OH
Monthly Food Boxes
IMPROVE FOOD
ACCESS with diabetes-appropriate
foods
We offered NUTRITION & HEALTH EDUCATION through written materials,
classes & 1-on-1 discussion
We Screened & Enrolled
1,500 INDIVIDUALS struggling with diabetes &
food insecurity
Client and Program Evaluation led by Dr. Hilary Seligman University of California, San Francisco,
Center for Vulnerable Populations
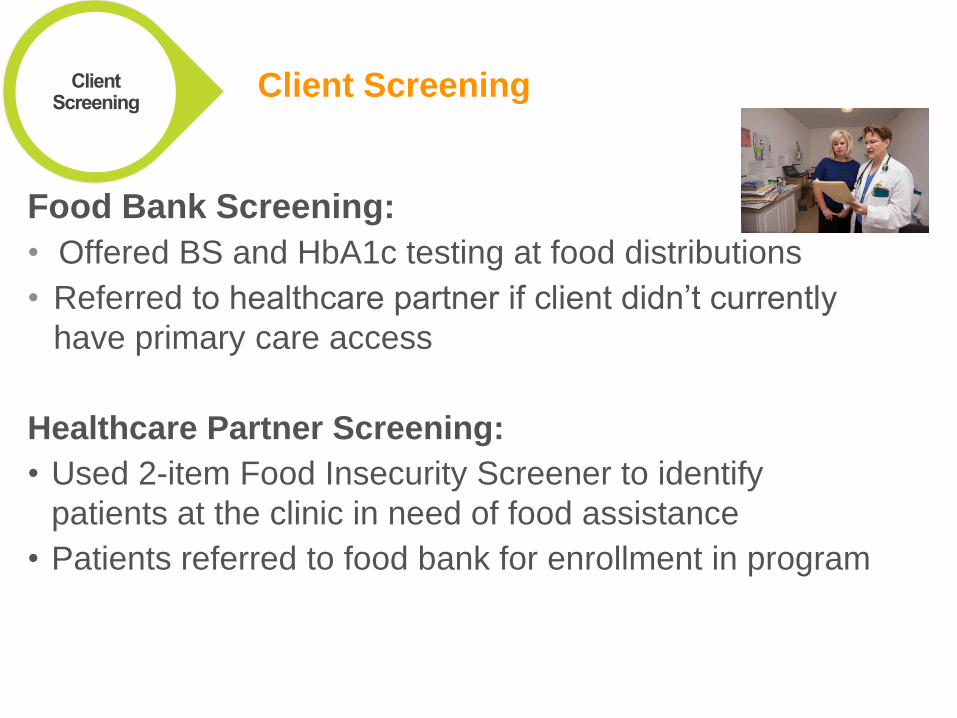
Client Screening
Food Bank Screening:
• Offered BS and HbA1c testing at food distributions
• Referred to healthcare partner if client didn’t currently
have primary care access
Healthcare Partner Screening:
• Used 2-item Food Insecurity Screener to identify
patients at the clinic in need of food assistance
• Patients referred to food bank for enrollment in program
Client Screening

Monthly Food Boxes Provided to
Clients in the Project
•Pre-packed boxes with shelf-
stable diabetes appropriate foods
•Fresh & frozen items
•Cost: Boxes provided free to
clients.
Items were a mix of purchased and donated
foods. Average cost ~ $18 per box, paid for
by the grant.
Improving Food Access
Diabetes & Health Education Offered
through a Variety of Approaches
• Written Information Accompanied Food Boxes
• Group Classes
• Videos
Nutrition & Health
Education

Diabetes Intervention at 3 Food Banks Total n = 1265 Age, mean (SD) 56.4 (12.5) Female, % 889 (70%) Race/ethnicity, % Latino or Hispanic White Black or African American Native American, Pacific Islander, or other
680 (55%) 317 (25%) 121 (10%) 124 (10%)
Education, % <High school degree/GED High school degree/GED >High school degree/GED
530 (42%) 286 (23%) 432 (35%)
Food insecurity, % Very low security Low security Secure
529 (42%) 520 (42%) 201 (16%)
BMI (kg/m2), mean (SD) (n=1082) 34.3 (8.5) Tobacco use, % 263 (21%)

Preliminary Results: Unadjusted pre-post changes
Variable N Pre-post change P-value
HbA1c 769 8.11 to 7.96% (overall reduction of 0.15%) CA: -0.14% TX: -0.19% OH: -0.39%
<0.01
Severe hypoglycemic events 646 15% to 11% 0.07
Medication non-adherence, scored 0-4
630 1.2 to 1.1 <0.01
Self-efficacy, scored 1-10
651 6.8 to 7.3 <0.01
Diabetes distress, scored 1-6
650 3.1 to 2.7 <0.01
Depressive symptoms 684 68% to 59% <0.01
Med affordability challenges 641 47% to 36% <0.01
