humans make search happen: using behavioral data to debunk seo's sullied reputation
TRANSCRIPT

Humans Make Search Happen
USING BEHAVIORAL DATA TO DEBUNK SEO’S SULLIED REPUTATION
Deborah CarverKatie PennellNina Hale, Inc.
@fightwithknives@katiepennell
@ninahale
#HumansContentData

Table of Contents
Chapter 1: SEO’s Reputation & How Google Works
Chapter 2: What to Measure & How to Find Metrics
Chapter 3: Search Metrics in the Real World
Chapter 4: How to Tell YOUR Data Story

Chapter 1:
I DON’T GIVE A DAMN ABOUT MY BAD REPUTATION.
“This data doesn’t fit with our new creative approach.”
What we hear
“But our focus group already showed us how the audience speaks about
this topic.”
What we hear
“This is a whole new content experience, and we don’t think
we need to rely on what worked in the past.”
What we hear

“We’re developing this content for humans and not for robots.”
What we hear
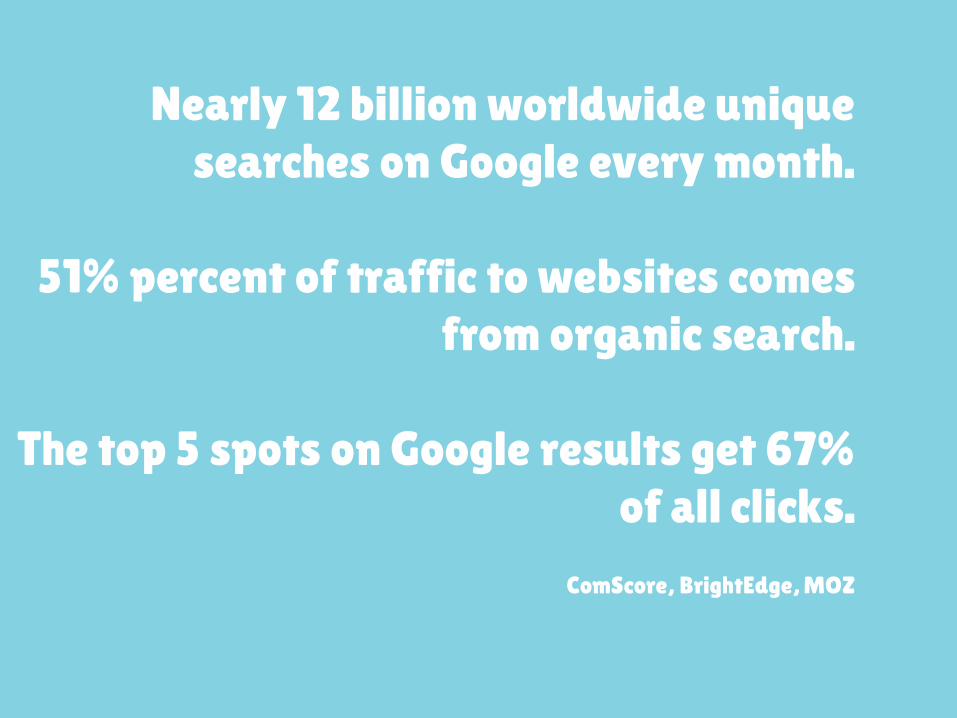
ComScore, BrightEdge, MOZ
Nearly 12 billion worldwide unique searches on Google every month.
51% percent of traffic to websites comes from organic search.
The top 5 spots on Google results get 67% of all clicks.

Humans not Robots
The Almighty GoogleGoogle is driven by robots mimicking humans,
not by humans mimicking robot behavior.
OK, Google…
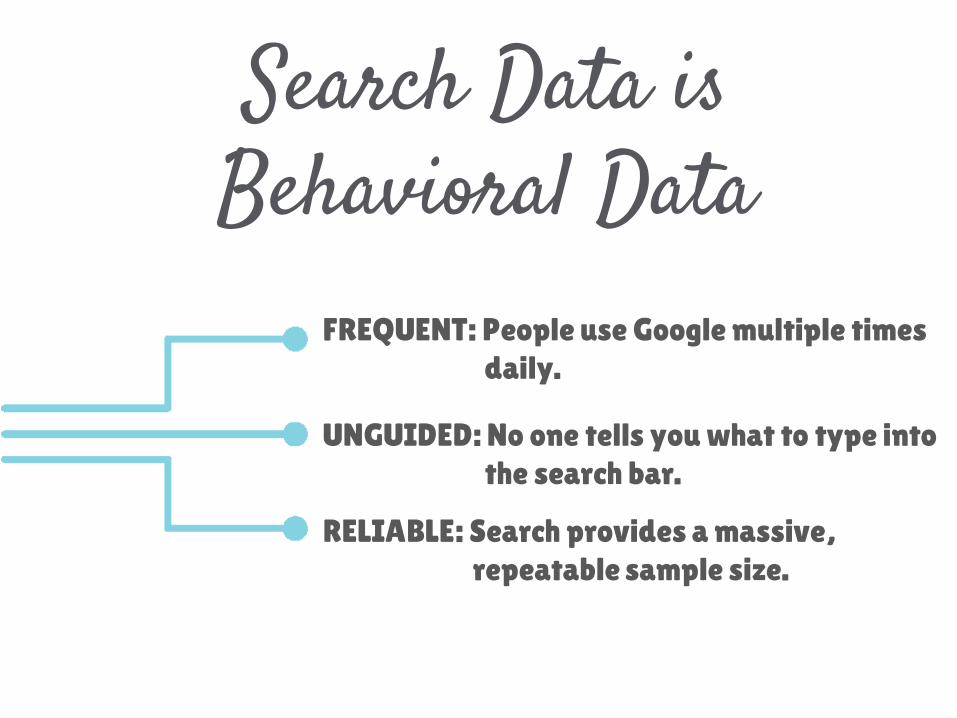
Search Data is Behavioral Data
FREQUENT: People use Google multiple times daily.
UNGUIDED: No one tells you what to type into the search bar.
RELIABLE: Search provides a massive, repeatable sample size.

1. Click-Through Rate
2. Co-Occurring, Relevant Terms
3. Social Sharing
4. High-Quality Backlinks
Top 4 Organic Ranking Factors
Searchmetrics

• Percentage of people who choose your search result after seeing it.
• Found in Google Webmaster Tools.
Click-Through Rate

Co-Occurring, Relevant Terms
• How people use the same words related to your topic without using the synonyms themselves.
• Google’s authority metric -- TF-IDF –- is not public.
• How many people think your content is good enough to share.
• Found in Google Analytics referral traffic and social analytics tools.
Social Sharing Activity

High-Quality Backlinks• Good backlinks are built on
quality content + relationships.› News websites
› Influencer links
› Well-known brand links
• Found in Google Analytics referral traffic and other tools, like Majestic.

YOU CAN UNDERSTAND USER BEHAVIOR FROM SEARCH DATA.

Chapter 2:
KNOW YOUR GOALS.LOVE YOUR GOALS.

76% of marketers cannot convert behavioral data into
targeting execution.Razorfish & Adobe 2014
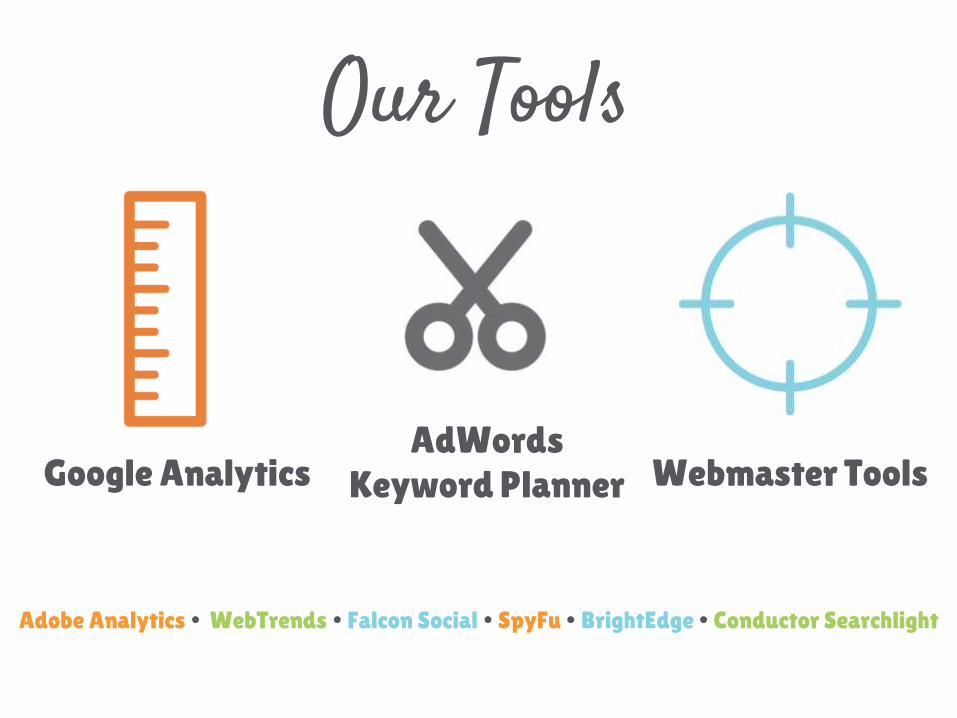
Adobe Analytics WebTrends Falcon Social SpyFu BrightEdge Conductor Searchlight
Our Tools
Google AnalyticsAdWords
Keyword Planner Webmaster Tools
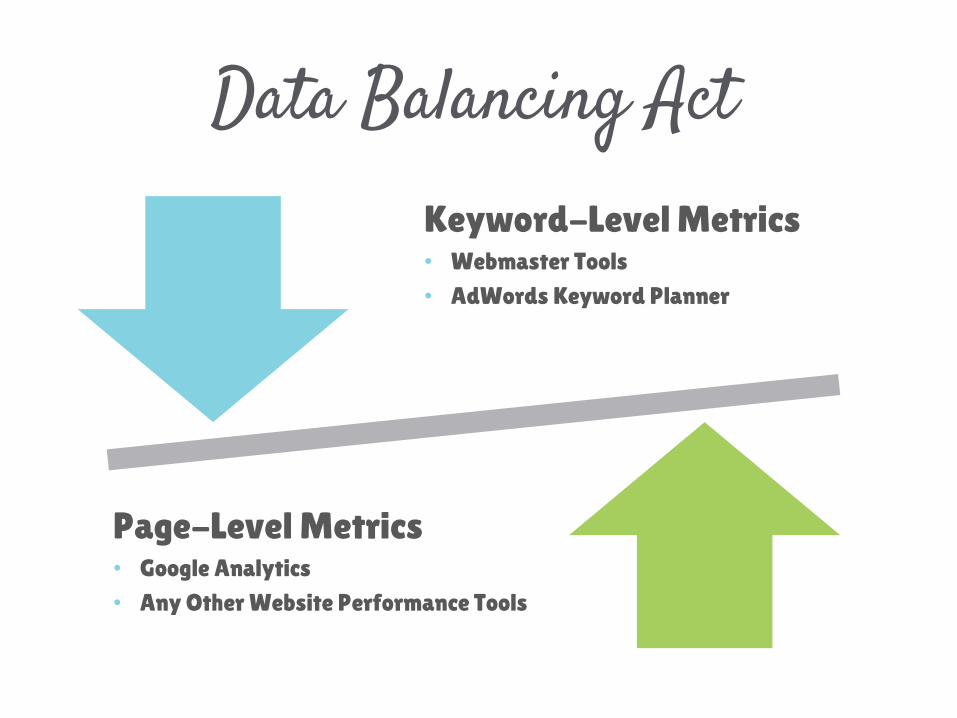
Data Balancing Act
Keyword-Level Metrics• Webmaster Tools
• AdWords Keyword Planner
Page-Level Metrics• Google Analytics
• Any Other Website Performance Tools

What We Do: Keyword Map
KEYWORD PAGE
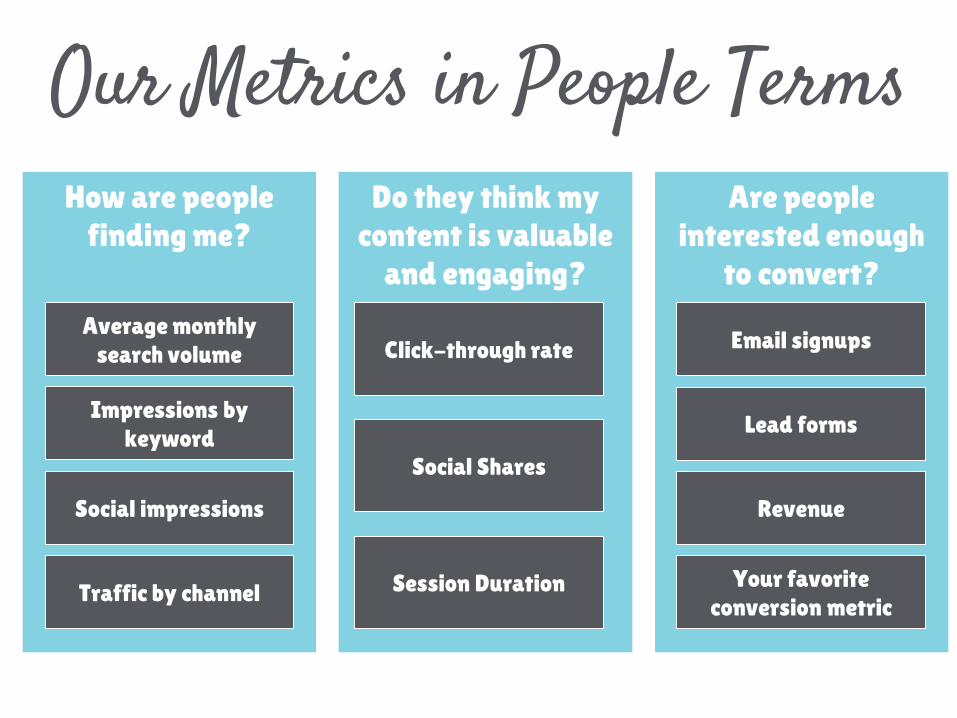
Our Metrics in People TermsHow are people
finding me?
Average monthly search volume
Impressions by keyword
Social impressions
Traffic by channel
Are people interested enough
to convert?
Email signups
Lead forms
Revenue
Your favorite conversion metric
Do they think my content is valuable
and engaging?
Session Duration
Click-through rate
Social Shares
CONVERSION:
any action that drives business value on the page level.
24
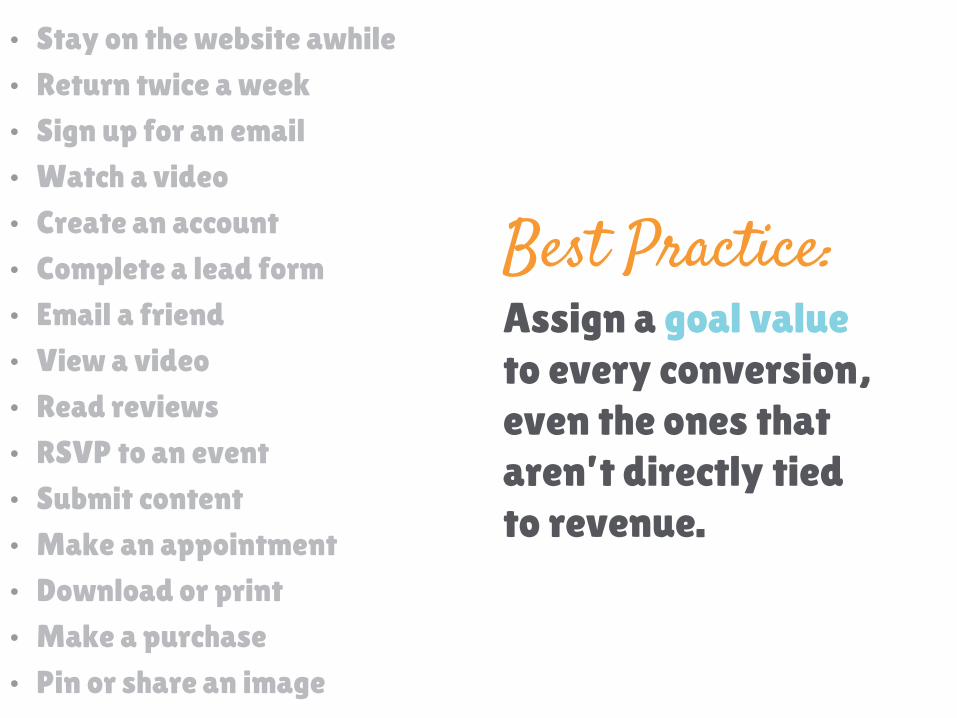
• Stay on the website awhile
• Return twice a week
• Sign up for an email
• Watch a video
• Create an account
• Complete a lead form
• Email a friend
• View a video
• Read reviews
• RSVP to an event
• Submit content
• Make an appointment
• Download or print
• Make a purchase
• Pin or share an image
Best Practice:Assign a goal value to every conversion, even the ones that aren’t directly tied to revenue.
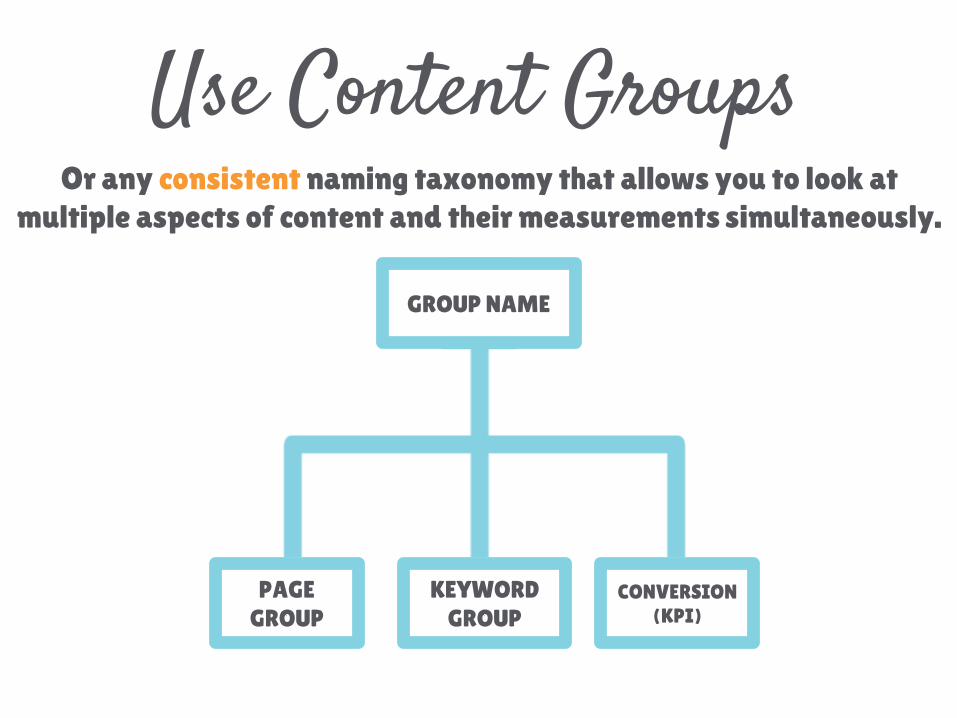
Use Content GroupsOr any consistent naming taxonomy that allows you to look at
multiple aspects of content and their measurements simultaneously.
GROUP NAME
PAGE GROUP
KEYWORD GROUP
KPIs
GROUP NAME
PAGE GROUP
KEYWORD GROUP
CONVERSION(KPI)

BUT WAIT… THERE’S MORE!

Introducing the Channels!
Paid!Paid SearchPaid Social
Owned!Website
Rented!
Social Profiles
Earned!
Social SharesReferrals

How to Benchmark
Look at data from the past year.
Take seasons & fluke days into account.
Discern a reasonable average.
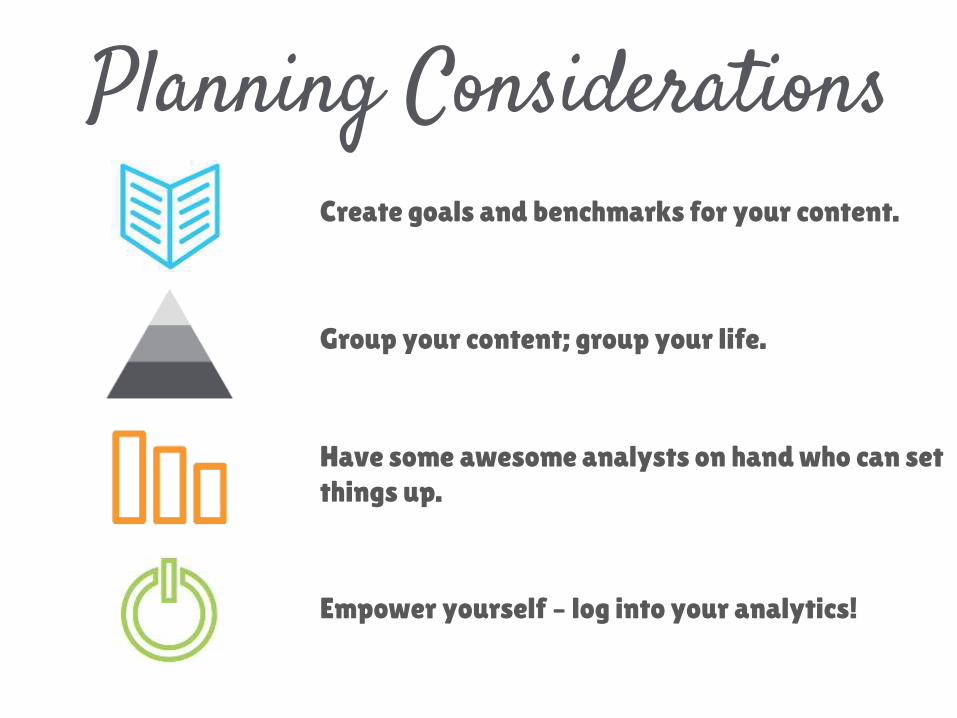
Planning Considerations
Group your content; group your life.
Have some awesome analysts on hand who can set things up.
Empower yourself – log into your analytics!
Create goals and benchmarks for your content.

MEASURE YOUR CONTENT. YOU CAN DO IT.
Chapter 3:
DATA STORIES

The Case of the Lone Metric

One single metric is out-of-sync.› Ex: Bounce rates are high.
Other organic metrics are in line with or better than benchmarked expectations.
Problem
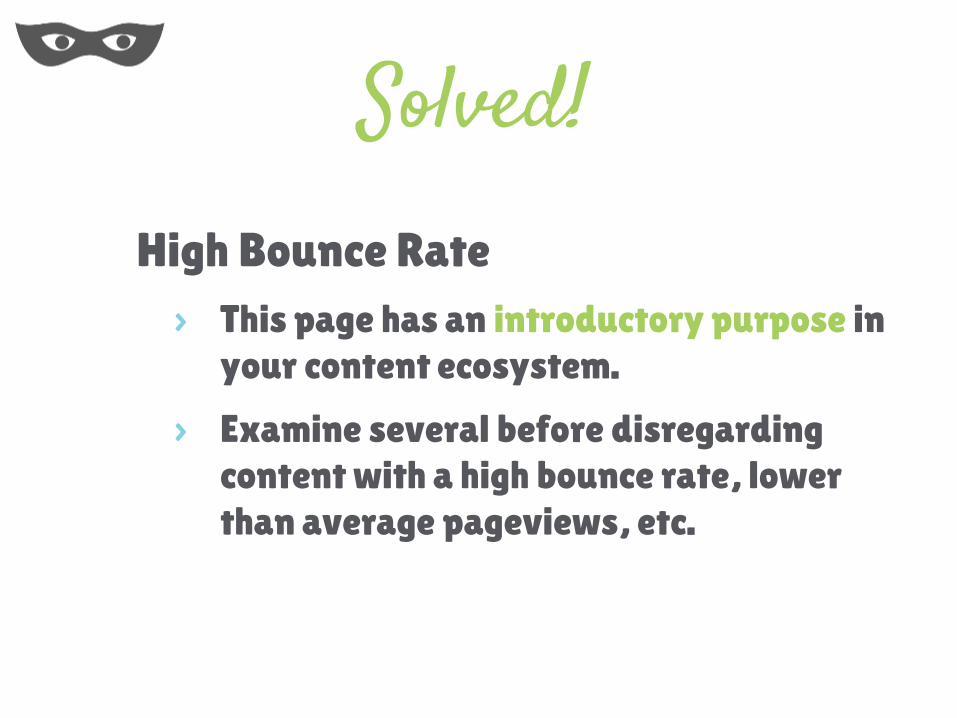
High Bounce Rate› This page has an introductory purpose in
your content ecosystem.
› Examine several before disregarding content with a high bounce rate, lower than average pageviews, etc.
Solved!
Don’t make major decisions based on one metric!
Moral
The Case of Unexpected Interference

Organic revenue is down compared to the benchmark.
Revenue from other channels are on par with the benchmark or better.
Problem
Paid campaigns are influencing organic revenue.
› Look into any recent changes in paid campaigns.
› Ensure you’re employing an efficient media mix (aka the rock band).
Solved!

All of your content channels influence each other.
Moral

The Case of the Apples & Oranges
Two separate content groups are behaving completely differently.
› The product page group has a high conversion rate.
› The idea page group has high time on site.
Problem

Your content types are producing different engagement.
› Tweak idea pages to promote more conversions.
› Link product pages back to your idea pages clearly.
Solved!

Each content type produces unique combinations of engagement metrics.
Moral

The Case of the Star Player

Social engagement is significantly up.
Social referral traffic and socialconversions are down.
Problem
There aren’t enough backlinks in your social posts.
› Link to your website in social posts using keywords.
Solved!

Even when your rented channels are performing well, your owned
channels still matter.
Moral

The Case of the New Kid on the Block

Social referral traffic is significantly up.
All other organic metrics are stable.
Problem

Something happened in the social realm.› Determine the source of the spike.
› Either create a profile or optimize your current profile.
Solved!

Your content doesn’t exist in a vacuum.
Moral

DATA STORIES VALIDATE YOUR CONTENT DECISIONS.

Chapter 4:
JUSTIFY YOUR CONTENT WITH NUMBERS THAT MATTER.

Establish your benchmarks.Start small. Scale up.
Consider all the metrics that lead to conversions.
Set up analytics to help your data stories.

Consider how much time you spend on your content.
The content comes from somewhere, and that somewhere is your department.
Graph it out with multiple metrics.
The numbers you choose represent PEOPLE’S actions.

Tell your data story.
Explain your story in terms of people, not numbers.
1. 1. Search data is behavioral data.
2. 2. Define your goals and benchmarks.
3. 3. Plan to set yourself up for success.
4. Associate your data with people’s actions.
1. 5. Be an empowered content strategist!
Epilogue
QUESTIONS?
Deborah CarverKatie PennellNina Hale, Inc.
@fightwithknives@katiepennell
@ninahale
STAY IN TOUCH. FIND US AT NINAHALE.COM.
#HumansContentData