human smuggling under risk evidence from the mediterranean
TRANSCRIPT

Human Smuggling under RiskEvidence from the Mediterranean∗
Kara Ross Camarena† Sarah Claudy‡ Jijun Wang§
Austin L. Wright¶
April 2019
Abstract
Since 2007, the number of refugees fleeing conflict and violence has doubled to about 25million. Mass migration has destabilized the European Union, lead to broad changesin national immigration policies, and triggered the resurgence of far right, xenophobicpolitical parties. Yet little is known about how illicit human smuggling institutionsmay be driving migration and the subsequent political changes. We leverage granulardata on migrant flows across the Mediterranean, coupled with information about searoutes, riots at port cities, and wave conditions, to conduct two studies. We findsubstantial evidence that migrant flows respond to political and environmental risks aswell as a government-led counter-smuggling intervention. These findings clarify driversof migration and suggest actions that can be taken to mitigate human smuggling.
Word Count: 3991
∗Author names appear in alphabetical order. We thank colleagues for feedback on the theoretical argu-ment and research design. We also thank Antonio Saccone (Head, Operational Sector, FRONTEX) for acomprehensive overview of data collection on migration in the Mediterranean. Laura Bergedieck providedexcellent research assistance. Support from the Pearson Institute for the Study and Resolution of GlobalConflicts is gratefully acknowledged. The opinions disclosed in this work are the authors’ own and not areflection of the official position of the Department of the Navy or the Department of Defense. All errorsremain our own.†Harris School of Public Policy, University of Chicago. Email: [email protected].‡United States Navy. Email: [email protected].§Harris School of Public Policy, University of Chicago. Email: [email protected].¶Harris School of Public Policy, University of Chicago. Email: [email protected].
In the last decade, the number of refugees fleeing conflict and violence has doubled to
about 25 million. In the last five years alone, nearly 2 million migrants have crossed the
Mediterranean. Some of these migrants qualify for asylum, and nearly all have used a
smuggler. Annually, human smuggling to the European Union (EU) is a 5 to 6 billion dollar
industry, but crossing the Mediterranean Sea is risky. More than 18,000 people have died
crossing to Europe since 2014 (UNHCR 2019). As the number of migrant deaths has risen,
policymakers and humanitarian organizations have wondered, why are migrants willing to
face the risk of death at sea in order to make it to Europe?
Early qualitative assessments of the crisis emphasized the role of migrants.1 This account
of the migrant flows suggested three tenants for policy interventions: focus on the migrants,
provide them with information, and improve the conditions in their home countries. Inform-
ing migrants of the risks and improving conditions in home countries would directly reduce
flows. By slowing the demand for crossing the sea, unscrupulous smugglers would exit the
market, finding another livelihood. Despite clear logic, interventions aimed at information
and development in countries of origin did not slow migrant flows. Crucially, we argue, this
approach to migration overlooks the important role of institutions that engage in and profit
from smuggling.
Scholars are devoting greater attention to human smuggling (Triandafyllidou 2018; Cam-
pana 2018; Martinez 2015). Research and analysis of how smugglers and migrants strate-
gically respond to enforcement at the frontier has also had a resurgence (Massey, Durand,
and Pren 2016; Lessem 2018). In particular, findings from along the US-Mexico border show
that border enforcement, targeting migrants but not smugglers, leads to displacement along
alternative routes (Gathmann 2008). We contribute to this emerging body of work by care-
fully examining how migration patterns respond to political and environmental risks as well
as a government-led intervention to disrupt smuggling markets.
With detailed data about crossings from North Africa to Italy, we establish that migrants
1. E.g. Greene (2016).

respond to political unrest in North Africa by fleeing across the Mediterranean to Europe.
A 10 percent increase in riots near ports where migrants congregate corresponds to a 4.89
percent increase in migrants arriving in Italy. The response is moderated by a reluctance to
leave in sea conditions that are too risky. A 10 percent increase in wave height corresponds to
a 27 percent decrease in arrivals in Italy. These findings are robust to a number of alternative
model and outcome specifications.
Our first set of empirical analyses cannot distinguish between the two possible agents
responding to risky sea conditions: the migrants and the smugglers. Economic theory, com-
bined with anecdotal accounts of smuggling, suggests that it is the smuggler, not the migrant,
who responds to the risky sea conditions. We disentangle migrants and smugglers’ roles in
the flows using an event study motivated by a government-led intervention. In mid-2017,
Italy, backed with EU money, pursued an intervention aimed at disrupting migration using
side payments to militias on the Libyan coast and enhanced maritime patrols. We find that
343 fewer migrants arrive in Italy per week, following the intervention, a 0.6 standard devi-
ation reduction in migrant crossings. The reduction occurs despite little change in demand.
Underlying drivers of migration from origin countries in Sub-Saharan Africa changed little
in 2017, and the number of international migrants in Libya remained stable. There is limited
evidence of negative externalities as a result of the intervention.
Migrant Risk and the Smuggling Market
Potential migrants consider the expected utility of staying at home, the cost of migrating,
and the expected benefits of working in their destination, when deciding to move. They are
well informed about the situation in their home country but relatively less informed about
the path to their destination. To ease their travel, they pay a smuggler (Martinez 2015). By
selecting a reputable smuggler, a migrant lowers the risk of travel and increases the expected
utility of moving.
Reputational dynamics facilitate illicit markets, and human smuggling is no exception.
People rely on repeated interactions and a reputation to facilitate “relational contracts” or
cooperation in the shadow of the future (Przepiorka, Norbutas, and Corten 2017). Mediter-
ranean human smuggling is built on repeated interactions, but the information environment
for smuggling is different from other illicit markets. Since most of the migrants are not from
North Africa, but further south, their family and friends do not have information about
which sea smuggler they used. Instead, the sea smuggler preserves his reputation among
other land smugglers.2 These land smugglers’ reputations depends in part on linking with a
sea smuggler who sends migrants into the Mediterranean only when they are likely to arrive
in Europe and relay to their family that all went well. The reputational mechanism at work
in smuggling across the Mediterranean is much like original work on relational contracts in
supply chains of firms (Grossman and Hart 1986; Baker, Gibbons, and Murphy 2002).
Context
The human smuggling market in North African port cities is competitive. When smug-
glers began using inflatable craft that are easily replaced, entry barriers were further reduced.
The price for crossing the Mediterranean fell substantially. Furthermore, the Libyan Navy
and Coast Guard’s vessels were among the targets of the 2011 NATO intervention in Libya.
By 2014 when smuggling across the Mediterranean was expanding rapidly, there was little
government infrastructure to curtail it. Militias and other armed groups controlled ports and
the surrounding water. In the context of a thriving smuggling industry, militias smuggled
migrants themselves, charged tolls to other smugglers for passage out of controlled waters,
and operated detention centers for migrants who were captured by formal and informal
authorities.
2. Campana (2018) studies networks of smugglers in Libya. Martinez (2015) documents similar linksamong coyotes who facilitate US-Mexico border crossings.
Data
We study migrant movement into Italy from January 2016 to April 2018. Our data tracks
the arrival of 307,056 individuals and comes from the United Nations High Commissioner for
Refugees, through the Operational Portal—Mediterranean. The arrivals were predominantly
processed at the Lampedusa Intake Facility, located in the Italian Pelagie Islands. Remaining
counts were compiled at smaller facilities along the Italian coast. These records do not
distinguish origins, effectively yielding a daily time series of migration. From Lampedusa,
we trace the nine primary sea routes back to their origins in Libya and Tunisia (see Figure 1).
These routes are based on extensive qualitative research by the International Organization
for Migration (IOM).
To capture variation in political unrest near areas where migrants depart, we construct
25-kilometer buffers around these nine ports. We identify all riots within these buffers
collected in the Armed Conflict Location & Event Data Project (ACLED).3 During our
sample period, nearly all events recorded within our buffers were georeferenced to the town
(spatial precision level 1), giving us more confidence in the assignment of riot events to ports.
Because sea travel takes roughly one week from departure to arrival, we count the number
of riot events in the prior week.4
Migration may also be influenced by sea conditions. To account for this, we gather daily
sea wave height data from the EU’s Copernicus marine environment monitoring service.
Wave heights were recorded at 0500 local time (approximately sunrise). We calculate wave
conditions within a geographic zone derived from the IOM sea routes, enabling us to capture
wave heights along and around these passageways (see Figure 1). Similar to our riot data,
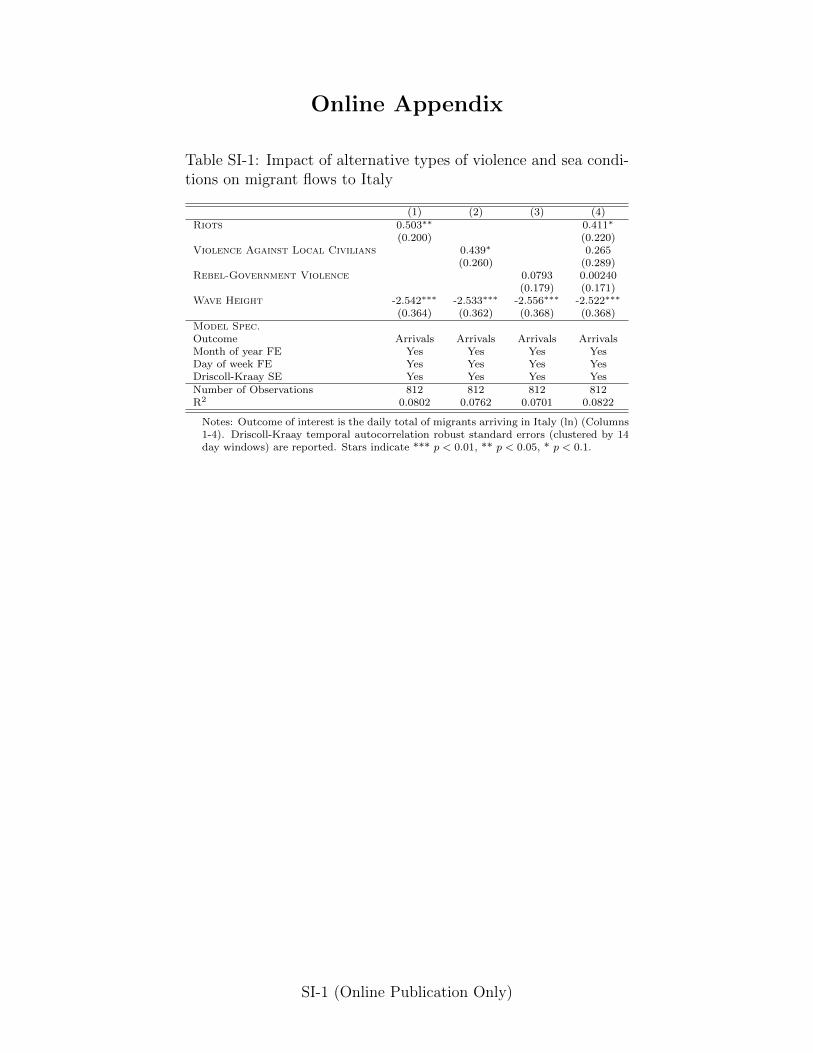
3. Riots occur in urban areas and are likely to affect labor migrants. Migrants should be less affected byviolence targeting civilians and rebel violence, as the migrants are just passing through and tend to avoidplaces with ongoing rebel violence. As robustness checks we examine responsiveness to violence againstcivilians and rebel-government violence. As expected, migrants are more responsive to riots (See OnlineAppendix.)
4. When migrants depart from Libya, smugglers instruct migrants to take their boats towards Italy for6-8 hours and then to call for help. Once rescued, migrants begin processing that starts on the rescue shipand ends a few days later with registration at a “hotspot.” (Papadopoulou et al. 2016)
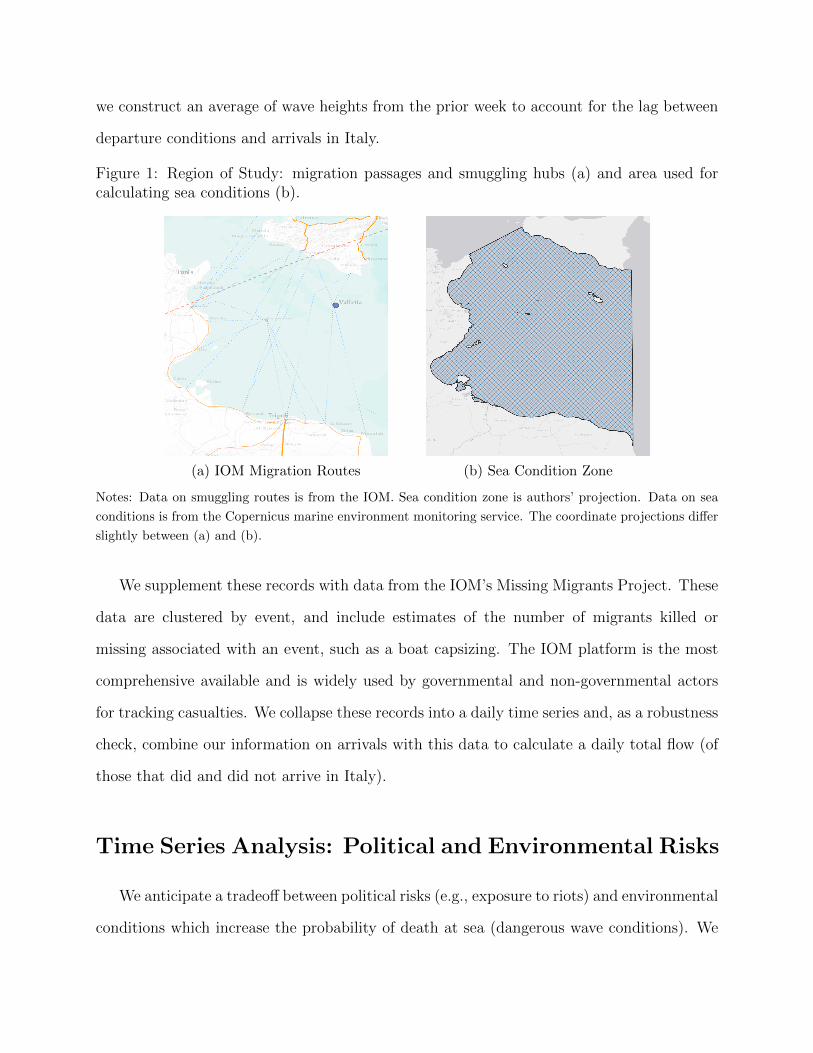
we construct an average of wave heights from the prior week to account for the lag between
departure conditions and arrivals in Italy.
Figure 1: Region of Study: migration passages and smuggling hubs (a) and area used forcalculating sea conditions (b).
(a) IOM Migration Routes (b) Sea Condition Zone
Notes: Data on smuggling routes is from the IOM. Sea condition zone is authors’ projection. Data on sea
conditions is from the Copernicus marine environment monitoring service. The coordinate projections differ
slightly between (a) and (b).
We supplement these records with data from the IOM’s Missing Migrants Project. These
data are clustered by event, and include estimates of the number of migrants killed or
missing associated with an event, such as a boat capsizing. The IOM platform is the most
comprehensive available and is widely used by governmental and non-governmental actors
for tracking casualties. We collapse these records into a daily time series and, as a robustness
check, combine our information on arrivals with this data to calculate a daily total flow (of
those that did and did not arrive in Italy).
Time Series Analysis: Political and Environmental Risks
We anticipate a tradeoff between political risks (e.g., exposure to riots) and environmental
conditions which increase the probability of death at sea (dangerous wave conditions). We

exploit the daily time series data above to study this question. Our main specification
incorporates political unrest (riots) and sea conditions. We begin by estimating Equation 1:
arrivalsi = α + β1riots i + β2wave height i + γmonthi + λdayi + ε (1)
Where arrivalsi is the daily total of arrivals, riotsi indicates the intensity of riots in
the prior week, and wave heighti captures average sea conditions in the prior week. To
ease interpretation as elasticities (percentages), we evaluate the log of these three measures.5
Supplemental models incorporate monthi and dayi. monthi indicates month of year fixed
effects and dayi represents day of week fixed effects. We leverage monthi to capture any
seasonal trends in flight, violence, or sea conditions. dayi helps us account for any systematic
variation in arrivals that might be driven by intake operations (e.g., the facility may staff
fewer officers on Sundays). In our main specification, we produce heteroskedasticity robust
standard errors.
Results: Political and Environmental Risks
Table 1 reports the results from our main specifications in equation 1. In Column 1, we
present the baseline correlation between arrivals and political unrest in the prior week. We
find evidence consistent with our expectation, a strong positive relationship. A 10 percent
increase in riot intensity corresponds to a 4.89 percent increase in arrivals. In Column 2, we
introduce our measure of travel risk. If our argument is correct, we would expect a negative
correlation between wave height and arrival intensity. Here, the evidence is even sharper.
A 10 percent increase in wave heights leads to an approximately 27 percent decrease in
arrivals. We have no reason to expect that sea conditions would be linked to riot activity,
but jointly estimating these effects in Column 3 allows us to partial out any residual pair-
wise correlation. Our estimates are stable. In Column 4, we introduce monthi fixed effects
5. We add one to arrivalsi and riotsi before calculating the log.
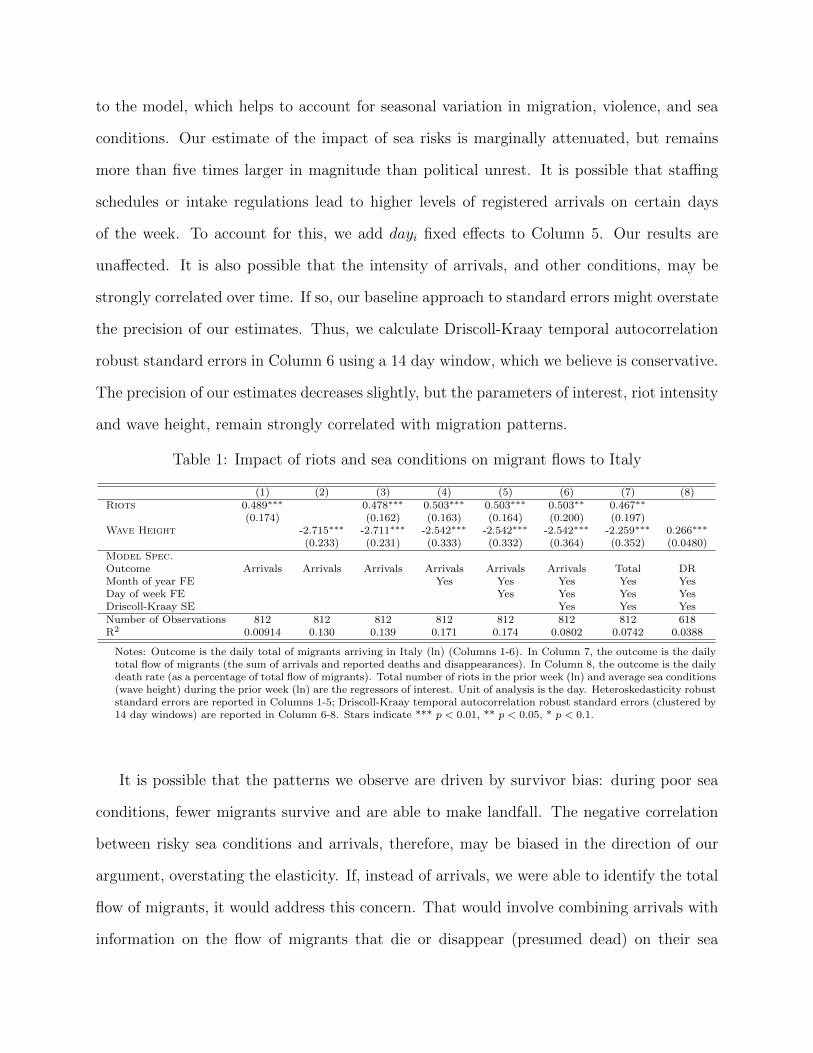
to the model, which helps to account for seasonal variation in migration, violence, and sea
conditions. Our estimate of the impact of sea risks is marginally attenuated, but remains
more than five times larger in magnitude than political unrest. It is possible that staffing
schedules or intake regulations lead to higher levels of registered arrivals on certain days
of the week. To account for this, we add dayi fixed effects to Column 5. Our results are
unaffected. It is also possible that the intensity of arrivals, and other conditions, may be
strongly correlated over time. If so, our baseline approach to standard errors might overstate
the precision of our estimates. Thus, we calculate Driscoll-Kraay temporal autocorrelation
robust standard errors in Column 6 using a 14 day window, which we believe is conservative.
The precision of our estimates decreases slightly, but the parameters of interest, riot intensity
and wave height, remain strongly correlated with migration patterns.
Table 1: Impact of riots and sea conditions on migrant flows to Italy
(1) (2) (3) (4) (5) (6) (7) (8)Riots 0.489∗∗∗ 0.478∗∗∗ 0.503∗∗∗ 0.503∗∗∗ 0.503∗∗ 0.467∗∗
(0.174) (0.162) (0.163) (0.164) (0.200) (0.197)Wave Height -2.715∗∗∗ -2.711∗∗∗ -2.542∗∗∗ -2.542∗∗∗ -2.542∗∗∗ -2.259∗∗∗ 0.266∗∗∗
(0.233) (0.231) (0.333) (0.332) (0.364) (0.352) (0.0480)Model Spec.Outcome Arrivals Arrivals Arrivals Arrivals Arrivals Arrivals Total DRMonth of year FE Yes Yes Yes Yes YesDay of week FE Yes Yes Yes YesDriscoll-Kraay SE Yes Yes YesNumber of Observations 812 812 812 812 812 812 812 618R2 0.00914 0.130 0.139 0.171 0.174 0.0802 0.0742 0.0388
Notes: Outcome is the daily total of migrants arriving in Italy (ln) (Columns 1-6). In Column 7, the outcome is the dailytotal flow of migrants (the sum of arrivals and reported deaths and disappearances). In Column 8, the outcome is the dailydeath rate (as a percentage of total flow of migrants). Total number of riots in the prior week (ln) and average sea conditions(wave height) during the prior week (ln) are the regressors of interest. Unit of analysis is the day. Heteroskedasticity robuststandard errors are reported in Columns 1-5; Driscoll-Kraay temporal autocorrelation robust standard errors (clustered by14 day windows) are reported in Column 6-8. Stars indicate *** p < 0.01, ** p < 0.05, * p < 0.1.
It is possible that the patterns we observe are driven by survivor bias: during poor sea
conditions, fewer migrants survive and are able to make landfall. The negative correlation
between risky sea conditions and arrivals, therefore, may be biased in the direction of our
argument, overstating the elasticity. If, instead of arrivals, we were able to identify the total
flow of migrants, it would address this concern. That would involve combining arrivals with
information on the flow of migrants that die or disappear (presumed dead) on their sea
passage. To investigate this, we rely on the IOM’s data on missing migrants. We collapse
this data into a comparable daily time series and sum arrivals and deaths from this source
into a total migrant flow. We replicate our most conservative model specification in Column
7 with this new outcome. Notice that our sea condition coefficient decreases in magnitude,
from 2.54 to 2.26. The elasticity of riots also declines, which is consistent in relative scale.
This suggests that our benchmark results are marginally influenced by survivor bias.
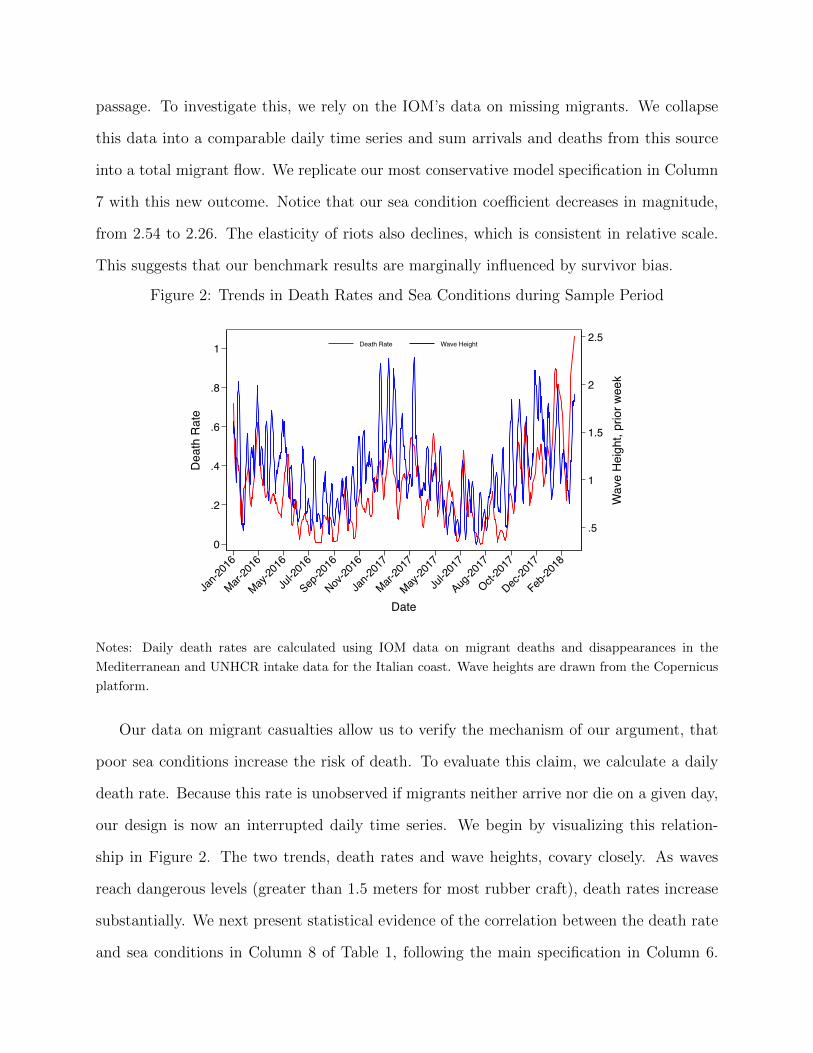
Figure 2: Trends in Death Rates and Sea Conditions during Sample Period
.5
1
1.5
2
2.5
Wav
e He
ight
, prio
r wee
k
0
.2
.4
.6
.8
1
Deat
h Ra
te
Jan-2
016
Mar-20
16
May-20
16
Jul-2
016
Sep-20
16
Nov-20
16
Jan-2
017
Mar-20
17
May-20
17
Jul-2
017
Aug-20
17
Oct-20
17
Dec-20
17
Feb-20
18
Date
Death Rate Wave Height
Notes: Daily death rates are calculated using IOM data on migrant deaths and disappearances in the
Mediterranean and UNHCR intake data for the Italian coast. Wave heights are drawn from the Copernicus
platform.
Our data on migrant casualties allow us to verify the mechanism of our argument, that
poor sea conditions increase the risk of death. To evaluate this claim, we calculate a daily
death rate. Because this rate is unobserved if migrants neither arrive nor die on a given day,
our design is now an interrupted daily time series. We begin by visualizing this relation-
ship in Figure 2. The two trends, death rates and wave heights, covary closely. As waves
reach dangerous levels (greater than 1.5 meters for most rubber craft), death rates increase
substantially. We next present statistical evidence of the correlation between the death rate
and sea conditions in Column 8 of Table 1, following the main specification in Column 6.

The estimate confirms that there is a strong positive relationship between sea risk and the
percentage of migrants who die or are lost at sea.
Event Study: Italy’s 2017 Libya Intervention
We use a policy intervention by Italy and backed by EU funding to interrogate the
assumption that the migrant flows across the Mediterranean are demand driven. The policy is
aimed at disrupting the human smuggling business in Libya, while doing nothing to explicitly
address the flow of migrants seeking to travel across the Mediterranean. An important
discrete change in July 2017 allows us to disentangle the supply of smuggling from the
demand of migrants.6
Italy has mediated deals between various armed groups that control territory critical to
human smuggling. At the end of June 2017, Italy facilitated a deal with two militias in
the key port of Sabratha, west of the capital, Tripoli. The deal effectively turned militias
that facilitated smuggling into “anti-smuggling” coast guard (Micallef and Reitano 2017;
Michael 2017). Furthermore, it gives the militias access to funds and equipment for coast
guard activities, similar to an agreement in Southern Libya that built a coalition among
Southern tribes and the UN-backed government in Libya and gave them access to EU funds
(Karasapan 2017).7 By the beginning of July, the Libyan Coast Guard had refurbished
boats, and joint operations between the EU-bolstered Libyan Coast Guard and Italian Navy
ensured that 60% of intercepted migrant boats were being returned to Libya (Wintour 2017;
Micallef and Reitano 2017). At the same time, Italy announced draft code of conduct
restrictions on NGO rescue ships (Micallef and Reitano 2017). Subsequent investigation
suggests that the Libyan government has used an EU cash influx to pay off or co-opt militias
who controlled ports, acted as coast guard, and facilitated migrant smuggling and detention
6. Based on reported events, the policy intervention occurred over three weeks. Reports of Libyan CoastGuard’s boats in the water and turning around migrant vessels coincide with the second week of July.
7. While the Italian Foreign Minister acknowledges Italy “spoke to everyone,” the Italian government doesnot acknowledge part in Sabratha deal (Walsh and Horowitz 2017; Wintour 2017).
(Eaton 2018). Because the intervention targets the supply of smugglers, but does not change
the underlying conditions in countries of origin like Somalia, Eritrea or Nigeria, we can use
Italy’s intervention to separate the supply of human smuggling from the demand for sea
crossings by migrants.
The next component of our analysis is focused on the Italian-led anti-smuggling interven-
tion, which was initiated in July 2017. Because we lack a viable control group,8 we implement
a synthetic prediction model (using high dimensional time fixed effects) to construct a coun-
terfactual flow of migrants for 2017 based on 2016 migration patterns.9 The timing of the
intervention sets up an ideal shock, from which we can estimate a difference-in-differences
model using Equation 2:
arrivalsi = α + β1Post i + β2Intervention i + β3Post × Intervention i + ε (2)
Where arrivalsi is the weekly total of arrivals and Post× Intervention is the quantity
of interest, the change in migrant flows into Italy following the intervention (compared to
the synthetic counterfactual).10 Following our most conservative time series specification, we
produce Driscoll-Kraay temporal autocorrelation robust standard errors (with a bandwidth
of four weeks).
Results: Government-led Intervention
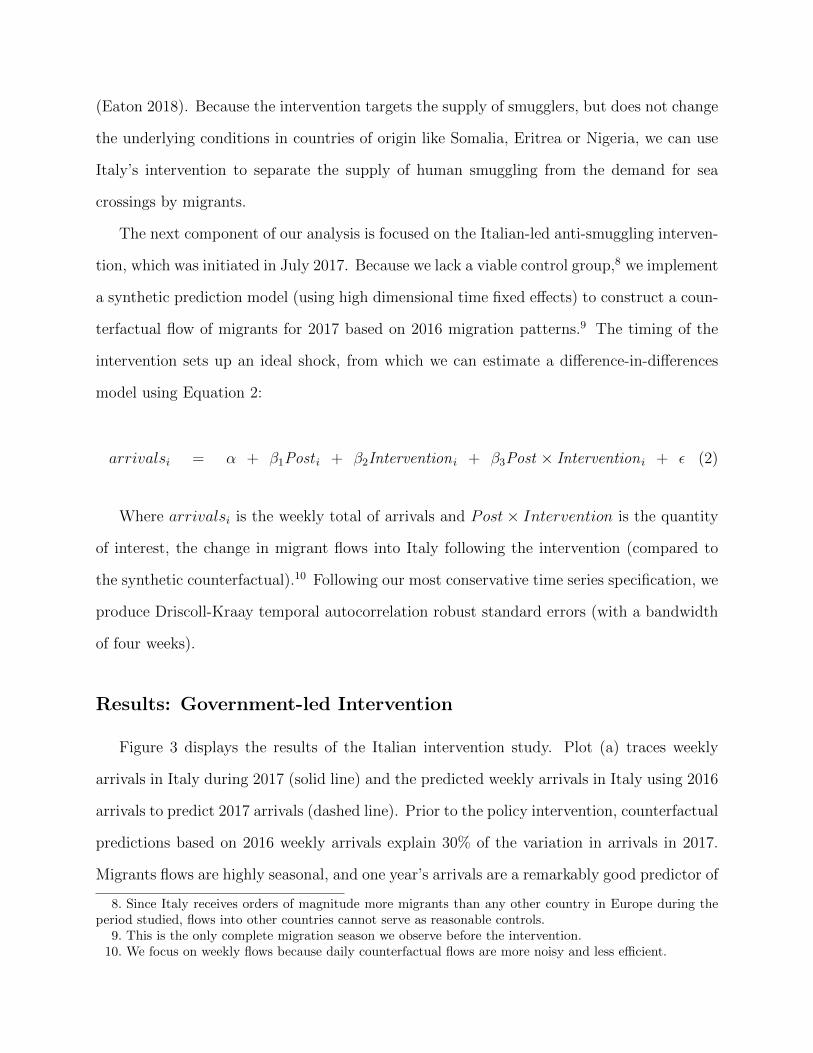
Figure 3 displays the results of the Italian intervention study. Plot (a) traces weekly
arrivals in Italy during 2017 (solid line) and the predicted weekly arrivals in Italy using 2016
arrivals to predict 2017 arrivals (dashed line). Prior to the policy intervention, counterfactual
predictions based on 2016 weekly arrivals explain 30% of the variation in arrivals in 2017.
Migrants flows are highly seasonal, and one year’s arrivals are a remarkably good predictor of
8. Since Italy receives orders of magnitude more migrants than any other country in Europe during theperiod studied, flows into other countries cannot serve as reasonable controls.
9. This is the only complete migration season we observe before the intervention.10. We focus on weekly flows because daily counterfactual flows are more noisy and less efficient.

the next. Italy’s intervention occurs in mid-July, and the drop in arrivals is visible. Following
the intervention, the 2016 migrant flows explain only 2% of the variation in arrivals. Plot (b)
displays estimated coefficients from the difference-in-difference estimation. The first point
plotted is our preferred specification which marks the intervention at Week 28, the earliest
week that we could document the Libyan Coast Guard turning around most boats. We
estimate the the policy intervention reduced migrant arrivals by 343 people per week for the
remainder of 2017. As robustness checks, we include estimates from three other specifications.
The second estimate includes controls for the arrivals in the previous week. The third
estimate uses an earlier week for the intervention, Week 26 which follows the weekend when
Italy is reported to have negotiated with armed groups in the port city of Sabratha. The
final estimate use the earlier treatment week and includes lagged arrivals. Regardless of the
specification, the estimates are stable and statistically non-zero at conventional levels.
It is possible that Italy’s intervention successfully limited flows into Italy while causing
negative externalities; we consider two possibilities. First, it may be that when crossing from
Libya to Italy became too difficult or costly, migrants moved through alternative routes. The
two most natural routes are through the Western Mediterranean into Spain or through the
Eastern Mediterranean into Greece. Panel (c) shows that there is some displacement through
these routes into Spain and Greece, although the magnitude of displacement is much lower
than the reduction from Italy’s intervention.
Second, it may be that even though fewer migrants are crossing the Mediterranean, they
are using worse smugglers and traveling in more dangerous seas. Observers have worried
that as NGO rescue boats have withdrawn that the quality and timeliness of rescues has
diminished. Panel (d) compares the arrivals and deaths before and after Italy’s intervention.
The number of deaths tracks the number of migrants consistently (note the different scales).
While there is one peak in deaths in November 2017, it is not abnormal for the winter when
few migrants cross and conditions are more treacherous.
Italy’s intervention reduced the number of migrant crossings and deaths in Mediterranean
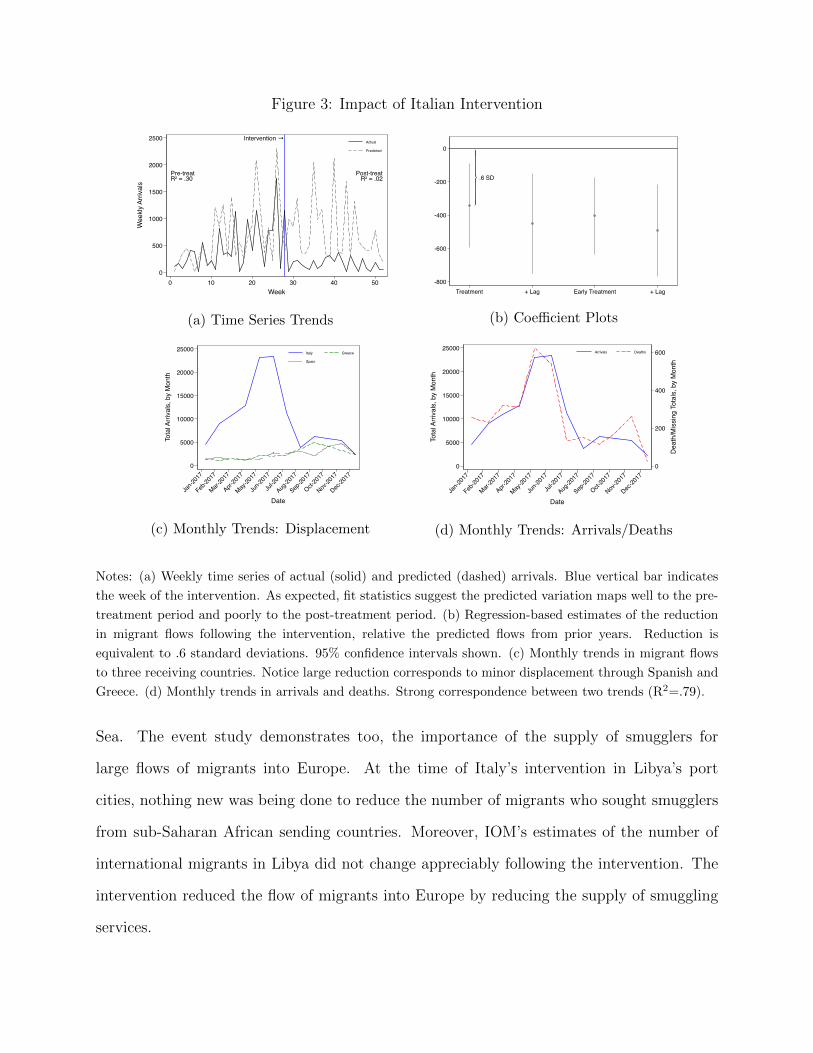
Figure 3: Impact of Italian Intervention
Intervention →
Pre-treatR2 = .30
Post-treatR2 = .02
0
500
1000
1500
2000
2500W
eekl
y Ar
rival
s
0 10 20 30 40 50Week
Actual
Predicted
(a) Time Series Trends
⎫||⎬||⎭
.6 SD
-800
-600
-400
-200
0
Treatment + Lag Early Treatment + Lag
(b) Coefficient Plots
0
5000
10000
15000
20000
25000
Tota
l Arri
vals,
by
Mon
th
Jan-2
017
Feb-20
17
Mar-20
17
Apr-20
17
May-20
17
Jun-2
017
Jul-2
017
Aug-20
17
Sep-20
17
Oct-20
17
Nov-20
17
Dec-20
17
Date
Italy Greece
Spain
(c) Monthly Trends: Displacement
0
200
400
600
Deat
h/M
issin
g To
tals,
by
Mon
th
0
5000
10000
15000
20000
25000
Tota
l Arri
vals,
by
Mon
th
Jan-2
017
Feb-20
17
Mar-20
17
Apr-20
17
May-20
17
Jun-2
017
Jul-2
017
Aug-20
17
Sep-20
17
Oct-20
17
Nov-20
17
Dec-20
17
Date
Arrivals Deaths
(d) Monthly Trends: Arrivals/Deaths
Notes: (a) Weekly time series of actual (solid) and predicted (dashed) arrivals. Blue vertical bar indicates
the week of the intervention. As expected, fit statistics suggest the predicted variation maps well to the pre-
treatment period and poorly to the post-treatment period. (b) Regression-based estimates of the reduction
in migrant flows following the intervention, relative the predicted flows from prior years. Reduction is
equivalent to .6 standard deviations. 95% confidence intervals shown. (c) Monthly trends in migrant flows
to three receiving countries. Notice large reduction corresponds to minor displacement through Spanish and
Greece. (d) Monthly trends in arrivals and deaths. Strong correspondence between two trends (R2=.79).
Sea. The event study demonstrates too, the importance of the supply of smugglers for
large flows of migrants into Europe. At the time of Italy’s intervention in Libya’s port
cities, nothing new was being done to reduce the number of migrants who sought smugglers
from sub-Saharan African sending countries. Moreover, IOM’s estimates of the number of
international migrants in Libya did not change appreciably following the intervention. The
intervention reduced the flow of migrants into Europe by reducing the supply of smuggling
services.

Discussion
Migrants crossing the Mediterranean is among the most pressing issues facing the EU.
Understanding what drives and limits migrants crossing the Mediterranean is a critical first
step in designing an effective policy response. Our work establishes three key empirical
relationships. First, migrants, who are already precariously situated in Libya, respond to
violence and political unrest by crossing the Mediterranean. While migrants may be drawn
to the EU for economic reasons, one proximate cause of their choice to travel is the instability
along the North African coast.
Second, these political drivers of migration are moderated by travel risk. At roughly
5 times the elasticity magnitude, risky sea conditions forestall people from crossing the
Mediterranean. It is unlikely, if not impossible, that migrants are judging the seas. Rather,
the calibrated response to fluctuations in sea conditions come from experience at the sea.
Sea smugglers send migrants across the Mediterranean when it is sufficiently safe. Doing
so preserves their reputation for safe passage and ensures they will have a future stream of
income—new migrants to smuggle.
Third, smugglers not only play a key role in providing information about risk at sea,
they are critical for sea crossings. In the absence of smugglers, migrants do not cross the
sea in any volume. This further demonstrates that the smuggling market moderates flows.
Even when demand for sea crossing changes little, limiting the supply of smugglers reduces
arrivals dramatically. The reduction occurs with limited displacement to other routes.
Flows of migrants across the Mediterranean between 2014 and 2019 are among the largest
migrant flows into Europe since the EU’s inception, and indeed since the European coun-
tries began distinguishing between legal and illicit migration. The shear magnitude of the
flows and deaths of migrants, makes understanding human smuggling in the Mediterranean
important for policy and political science scholars. Some of our insights carry over to other
contexts, too. Previous research on the US-Mexico border has demonstrated that con-
centrated border enforcement leads to displacement through alternative paths (Gathmann

2008). Smugglers facilitate the displacement, and demand for smuggling services may in-
crease (Martinez 2015). Our evidence reinforces that migrants rely on smugglers to mitigate
risk, political and environmental. Furthermore, if border enforcement makes migration more
risky, it can incentivize smuggling. Our findings suggest policies that also mitigate the supply
of smugglers may make border enforcement more effective.
References
Baker, George, Robert Gibbons, and Kevin J. Murphy. 2002. “Relational Contracts and theTheory of the Firm.” The Quarterly Journal of Economics 117 (1): 39–84. doi:10.1162/003355302753399445.
Campana, Paolo. 2018. “Out of Africa: The organization of migrant smuggling across theMediterranean.” European Journal of Criminology 15 (4): 481–502. doi:10.1177/1477370817749179.
Copernicus Marine Environment Monitoring Service. 2018. Mediterranean Sea Waves Anal-ysis and Forecast. Accessed June 28, 2018.
Eaton, Tim. 2018. Libya’s War Economy: Predation, Profiteering and State Weakness. RoyalInstitute of International Affairs.
Gathmann, Christina. 2008. “Effects of enforcement on illegal markets: Evidence from mi-grant smuggling along the southwestern border.” Journal of Public Economics 92:1926–1941. doi:10.1016/j.jpubeco.2008.04.006.
Greene, Richard Allen. 2016. “3800 Dead – and More on the Way.” CNN (October 26).Accessed April 17, 2019. http://www.cnn.com/2016/10/26/europe/mediterranean-migrant-crisis-visual-guide-trnd/index.html.
Grossman, Sanford, and Oliver Hart. 1986. “The Costs and Benefits of Ownership: A Theoryof Vertical and Lateral Integration.” Journal of Political Economy 94 (4): 691–719.doi:10.1086/261404.
International Organization for Migration. 2018. Migration Flows - Europe. Accessed July 18,2018. http://migration.iom.int/europe/.
Karasapan, Omer. 2017. “The tragedy of migrants in Libya.” Future Development Blog(Washington, DC) (May 15). Accessed April 24, 2019. https://www.brookings.edu/blog/future-development/2017/05/15/the-tragedy-of-migrants-in-libya/.
Lessem, Rebecca. 2018. “Mexico-U.S. Immigration: Effects of Wages and Border Enforce-ment.” The Review of Economic Studies 85 (4): 2353–2388. doi:10.1093/restud/rdx078.

Martinez, Daniel E. 2015. “Coyote use in an era of heightened border enforcement: Newevidence from the Arizona-Sonora border.” Journal of Ethnic and Migration Studies 42(1): 103–119. doi:10.1080/1369183X.2015.1076720.
Massey, Douglas S., Jorge Durand, and Karen A. Pren. 2016. “Why Border EnforcementBackfired.” American Journal of Sociology 121 (5): 1557–1600. doi:10.1086/684200.
Micallef, Mark, and Tuesday Reitano. 2017. The anti-human smuggling business and Libya’spolitical end game. Geneva: Institute for Security Studies / The Global Initiative againstTransnational Organised Crime. https ://globalinitiative .net/wp- content/uploads/2018/01/Libya ISS Smuggling.pdf.
Michael, Maggie. 2017. “Backed by Italy, Libya enlists militias to stop migrants.” AP News(August 29). https://www.apnews.com/9e808574a4d04eb38fa8c688d110a23d.
Papadopoulou, Aspasia, Elisa Maimone, Vicky Tsipoura, and Katerina Drakopoulou. 2016.The Implementation of the hotspots in Italy and Greece. Brussels: ECRE, May.
Przepiorka, Wojtek, Lukas Norbutas, and Rense Corten. 2017. “Order without Law: Reputa-tion Promotes Cooperation in a Cryptomarket for Illegal Drugs.” European SociologicalReview 33 (6): 752–764. doi:10.1093/esr/jcx072.
Raleigh, Clionadh, Andrew Linke, H̊avard Hegre, and Joakim Karlsen. 2010. “IntroducingACLED: An Armed Conflict Location and Event Dataset.” Journal of Peace Research47, no. 5 (September): 651–660. doi:10.1177/0022343310378914.
Triandafyllidou, Anna. 2018. “Migrant Smuggling: Novel Insights and Implications for Migra-tion Control Policies.” The ANNALS of the American Academy of Political and SocialScience 676 (1): 212–221. doi:10.1177/0002716217752330.
UNHCR. 2019. Mediterranean Situation, Operational Portal: Refugee Situations. AccessedApril 30, 2019. https://data2.unhcr.org/en/situations/mediterranean.
Walsh, Declan, and Jason Horowitz. 2017. “Italy, Going It Alone, Stalls the Flow of Migrants.But at What Cost?” New York Times (September 17). Accessed April 24, 2019. https://www.nytimes.com/2017/09/17/world/europe/italy-libya-migrant-crisis.html.
Wintour, Patrick. 2017. “Italy’s deal to stem flow of people from Libya in danger of collapse.”The Guardian (October 3). https://www.theguardian.com/world/2017/oct/03/italys-deal-to-stem-flow-of-people-from-libya-in-danger-of-collapse.
Online Appendix
Table SI-1: Impact of alternative types of violence and sea condi-tions on migrant flows to Italy
(1) (2) (3) (4)Riots 0.503∗∗ 0.411∗
(0.200) (0.220)Violence Against Local Civilians 0.439∗ 0.265
(0.260) (0.289)Rebel-Government Violence 0.0793 0.00240
(0.179) (0.171)Wave Height -2.542∗∗∗ -2.533∗∗∗ -2.556∗∗∗ -2.522∗∗∗
(0.364) (0.362) (0.368) (0.368)Model Spec.Outcome Arrivals Arrivals Arrivals ArrivalsMonth of year FE Yes Yes Yes YesDay of week FE Yes Yes Yes YesDriscoll-Kraay SE Yes Yes Yes YesNumber of Observations 812 812 812 812R2 0.0802 0.0762 0.0701 0.0822
Notes: Outcome of interest is the daily total of migrants arriving in Italy (ln) (Columns1-4). Driscoll-Kraay temporal autocorrelation robust standard errors (clustered by 14day windows) are reported. Stars indicate *** p < 0.01, ** p < 0.05, * p < 0.1.
SI-1 (Online Publication Only)