hrl forest - copernicus land monitoring service
TRANSCRIPT

Copernicus Land Monitoring Service –
High Resolution Layer Forest
Product Specifications
land.copernicus.eu
HRL Forest Product Specifications Document Page 1
Copernicus Land Monitoring Service – High Resolution Layer Forest:
Product Specifications Document
Title Copernicus Land Monitoring Service – High Resolution Layer Forest: Product Specifications Document
Creator Tobias LANGANKE
Creation date 2017-03-15
Subject Definitions and product specifications of Copernicus High Resolution Layer Forest products
Status Final
Publisher Copernicus team at EEA
Type Text
Description This document contains detailed product definitions and specifications for the pan-European Copernicus High Resolution Layer Forest. It was created in close collaboration and with contributions from the implementing service providers in a consultative process.
Contributor David HERRMANN (GAF AG), Gernot RAMMINGER (GAF AG), Giovanni BUZZO (GAF AG), Fabian BERNDT (GAF AG)
Format Microsoft Word document
Source European Environment Agency and HRL Forest service providers
Rights European Environment Agency
Identifier This is version 11 of 2018-08-14
Language EN
Relation Copernicus regulation
Coverage 2018

HRL Forest Product Specifications Document Page 2
TABLE OF CONTENTS
Page
1. Background .................................................................................................................................... 5
2. Product Overview .......................................................................................................................... 5
2.1 Tree Cover Density (TCD) ...................................................................................................... 7
2.2 Dominant Leaf Type (DLT) .................................................................................................... 9
2.3 Forest Type (FTY)................................................................................................................. 10
2.3.1 Forest Additional Support Layer (FADSL) ................................................................... 12
2.4 Change Products .................................................................................................................... 13
2.4.1 Dominant Leaf Type Change (DLTC) ........................................................................... 13
2.4.2 Tree Cover Density Change (TCDC)............................................................................. 13
3. Data Used for HRL Forest Generation ........................................................................................ 14
4. File Naming Convention .............................................................................................................. 15
5. INSPIRE Metadata and Mapping Tables ..................................................................................... 19
6. Thematic Accuracy ...................................................................................................................... 19
Annex I: File Format and Delivery Details Specification .................................................................... 20
Annex II: Detailed Product Specifications........................................................................................... 21
Annex III: Colour Palettes ................................................................................................................... 29
Annex IV: Derivation of the 20m Forest Type Layer .......................................................................... 32
Annex V: FADSL Products 2012/2015 ............................................................................................... 33
Annex VI: Aggregation Rules to 100m Products ................................................................................ 35
Annex VII: Derivation of Change Products ......................................................................................... 37

HRL Forest Product Specifications Document Page 3
LIST OF FIGURES Page
Figure 1: HRL Forest Product Portfolio .................................................................................................. 5
Figure 2: Ideal-typical illustration of the Tree Cover Density product .................................................. 7
Figure 3: Pan-European illustration of the Tree Cover Density 2015 .................................................... 9
Figure 4: Pan-European illustration of the Dominant Leaf Type 2015 ................................................ 10
Figure 5: Pan-European illustration of the Forest Type 2015 .............................................................. 11
LIST OF TABLES Page
Table 1: Overview on HRL Forest raster products ................................................................................. 6
Table 2: LC/LU elements to be included/excluded in the Tree Cover Mask ......................................... 8
Table 3: List of ancillary datasets used in HRL Forest production ....................................................... 14
Table 4: File naming descriptors for HRL products .............................................................................. 16
Table 5: Example of a Coordinate Reference System Sheet ................................................................ 20
Table 6: FADSL: Hierarchical intersection of input layers and resulting thematic classes .................. 34
HRL Forest Product Specifications Document Page 4
LIST OF ACRONYMS CLC CORINE Land Cover
CLMS Copernicus Land Monitoring Service
CRS Coordinate Reference System
DLT Dominant Leaf Type
DLTC Dominant Leaf Type Change
DWH Data Warehouse
EEA European Environment Agency
EO Earth Observation
EPSG European Petroleum Survey Group
ESA European Space Agency
FADSL Forest Additional Support Layer
FAO Food and Agriculture Organization of the United Nations
FRA Forest Resources Assessment
FTY Forest Type
GIO GMES Initial Operations
GIS Geographic Information System
HR High Resolution
HRL High Resolution Layer
IMD Impervious Degree
INSPIRE INfrastructure for SPatial InfoRmation in Europe
LAEA Lambert Azimuthal Equal Area Projection
LUCAS Land Use and Coverage Area frame Survey
MMU Minimum Mapping Unit
MMW Minimum Mapping Width
MSGI Metadata Standard for Geographic Information
QC Quality Control
SVM Support Vector Machine
TCD Tree Cover Density
TCDC Tree Cover Density Change
TCM Tree Cover Mask
USGS United States Geological Survey
VHR Very High Resolution

HRL Forest Product Specifications Document Page 5
1. Background
This document captures the detailed definitions and product specifications for the High Resolution Layer (HRL) Forest products as part of the Copernicus Land Monitoring Service (CLMS), coordinated by the European Environment Agency (EEA). The document evolved during the production period as a specification document, and was then adopted for the final users of the datasets. The HRL Forest with reference year 2015 (± 1 year) has been fully produced in the European
Terrestrial Reference System 1989 (ETRS89) and in Lambert Azimuthal Equal Area (LAEA) projection
with one harmonised set of products (no split in different service elements and geographic lots) by a
consortium of well-established European service providers. For the first time, the product portfolio
includes a set of new change products at pan-European scale. Multitemporal satellite data in 20m
spatial resolution, mainly Sentinel-2A data from the European Space Agency (ESA) as well as Landsat
8 data from the United States Geological Survey (USGS), represent the primary input data source for
the 2015 products. Additionally, the 2015 production includes the correction and re-processing of the
historical 2012 HRL Forest products to allow a full harmonisation across Europe. The two primary
status layers Dominant Leaf Type (DLT) and Tree Cover Density (TCD) at 20m spatial resolution are
sharing the same spatial extent and provide information on the leaf type (broadleaved /coniferous)
and the proportional tree cover at pixel level. This allows users to apply a (national) forest definition,
taking any canopy crown cover into account, which fits best to their specific needs.
2. Product Overview
Figure 1 summarizes the limited amount of products in the GMES Initial Operations (GIO) phase 2012,
and the new products in the frame of the 2015 reference year production. New are in particular the
separation between the pixel-based Dominant Leaf Type (DLT) and the Forest Type (FTY) following a
forest definition, and new change products, namely the Dominant Leaf Type Change (DLTC) as well
as the Tree Cover Density Change (TCDC).
Table 1 provides an overview of the HRL Forest raster products in a tabular way.

HRL Forest Product Specifications Document Page 6
Table 1: Overview on HRL Forest raster products
No Product
name
Rfr.
year Abbreviation
Pixel
size MMU
TCD
threshold Classified feature
1 Tree Cover
Density 2015 2015 TCD_2015_020m 20m N/A N/A
Tree cover; tree cover density
from 1-100%
2
Dominant
Leaf Type
2015
2015 DLT_2015_020m 20m N/A N/A Dominant leaf type:
broadleaved or coniferous
3 Forest Type
2015 2015 FTY_2015_020m 20m 0.5 ha 10%
Forest Type:
broadleaved or coniferous,
largely following the FAO
forest definition
4
Forest
Additional
Support
Layer 2015
2015 FADSL_2015_020 20m N/A 10%
Trees in urban context, trees
predominantly used for
agricultural practices
5 Tree Cover
Density 2015 2015 TCD_2015_100m 100m N/A N/A
Aggregated tree cover; tree
cover density from 1-100%
6 Forest Type
2015 2015 FTY_2015_100m 100m N/A 10%
Aggregated Forest Type
(broadleaved, coniferous,
mixed), following the FAO
forest definition
7 Tree Cover
Density 2012 2012 TCD_2012_020m 20m N/A N/A
Tree cover; tree cover density
from 1-100%
8
Dominant
Leaf Type
2012
2012 DLT_2012_020m 20m N/A N/A Dominant leaf type:
broadleaved or coniferous
9 Forest Type
2012 2012 FTY_2012_020m 20m 0.5 ha 10%
Forest Type:
broadleaved or coniferous,
largely following the FAO
forest definition
10
Forest
Additional
Support
Layer 2012
2012 FADSL_2012_020m 20m N/A 10%
Trees in urban context, trees
predominantly used for
agricultural practices
11 Tree Cover
Density 2012 2012 TCD_2012_100m 100m N/A N/A
Aggregated tree cover; tree
cover density from 1-100%
12 Forest Type
2012 2012 FTY_2012_100m 100m N/A 10%
Aggregated Forest Type
(broadleaved, coniferous,
mixed), following the FAO
forest definition
13
Tree Cover
Density
Change
2012-
2015 TCDC_1215_100m 100m N/A 30%
Tree cover density changes
between two reference years
HRL Forest Product Specifications Document Page 7
No Product
name
Rfr.
year Abbreviation
Pixel
size MMU
TCD
threshold Classified feature
14
Dominant
Leaf Type
Change
2012-
2015 DLTC_1215_020m 20m 0.5 ha 30%
Various possible leaf type
changes between two
reference years
In the following, definitions for the primary status layers Tree Cover Density and Dominant Leaf Type
as well as of the secondary status layer Forest Type and associated change layers will be given.
Detailed product specifications are provided in Annex II.
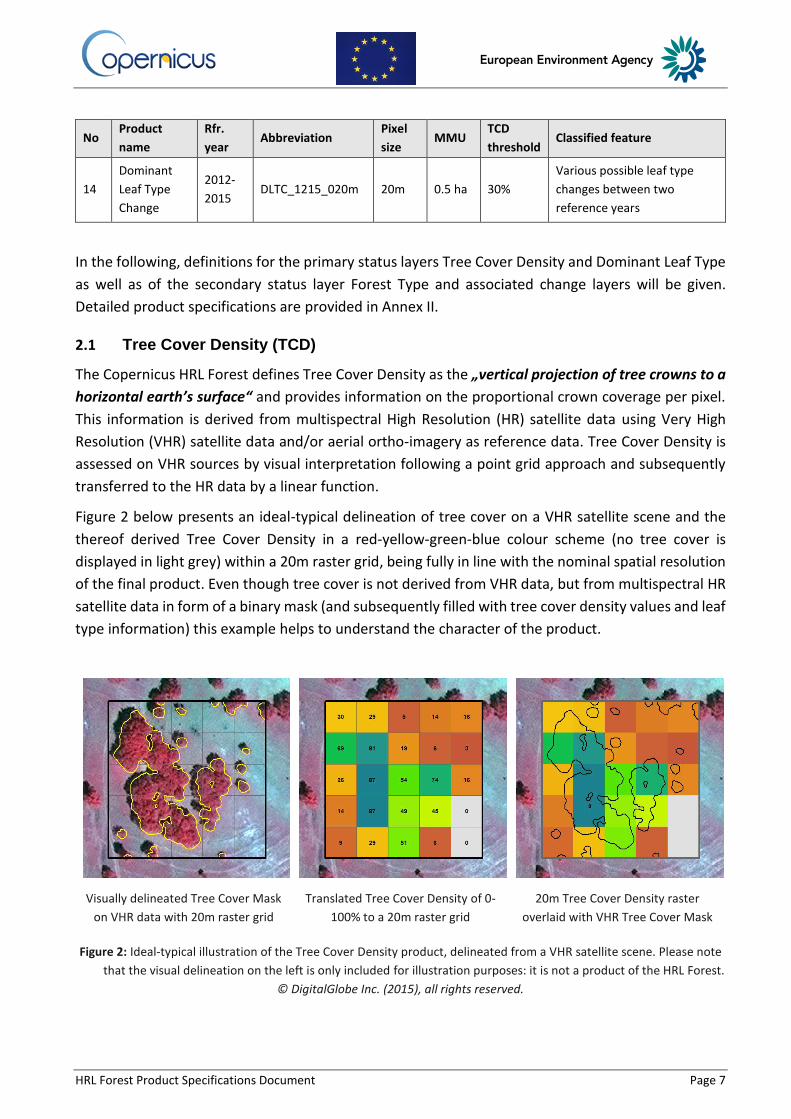
2.1 Tree Cover Density (TCD)
The Copernicus HRL Forest defines Tree Cover Density as the „vertical projection of tree crowns to a
horizontal earth’s surface“ and provides information on the proportional crown coverage per pixel.
This information is derived from multispectral High Resolution (HR) satellite data using Very High
Resolution (VHR) satellite data and/or aerial ortho-imagery as reference data. Tree Cover Density is
assessed on VHR sources by visual interpretation following a point grid approach and subsequently
transferred to the HR data by a linear function.
Figure 2 below presents an ideal-typical delineation of tree cover on a VHR satellite scene and the
thereof derived Tree Cover Density in a red-yellow-green-blue colour scheme (no tree cover is
displayed in light grey) within a 20m raster grid, being fully in line with the nominal spatial resolution
of the final product. Even though tree cover is not derived from VHR data, but from multispectral HR
satellite data in form of a binary mask (and subsequently filled with tree cover density values and leaf
type information) this example helps to understand the character of the product.
Figure 2: Ideal-typical illustration of the Tree Cover Density product, delineated from a VHR satellite scene. Please note
that the visual delineation on the left is only included for illustration purposes: it is not a product of the HRL Forest.
© DigitalGlobe Inc. (2015), all rights reserved.
Visually delineated Tree Cover Mask
on VHR data with 20m raster grid
Translated Tree Cover Density of 0-
100% to a 20m raster grid
20m Tree Cover Density raster
overlaid with VHR Tree Cover Mask

HRL Forest Product Specifications Document Page 8
Table 2 provides an overview of the Land Cover (LC) and Land Use (LU) features that shall be included
or excluded in the “tree cover” mapping, if detectable from the satellite imagery. The resulting binary
Tree Cover Mask (TCM) has been semi-automatically enhanced by means of various processing steps
and subsequently filled with the relevant information on Tree Cover Density. This is done using a
multiple linear regression estimator correlating the assessed Tree Cover Density (VHR-based) with
the spectral reflection values of the best available underlying HR satellite scene. Tree Cover Density
shows a natural sensitivity towards phenology and radiometric influences (e.g. haze). Consequently,
the magnitude of tree cover density values strongly relies on the availability and quality of adequate
satellite data and reference data.
Table 2: LC/LU elements to be included/excluded in the Tree Cover Mask
Elements to be included in the tree covered area
(if tree cover can be detected from the 20m imagery)
Elements to be excluded from tree covered area
(if no tree cover can be detected from the 20m imagery)
Evergreen/deciduous broadleaved, sclerophyllous and coniferous trees of any use
Forests (grown-up and under development)
Orchards, olive groves, fruit and other tree plantations, agro-forestry areas
Transitional woodland, forests in regeneration
Groups of trees within urban areas (alleys, wooded parks and gardens)
Forest management/use features inside forests (forest roads, firebreaks, thinnings, forest nurseries, etc.)
Forest damage features inside forests (partially burnt areas, storm damages, insect-infested damages, etc.)
Open areas within forests (roads, permanently open vegetated areas, clear cuts, fully burnt areas, other severe forest damage areas, etc.)
Dwarf shrub-covered areas, such as moors and heathland
Vineyards
Dwarf pine / green alder in alpine areas
Mediterranean shrublands (macchia, garrigue etc.)
Shrubland
The Tree Cover Density represents one of the primary status layers of the HRL Forest product portfolio
and has the following main specifications:
20m spatial resolution
Tree Cover Density range of 0-100%
No Minimum Mapping Unit (MMU); pixel-based
Minimum Mapping Width (MMW) of 20m
Monotemporal coverage
In particular, information on crown cover, which is provided with the continuous-scale (0-100%) Tree
Cover Density product for the whole of Europe (see Figure 3), can be generally used by different
countries, even if different national forest definition regards the crown/canopy cover exist (e.g.
Austria with 3%, Spain with 5%). In this sense, the TCD product largely supports the user-specific
derivation of forest-related products according to the European-wide different understandings of
forest.
HRL Forest Product Specifications Document Page 9
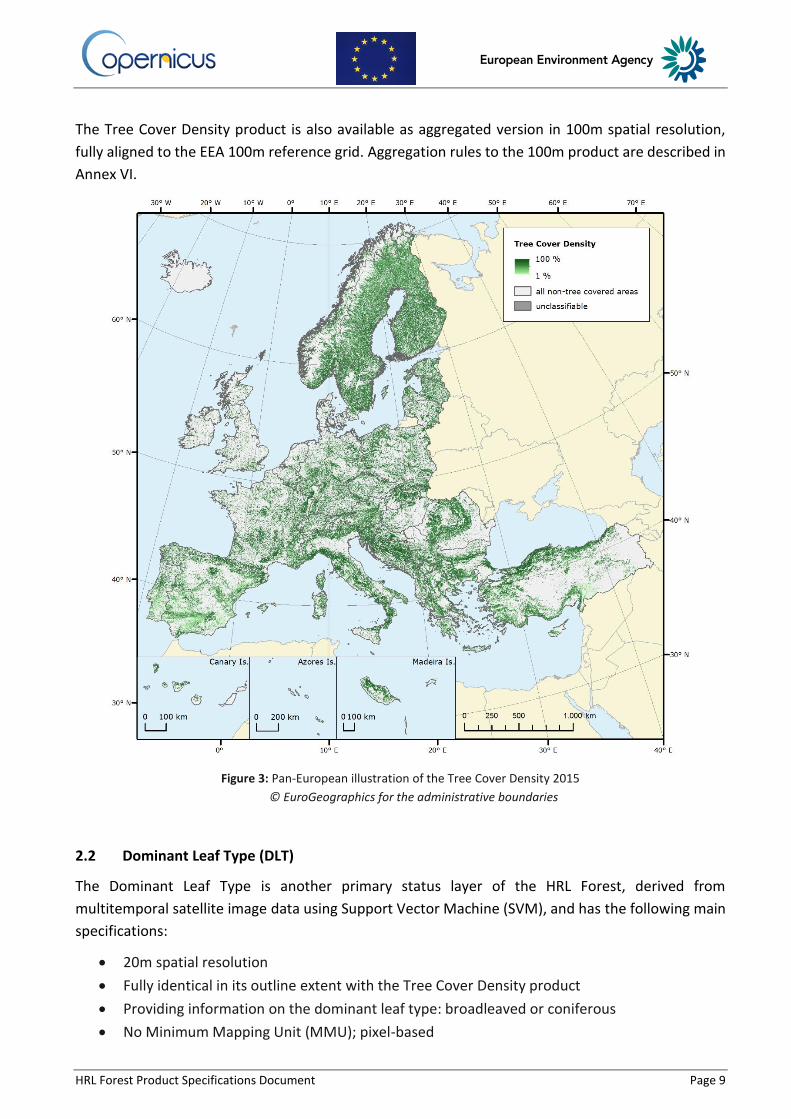
The Tree Cover Density product is also available as aggregated version in 100m spatial resolution,
fully aligned to the EEA 100m reference grid. Aggregation rules to the 100m product are described in
Annex VI.
Figure 3: Pan-European illustration of the Tree Cover Density 2015
© EuroGeographics for the administrative boundaries
2.2 Dominant Leaf Type (DLT)
The Dominant Leaf Type is another primary status layer of the HRL Forest, derived from
multitemporal satellite image data using Support Vector Machine (SVM), and has the following main
specifications:
20m spatial resolution
Fully identical in its outline extent with the Tree Cover Density product
Providing information on the dominant leaf type: broadleaved or coniferous
No Minimum Mapping Unit (MMU); pixel-based

HRL Forest Product Specifications Document Page 10
Minimum Mapping Width (MMW) of 20m
Multitemporal coverage
Figure 4: Pan-European illustration of the Dominant Leaf Type 2015
© EuroGeographics for the administrative boundaries
In combination with the Tree Cover Density product, the Dominant Leaf Type is suitable to serve
various national forest definitions.
2.3 Forest Type (FTY)
With the Forest Type product the HRL Forest already provides one type of forest products following
a forest definition. Contrary to the Tree Cover Density product non-forest trees are excluded
following the forest definition of the Food and Agriculture Organization (FAO). This is e.g. specified in
the terms and definitions of the Global Forest Resources Assessment (FRA) Working Paper 1, which
is accessible online via www.fao.org/docrep/006/ad665e/ad665e06.htm. The forest definition of the
FAO includes and excludes the following features/elements:

HRL Forest Product Specifications Document Page 11
Includes (FAO): forest nurseries and seed orchards that constitute an integral part of the forest; as
well as forest roads, cleared tracts, firebreaks and other small open areas < 0.5 ha and/or < 20m
width. Forest in national parks, nature reserves and other protected areas such as those of specific
scientific, historical, cultural or spiritual interest; windbreaks and shelterbelts of trees with an area of
more than 0.5 ha and width of more or equal than 20m; plantations primarily used for forestry
purposes, including cork oak stands.
Excludes (FAO): land predominantly used for agricultural practices. In this sense fruit trees and olive
groves are also excluded. Gardens and urban parks are also not considered as forest.
Figure 5: Pan-European illustration of the Forest Type 2015
© EuroGeographics for the administrative boundaries
The 20m Forest Type products are produced applying a minimum „Forest“ definition, largely following
the FAO definition, whereas tree cover in traditional agroforestry systems such as Dehesa / Montado
is explicitly included for EEA purposes. The product is derived through a spatial intersection of the

HRL Forest Product Specifications Document Page 12
two primary status layers Tree Cover Density and Dominant Leaf Type and has the following main
specifications:
20m spatial resolution
Tree Cover Density range of ≥10-100%
Minimum Mapping Unit (MMU; minimum number of pixels to form a patch) of 0.52 ha (equivalent to 13 pixels); applicable both for tree-covered areas and for non-tree-covered areas in a 4-pixel connectivity mode, but not for the distinction of dominant leaf type within the tree-covered area for which no such minimum is set. The potentially available leaf type information for areas below 10% density within non-forest patches smaller the MMU is explicitly kept from the pixel-based DLT product to ensure consistency.
Minimum Mapping Width (MMW) of 20m
The relevant processing steps to derive the 20m Forest Type product are described in Annex IV.
In order to separate real “forest” areas from non-forest areas (i.e. trees predominantly used for
agricultural practices, trees in an urban context), an additional raster product is provided named
Forest Additional Support Layer. This 20m layer differentiates between forest areas and non-forest
areas using a specific labelling approach and is briefly described below.
The Forest Type product is also available as aggregated version in 100m spatial resolution, fully
aligned to the EEA 100m reference grid. Trees predominantly used for agricultural practices and trees
in urban context (as presented by the Forest Additional Support Layer) are explicitly excluded in the
aggregated version.
This means that the 20m FTY and 100m aggregated FTY product differ in that:
The 20m FTY product includes trees predominantly used for agricultural practices and trees
in urban context (as distinguished in the FADSL)
The 100m FTY product has those areas (trees predominantly used for agricultural practices
and trees in urban context), from the FADSL layer excluded.
2.3.1 Forest Additional Support Layer (FADSL)
The Forest Additional Support Layer (FADSL) provides information on trees under agricultural or
urban use by utilization of CORINE Land Cover (CLC) 2012 information and HRL Imperviousness
products 2012/2015. The layer is derived through a spatial intersection of the Forest Type product
with additional sources and has the following main specifications:
20m spatial resolution
Tree Cover Density range of ≥ 10-100%
No Minimum Mapping Unit (MMU); pixel-based
Minimum Mapping Width (MMW) of 20m
Providing information on:
o trees predominantly used for agricultural practices – broadleaved (from CLC)
o trees in urban context – broadleaved and coniferous (from CLC)
o trees in urban context – broadleaved and coniferous (from HRL Imperviousness)

HRL Forest Product Specifications Document Page 13
A detailed description of the Forest Additional Support Layer is given in Annex V.
2.4 Change Products
The HRL Forest product portfolio includes for the first time dedicated change products. Both change
products cover the time period between the 2012 and 2015 reference years and are briefly described
in the sections below. Detailed product specifications are provided in Annex II.
2.4.1 Dominant Leaf Type Change (DLTC)
The Dominant Leaf Type Change product is a pixel-based 20m layer covering the time period of 2012
(+/- 1 year) to 2015 (+/- 1 year). It is derived by dedicated GIS operations of the primary status layers
Tree Cover Density and Dominant Leaf Type for both time steps. It includes 14 thematic classes,
thereof 10 change classes. The layer has a “noise” filter applied to address geometric, radiometric as
well as phenological differences between the reference years 2012/2015 using a 30% density
threshold and a 1 ha boundary filter. Changes in the tree cover extent and leaf type are indicated, if
the difference between TCD 2012 and 2015 products is exceeded by the defined significance
threshold of 30%, whilst considering a Minimum Mapping Unit of 1 ha. Due to its complexity and the
fundamentally different data baseline of the 2012 and 2015 status layers, this product has actually a
more experimental character.
The Dominant Leaf Type Change product has the following main specifications:
20m spatial resolution
Tree Cover Density range of 0-100%
Tree Cover Density significance difference threshold of 30%
Boundary filter of 1 ha (25 pixels) to address geometric differences
Minimum Mapping Unit (MMU) of 1 ha (25 pixels) for change classes
2.4.2 Tree Cover Density Change (TCDC)
The Tree Cover Density Change product is a pixel-based 100m layer based on the aggregated TCD
status layers 2012 and 2015. It summarizes the extent and magnitude of tree cover density increases
and decreases over time. A filtering approach with a 30% density significance threshold has been
applied to differentiate between “noise” and the expected real change between both time steps.
Changes in the magnitude of tree cover density will be derived, if the difference between TCD 2012
and 2015 products is exceeded by the defined significance threshold of 30%.
The Tree Cover Density Change product has the following main specifications:
100m spatial resolution
Tree Cover Density range of -30 to -100% and +30 to +100%
Tree Cover Density significance difference threshold of 30%
No Minimum Mapping Unit (MMU); pixel-based

HRL Forest Product Specifications Document Page 14
3. Data Used for HRL Forest Generation
A variety of high to very high resolution satellite data with multiple spatial resolutions were utilized
for the production of the Forest layers. These include primarily multispectral time series of Sentinel-
2A from the Copernicus programme and Landsat 8 from the Landsat programme, both resampled to
20m spatial resolution. These sources were complemented by the SPOT-5 and ResourceSat-2 satellite
data of the HR_IMAGE_2015 dataset, available in 20m spatial resolution. For the reference sampling
of Tree Cover Density values and the creation of an European-wide HRL Forest Reference Database,
the VHR_IMAGE_2015 dataset provided by the ESA Data Warehouse (DWH) was of vital importance.
For the correction and re-processing of the historical HRL Forest 2012 products, the pan-European
ESA DWH datasets DWH_MG2_CORE_01 (HR_IMAGE_2012) and DWH_MG2b_CORE_03 also
referred to as VHR_IMAGE_2012 have been used.
Besides the EO data, a series of available ancillary datasets proved to be suitable to support training
sample selection, plausibility checks and final Quality Control (QC) steps. Table 3 provides an overview
on the utilized data.
Table 3: List of ancillary datasets used in HRL Forest production
Dataset Characteristics
VHR_IMAGE_2015 Resolution: 0.3m to 1.0m
Coverage: EEA-39
VHR_IMAGE_2012 Resolution: 1.5m to 2.5m
Coverage: EEA-39
National Ortho-Imagery Web Map Services (e.g. Poland)
Resolution: 0.1m to 0.5m
Coverage: national
HRL Tree Cover Density 2012 Resolution: 20m
Coverage: EEA-39
HRL Forest Type 2012 Resolution: 20m
Coverage: EEA-39
HRL Impervious Degree 2012 & 2015 Resolution: 20m
Coverage: EEA-39
HRL Water & Wetness 2012 & 2015 Resolution: 20m
Coverage: EEA-39
HRL Grassland 2012 & 2015 Resolution: 20m
Coverage: EEA-39
JRC Forest Type Map 2006 Resolution: 25m
Coverage: EU-27 plus various cooperating countries
Global Forest Change 2000–2014 (Hansen et al. 2013) Resolution: 30m
Coverage: global
CORINE Land Cover 2012 v18.5.1 Thematic Land Cover data
Minimum Mapping Unit: 25 ha
Coverage: EEA-39
National thematic Land Cover maps (e.g. Sweden) Thematic Land Cover map
Minimum Mapping Unit: ≥1ha
Coverage: national
EuroBoundaryMap v11 Scale: 1:100,000
Coverage: Europe

HRL Forest Product Specifications Document Page 15
4. File Naming Convention
The proposed file naming convention will be applied both to raster and vector products for all High
Resolution Layer products. All letters except the THEME descriptor are in small (not capital) letters,
and no points (“.”) and/or minus (“-“) within file names. The file naming is based on the following
descriptors:
THEME YEAR RESOLUTION EXTENT EPSG VERSION
THEME:
3 letter abbreviation for main products (green)
4 letter abbreviation for change products (blue)
5 letter abbreviation for additional and expert products (orange)
REFERENCE YEAR
2012 and 2015 in four digits
Change products in four digits (e.g. 0609)
RESOLUTION
Four-digit (020m and 100m)
EXTENT
2-digit country code for country deliveries in national projection
“eu” for all deliveries in European Projection (partial and full lot mosaics)
EPSG
5-digit EPSG code (geodetic parameter dataset code by the European Petroleum Survey
Group), see http://www.epsg-registry.org/
e.g. “03035” for the European LAEA projection
VERSION
4-digit qualifier of the version number, starting with “V1_1” for a first full final version, and
allowing to capture re-processing/calculation of small changes as (“V1_2”, “V1_3” etc.). In
case of major changes a second version should be used (“V2_1”)

HRL Forest Product Specifications Document Page 16
Table 4: File naming descriptors for HRL products
Descriptor To be written as Meaning Comments
THEME TCD Tree Cover Density Three letter abbreviation for
main products DLT Dominant Leaf Type
FTY Forest Type
FADSL Forest Additional Support
Layer
DLTC Dominant Leaf Type Change
TCDC Tree Cover Density Change
TCDRP Tree Cover Density Reference
Product (Vector data)
Reference product: Vector
product with selected
100mx100m cells with density
information
TCDRG Tree Cover Density Reference
Grid
Reference product: Tree cover
point grid
NDVI Biophysical variables delivery Scene-based results
NDWI
REFERENCE YEAR 2012 Reference year 2012 (+/- 1
year)
2015 Reference year 2015 (+/- 1
year)
1215 Change 2012-2015
RESOLUTION 020m 20m spatial (pixel) resolution
100m 100m spatial (pixel) resolution
EXTENT al Albania 2-letter abbreviation for the
country (in national
projections), and “eu” for
deliveries in European
projection
at Austria
ba Bosnia and Herzegovina
be Belgium
bg Bulgaria
ch Switzerland
cy Cyprus
cz Czech Republic
de Germany
dk Denmark
ee Estonia
es Spain (including Andorra)
eu Europe (full lot mosaic)
fi Finland
fr France
gb United Kingdom
gf French Guiana
gp Guadeloupe
gr Greece

HRL Forest Product Specifications Document Page 17
Descriptor To be written as Meaning Comments
hr Croatia
hu Hungary
ie Ireland
im Isle of Man
is Iceland
it Italy
li Liechtenstein
lt Lithuania
lu Luxembourg
lv Latvia
me Montenegro
mk Macedonia, FYR of
mq Martinique
mt Malta
ni Northern Ireland
nl Netherlands
no Norway
pl Poland
pt Portugal
re Réunion
ro Romania
rs Serbia
se Sweden
si Slovenia
sk Slovakia
tr Turkey
xk Kosovo
yt Mayotte
EPSG e.g. 03035 ETRS89 LAEA
(European Projection)
5-digit EPSG code (geodetic
parameter dataset code by
the European Petroleum
Survey Group)
VERSION V1_1 First full final version 4-digit qualifier of the version
number, starting with “V1_1”
for a first full final version, and
allowing to capture re-
processing/calculation of
small changes as (“V1_2”,
“V1_3” etc.). In case of major
changes a second version
should be introduced
(“V2_1”).
V1_2 Re-delivery of first full final
version with small changes
V2_1 Second full final version
etc. etc.

HRL Forest Product Specifications Document Page 18
Examples and meaning of full product names for final products:
DLT_2015_020m_eu_03035_V1_1.tif
Dominant Leaf Type, 2015 reference year, 20m spatial resolution, pan-european product in European
projection (EPSG: 3035), first final version (fully accepted).
DLT_2015_020m_eu_03035_V1_2.tif
Dominant Leaf Type, 2015 reference year, 20m spatial resolution, pan-european product in European
projection (EPSG: 3035), first final version (fully accepted), second delivery after small changes.
DLT_2015_020m_fr_02154_V1_1.tif
Dominant Leaf Type, 2015 reference year, 20m spatial resolution, France mainland, national
projection (EPSG: 2154), first final version (fully accepted).

HRL Forest Product Specifications Document Page 19
5. INSPIRE Metadata and Mapping Tables
Metadata are provided together with the products as INSPIRE-compliant XML files according to the
EEA Metadata Standard for Geographic Information (EEA-MSGI). EEA-MSGI has been developed by
EEA to meet needs and demands for inter-operability of metadata. EEA’s standard for metadata is a
profile of the ISO 19115 standard for geographic metadata and contains more elements than the
minimum required to comply the INSPIRE metadata regulation. Detailed conceptual specifications on
EEA-MSGI and other relevant information on metadata can be found online at
http://www.eionet.europa.eu/gis.
INSPIRE mapping tables show the evidence that the products delivered are compatible with the
INSPIRE Data Specification on Land Cover. This evidence is provided as table document showing the
associations between the source (product/deliverable) and the target data model (INSPIRE Data
Specification on Land Cover). Mapping tables are provided together with the final products.
6. Thematic Accuracy
The general accuracy level of the primary 20m status layers Dominant Leaf Type and Tree Cover
Density of the HRL Forest is aimed to be in the order of 90 % (both, Producers and User’s Accuracy).
This accuracy should be reached for the pan-European mosaic. There will be two levels of accuracy
assessment:
a) internal assessment performed by the service providers and reported in the delivery report,
b) full independent validation of the full European mosaics to be performed after production.

HRL Forest Product Specifications Document Page 20
Annex I: File Format and Delivery Details Specification
Raster products are delivered as GeoTIFF (*.tif) with world file (*.tfw), pyramids (*.ovr), attribute
table (*.dbf) and statistics (*.aux.xml). Each product is accompanied with product-specific color tables
(*.clr & *.txt) and INSPIRE-compliant metadata in XML format and an INSPIRE Mapping Table.
In addition, a PDF providing Coordinate Reference System (CRS) information, including details of
parameters used to transform to ETRS89 LAEA projection as in the following example from Hungary
will be delivered. CRS information sheets will be static and named as follows:
CRS_Information_Sheet_<country 2-letter ISO code>, e.g. CRS_Information_Sheet_BG.pdf.
Table 5: Example of a Coordinate Reference System Sheet
National
Datum HD72 (EOV - Egységes Országos Vetületi rendszer)
type geodetic
valid area Hungary
Prime meridian Greenwich
longitude 0°
Ellipsoid IUGG GRS 1967 (International 1967)
semi major axis 6 378 160.0 m
inverse flattening 298.2471674
Projection Hotine Oblique Mercator (EOV proxy)
latitude of projection center 47°08'39.817392"
longitude of projection center 19°02'54.858408"
azimuth of initial line 90°00'00"
scale factor on initial line 0.99993
false easting 650 000 m
false northing 200 000 m
European
Datum ETRS89 (European Terrestrial Reference System 1989)
type geodetic
valid area Europe / EUREF
Prime meridian Greenwich
longitude 0°
Ellipsoid GRS 80 (New International)
semi major axis 6 378 137 m
inverse flattening 298.257222101
Projection Geographic (Ellipsoidal Coordinate System)
Datum shift parameters used
Operation
method
Bursa-Wolf (PositionVector)
geocentric X translation +52.684 m
geocentric Y translation -71.194 m
geocentric Z translation -13.975 m
rotation X-axis - 0.312"
rotation Y-axis - 0.1063"
rotation Z-axis - 0.3729"
correction of scale - 1.0191 ppm
HRL Forest Product Specifications Document Page 21
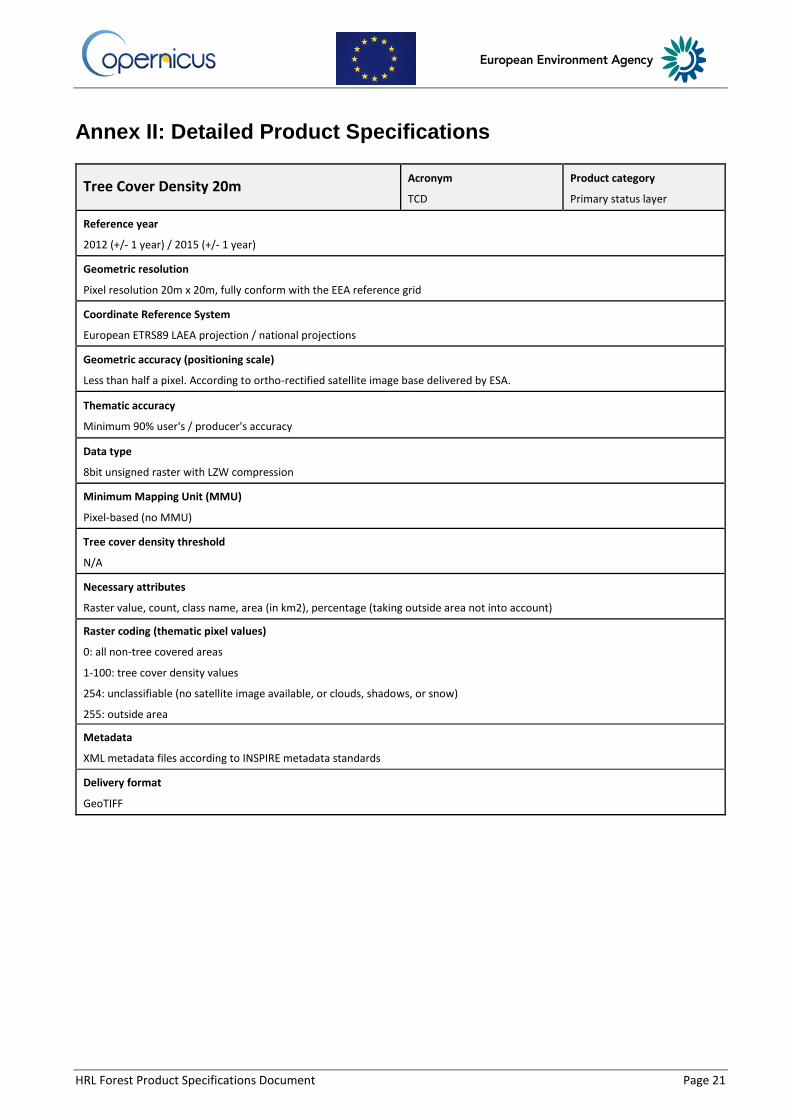
Annex II: Detailed Product Specifications
Tree Cover Density 20m Acronym
TCD
Product category
Primary status layer
Reference year
2012 (+/- 1 year) / 2015 (+/- 1 year)
Geometric resolution
Pixel resolution 20m x 20m, fully conform with the EEA reference grid
Coordinate Reference System
European ETRS89 LAEA projection / national projections
Geometric accuracy (positioning scale)
Less than half a pixel. According to ortho-rectified satellite image base delivered by ESA.
Thematic accuracy
Minimum 90% user's / producer's accuracy
Data type
8bit unsigned raster with LZW compression
Minimum Mapping Unit (MMU)
Pixel-based (no MMU)
Tree cover density threshold
N/A
Necessary attributes
Raster value, count, class name, area (in km2), percentage (taking outside area not into account)
Raster coding (thematic pixel values)
0: all non-tree covered areas
1-100: tree cover density values
254: unclassifiable (no satellite image available, or clouds, shadows, or snow)
255: outside area
Metadata
XML metadata files according to INSPIRE metadata standards
Delivery format
GeoTIFF

HRL Forest Product Specifications Document Page 22
Dominant Leaf Type 20m Acronym
DLT
Product category
Primary status layer
Reference year
2012 (+/- 1 year) / 2015 (+/- 1 year)
Geometric resolution
Pixel resolution 20m x 20m, fully conform with the EEA reference grid
Coordinate Reference System
European ETRS89 LAEA projection / national projections
Geometric accuracy (positioning scale)
Less than half a pixel. According to ortho-rectified satellite image base delivered by ESA.
Thematic accuracy
Minimum 90% user's / producer's accuracy for both, broadleaved and coniferous class
Data type
8bit unsigned raster with LZW compression
Minimum Mapping Unit (MMU)
Pixel-based (no MMU)
Tree cover density threshold
N/A
Necessary attributes
Raster value, count, class name, area (in km2), percentage (taking outside area not into account)
Raster coding (thematic pixel values)
0: all non-tree covered areas
1: broadleaved trees
2: coniferous trees
254: unclassifiable (no satellite image available, or clouds, shadows, or snow)
255: outside area
Metadata
XML metadata files according to INSPIRE metadata standards
Delivery format
GeoTIFF

HRL Forest Product Specifications Document Page 23
Forest Type 20m Acronym
FTY
Product category
Secondary status layer
Reference year
2012 (+/- 1 year) / 2015 (+/- 1 year)
Geometric resolution
Pixel resolution 20m x 20m, fully conform with the EEA reference grid
Coordinate Reference System
European ETRS89 LAEA projection
Geometric accuracy (positioning scale)
Less than half a pixel. According to ortho-rectified satellite image base delivered by ESA.
Thematic accuracy
Determined by the accuracy of the source Tree Cover Density and Dominant Leaf Type in 20m spatial resolution.
Data type
8bit unsigned raster with LZW compression
Minimum Mapping Unit (MMU)
0.52 ha (13 pixels)
Tree cover density threshold
10%
Necessary attributes
Raster value, count, class name, area (in km2), percentage (taking outside area not into account)
Raster coding (thematic pixel values)
0: all non-forest areas
1: broadleaved forest
2: coniferous forest
254: unclassifiable (no satellite image available, or clouds, shadows, or snow)
255: outside area
Metadata
XML metadata files according to INSPIRE metadata standards
Delivery format
GeoTIFF

HRL Forest Product Specifications Document Page 24
Forest Type Additional Support Layer 20m Acronym
FADSL
Product category
Derived layer
Reference year
2012 (+/- 1 year) / 2015 (+/- 1 year)
Geometric resolution
Pixel resolution 20m x 20m, fully conform with the EEA reference grid
Coordinate Reference System
European ETRS89 LAEA projection
Geometric accuracy (positioning scale)
Less than half a pixel. According to ortho-rectified satellite image base delivered by ESA.
Thematic accuracy
Determined by the accuracy of the source Forest Type, Imperviousness Degree and CLC in 20m spatial resolution.
Data type
8bit unsigned raster with LZW compression
Minimum Mapping Unit (MMU)
Pixel-based (no MMU)
Tree cover density threshold
10%
Necessary attributes
Raster value, count, class name, area (in km2), percentage (taking outside area not into account)
Raster coding (thematic pixel values)
0: all non-tree areas, and tree cover without urban context or agricultural use
3: trees predominantly used for agricultural practices – broadleaved (from CLC2012)
4: trees in urban context – broadleaved and coniferous (from IMD2012 / IMD2015)
5: trees in urban context – broadleaved and coniferous (from CLC2012)
254: unclassifiable (no satellite image available, or clouds, shadows, or snow)
255: outside area
Metadata
XML metadata files according to INSPIRE metadata standards
Delivery format
GeoTIFF

HRL Forest Product Specifications Document Page 25
Tree Cover Density 100m Acronym
TCD
Product category
Aggregated status layer
Reference year
2012 (+/- 1 year) / 2015 (+/- 1 year)
Geometric resolution
Pixel resolution 100m x 100m, fully conform with the EEA reference grid
Coordinate Reference System
European ETRS89 LAEA projection
Geometric accuracy (positioning scale)
Less than half a pixel. According to ortho-rectified satellite image base delivered by ESA.
Thematic accuracy
Determined by the accuracy of the source Tree Cover Density in 20m spatial resolution.
Data type
8bit unsigned raster with LZW compression
Minimum Mapping Unit (MMU)
Pixel-based (no MMU)
Tree cover density threshold
N/A
Necessary attributes
Raster value, count, class name, area (in km2), percentage (taking outside area not into account)
Raster coding (thematic pixel values)
0: all non-tree covered areas
1-100: tree cover density values
254: unclassifiable (no satellite image available, or clouds, shadows, or snow)
255: outside area
Metadata
XML metadata files according to INSPIRE metadata standards
Delivery format
GeoTIFF
HRL Forest Product Specifications Document Page 26
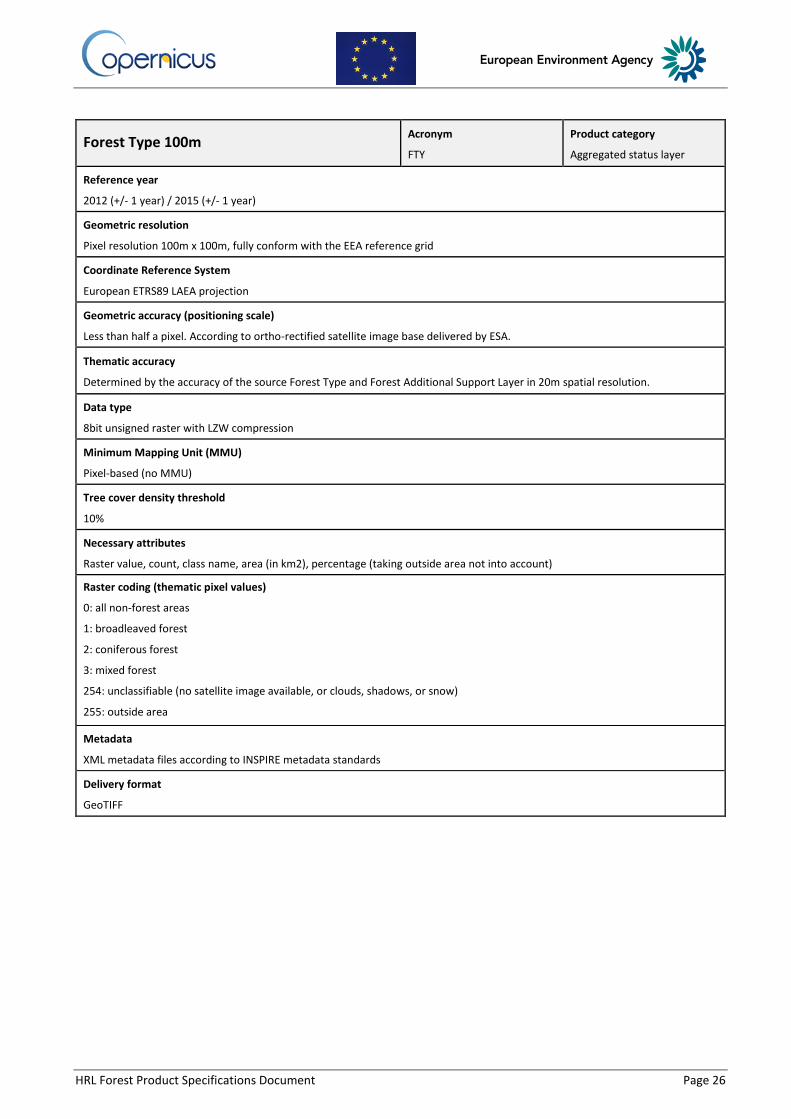
Forest Type 100m Acronym
FTY
Product category
Aggregated status layer
Reference year
2012 (+/- 1 year) / 2015 (+/- 1 year)
Geometric resolution
Pixel resolution 100m x 100m, fully conform with the EEA reference grid
Coordinate Reference System
European ETRS89 LAEA projection
Geometric accuracy (positioning scale)
Less than half a pixel. According to ortho-rectified satellite image base delivered by ESA.
Thematic accuracy
Determined by the accuracy of the source Forest Type and Forest Additional Support Layer in 20m spatial resolution.
Data type
8bit unsigned raster with LZW compression
Minimum Mapping Unit (MMU)
Pixel-based (no MMU)
Tree cover density threshold
10%
Necessary attributes
Raster value, count, class name, area (in km2), percentage (taking outside area not into account)
Raster coding (thematic pixel values)
0: all non-forest areas
1: broadleaved forest
2: coniferous forest
3: mixed forest
254: unclassifiable (no satellite image available, or clouds, shadows, or snow)
255: outside area
Metadata
XML metadata files according to INSPIRE metadata standards
Delivery format
GeoTIFF
HRL Forest Product Specifications Document Page 27
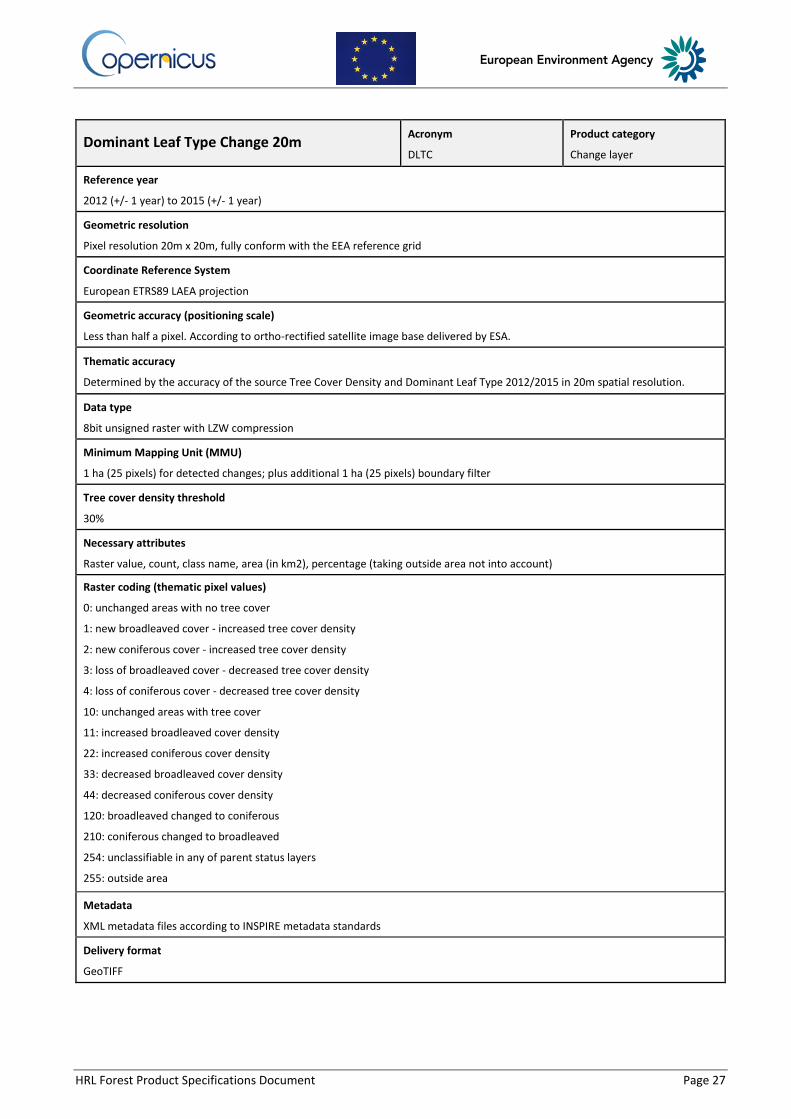
Dominant Leaf Type Change 20m Acronym
DLTC
Product category
Change layer
Reference year
2012 (+/- 1 year) to 2015 (+/- 1 year)
Geometric resolution
Pixel resolution 20m x 20m, fully conform with the EEA reference grid
Coordinate Reference System
European ETRS89 LAEA projection
Geometric accuracy (positioning scale)
Less than half a pixel. According to ortho-rectified satellite image base delivered by ESA.
Thematic accuracy
Determined by the accuracy of the source Tree Cover Density and Dominant Leaf Type 2012/2015 in 20m spatial resolution.
Data type
8bit unsigned raster with LZW compression
Minimum Mapping Unit (MMU)
1 ha (25 pixels) for detected changes; plus additional 1 ha (25 pixels) boundary filter
Tree cover density threshold
30%
Necessary attributes
Raster value, count, class name, area (in km2), percentage (taking outside area not into account)
Raster coding (thematic pixel values)
0: unchanged areas with no tree cover
1: new broadleaved cover - increased tree cover density
2: new coniferous cover - increased tree cover density
3: loss of broadleaved cover - decreased tree cover density
4: loss of coniferous cover - decreased tree cover density
10: unchanged areas with tree cover
11: increased broadleaved cover density
22: increased coniferous cover density
33: decreased broadleaved cover density
44: decreased coniferous cover density
120: broadleaved changed to coniferous
210: coniferous changed to broadleaved
254: unclassifiable in any of parent status layers
255: outside area
Metadata
XML metadata files according to INSPIRE metadata standards
Delivery format
GeoTIFF

HRL Forest Product Specifications Document Page 28
Tree Cover Density Change 100m Acronym
TCDC
Product category
Change layer
Reference year
2012 (+/- 1 year) to 2015 (+/- 1 year)
Geometric resolution
Pixel resolution 100m x 100m, fully conform with the EEA reference grid
Coordinate Reference System
European ETRS89 LAEA projection
Geometric accuracy (positioning scale)
Less than half a pixel. According to ortho-rectified satellite image base delivered by ESA.
Thematic accuracy
Determined by the accuracy of the source Tree Cover Density 2012/2015 in 20m spatial resolution.
Data type
16bit signed raster with LZW compression
Minimum Mapping Unit (MMU)
Pixel-based (no MMU)
Tree cover density threshold
30%
Necessary attributes
Raster value, count, class name, area (in km2), percentage (taking outside area not into account)
Raster coding (thematic pixel values)
-100 to -301: decreased tree cover density
0: unchanged areas
30-100: increased tree cover density
254: unclassifiable in any of parent status layers
255: outside area
Metadata
XML metadata files according to INSPIRE metadata standards
Delivery format
GeoTIFF
1 A filtering approach with a 30% density significance threshold has been applied to differentiate between “noise” and the
expected real change between both time steps. Changes in the magnitude of tree cover density will be derived, if the
difference between TCD 2012 and 2015 products is exceeded by the defined significance threshold of 30%. This is why
only positive or negative changes >30% are represented in the raster coding.

HRL Forest Product Specifications Document Page 29
Annex III: Colour Palettes
For each product both, the GIS file [*.clr) specifying the colour palette and a text file (*.txt) listing the
RGB values for possible non-GIS products and material will be provided.
Tree Cover Density
Class Code Class Name Red Green Blue
0 all non-tree and non-forest areas 240 240 240
1 1% tree cover density 186 255 172
50 50% tree cover density 85 160 89
100 100% tree cover density 28 92 36
254 unclassifiable (no satellite image available, or
clouds, shadows, or snow) 153 153 153
255 outside area 0 0 0
Dominant Leaf Type
Class Code Class Name Red Green Blue
0 all non-tree covered areas 240 240 240
1 broadleaved trees 70 158 74
2 coniferous trees 28 92 36
254 unclassifiable (no satellite image available, or
clouds, shadows, or snow) 153 153 153
255 outside area 0 0 0
Forest Type
Class Code Class Name Red Green Blue
0 all non-tree and non-forest areas 240 240 240
1 broadleaved forest 70 158 74
2 coniferous forest 28 92 36
3 mixed forest (only for aggregated 100m
layer) 76 133 67
254 unclassifiable (no satellite image available, or
clouds, shadows, or snow) 153 153 153
255 outside area 0 0 0
HRL Forest Product Specifications Document Page 30
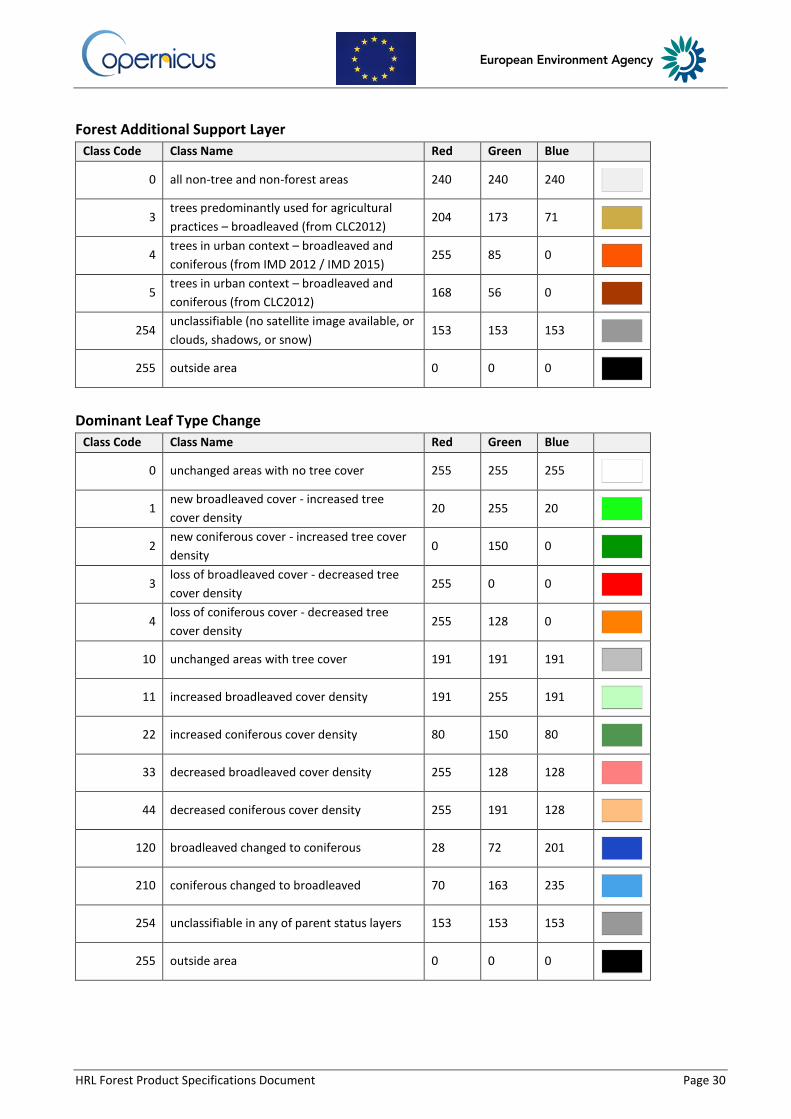
Forest Additional Support Layer
Class Code Class Name Red Green Blue
0 all non-tree and non-forest areas 240 240 240
3 trees predominantly used for agricultural
practices – broadleaved (from CLC2012) 204 173 71
4 trees in urban context – broadleaved and
coniferous (from IMD 2012 / IMD 2015) 255 85 0
5 trees in urban context – broadleaved and
coniferous (from CLC2012) 168 56 0
254 unclassifiable (no satellite image available, or
clouds, shadows, or snow) 153 153 153
255 outside area 0 0 0
Dominant Leaf Type Change
Class Code Class Name Red Green Blue
0 unchanged areas with no tree cover 255 255 255
1 new broadleaved cover - increased tree
cover density 20 255 20
2 new coniferous cover - increased tree cover
density 0 150 0
3 loss of broadleaved cover - decreased tree
cover density 255 0 0
4 loss of coniferous cover - decreased tree
cover density 255 128 0
10 unchanged areas with tree cover 191 191 191
11 increased broadleaved cover density 191 255 191
22 increased coniferous cover density 80 150 80
33 decreased broadleaved cover density 255 128 128
44 decreased coniferous cover density 255 191 128
120 broadleaved changed to coniferous 28 72 201
210 coniferous changed to broadleaved 70 163 235
254 unclassifiable in any of parent status layers 153 153 153
255 outside area 0 0 0

HRL Forest Product Specifications Document Page 31
Tree Cover Density Change
Class Code Class Name Red Green Blue
-100 decreased tree cover density 240 118 5
-50 decreased tree cover density 255 200 145
-30 decreased tree cover density 255 237 207
0 unchanged areas 240 240 240
30 increased tree cover density 206 255 207
50 increased tree cover density 158 242 150
100 increased tree cover density 14 204 14
254 unclassifiable in any of parent status layers 153 153 153
255 outside area 0 0 0
HRL Forest Product Specifications Document Page 32
Annex IV: Derivation of the 20m Forest Type Layer
The following workflow is applied to derive the 20m Forest Type product from the two 20m primary
status layers Dominant Leaf Type and Tree Cover Density:
1) All pixel values ≥ 10% and ≤ 100% TCD from the Tree Cover Density product are initially
considered for the Forest Type product and are used to extract the associated leaf type
information (broadleaved or coniferous) from the 20m Dominant Leaf Type product.
2) Application of a 4-pixel-connectivity MMU filter to all extracted “tree covered” areas < 0.52
ha (13 pixels). All “tree cover” patches < 0.52 ha are reclassified to “all non-tree areas”.
“Forest/tree cover” patches < 0.52 ha adjacent to (buffered) country borders can remain as
they are.
3) Application of a 4-pixel-connectivity MMU filter to “all non-tree areas” < 0.52 ha (13 pixels)
within forest stands. All “non-tree area” patches < 0.52 ha are reclassified to “forest
(broadleaved or coniferous)”. “All non-tree area” patches < 0.52 ha adjacent to (buffered)
country borders can remain as they are.
4) To keep consistency with the 20m Dominant Leaf Type product, the leaf type information of
existent pixels within filtered “all non-tree area” patches will be explicitly kept, if available.
HRL Forest Product Specifications Document Page 33
Annex V: FADSL Products 2012/2015
The Forest Additional Support Layer (FADSL) provides information on trees under agricultural or
urban use by utilization of CORINE Land Cover (CLC) 2012 information and HRL Imperviousness
products 2012/2015. The layer has the following main specifications:
20m spatial resolution
Tree Cover Density range of ≥ 10-100%
No Minimum Mapping Unit (MMU); pixel-based
Minimum Mapping Width (MMW) of 20m
Providing information:
o trees predominantly used for agricultural practices – broadleaved (from CLC)
o trees in urban context – broadleaved and coniferous (from CLC)
o trees in urban context – broadleaved and coniferous (from HRL Imperviousness)
Considering different options for separating real “forest” areas as far as possible compliant with the
FAO definition from non-forest tree-covered areas (i.e. trees predominantly used for agricultural
practices, trees in an urban context) for the 20m Forest Type product, the following procedure is
applied:
In order to avoid misinterpretation of the 20m Forest Type product by potential users, specifically
with respect to the contents / accuracies / information origins of the additional information on "trees
predominantly used for agricultural practices - broadleaved" (as derived from CLC classes 2.2.2 and
2.2.3) and "trees in urban context – broadleaved and coniferous" (as derived from a filtering approach
applied to HRL Imperviousness and from CLC class 1.4.1 Green Urban Areas), this additional
information is made available through a labelling approach. In technical terms, this requires that in
addition to the 20m Forest Type product’s basic raster data set with the nomenclature of [0: all non-
forest areas, 1: broadleaved forest, 2: coniferous forest] an additional support raster data set is
provided with information on the occurrence of "trees predominantly used for agricultural practices
- broadleaved" and "trees in urban context – broadleaved and coniferous" – both only within the
confines of broadleaved and coniferous tree areas of the basic product (not beyond!) – in the sense
of additional, and not contradicting/conflicting information (as would be the case e.g. if CLC orchards
would be identified in non-forest areas).
Such approach will allow providing to users the required real “forest” information, which will then
actually be contained in the combination of the 2 raster data sets described above. This will allow:
i. to have a clear, traceable and explainable separation of the different sources of information,
i.e. the 20m highly-accurate Forest Type classification vs. the 25 / 5 ha CLC-based overlay
information, without already giving to users a “hard” intersection (with all associated
problems of misinterpretation);
ii. users nevertheless to simply derive the real "Forest" areas (close to the FAO definition) by
simple GIS (Geographic Information System) operations between these 2 raster data sets, i.e.
by doing an intersection;

HRL Forest Product Specifications Document Page 34
iii. to preserve the mapped dominant leaf type information on pixel-level for various later
applications, also e.g. in the climate change domain– without irreversibly casting away all non-
Forest tree-based information.
In practical terms, the FADSL can be derived by GIS operations using the HRL Imperviousness Degree
(IMD), CLC 2012 data and FTY products respectively, considering the following processing steps:
1) Reclassification of the Imperviousness Degree layer (pixel range 0-100%) in 20m spatial
resolution to a binary mask of impervious with 0 = all non-impervious areas and 1 = all
impervious areas. Clouds are explicitly not considered
2) Filtering of all contiguous all non-impervious patches < 25 ha which are fully surrounded by
impervious areas in a 4-pixel connectivity mode and subsequently reclassification to 1 = all
impervious areas;
3) Hierarchical intersection of HRL Forest Type, CLC (full vector resolution) and the gap-filled
Imperviousness dataset and subsequent reclassification according to the product
specifications, resulting in the following thematic classes:
Table 6: FADSL: Hierarchical intersection of input layers and resulting thematic classes
Order FTY
Class
CLC
Class
IMD
Class
FADSL
Class Class Description
1.) 1 or 2 any 1 4 trees in urban context – broadleaved and
coniferous (from HRL Imperviousness context)
2.) 1 or 2 141 0 5 trees in urban context – broadleaved and
coniferous (from CLC class 1.4.1)
3.) 1
222
or
223
any 3
trees predominantly used for agricultural
practices – broadleaved (from CLC classes 2.2.2
and 2.2.3)
254 any any 254 unclassifiable (no satellite image available, or
clouds, shadows, or snow)
255 any any 255 outside area
any other remaining combination 0 all non-tree areas, and tree cover without urban
context or agricultural use

HRL Forest Product Specifications Document Page 35
Annex VI: Aggregation Rules to 100m Products
In the following, the aggregation rules to derive the aggregated status layers Tree Cover Density and
Forest Type in 100m spatial resolution and European projection will be described. This supports users
in the understanding of the products.
Tree Cover Density (100m, European Projection)
1) The spatially consistent EEA 100m grid is overlaid to the 20m Tree Cover Density product in
European projection.
2) If the number of valid pixels (i.e. without “outside area” and “unclassifiable” values) is <50%
(i.e. <13 pixels), the 100m grid cell is assigned “outside area” (255) or “unclassifiable”(254)
depending on the relative majority of 255 or 254 underlying 20m pixels, or “unclassifiable”
(254) in case of equal number of such 254 and 255 pixels.
3) Within those 100m grid cells with a number of valid pixels (all pixels with TCD value of 0-100)
>50% (i.e. ≥ 13 pixels), the arithmetic mean density of all valid underlying 20m pixels (with
density values from 0-100) is calculated (excluding “outside area” and “unclassifiable”). The
thereof resulting mean values from the aggregation (floating point data type) are rounded and
finally converted to integer values (e.g. raw values in the range from 33.5 to 34.4 are
converted to a density value of 34).
Forest Type (100m, European Projection)
1) The spatially consistent EEA 100m grid is overlaid to the 20m Forest Type product and the
associated Forest Additional Support Layer with information on trees in agricultural use and
urban context.
2) If the number of valid pixels (i.e. without “outside area” and “unclassifiable” values) is <50%
(i.e. <13 pixels), the 100m grid cell is assigned “outside area” (255) or “unclassifiable”(254)
depending on the relative majority of 255 or 254 underlying 20m pixels, or “unclassifiable”
(254) in case of equal number of such 254 and 255 pixels.
3) Within those 100m grid cells with a number of valid pixels >50% (i.e. ≥ 13 pixels), the numbers
of underlying 20m coniferous forest pixels and broadleaved forest pixels, as well as broadleaf
agriculture pixels (from FADSL), and broadleaf/coniferous urban pixels (from FADSL) are
separately counted [resulting in frequency values for these classes between 0 and 25]. Pixels
coded as “outside area” and “unclassifiable” are not counted.
4) The 100m grid cell is classified according to the majority rule first. That means that a 100m
grid cell is assigned “forest”, if a majority (>50%) of valid pixels (as defined in step 2) in the
grid cell which do not in parallel have FADSL code 3, 4 or 5 belongs to broadleaf and/or
coniferous (in this case continue with step 5). It is assigned “all non-forest areas”, if a majority
(>50%) of valid pixels in the grid cell belongs to non-tree area and/or broadleaf agriculture

HRL Forest Product Specifications Document Page 36
trees and/or broadleaf/coniferous urban trees (in this case, processing is finished). If all the
counts (from step 3) are 0 (but the number of valid pixels is >0), the 100m grid cell is also
assigned “all non-forest areas” (in this case, processing is finished). If the number of valid
pixels is >0, some counts (from step 3) are >0, but no majority of valid pixels exists for either
“forest” or “all non-forest areas” in the grid cell (i.e. both have the same number of valid
pixels), the 100m grid cell is considered “unclassifiable” (254) (in this case, processing is
finished).
5) In this step, the CORINE Land Cover definition for coniferous, broadleaved and mixed forest is
applied for grid cells having a “forest” majority: 100m grid cells with “coniferous” constituents
with ≥75% of the forest pixels are assigned the thematic class “coniferous forest”, 100m grid
cells with “broadleaved” constituents with ≥75% of the forest pixels are assigned the thematic
class “broadleaved forest”, and 100m grid cells in which neither “coniferous” nor
“broadleaved” constituents account for ≥75% of the forest pixels are devised as the thematic
class “mixed forest”.
6) The resulting thematic classes of the 100m x 100m product are coded with the following
values:
all non-forest areas = 0
broadleaved forest = 1
coniferous forest = 2
mixed forest = 3
As a consequence of this aggregation, small patches in the 100m x 100m grid will be generalised (i.e.
exaggerated or deleted) according to the above aggregation rules.

HRL Forest Product Specifications Document Page 37
Annex VII: Derivation of Change Products
This annex describes the processing steps to derive the newly introduced change layers Dominant
Leaf Type Change and the Tree Cover Density Change.
Tree Cover Density Change (100m, European Projection)
The generation of the Tree Cover Density Change product requires the aggregated 100m status layers
TCD 2012 and TCD 2015 and is calculated in two steps:
1) The pixels of the aggregated 100m status layer TCD 2012 are subtracted from the aggregated
status layer TCD 2015. The resulting raster provides information on the difference between
both time steps ranging from -100% to +100% at a 100m pixel level.
2) Application of the 30% significance difference threshold. All pixel in the range of -29% to -1%
and +1% to +29% are recoded to 0 = unchanged areas.
Dominant Leaf Type Change (20m, European Projection)
A more complex workflow has been designed for derivation of the 20m Dominant Leaf Type Change
product, which relies on the primary status layers DLT and TCD of each time step. The complexity of
the change product calculation requires the arrangement in working units. For this purpose, the EEA
100km reference grid with a 500m buffer applied has been chosen.
Calculation of the Dominant Leaf Type Change is then based on a combination of DLT and TCD layers:
1) Calculation of the difference between the TCD status layers of the 2012 and 2015 reference
year (∆TCD = TCD_2015 – TCD_2012). Subsequently, the DLT difference is calculated for both
reference years (∆DLT = DLT_2015 – DLT_2012).
2) Application of the 30% significance difference threshold. The DLTC is then derived based on
the following conditions using a python script:
Combined TCD – DLT DLTC Code* Class Description
(TCD_2012==0)&(TCD_2015==0) 0 unchanged areas with no tree cover
(TCD_2012==0)&(DLT_2015==1) 1 new broadleaved cover
(TCD_2012==0)&(DLT_2015==2) 2 new coniferous cover
(DLT_2012==1)&(DLT_2015==0) 3 loss of broadleaved cover
(DLT_2012==2)&(DLT_2015==0) 4 loss of coniferous cover
(∆DLT==0)&(TCD_2015>0)&(abs(∆TCD) <= TCD_30%) 10 unchanged areas with tree cover
(∆DLT==0)&(DLT_2012==1)&(∆TCD > TCD_30%) 11 increased broadleaf density
(∆DLT==0)&(DLT_2012==2)&(∆TCD > TCD_30%) 22 increased coniferous density
(∆DLT==0)&(DLT_2012==1)&(∆TCD < -TCD_30%) 33 decreased broadleaved density
(∆DLT==0)&(DLT_2012==2)&(∆TCD < -TCD_30%) 44 decreased coniferous density
(DLT_2012==1)&(DLT_2015==2)&(TCD_2015>0)&(TCD_2012>0) 120 broadleaved changed to coniferous
(DLT_2012==2)&(DLT_2015==1)&(TCD_2015>0)&(TCD_2012>0) 210 coniferous changed to broadleaved

HRL Forest Product Specifications Document Page 38
(TCD_2012==254)|(TCD_2015==254) 254 unclassifiable
(TCD_2012==255)|(TCD_2015==255) 255 outside area
* Class codes 1 to 4 and 11 to 210 represent change classes.
3) Application of a 1 ha boundary filter to the unfiltered (raw) DLTC product in order to address
geometric differences between the products 2012/2015, inherited by the initially different EO
data basis of 2012 and 2015. If certain conditions are met, the filtering is applied to the change
classes 1 to 4 (change of tree cover extent) in a multi-stage approach:
a. Calculation of the area size by performing a region group in a 4-pixel-connectivity
mode for all pixels different than 0 = unchanged areas with no tree cover and without
class distinction.
b. Identification of border pixels within region groups (as derived in step a.) > 1 ha MMU
using a 2-pixel erosion filter (40m).
c. Calculation of the area size for all change objects in the identified borders by
performing a region group in a 4-pixel-connectivity mode.
d. Recoding of change objects < 1 ha MMU according to the following rules: change
objects with the original pixel code 1 or 2 will be recoded to 10 = unchanged areas with
tree cover; pixel codes with class codes 3 or 4 will be recoded to 0 = unchanged areas
with no tree cover.
4) Application of a 4-pixel-connectivity MMU filter to the full-extent raster:
a. Calculation of the area size for all change objects by performing a region group in a 4-
pixel-connectivity mode.
b. Recoding of change objects < 1 ha MMU (25 pixels) and with class codes 3 or 4 to 0 =
unchanged areas with no tree cover.
c. Recoding of all remaining change objects < 1 ha MMU (25 pixels) to 10 = unchanged
areas with tree cover.
5) Mosaicking of the filtered results without a 500m buffer applied to a European-wide mosaic.