hplc column technology: smaller and faster · 2016-08-30 · 1 hplc column technology: smaller and...
TRANSCRIPT
1
HPLC Column Technology: Smallerand Faster
Ronald E. MajorsAgilent TechnologiesWilmington, DE, USA
Tuesday, May 13, 2008
HPLC 2008
Outline of Talk*
• Drivers for HPLC Column Improvements
• Approaches to increase throughput in HPLC• Small porous particles (10- 5- 3- 2-3-
< 2-µm)• Superficially porous** and non-porous particles
(401.5-5- 2.7-µm)• Monoliths
• Silica-based• Polymer-based
• Brief Comparisons of above
• Parallel LC* Focus on commercial products, not research products** Also called pellicular, porous layer beads, fused core

2
Drivers for Improvements in HPLC ColumnTechnologies
1. Productivity Gains (faster separations, rapid method development, automation,time-to-market, QC department—quicker results)
2. Improvement in Quality of Analysis [reproducible columns, improved recovery (bio-compounds), lower activity (less tailing, especially for basic compounds}]
3. Cost of Analysis (column lifetime & stability, guard columns, solvent reduction,lower cost solvents, narrow bore and smaller, high throughput LC)
4. Smaller, more complex samples, trace analysis (proteomics) (nanocolumns,selectivity improvements-specialty columns, 2-D & comprehensive chrom./columnswitching)
5. Widespread use of LC-MS & LC/MS-MS (cap/nano columns, short columns,smaller particles, packings with wider range of solvent compatibility, low bleed)
6. Increasing Importance of Biologically -Derived Molecules (wide pore packings,rugged packings, biocompatible surfaces, inert column materials)
7. Environmental Reasons; solvent reduction (smaller diameter columns,shorter columns, less toxic solvents, disposal costs)
1) Shorter column lengths (to reduce analysis time) packed with small porousparticles (to maintain resolution). (Reasonable # of plates and reasonablepressure, fast separation)
2) Longer column lengths (to increase efficiency) packed with even smaller porousand non-porous particles (to maintain resolution), with the ultimate being the so-called “Ultra-High Pressure LC”. (Many plates, fast separation, high pressure)
3) Columns packed with various small superficially porous particles (pellicular) particlesizes, pore sizes and phase thickness to allow the rapid resolution ofbiomolecules such as proteins as well as small molecules. (Large and smallmolecules, fast separations, lower pressure)
4) Columns designed with silica- and polymer-based monolith stationary phase formats(fast separation, low pressure, in-series columns)
5) Parallel LC (multiple capillary columns/channels, increased samples/hour)
Some Ways to Increase Sample Throughput(and Resolution)
3
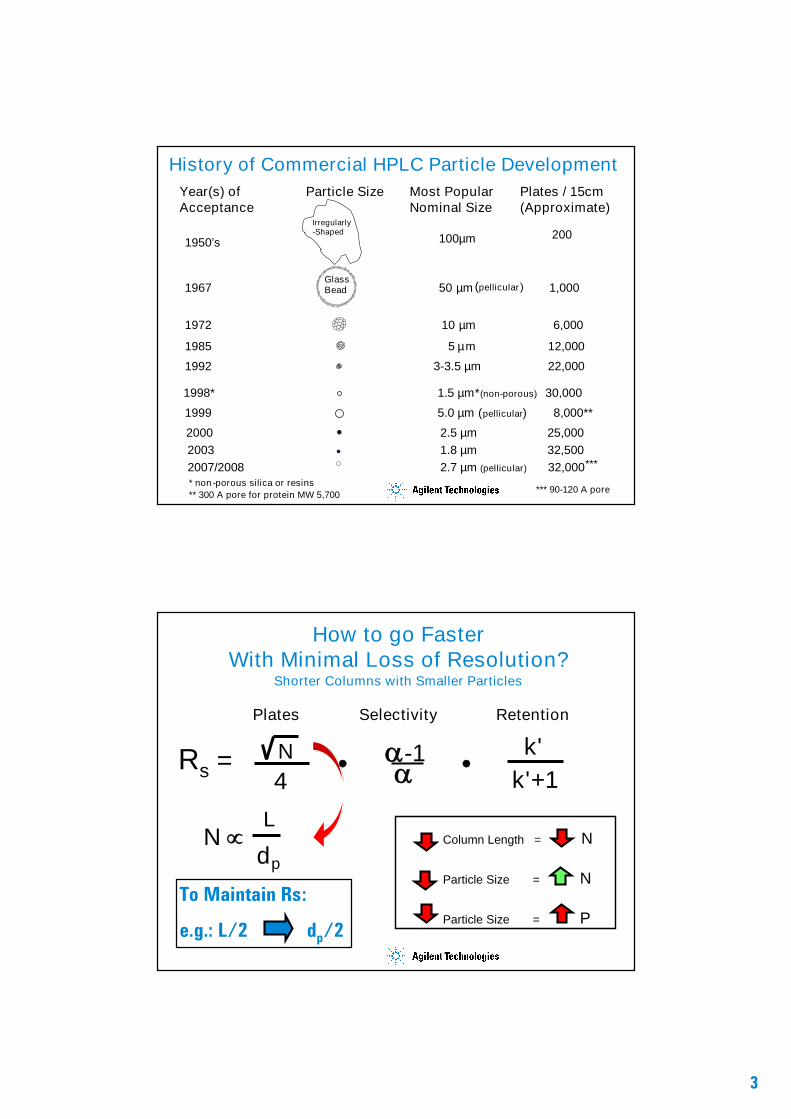
1998* 1.5 µm*(non-porous) 30,000
History of Commercial HPLC Particle Development
2003 1.8 µm 32,5002007/2008 2.7 µm (pellicular) 32,000***
Year(s) ofAcceptance
Particle Size Most PopularNominal Size
Plates / 15cm(Approximate)
1950’s 100µm 200
1967 50 µm(pellicular) 1,000
1972 10 µm 6,000
GlassBead
Irregularly-Shaped
12,000
1992 3-3.5 µm 22,000
1985 5 µm
2000 2.5 µm 25,000
1999 5.0 µm (pellicular) 8,000**
* non-porous silica or resins** 300 A pore for protein MW 5,700 *** 90-120 A pore
How to go FasterWith Minimal Loss of Resolution?
Shorter Columns with Smaller Particles
Rs = N4
k'k'+1
Plates Selectivity Retention
LN
dp
To Maintain Rs:
e.g.: L/2 dp/2
000990P2.PPT
Column Length = N
Particle Size = N
Particle Size = P
-1
4
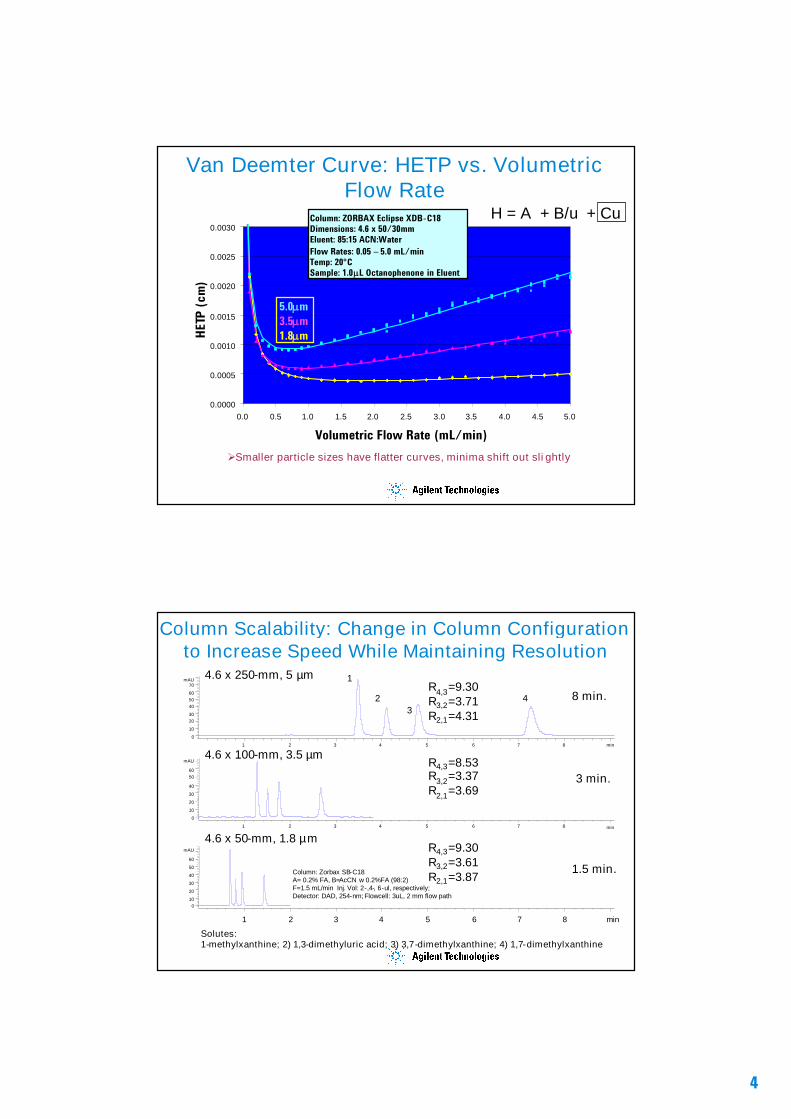
Van Deemter Curve: HETP vs. VolumetricFlow Rate
0.0000
0.0005
0.0010
0.0015
0.0020
0.0025
0.0030
0.0 0.5 1.0 1.5 2.0 2.5 3.0 3.5 4.0 4.5 5.0
Column: ZORBAX Eclipse XDB-C18Dimensions: 4.6 x 50/30mmEluent: 85:15 ACN:WaterFlow Rates: 0.05 – 5.0 mL/minTemp: 20°CSample: 1.0L Octanophenone in Eluent
Volumetric Flow Rate (mL/min)
HET
P(c
m)
5.0m3.5m1.8m
Smaller particle sizes have flatter curves, minima shift out slightly
H = A + B/u + Cu
Column Scalability: Change in Column Configurationto Increase Speed While Maintaining Resolution
min1 2 3 4 5 6 7 8
4.6 x 50-mm, 1.8 µm
min1 2 3 4 5 6 7 8
mAU
0
10
2030
405060
70
4.6 x 250-mm, 5 µmR4,3=9.30R3,2=3.71R2,1=4.31
8 min.
min1 2 3 4 5 6 7 8
mAU
0
10
20
30
40
5060
4.6 x 100-mm, 3.5 µm
3 min.R4,3=8.53R3,2=3.37R2,1=3.69
mAU
010
20
30
40
50
60
1.5 min.Column: Zorbax SB-C18A= 0.2% FA, B=AcCN w 0.2%FA (98:2)F=1.5 mL/min Inj. Vol: 2-,4-, 6-ul, respectively;Detector: DAD, 254-nm;Flowcell: 3uL, 2 mm flow path
R4,3=9.30R3,2=3.61R2,1=3.87
1-methylxanthine; 2) 1,3-dimethyluric acid; 3) 3,7-dimethylxanthine; 4) 1,7-dimethylxanthineSolutes:
1
23
4
5
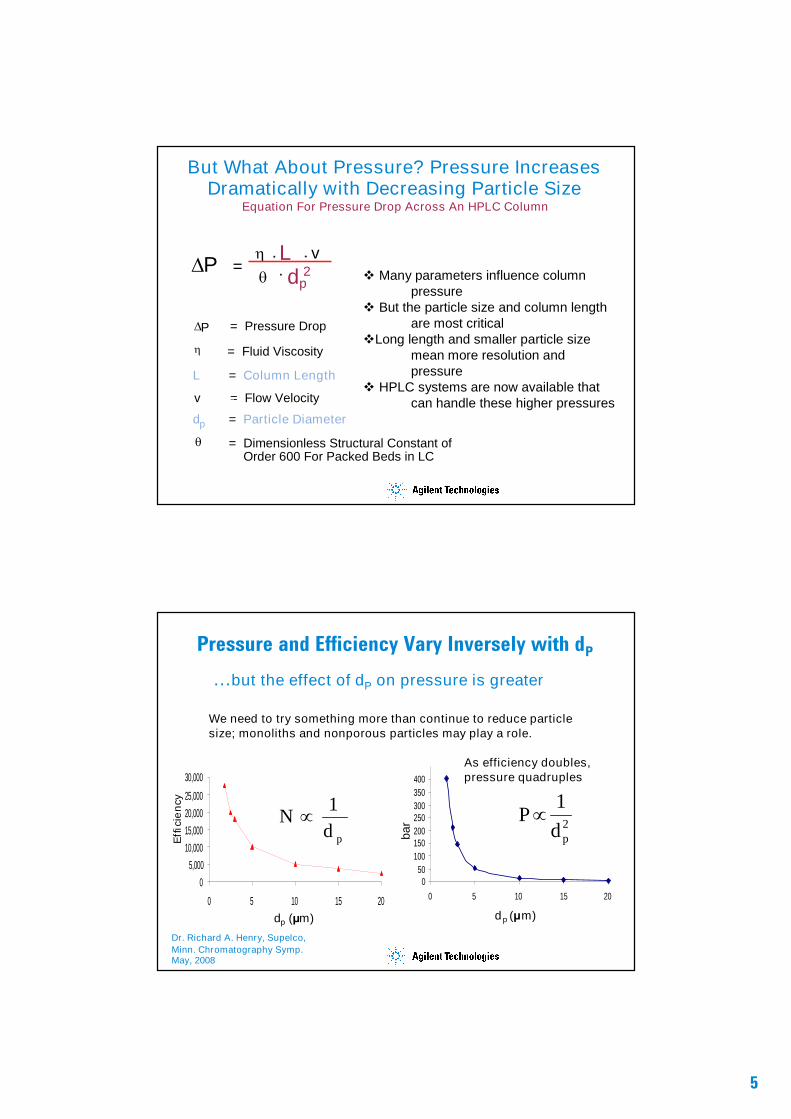
But What About Pressure? Pressure IncreasesDramatically with Decreasing Particle Size
Equation For Pressure Drop Across An HPLC Column
P = Pressure Drop
L = Column Length
v = Flow Velocity
= Fluid Viscosity
= Dimensionless Structural Constant ofOrder 600 For Packed Beds in LC
d = Particle Diameterp
P = L v dp
2 Many parameters influence columnpressure
But the particle size and column lengthare most critical
Long length and smaller particle sizemean more resolution andpressure
HPLC systems are now available thatcan handle these higher pressures
We need to try something more than continue to reduce particlesize; monoliths and nonporous particles may play a role.
050
100150200250300350400
0 5 10 15 20
dp (μm)
bar 2
1
pdP
As efficiency doubles,pressure quadruples
Pressure and Efficiency Vary Inversely with dP
…but the effect of dP on pressure is greater
05,000
10,00015,00020,00025,000
30,000
0 5 10 15 20
Eff
icie
ncy
pdN
1
dp (μm)
Dr. Richard A. Henry, Supelco,Minn. Chromatography Symp.May, 2008

6
Pressures for Various Particle Sizes
2,50034420
3,75068715
5,0001318910
10,000537695
16,50014621183
20,00021330892.5
27,50040658891.8
NBar
Pressure,
psiParticle Size
100x4.6mm column, 1.0 mL/min, 50/50Water/ACN, 30
pdN
1
2
1
pdP
3
1
p
Nd
Popt
Dr. Richard A. Henry, Supelco,Minn. Chromatography Symp.
May, 2008
Commercial Two and Sub-Two Micron TotallyPorous HPLC Columns (Pittcon ’08)*
1.7EmeraldOrachem Technologies
1.7GP-8 and GP-18Sepax
1.9Pinnacle DBRestek
1.5PathfinderShant Laboratories
1.8Cogent Diamond & Silica-CMicroSolv Technology
2.0TSKgel SuperODSTosoh Haas
1.8NucleodurMacherey-Nagel
2.0Ultra-FastYMC
2.0LunaPhenomenex
1.7Acquity BEHWaters
1.9Hypersil GoldThermo
1.8ProntoPEARL TPP Ace-EPSBischoff
1.5VisionHTAlltech
1.8Zorbax Rapid Resolution HTAgilent
Aver. dP, µmProduct NameManufacturer
* Non-porous & Superficially Porous Particles Not Included

7
Commercial Two to Three Micron TotallyPorous HPLC Columns (Pittcon ’08)*
2.5XBridge, SunFireWaters
2.2GP-8 and GP-18Sepax
2.2XRShimadzu
2.1FortisFortis Technologies
2.4, 2.8Pursuit UPS and XRSVarian
2.5Luna HST and SynergiPhenomenex
2.3TSK-Gel ODS HTPTosoh Bioscience
Aver. dP, µmProduct NameManufacturer
* Non-porous & Superficially Porous Particles Not Included
1) Shorter column lengths (to reduce analysis time) packed with small porousparticles (to maintain resolution). (Reasonable # of plates and reasonablepressure, fast separation)
2) Longer column lengths (to increase efficiency) packed with even smaller porousand non-porous particles (to maintain resolution), with the ultimate being the so-called “Ultra-High Pressure LC”. (Many plates, fast separation, high pressure)
3) Columns packed with various small superficially porous particles (pellicular) particlesizes, pore sizes and phase thickness to allow the rapid resolution ofbiomolecules such as proteins as well as small molecules. (Large and smallmolecules, fast separations, lower pressure)
4) Columns designed with silica- and polymer-based monolith stationary phase formats(fast separation, low pressure, in-series columns)
5) Parallel LC (multiple capillary columns/channels, increased samples/hour)
Some Ways to Increase Sample Throughput(and Resolution)

8
Calculating Peak Capacity - EquationsPeak Capacity (Zp) - Isocratic Elution
k last :retention factor last peak determines:N : efficiencyRs : required resolution (base line separation: Rs 1.5)Pc : peak capacity
Peak Capacity (Zp) - Gradient Elution Equations
Pc = peak capacitytg = gradient time (min)w = peak width (min)
av
g
n
gC
w
t
wn
tP 1
11
1
Pc = ln[1+klast]N
4RS
1
Pc = 1 + tR,n – tR,m
Wav
Pc = 1 +tR,n – tR,1
WavtR,n = last peaktR,m = first possible peak (unretained)tR,1 = first actual peak
1. 2.
3.
Equation 1 used in next examples
W impacted by N, which includes column lengthand particle size
Peptide Map of BSA for Three DifferentParticle Size Columns
Gradient Time = 30 minTemp. = 80°C
231
Peak Capacity,@5 sigma
StartingPressure
51
min4 6 8 10 12 14 16 18 20
mAU
0
5
10
15
20
25
30 Zorbax SB-C18, 2.1x150mm, 5µm
348 103
min*4 6 8 10 12 14 16 18 20
mAU
0
10
20
30
40
50
Zorbax SB-C18, 2.1x150mm, 3.5µm
442 340
min*4 6 8 10 12 14 16 18 20
mAU
0
10
20
30
40
50
60
Zorbax SB-C18, 2.1x150mm, 1.8µm
9
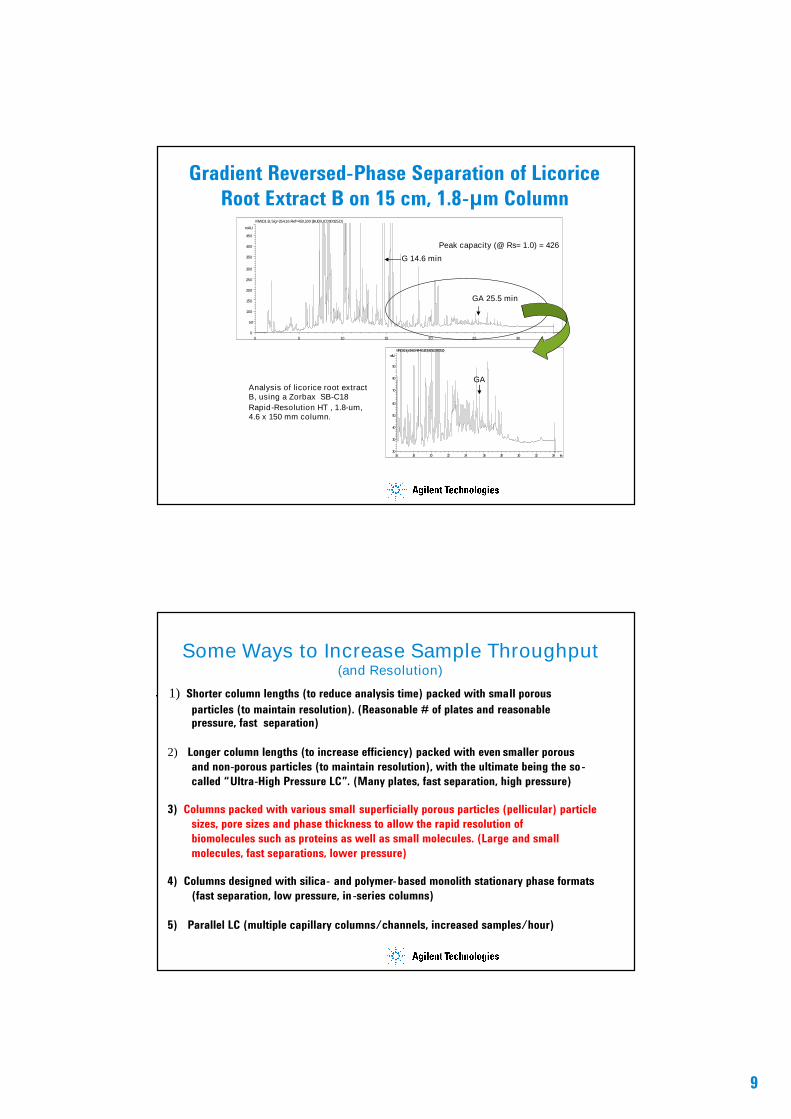
Gradient Reversed-Phase Separation of LicoriceRoot Extract B on 15 cm, 1.8-μm Column
min0 5 10 15 20 25 30
mAU
0
50
100
150
200
250
300
350
400
450
MWD1 B,Sig=254,16 Ref=450,100 (BUD\LIC000025.D)
Peak capacity (@ Rs= 1.0) = 426
G 14.6 min
min16 18 20 22 24 26 28 30 32 34
mAU
20
30
40
50
60
70
80
90
MWD1B,Sig=254,16Ref=450,100(BUD\LIC000025.D)
GA 25.5 min
GAAnalysis of licorice root extractB, using a Zorbax SB-C18Rapid-Resolution HT , 1.8-um,4.6 x 150 mm column.
1) Shorter column lengths (to reduce analysis time) packed with small porousparticles (to maintain resolution). (Reasonable # of plates and reasonablepressure, fast separation)
2) Longer column lengths (to increase efficiency) packed with even smaller porousand non-porous particles (to maintain resolution), with the ultimate being the so-called “Ultra-High Pressure LC”. (Many plates, fast separation, high pressure)
3) Columns packed with various small superficially porous particles (pellicular) particlesizes, pore sizes and phase thickness to allow the rapid resolution ofbiomolecules such as proteins as well as small molecules. (Large and smallmolecules, fast separations, lower pressure)
4) Columns designed with silica- and polymer-based monolith stationary phase formats(fast separation, low pressure, in-series columns)
5) Parallel LC (multiple capillary columns/channels, increased samples/hour)
Some Ways to Increase Sample Throughput(and Resolution)
10
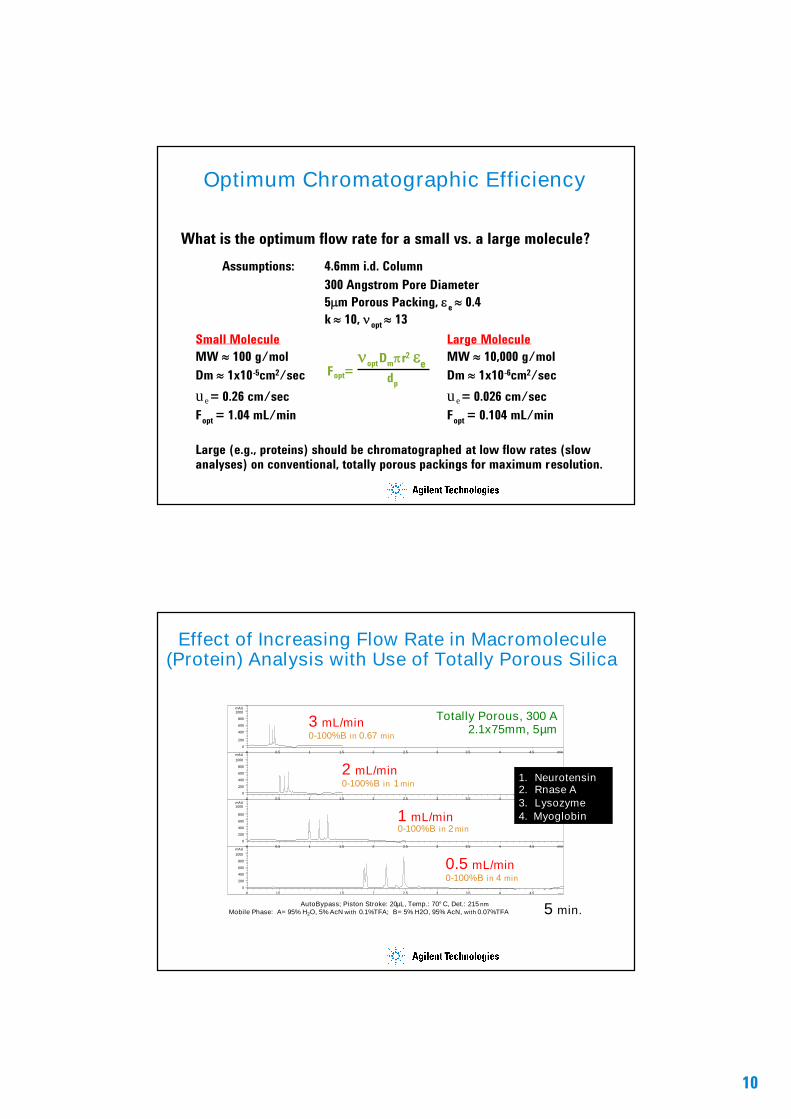
Optimum Chromatographic Efficiency
What is the optimum flow rate for a small vs. a large molecule?
Assumptions: 4.6mm i.d. Column300 Angstrom Pore Diameter5m Porous Packing, e 0.4k 10, opt 13
Small MoleculeMW 100 g/molDm 1x10⁻⁵cm2/sec
ue = 0.26 cm/secFopt = 1.04 mL/min
Large MoleculeMW 10,000 g/molDm 1x10⁻⁶cm2/sec
ue = 0.026 cm/secFopt = 0.104 mL/min
optDmr2 edp
Fopt=
Large (e.g., proteins) should be chromatographed at low flow rates (slowanalyses) on conventional, totally porous packings for maximum resolution.
Effect of Increasing Flow Rate in Macromolecule(Protein) Analysis with Use of Totally Porous Silica
min0 0.5 1 1.5 2 2.5 3 3.5 4 4.5
mAU
0
200
400
600
800
1000
min0 0.5 1 1.5 2 2.5 3 3.5 4 4.5
mAU
0
200
400
600
800
1000
min0 0.5 1 1.5 2 2.5 3 3.5 4 4.5
mAU
0
200
400
600
800
1000
min0 0.5 1 1.5 2 2.5 3 3.5 4 4.5
mAU
0
200
400
600
800
1000
Totally Porous, 300 A2.1x75mm, 5µm3 mL/min
0-100%B in 0.67 min
1. Neurotensin2. Rnase A3. Lysozyme4. Myoglobin
1 2 3 4
2 mL/min0-100%B in 1 min
1 mL/min0-100%B in 2 min
0.5 mL/min0-100%B in 4 min
Agilent 1100 WPS with AutoBypass; Piston Stroke: 20µL, Temp.: 70° C, Det.: 215 nmMobile Phase: A= 95% H2O, 5% AcN with 0.1%TFA; B= 5% H2O, 95% AcN, with 0.07%TFA 5 min.
11
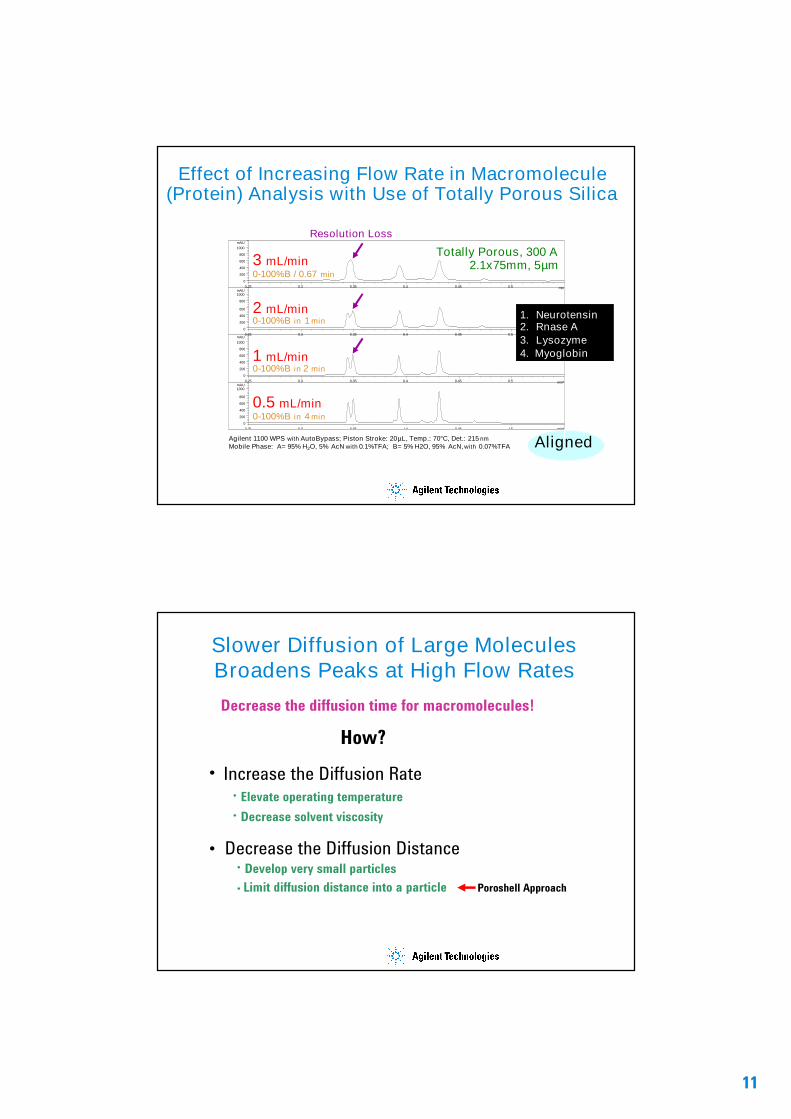
Effect of Increasing Flow Rate in Macromolecule(Protein) Analysis with Use of Totally Porous Silica
min0.25 0.3 0.35 0.4 0.45 0.5
mAU
0
200
400
600
800
1000
min*0.25 0.3 0.35 0.4 0.45 0.5
mAU
0
200
400
600
800
1000
min*0.25 0.3 0.35 0.4 0.45 0.5
mAU
0
200
400
600
800
1000
min*0.25 0.3 0.35 0.4 0.45 0.5
mAU
0
200
400
600
800
1000
Totally Porous, 300 A2.1x75mm, 5µm3 mL/min
0-100%B / 0.67 min
1. Neurotensin2. Rnase A3. Lysozyme4. Myoglobin
1 2 3 4
Agilent 1100 WPS with AutoBypass; Piston Stroke: 20µL, Temp.: 70°C, Det.: 215 nmMobile Phase: A= 95% H2O, 5% AcN with 0.1%TFA; B= 5% H2O, 95% AcN,with 0.07%TFA
2 mL/min0-100%B in 1 min
1 mL/min0-100%B in 2 min
0.5 mL/min0-100%B in 4 min
Resolution Loss
Aligned
Slower Diffusion of Large MoleculesBroadens Peaks at High Flow Rates
Decrease the diffusion time for macromolecules!
How?
• Increase the Diffusion Rate• Elevate operating temperature• Decrease solvent viscosity
• Decrease the Diffusion Distance• Develop very small particles• Limit diffusion distance into a particle Poroshell Approach
12
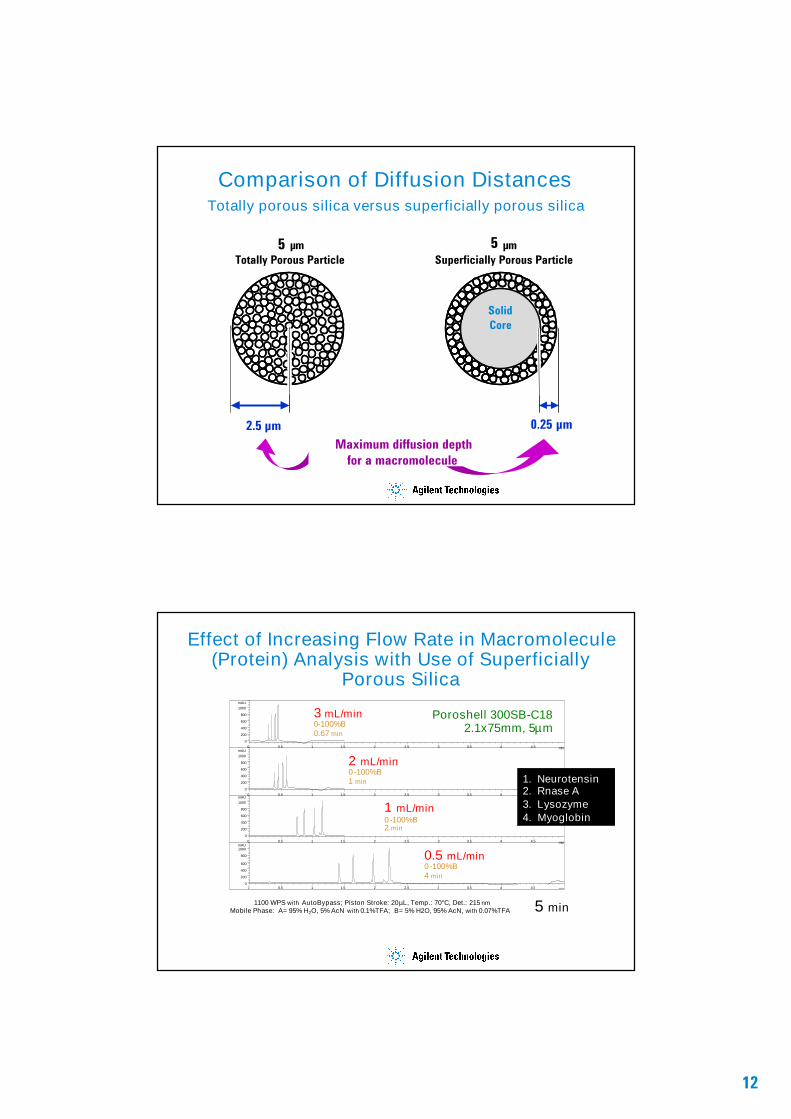
Comparison of Diffusion DistancesTotally porous silica versus superficially porous silica
SolidCore
0.25 µm
5 µmTotally Porous Particle
2.5 µmMaximum diffusion depth
for a macromolecule
5 µmSuperficially Porous Particle
min0 0.5 1 1.5 2 2.5 3 3.5 4 4.5
mAU
0
200
400
600
800
1000
min0 0.5 1 1.5 2 2.5 3 3.5 4 4.5
mAU
0
200
400
600
800
1000
min0 0.5 1 1.5 2 2.5 3 3.5 4 4.5
mAU
0
200
400
600
800
1000
min0 0.5 1 1.5 2 2.5 3 3.5 4 4.5
mAU
0
200
400
600
800
1000
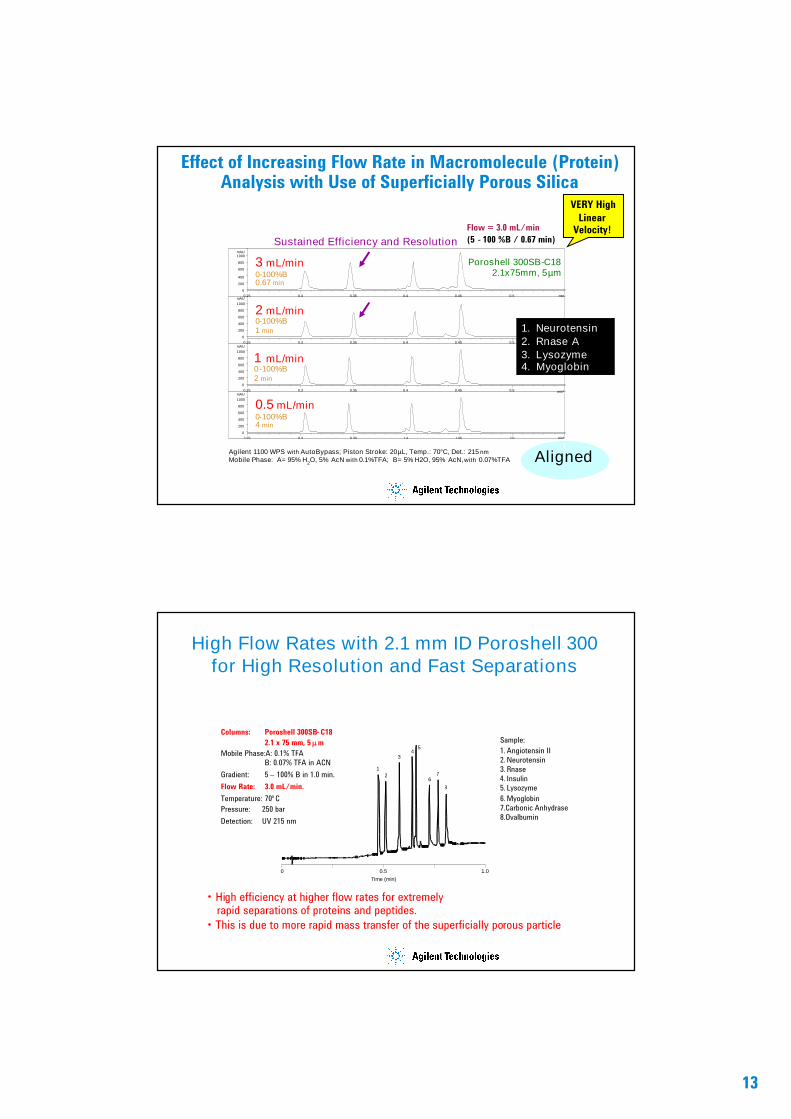
Effect of Increasing Flow Rate in Macromolecule(Protein) Analysis with Use of Superficially
Porous Silica
Poroshell 300SB-C182.1x75mm, 5µm
3 mL/min0-100%B0.67 min
1. Neurotensin2. Rnase A3. Lysozyme4. Myoglobin
12 3 4
Agilent 1100 WPS with AutoBypass; Piston Stroke: 20µL, Temp.: 70°C, Det.: 215 nmMobile Phase: A= 95% H2O, 5% AcN with 0.1%TFA; B= 5% H2O, 95% AcN, with 0.07%TFA
2 mL/min0-100%B1 min
1 mL/min0-100%B2 min
0.5 mL/min0-100%B4 min
5 min
13
Effect of Increasing Flow Rate in Macromolecule (Protein)Analysis with Use of Superficially Porous Silica
min0.25 0.3 0.35 0.4 0.45 0.5
mAU
0
200
400
600
800
1000
min*0.25 0.3 0.35 0.4 0.45 0.5
mAU
0
200
400
600
800
1000
min*0.25 0.3 0.35 0.4 0.45 0.5
mAU
0
200
400
600
800
1000
min*0.25 0.3 0.35 0.4 0.45 0.5
mAU
0
200
400
600
800
1000
Poroshell 300SB-C182.1x75mm, 5µm
3 mL/min0-100%B0.67 min
1. Neurotensin2. Rnase A3. Lysozyme4. Myoglobin
12 3
4
Agilent 1100 WPS with AutoBypass; Piston Stroke: 20µL, Temp.: 70°C, Det.: 215 nmMobile Phase: A= 95% H2O, 5% AcN with 0.1%TFA; B= 5% H2O, 95% AcN,with 0.07%TFA
2 mL/min0-100%B1 min
1 mL/min0-100%B2 min
0.5 mL/min0-100%B4 min
Sustained Efficiency and Resolution
Aligned
Flow = 3.0 mL/min(5 - 100 %B / 0.67 min)
VERY HighLinear
Velocity!
High Flow Rates with 2.1 mm ID Poroshell 300for High Resolution and Fast Separations
12
34
5
67
8
0 0.5 1.0
Time (min)
Columns: Poroshell 300SB-C182.1 x 75 mm, 5 m
Mobile Phase:A: 0.1% TFAB: 0.07% TFA in ACN
Gradient: 5 – 100% B in 1.0 min.Flow Rate: 3.0 mL/min.Temperature: 70°CPressure: 250 barDetection: UV 215 nm
Sample:1. Angiotensin II2. Neurotensin3. Rnase4. Insulin5. Lysozyme6. Myoglobin7.Carbonic Anhydrase8.Ovalbumin
• High efficiency at higher flow rates for extremelyrapid separations of proteins and peptides.
• This is due to more rapid mass transfer of the superficially porous particle

14
5 µmTotally Porous Particle
Comparison of Diffusion DistancesTotally porous silica versus superficially porous silicas
2.5 µm
Required diffusion distancefor a molecule
0.25 µm
5 µmSuperficially Porous Particle
2.7 µmSuperficially Porous Particle
Poroshell 300 A Poroshell 120 A
0.50 µm
1.7µm4.5 µm
What is Poroshell 120?
SolidCore
1.7um
A new HPLC column with:
1. Sub-2 µm like high efficiency2. At ~40-50% lower pressure3. A 2.7 µm particle size with 1.0
µm porous shell4. 120Å pores for small molecule
separations5. A “standard” frit to reduce
potential clogging

15
Superficially Porous Column for Small Moleculescan Achieve Equal Performance to 1.8 µm
van Deemter
0
0.0005
0.001
0.0015
0.002
0.0025
0.003
0 0.5 1 1.5 2 2.5 3 3.5
Flow rate (mL/min)
HE
TP
(cm
)
Eclipse Plus C18, 3.5 µmEclipse Plus C18, 1.8 µmPoroshell 120 C18, 2.6umPoroshell 120 C18, 2.6 µmPoroshell 120 C18, 2.7 µm
Comparing Efficiency and Pressure with DifferentTypes of Columns
All LC’s but pressure limitsmay be reached early
All LC’s
All 400 bar instruments
LC Compatibility
11,000285 bar1.8um – Totally Porous
11,000180 bar2.7um – Poroshell 120
7,800123 bar3.5um – Totally Porous
EfficiencyPressureParticle Size/Type
Columns: 4.6 x 50mm, Mobile Phase: 60% ACN:40% Water Flow Rate: 2 mL/min
16
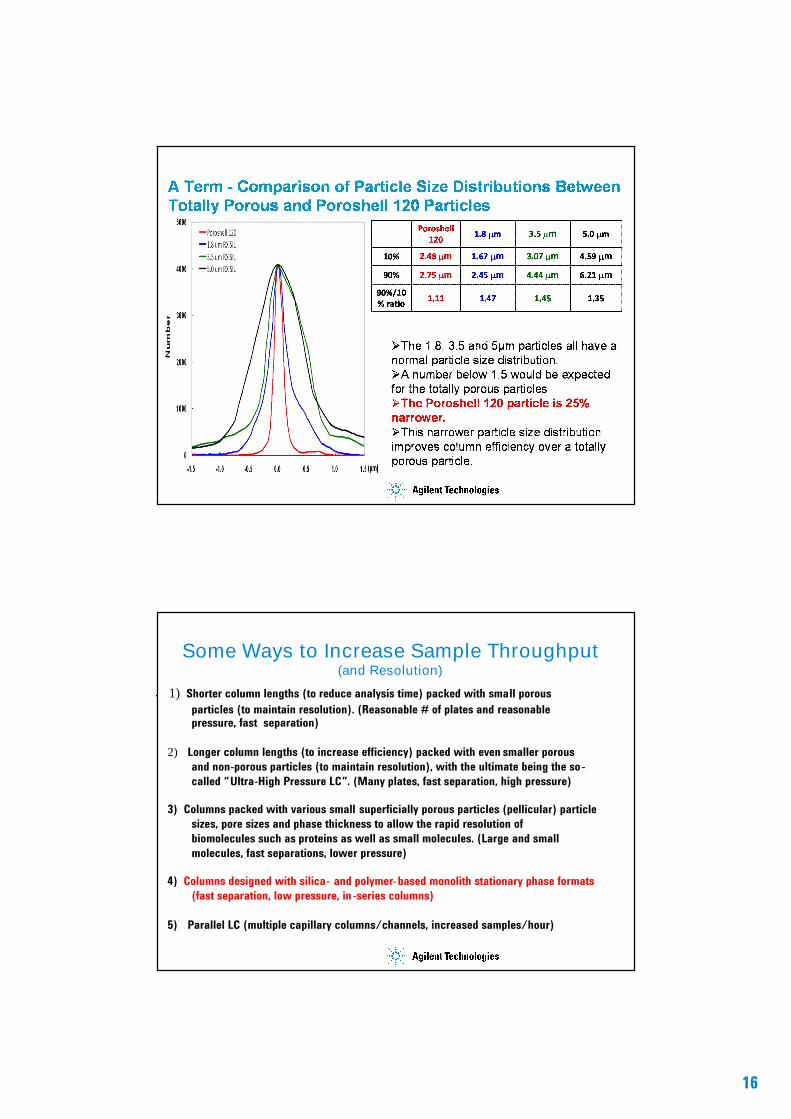
1) Shorter column lengths (to reduce analysis time) packed with small porousparticles (to maintain resolution). (Reasonable # of plates and reasonablepressure, fast separation)
2) Longer column lengths (to increase efficiency) packed with even smaller porousand non-porous particles (to maintain resolution), with the ultimate being the so-called “Ultra-High Pressure LC”. (Many plates, fast separation, high pressure)
3) Columns packed with various small superficially porous particles (pellicular) particlesizes, pore sizes and phase thickness to allow the rapid resolution ofbiomolecules such as proteins as well as small molecules. (Large and smallmolecules, fast separations, lower pressure)
4) Columns designed with silica- and polymer-based monolith stationary phase formats(fast separation, low pressure, in-series columns)
5) Parallel LC (multiple capillary columns/channels, increased samples/hour)
Some Ways to Increase Sample Throughput(and Resolution)
17
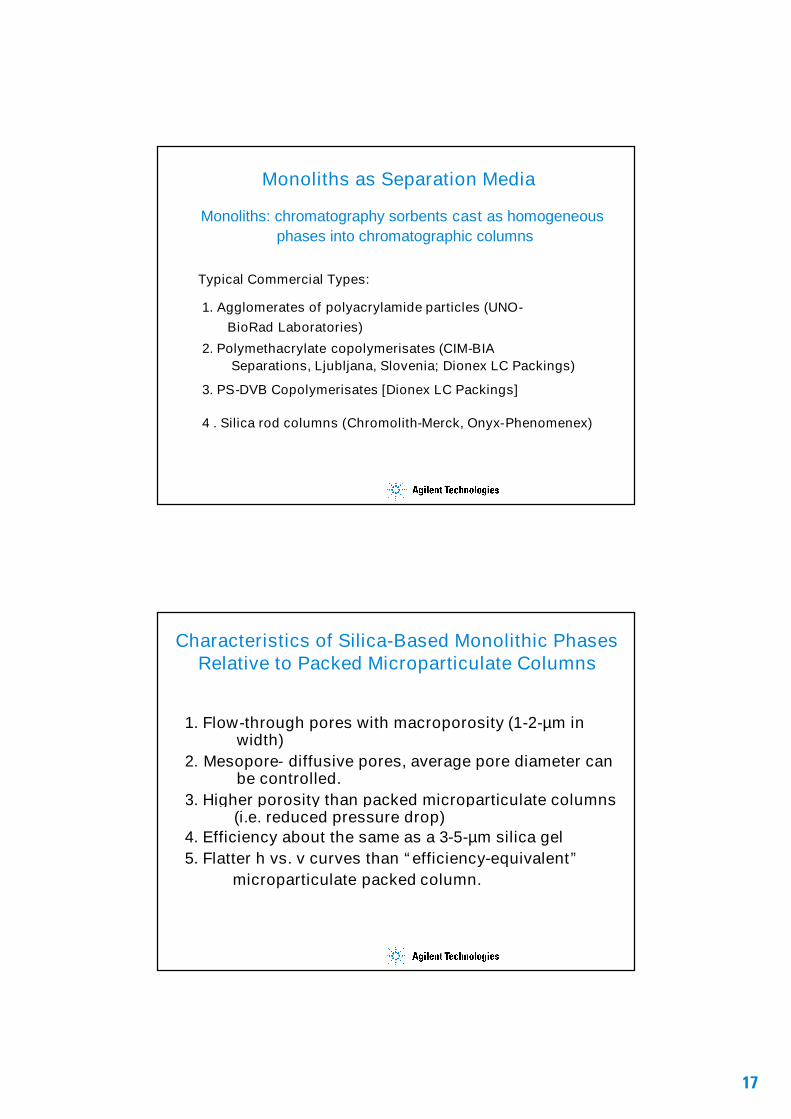
Monoliths as Separation Media
Monoliths: chromatography sorbents cast as homogeneousphases into chromatographic columns
Typical Commercial Types:
4 . Silica rod columns (Chromolith-Merck, Onyx-Phenomenex)
1. Agglomerates of polyacrylamide particles (UNO-BioRad Laboratories)
2. Polymethacrylate copolymerisates (CIM-BIASeparations, Ljubljana, Slovenia; Dionex LC Packings)
3. PS-DVB Copolymerisates [Dionex LC Packings]
Characteristics of Silica-Based Monolithic PhasesRelative to Packed Microparticulate Columns
1. Flow-through pores with macroporosity (1-2-µm inwidth)
2. Mesopore- diffusive pores, average pore diameter canbe controlled.
3. Higher porosity than packed microparticulate columns(i.e. reduced pressure drop)
4. Efficiency about the same as a 3-5-µm silica gel5. Flatter h vs. v curves than “efficiency-equivalent”
microparticulate packed column.
18
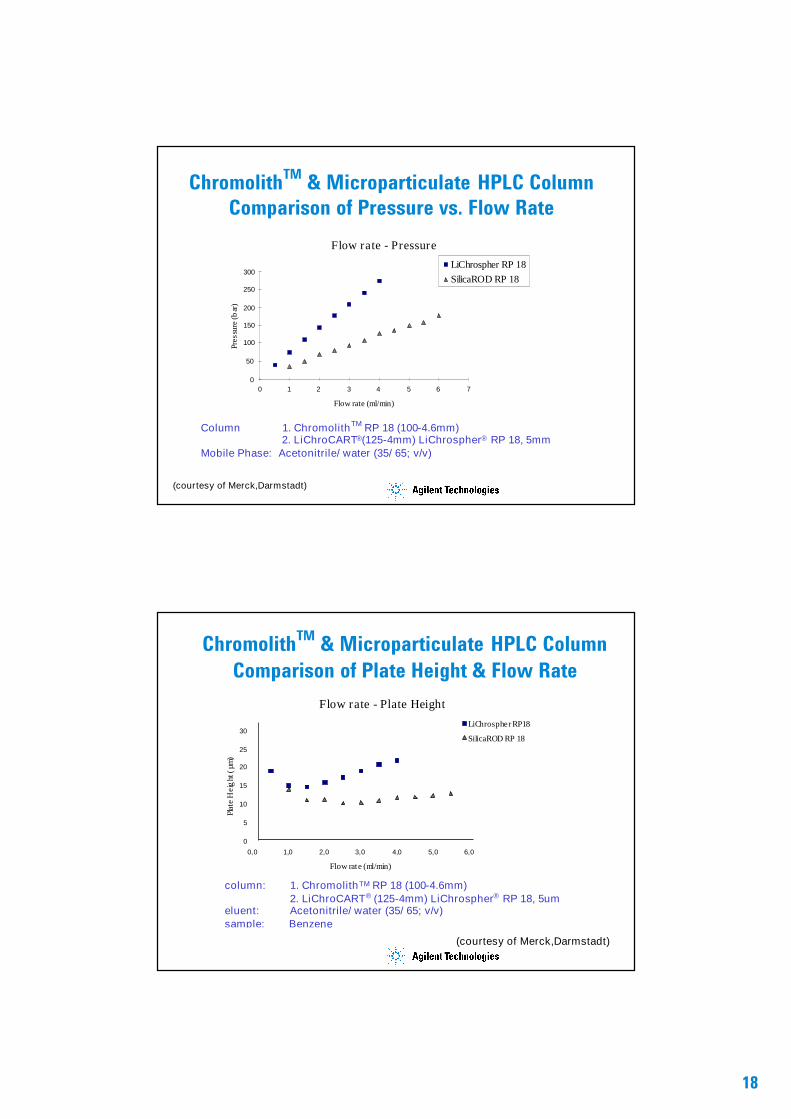
ChromolithTM & Microparticulate HPLC ColumnComparison of Pressure vs. Flow Rate
Column 1. ChromolithTM RP 18 (100-4.6mm)2. LiChroCART®(125-4mm) LiChrospher® RP 18, 5mm
Mobile Phase: Acetonitrile/ water (35/ 65; v/v)
Flow rate - Pressure
0
50
100
150
200
250
300
0 1 2 3 4 5 6 7
Flow rate (ml/min)
Pres
sure
(bar
)
LiChrospher RP 18SilicaROD RP 18
(courtesy of Merck,Darmstadt)
ChromolithTM & Microparticulate HPLC ColumnComparison of Plate Height & Flow Rate
Flow rate - Plate Height
0
5
10
15
20
25
30
0,0 1,0 2,0 3,0 4,0 5,0 6,0
Flow rate (ml/min)
Plat
eH
eig
ht(µ
m)
LiChrospherRP18
SilicaROD RP 18
column: 1. ChromolithTM RP 18 (100-4.6mm)2. LiChroCART® (125-4mm) LiChrospher® RP 18, 5um
eluent: Acetonitrile/ water (35/ 65; v/v)sample: Benzene
(courtesy of Merck,Darmstadt)
19
0
5000
10000
15000
0 2 4 6 8 10
Chromolith® Performance RP-18e, 3mm i.d.PurospherTM STAR RP 18e, 3m
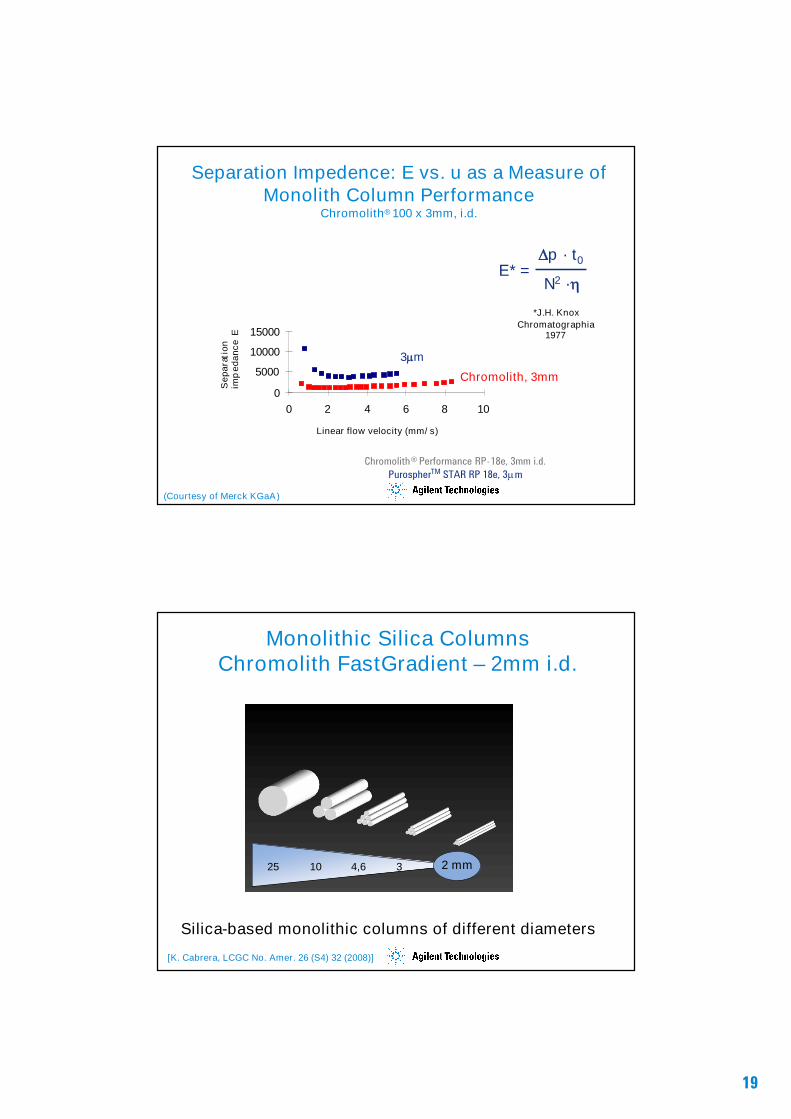
Separation Impedence: E vs. u as a Measure ofMonolith Column Performance
Chromolith® 100 x 3mm, i.d.
Chromolith, 3mm
3m
Linear flow velocity (mm/ s)
Sep
arat
ion
imp
edan
ceE
p · t0
N2 ·E* =
*J.H. KnoxChromatographia
1977
(Courtesy of Merck KGaA)
Monolithic Silica ColumnsChromolith FastGradient – 2mm i.d.
2 mm25 10 4,6 3
Silica-based monolithic columns of different diameters
[K. Cabrera, LCGC No. Amer. 26 (S4) 32 (2008)]

20
Interface of Silica Monolith and PEEK EncapsulationSEM Picture
[K. Cabrera, LCGC No. Amer. 26 (S4) 32 (2008)]
With Chromolith PEEK Cladding-Minimized WallEffects
center region wall region
Overlap of three chromatograms after manual injections of 0.1mL substance mixture(toluene, nitrobenzene, 2-nitroanisole) on top of a silica-based monolith with a syringein the center or at the wall region. After replacement of the end fitting, connection to anHPLC-system and operation with n-heptane/ dioxane (95/5; v/v) and a flow rate of0,38mL/ min.
[K. Cabrera, LCGC No. Amer. 26 (S4) 32 (2008)]

21
Chromolith FastGradientH/u and ΔP/u Curves
Chromolith FastGradient (50-2mm)
6
9
12
15
18
21
24
0,00 1,00 2,00 3,00 4,00 5,00 6,00 7,00 8,00 9,00 10,00 11,00 12,00 13,00 14,00
lineare Fließgeschwindigkeit [mm/sec.]
H[µ
m]
0,0
10,0
20,0
30,0
40,0
50,0
60,0
70,0
80,0
90,0
100,0
110,0
ΔP
[bar
]
[K. Cabrera, LCGC No. Amer. 26 (S4) 32 (2008)]
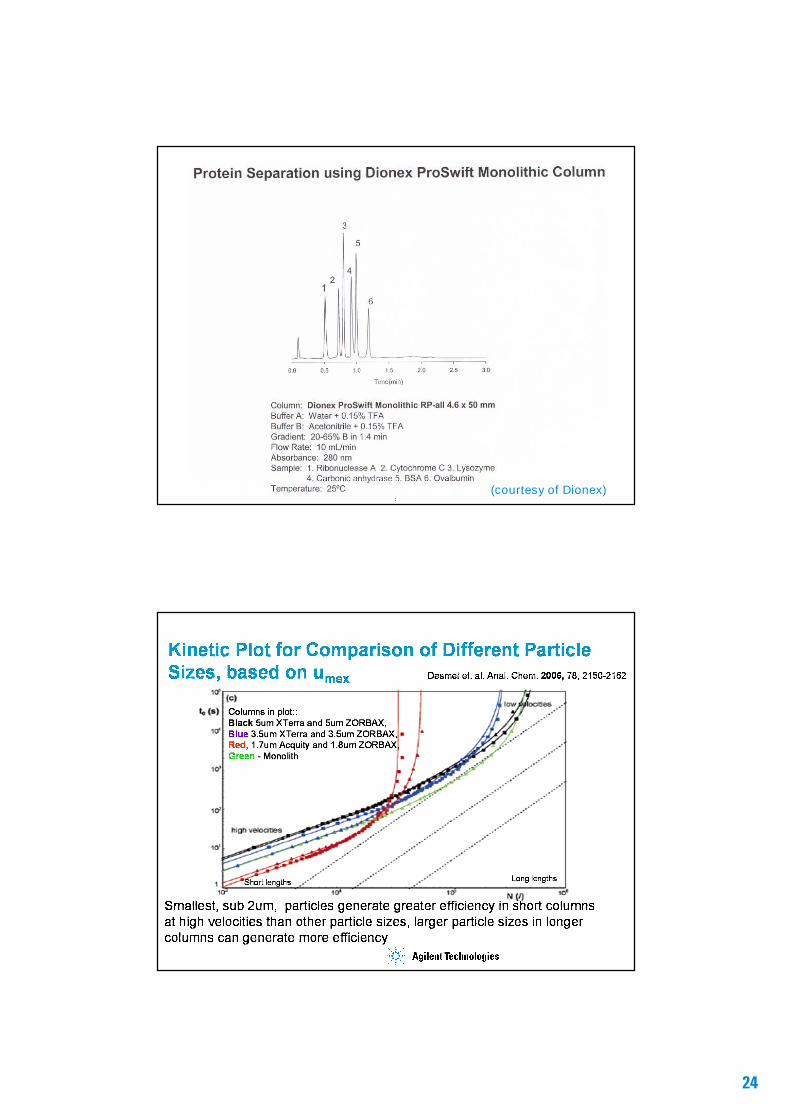
Van Deemter Plot A: HETP vs. Linear VelocitySmall Particle Columns including Monolith
0.0000
0.0005
0.0010
0.0015
0.0020
0.0025
0.0030
0.0 0.2 0.4 0.6 0.8 1.0 1.2 1.4
HET
P(c
m/p
late
)
Interstitial Linear Velocity (ue)
Dimensions: 4.6 x 50/30/20mmEluent : 85:15 ACN:WaterFlow Rates: 0.05 – 5.0 mL/minTemp: 20°CSample: 1.0L Octanophenone in Eluent
ZORBAX 5.0mZORBAX 3.5mVendor A 2.5mVendor B 2.0mZORBAX 1.8mMonolith

22
Mobile Phase:A-ACNB-H 2O
Gradient:t A B flow[min] [%] [%] [ml/min]
0,0 15 85 1,500,4 15 85 1,502,0 100 0 1,002,5 100 0 1,002,6 15 85 1,003,0 15 85 1,00
Injection: 0,5µlDetection: 240 nm UVTemperature: 40°C
Sample: 1.) Fluoxymesterone2.) Boldenone3.) Methandrostenolone4.) Testosterone5.) Methyltestosterone6.) Boldenone acetate7.) Testosterone acetate8.) Nandrolone propionate9.) Testosterone propionate
10.) Nandrolone phenylpropionate11.) Testosterone isocaproate
0 0,5 1 1,5 2 2,5t [min]
Chromolith® FastGradient (50-2mm)Fast Analysis of Steroids (Doping Substances)
(Courtesy of Merck KGaA)
Example of Monolithic Polymer forBiochromatography
CIM = Convective Interactive Media (BIA Separations)
- Crosslinked, porous monolithic polymer (GMA-EDMA)- Available in disks and tubes- IEX, HIC, RPC, affinity phases available- Can be stacked and used for multi-modal separations- Purification, process control, SPE, trace enrichment

23
Separation of Oligodeoxynucleotides onCIM DEAE Disk
Separation Device: CIM DEAE Disk,diameter: 16 mm, 3 mm thick,active bed volumne: 0.34 mL
Instrument:: HPLC system with low deadvolume mixing chamber
Sample: 10-ug of each in 1 mL buffer AInjection Volume: 20-uLBuffer A: 20 mM Tris-HCl, pH 7.4Buffer B: Buffer A + NaClGradient: Shown on chromatogramFlow Rate: 6 mL/minDetection: UV at 260-nmSample:No.of Bases 5'-3' Sequence Short Name8 CCA TGT CT 8mer10 GTC CAT GTC T 10mer12 AGG TCC ATG TCT 12mer14 CGA GGT CCA TGT CT 14mer15 CCGAGGTCC ATG TCT 15mer16 GCCG AGG TCC ATG TCT 16mer
(Courtesy of BIA Separations)
Preparative Scaleup with CIM Column Modules
Disk, 0.34-mL
Tube, 8-mL
Tube, 80-mL
(Courtesy of BIA Separations)
Latest Additions:- 800-mL- 8-L (200g protein,
2-L/min flow)
24
(courtesy of Dionex)

25
Analysis of Alkylphenone Standard on a Set of 8Columns of 25 cm x 2.1 mm i.d. Packed with 5 µm
Particles of Zorbax 300SB-C18 material.
min0 10 20 30 40 50
mAU
0
50
100
150
200
250
DAD1A,Sig=245,8Ref=400,80(C:\CHEM32\1\DATA\8COL-TESTMIX\33PHENONES12006-07-18\8COL-2000007.D)
23.98
1
26.1
41
27.97
5
30.1
4631
.043
33.1
29
37.34
7
43.2
30
Isocratic (70% acetonitrile – 30% water), 0.2 mL/min, 60°CCompounds: acetanilide (23.98 min), acetophenone (26.14 min), propiophenone (27.97 min), butyrophenone (30.15min), benzophenone (31.04 min), valerophenone (33.13 min), hexanophenone (37.35 min), heptanophenone (43.23min).
Plates: ~ 200,000
(courtesy of Pat Sandra, RIC)
Analysis of Peptide Standard Mixture on a Set of8 columns of 25 cm x 2.1 mm i.d. x 5 µm Zorbax
300SB-C18 material.
min0 50 100 150 200 250 300 350 400
mAU
0
25
50
75
100
125
150
175
DAD1B,Sig=214,4Ref=off, TT(C:\CHEM32\1\DATA\BSA21MM\3BSA21MM_FINAL2006-06-12\FINAL-000003.D)
25.5
25
165.4
51 249.
871
271
.338
319.
255
361.
883
363.
004
Standard mixture: Proteomix (containing 5 peptides and a-cyano-4-hydroxy-cinnamic acid,LaserBio Labs, Sophia-Antipolis, France). Gradient: 2% to 70% acetonitrile (+0.1% TFA) inwater (+0.1 % TFA) in 500 min. Flow rate: 0.2 mL/min. Column temperature: 60°C.
Peak Capacity: 900
(courtesy of Pat Sandra, RIC)

26
1) Shorter column lengths (to reduce analysis time) packed with small porousparticles (to maintain resolution). (Reasonable # of plates and reasonablepressure, fast separation)
2) Longer column lengths (to increase efficiency) packed with even smaller porousand non-porous particles (to maintain resolution), with the ultimate being the so-called “Ultra-High Pressure LC”. (Many plates, fast separation, high pressure)
3) Columns packed with various small superficially porous particles (pellicular) particlesizes, pore sizes and phase thickness to allow the rapid resolution ofbiomolecules such as proteins as well as small molecules. (Large and smallmolecules, fast separations, lower pressure)
4) Columns designed with silica- and polymer-based monolith stationary phase formats(fast separation, low pressure, in-series columns)
5) Parallel LC (multiple capillary columns/channels, increased samples/hour)
Some Ways to Increase Sample Throughput(and Resolution)
What is Parallel LC?
30” BenchtopOne Lab
Eksigent®
Sepiatec®
8-Channel HPLCConventional Single-ChannelHPLC
27
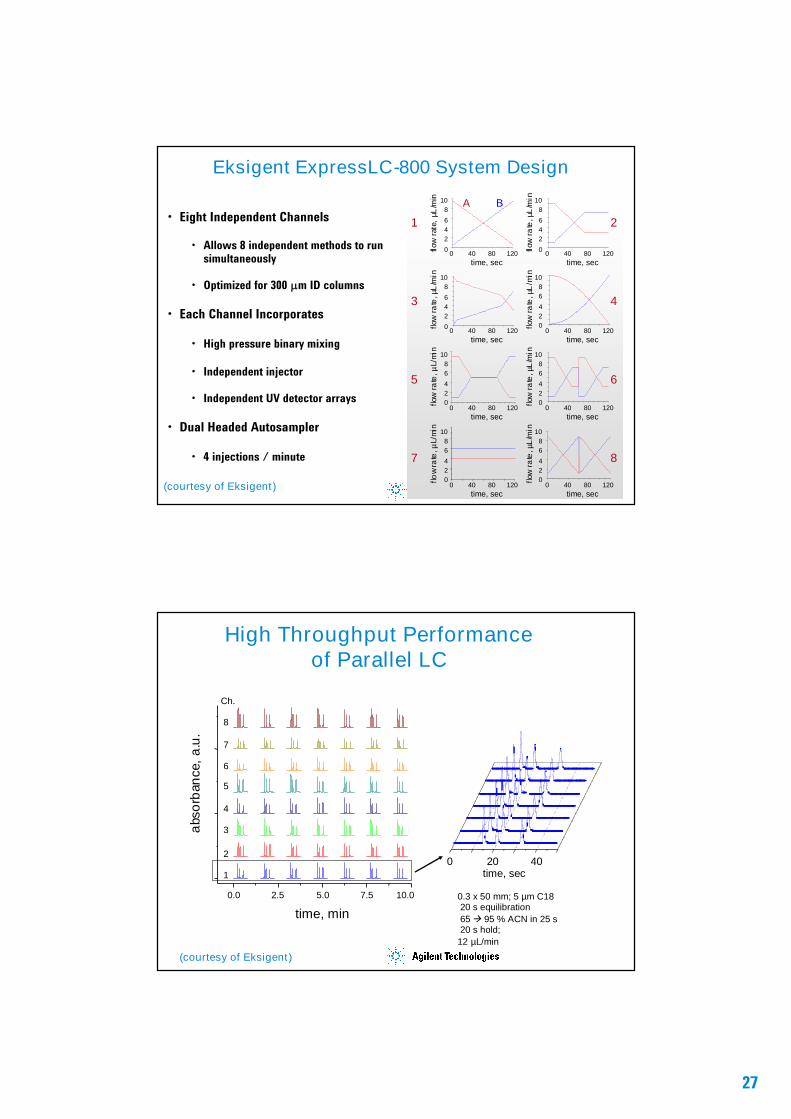
• Eight Independent Channels
• Allows 8 independent methods to runsimultaneously
• Optimized for 300 m ID columns
• Each Channel Incorporates
• High pressure binary mixing
• Independent injector
• Independent UV detector arrays
• Dual Headed Autosampler
• 4 injections / minute
1
3
5
7
2
4
6
8
A B
0
246
810
flow
rate
,µL
/min
0 40 80 120time, sec
0
246
810
flow
rate
,µL
/min
0 40 80 120time, sec
024
68
10flo
wra
te,µ
L/m
in
0 40 80 120time, sec
024
68
10
flow
rate
,µL/
min
0 40 80 120time, sec
0
246
810
flow
rate
,µL
/min
0 40 80 120time, sec
024
68
10
flow
rate
,µL
/min
0 40 80 120time, sec
024
68
10
flow
rate
,µL
/min
0 40 80 120time, sec
024
68
10
flow
rate
,µL
/min
0 40 80 120time, sec
Eksigent ExpressLC-800 System Design
(courtesy of Eksigent)
High Throughput Performanceof Parallel LC
10.00.0 2.5 5.0 7.5
8
7
6
5
3
2
4
abs
orb
ance
,a
.u.
time, min
1
0.3 x 50 mm; 5 µm C1820 s equilibration65 95 % ACN in 25 s20 s hold;
12 µL/min
0 20 40time, sec
Ch.
(courtesy of Eksigent)
28
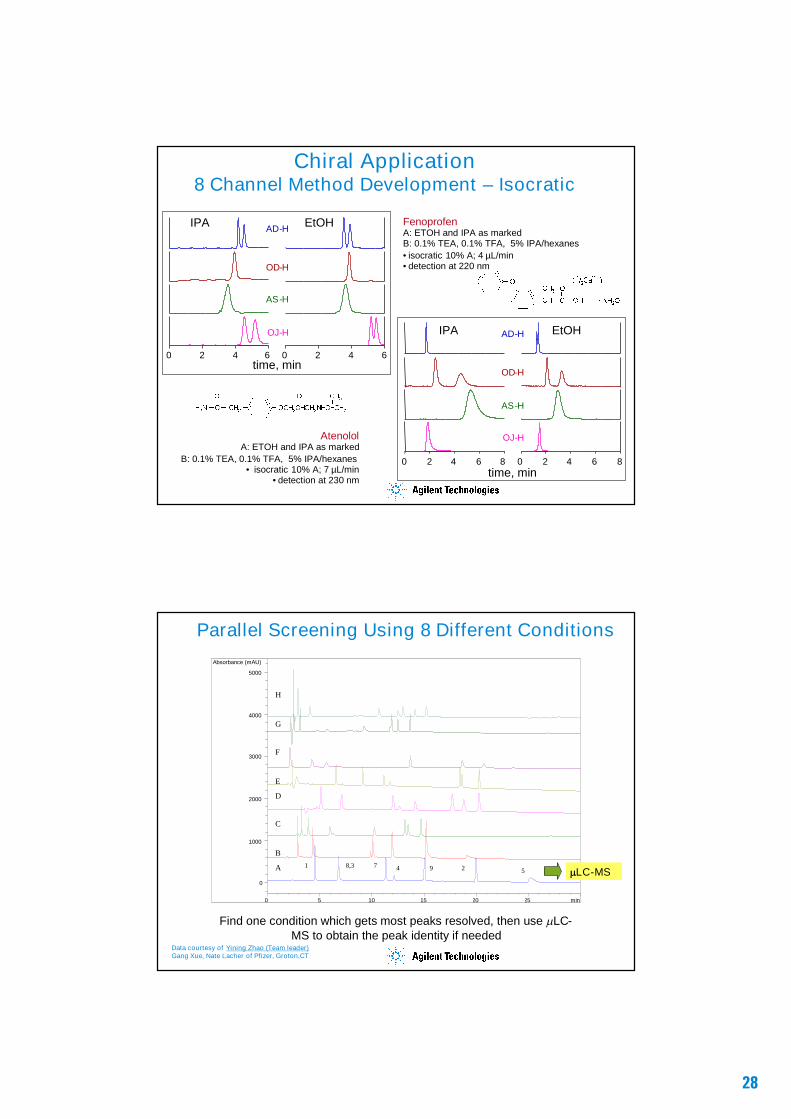
Chiral Application8 Channel Method Development – Isocratic
FenoprofenA: ETOH and IPA as markedB: 0.1% TEA, 0.1% TFA, 5% IPA/hexanes• isocratic 10% A; 4 µL/min• detection at 220 nm
AtenololA: ETOH and IPA as marked
B: 0.1% TEA, 0.1% TFA, 5% IPA/hexanes• isocratic 10% A; 7 µL/min
• detection at 230 nm
IPA EtOH
time, min6420 6420
AD-H
OD-H
AS-H
OJ-H IPA EtOH
time, min86420 86420
AD-H
OD-H
AS-H
OJ-H
Parallel Screening Using 8 Different Conditions
Find one condition which gets most peaks resolved, then use LC-MS to obtain the peak identity if needed
min0 5 10 15 20 25
Absorbance (mAU)
0
1000
2000
3000
4000
5000
94 2 578,31
H
G
F
E
D
C
B
A LC-MS
Data courtesy of Yining Zhao (Team leader)Gang Xue, Nate Lacher of Pfizer, Groton,CT
29
Conclusions• High-speed and/or high resolution HPLC separations can be performed
by a variety of approaches depending on time, sample complexity andsensitivity requirements
• Short columns, small particles (3.5- and sub-2-µm particles)(reasonable # of plates, fast separations, reasonable pressure)
• Long columns, smaller particles (down to 1.5-µm) (complex samples,reasonable separation times, high- or ultra-high pressure)
• Superficially porous particles for fast separations of bothbiomolecules and small molecules
• Polymeric or silica-based monoliths (low pressure drop, fastseparations, macromolecular or small molecule separations)
• An alternative approach is to use parallel LC with capillary columns
• Instrumental configurations may have to be modified to make thesevery fast separations possible and practical with available hardware.These changes involve decreasing extra column effects, increasingdata rate, decreasing dwell volume, smaller flow cells and so on.
Acknowledgements
• Colleagues at Agilent-Cliff Woodward (deceased), Bill Long,Maureen Joseph, John Henderson, Bud Permar and Bill Barber
• Manufacturers who supplied data on their products (Merck,Eksigent, Supelco, BIA Separations)
• Yining Zhang at Pfizer for parallel LC data
AND LAST BUT NOT LEAST
• Thanks to you the audience for listening to my marathonpresentation!