hp eds 2006 annual report
TRANSCRIPT

Delivering Results NOW
A Message From Michael H. Jordan • 2007 Annual Meeting Notice • Proxy Statement • 2006 Financial Information
eds.com
2006 Annual ReportEDS and the EDS logo are registered trademarks of Electronic Data Systems Corporation. All other brand or product names are
trademarks or registered marks of their respective owners. EDS is an equal opportunity employer and values the diversity of its people.
Copyright © 2007 Electronic Data Systems Corporation. All rights reserved. 03/2007 6GCJH6347
Contact us
Corporate Headquarters
United States
5400 Legacy DrivePlano, Texas 75024
USA
1 800 566 9337
Regional Headquarters
Asia
36F, Shanghai Information Tower211 Century Avenue
Pudong, ShanghaiChina 200120
86 21 2891 2888
Australia & New Zealand
Level 1, The Bond30 Hickson Road
Millers Point Sydney
New South Wales 2000Australia
612 8965 0500
Canada33 Yonge StreetToronto, Ontario
M5E 1G4 Canada
1 416 814 45001 800 814 9038
(in Canada only)
Europe, Middle East & Africa
2nd Floor Lansdowne House
Berkeley SquareLondon W1J 6ER
44 20 7569 5100
Latin America
Avenida Presidente JuscelinoKubitschek, 1830
5th Floor – Tower 404543-900
São PauloBrazil
55 11 3707 4100
About EDS
EDS (NYSE: EDS) is a leading global technology services company delivering business solutions
to its clients. EDS founded the information technology outsourcing industry more than 40 years
ago. Today, EDS delivers a broad portfolio of information technology and business process
outsourcing services to clients in the manufacturing, financial services, healthcare, communica-
tions, energy, transportation, and consumer and retail industries and to governments around
the world. Learn more at eds.com.
Printed entirely on recycled and recyclable paper.


To Our Shareholders,
This annual report marks the fourth since we began the revitalization of EDS. Our progress continues to be sure and
steady – with a strong finish to a good year in 2006. This momentum reflects a clear strategy well executed by our
employees – all committed to our clients’ success.
We are winning in the marketplace and increasing client satisfaction through a relentless focus on quality, cost
and operational excellence. As a result, your company is delivering improved financial performance – accelerating
growth and improving operating margins.
EDS increased market share as our technology vision and customer-focused service culture resonated with clients.
We deployed cash more effectively while investing heavily in our capabilities and cost competitiveness. Strategic
acquisitions filled gaps in our business, expanding EDS’ global reach and expertise.
Accountability became a watchword throughout the company. We adopted a zero-outages delivery mindset. We
believe this highly disciplined approach already is differentiating us in the marketplace.
In sum, we set a foundation for sustainable and profitable growth. In 2006, EDS:
Gained market share. We reached our highest total contract value for new business signings since 2001. Total con-
tract value increased 32 percent from a year ago to $26.5 billion. Business sold to “new logo” accounts represented
$4.2 billion – up nearly 70 percent. These clients included Kraft Foods and global telecommunications giant Vodafone.
We gained ground in the applications space, seeing total contract value rise by almost 50 percent. EDS also won
several important “recompetes,” contract modifications and extensions, deepening relationships with existing clients,
including General Motors, the U.S. Department of the Navy and the U.K. government.
Improved operational excellence. We completed our Global Services Network, the backbone of our Global Delivery
System. Unique to EDS, this system enhances business continuity, security and service flexibility for clients. Our
service delivery standardization and automation initiatives increased both productivity and service quality – and
ultimately moved the needle higher on client satisfaction. At the same time, we continued to enhance the skills of
our people, providing employees with almost 3 million hours of training.
Expanded Best ShoreSM presence. We continued to realign our work force with strong offshore capabilities, making
us more price competitive and responsive to client needs. We more than doubled our presence in high-quality, lower-
cost locations to 32,000 employees. While India was the primary beneficiary, we also are migrating our work force to
other regions such as Latin America, China, Hungary and Poland.
Filled important capability gaps. We invested in applications and business process outsourcing (BPO) capabilities,
including the acquisition of a majority stake in MphasiS. MphasiS enhances our global delivery model, adding top applica-
tions, BPO and financial industry skills to our portfolio, while more than tripling our presence in India. Our acquisition of
GEMS increased our ability to provide solutions in SAP enterprise management and customer relationship management.
Strengthened our management team. We promoted Ron Rittenmeyer to president and chief operating officer,
recognizing his many contributions to EDS in a short time. Ron’s commitment to instill accountability and quality
at every level is improving our operations worldwide. We leveraged account management and delivery through
regional hubs and Global Service Centers to maximize our expertise and concentrate our skills base. EDS also
recommitted to a strong industry focus. We put in place a team of proven leaders to engage clients across key indus-
tries and address their business needs.
5400 Legacy Drive Plano, Texas 75024

Further strengthened our financial foundation. In 2006, we doubled our net income and significantly increased
our operating margin, putting us on the pathway to our long-term goals. We also drove a more than 40 percent
increase in free cash flow through improved operating performance and growth. At the same time, our net debt
stayed essentially flat while we continued to invest in products, tools and cost competitiveness.
As we look back over the last four years, EDS has improved across the board:
We have transitioned from significant operating losses to earnings of nearly a dollar per share from
continuing operations.
EDS’ free cash flow, a good measure of a company’s health, has increased fourfold.
Our net debt is now essentially zero.
Total contract value has nearly doubled.
With a solid foundation in place, we believe we are better positioned than ever to deliver on our commitments to
clients and drive strategic value.
The Flat New World
A few years ago, we outlined a set of beliefs on the direction of the global marketplace and the role of rapidly chang-
ing technologies. Today, these beliefs are a reality. Globalization continues to accelerate. Wireless technologies and
extended supply chains have widened the scale and scope of global networks.
The world has truly flattened, changing the nature of when, how and where work gets done. Business ecosystems
now dominate. And, information security and privacy have become paramount in a world where international bound-
aries yield to millions of electronic transactions daily.
As a technology services leader, we recognize the increasing demands placed on governments and businesses today.
We see the issues our clients face. They need our help to deliver increased productivity, practical innovation, profit-
able growth and never-fail security – all underpinned by outstanding service quality.
For them, this means:
Reaching their customers with the right products and services – whenever and however they want them.
Supporting customer interactions – in person and online – with back-end processes that are responsive
and always on.
Having a clear line-of-sight into their entire operations to make intelligent decisions about where the
business is going.
EDS is uniquely qualified to help our clients navigate this new environment and compete more effectively.
Two Major Thrusts Going Forward
Our strategy in 2007 is two pronged. First, we will continue to drive improvements in our base business and broaden
our core capabilities. Second, we must reposition our business and emphasize development of attractive market seg-
ments, where EDS has strong intellectual property, processes and solutions.
Improve our base, broaden core capabilities
We have made significant investments to build a market-leading information technology outsourcing (ITO) platform.
This platform gives us a strong base to compete with and build on. It distinguishes EDS and sets the benchmark for
providers hoping to serve the needs of truly global enterprises.
Unlike the offshore “pure play” approach, EDS’ Global Delivery System – enabled by our Global Services Network –
allows clients to readily access our complete portfolio of services wherever they choose to do business.
•
•
•
•
•
•
•

This network gives us the upper hand to pursue both traditional ITO business – as well as less capital-intensive
infrastructure management services – from Best Shore locations such as Malaysia, Hungary, Brazil and India. These
activities include the remote monitoring and management of servers and desktops, providing end-to-end visibility
for enterprise operations.
We will continue using our infrastructure as a base to add higher-value services. This means adding to our skills base in
applications development and legacy modernization. Modernization services are important because many enterprises
are hampered by outdated legacy systems that cannot handle today’s business demands – much less tomorrow’s.
We will exploit our technology vision, coupled with our focus on execution, to address the issues facing our clients.
Toward that end, we will partner with businesses and governments to transform their organizations into modern,
agile enterprises.
Reposition our business, develop attractive segments
The changes we’ve made in the last few years make us a more competitive and client-focused company. Now, we
need to better position these capabilities to be more visible and valuable for our clients – and to bring greater
growth to our company.
We have identified several foundations for EDS’ growth, including key industries and capabilities. Each one has an
established client base and more than $1 billion in existing business to build from.
Our recommitment to an industry-based approach opens up more opportunities worldwide. We invested heavily
in the best data centers around the globe – all linked by our secure global network. This is a winning combination,
especially for governments, healthcare and financial services industries, where information security is critical.
Creating industry-enabled solutions that combine applications expertise, BPO capabilities and IT infrastructure will
enable EDS to bring more value to our clients. This means delivering solutions that hit their business issues head-on.
For EDS, we expect these solutions to bring growth with higher margins in return for more valuable services.
Delivering Results Now
Talent wins games, but teamwork and intelligence win championships. EDS is in it for the long haul. Our goal is to
become a valued part of the client management team, rather than just a vendor.
To do this for every client, we rely on our people to build deep and lasting relationships – some of which today span
more than a decade. We count on their expertise to provide answers so our clients can perform well and serve their
customers better.
Simply put, EDS delivers results now – for our clients and shareholders. It’s why we’re in business.
Sincerely,
Michael H. Jordan
Chairman and Chief Executive Officer


ELECTRONIC DATA SYSTEMS CORPORATION
NOTICE OF ANNUAL MEETING OF SHAREHOLDERS
TO BE HELD ON APRIL 17, 2007
The Annual Meeting of Shareholders of Electronic Data Systems Corporation (“EDS”) will be held on Tuesday, April 17, 2007, at 1:00 p.m. local time, at the offices of EDS, 5400 Legacy Drive, Plano, Texas 75024. The purpose of the meeting is to:
elect 11 directors to hold office until the next annual shareholders’ meeting or until their respective successors have been elected or appointed;
ratify the appointment of KPMG LLP as our independent auditors for the current year;
consider and vote upon two shareholder proposals, if presented at the meeting; and
act upon such other matters as may be properly presented at the meeting.
The proxy statement fully describes these items. We have not received notice of other matters that may be properly presented at the meeting.
Only EDS shareholders of record at the close of business on February 16, 2007, will be entitled to vote at the meeting.
To ensure that your vote is recorded promptly, please vote as soon as possible, even if you plan to attend the meeting. Most shareholders have three options for submitting their votes prior to the meeting: (1) via the Internet; (2) by phone; or (3) by mail. If you have Internet access, we encourage you to record your vote on the Internet.
It is convenient and saves our company significant postage and processing costs. Your completed proxy, or your telephone or Internet vote, will not prevent you from attending the meeting and voting in person should you so choose.
Please let us know if you plan to attend the meeting by marking the appropriate box on the enclosed proxy card or, if you vote by telephone or Internet, indicating your plans when prompted. If you are a shareholder of record, please bring the top portion of the proxy card to the meeting as your admission ticket. If your shares are held in street name (by a bank or broker, for example), you may bring a recent account statement to the meeting in lieu of the admission ticket.
By order of the Board of Directors,
Storrow M. Gordon Secretary
March 1, 2007

About the Meeting ................................................................................................................................................................................... 1
Record Date and Share Ownership .................................................................................................................................................. 1
Submitting and Revoking Your Proxy ............................................................................................................................................. 1
Vote Required to Adopt Proposals ................................................................................................................................................. 2
Other Matters to be Acted Upon at the Meeting ......................................................................................................................... 2
Expenses of Solicitation .................................................................................................................................................................... 2
Shareholders with Multiple Accounts ............................................................................................................................................ 2
Multiple Shareholders Sharing the Same Address ..................................................................................................................... 2
Corporate Governance and Board Matters ........................................................................................................................................ 3
Board of Directors ............................................................................................................................................................................... 3
Corporate Governance Guidelines .................................................................................................................................................. 3
Director Independence ...................................................................................................................................................................... 4
Communications with the Board ..................................................................................................................................................... 5
EDS Code of Business Conduct........................................................................................................................................................ 5
Committees of the Board .................................................................................................................................................................. 5
Director Qualifications ....................................................................................................................................................................... 6
Identification and Evaluation of Director Candidates ................................................................................................................ 6
Shareholder Proposals and Nomination of Directors ................................................................................................................ 7
Compensation and Benefits Committee Interlocks and Insider Participation ..................................................................... 7
Proposals to be Voted on ....................................................................................................................................................................... 8
Proposal 1: Election of Directors ...................................................................................................................................................... 8
Proposal 2: Ratification of Appointment of Auditors ................................................................................................................10
Audit and Non-Audit Fees to Independent Auditor ............................................................................................................10
Policy on Pre-Approval of Audit and Non-Audit Services ................................................................................................. 11
Report of the Audit Committee ................................................................................................................................................ 11
Proposal 3: Shareholder Proposal Relating to Performance-Based Stock Options ........................................................... 12
Proposal 4: Shareholder Proposal Relating to Special Shareholder Meetings ................................................................... 13
Stock Ownership of Management and Certain Beneficial Owners .............................................................................................. 15
Section 16(a) Beneficial Ownership Reporting Compliance .......................................................................................................... 16
Non-Employee Director Compensation .............................................................................................................................................. 17
Non-Employee Director Summary Compensation Table ..........................................................................................................18
Executive Compensation ....................................................................................................................................................................... 19
Compensation Discussion and Analysis ....................................................................................................................................... 19
Report of the Compensation and Benefits Committee ............................................................................................................25
Summary Compensation Table ......................................................................................................................................................26
Grants of Plan-Based Awards .........................................................................................................................................................28
Stock Option Exercises and Restricted Stock Vesting .............................................................................................................30
Pension Benefits ................................................................................................................................................................................ 31
Non-Qualified Deferred Compensation ....................................................................................................................................... 32
Agreements Related to Potential Payments Upon Termination of Employment .............................................................. 33
Potential Payments Upon Termination or Change of Control ................................................................................................35
Related Party Transactions ..................................................................................................................................................................39
Related Party Transaction Approval Policy ................................................................................................................................39
Certain Relationships and Related Party Transactions ...........................................................................................................39
Table of Contents — 2007 Proxy Statement

PROXY STATEMENT
FOR THE ANNUAL MEETING OF SHAREHOLDERS
TO BE HELD APRIL 17, 2007
The Board of Directors of EDS is soliciting proxies to be used at the 2007 Annual Meeting of Shareholders. Distribution of this Proxy Statement and a proxy form is scheduled to begin on March 9, 2007. The mailing address of EDS’ principal executive offices is 5400 Legacy Drive, Plano, Texas 75024.
About the Meeting
Record Date and Share Ownership
Only holders of record of our common stock at the close of business on February 16, 2007, may vote at the meeting. On that date, 515,965,298 shares of common stock were outstanding. Each share is entitled to cast one vote. The majority of the shares of common stock outstanding on the record date must be present in person or by proxy to have a quorum for the transaction of business at the meeting.
Submitting and Revoking Your Proxy
If you complete and submit your proxy before the meeting, the persons named as proxies will vote the shares represented by your proxy in accordance with your instructions. If you submit a proxy card but do not fill out the voting instructions on the proxy card, your shares will be voted FOR the election of the director nominees set forth in Proposal 1, FOR the ratification of the independent auditors set forth in Proposal 2, and AGAINST the shareholder proposals set forth in Proposals 3 and 4.
To ensure that your vote is recorded promptly, please vote as soon as possible, even if you plan to attend the meeting in person. Most shareholders have three options for submitting their votes prior to the meeting: (1) via the Internet; (2) by phone; or (3) by mail. If you have Internet access, we encourage you to record your vote on the Internet.
It is convenient and saves significant postage and processing costs. If you attend the meeting and are a registered holder (that is, your shares are not held through a bank or brokerage firm and you appear on our stock register as having shares issued in your name), you may also submit your vote in person, and any previous votes that you submitted, whether by Internet, phone or mail, will be superseded by the vote that you cast at the meeting. At this year’s meeting, the polls will close at 2:00 p.m. Central time; any further votes will not be accepted after that time. We intend to announce preliminary results at the meeting and publish final results on our Investor Relations Web site at www.eds.com/investor shortly after the meeting and also in our Quarterly Report on Form 10-Q for the second quarter of 2007.
If you are a registered holder, you may revoke your proxy at any time prior to the close of the polls by: (1) submitting a later-dated vote in person at the meeting, via the Internet, by telephone or by mail or (2) delivering instructions to our Corporate Secretary prior to the meeting by fax to (972) 605-5613 or by mail to 5400 Legacy Drive, MS H3-3A-05, Plano, TX 75024. If you hold shares through a bank or brokerage firm, you must contact that firm to revoke any prior voting instructions.
If you participate in the EDS common stock fund through our 401(k) Plan or hold shares through the EDS Stock Purchase Plan or a dividend reinvestment program, you may receive one proxy card for all shares registered in the same name. Generally, shares in these plans cannot be voted unless the proxy card is signed and returned, although shares held in the 401(k) Plan may be voted in the discretion of the plan trustee.

- 2 -
Vote Required to Adopt Proposals
Each share of our common stock outstanding on the record date will be entitled to one vote on each of the 11 director nominees and one vote on each other matter. Directors receiving the majority of votes cast (number of shares voted “for” a director must exceed the number of shares voted “against” that director) will be elected as a director. For each other proposal, the affirmative vote of the majority of the common stock represented in person or by proxy will be required for approval.
For the election of directors, each director must receive the majority of the votes cast with respect to that director. Shares not present at the meeting and shares voting “abstain” have no effect on the election of directors. For each other proposal, abstentions are treated as shares present or represented and voting, so an abstention will have the effect of a vote against the proposal.
If your broker holds your shares in its name, the broker is permitted to vote your shares on the election of directors and the ratification of our independent auditors even if it does not receive voting instructions from you. However, your broker may not be permitted to exercise voting discretion with respect to some of the matters to be acted upon. Thus, if you do not give your broker specific instructions, your shares may not be voted on those matters and will not be counted in determining the number of shares necessary for approval. When a broker votes a client’s shares on some but not all proposals, the missing votes are referred to as “broker non-votes.” Those shares will be included in determining the presence of a quorum at the meeting but would not be considered “present” for purposes of voting on a non-discretionary proposal. EDS understands that pursuant to New York Stock Exchange (“NYSE”) rules, Proposals 3 and 4 are non-discretionary proposals for which your broker may not exercise voting discretion.
Other Matters to be Acted Upon at the Meeting
We do not know of any other matters to be validly presented or acted upon at the meeting. Under our Bylaws, no business besides that stated in the meeting notice may be transacted at any meeting of shareholders. If any other matter is presented at the meeting on which a vote may properly be taken, the shares represented by proxies will be voted in accordance with the judgment of the person or persons voting those shares.
Expenses of Solicitation
EDS is making this solicitation and will pay the entire cost of preparing, assembling, printing, mailing and distributing these proxy materials and soliciting votes. If you choose to access the proxy materials and/or vote over the Internet, you are responsible for any Internet access charges you may incur. Our officers and employees may, but without compensation other than their regular compensation, solicit proxies by further mailing or personal conversations, or by telephone, facsimile, e-mail or otherwise. We will, upon request, reimburse brokerage firms and others for their reasonable expenses in forwarding proxy materials to beneficial owners of our common stock.
Shareholders with Multiple Accounts
Shareholders who previously have elected not to receive an annual report for a specific account may request EDS to promptly mail its 2006 Annual Report to that account by writing EDS Investor Relations, 5400 Legacy Drive, Mail Stop H1-2D-05, Plano, Texas 75024, or by calling (888) 610-1122 or (972) 605-6661.
Multiple Shareholders Sharing the Same Address
We have adopted a procedure approved by the Securities and Exchange Commission (“SEC”) called “householding,” which reduces our printing costs and postage fees. Under this procedure, shareholders of record who have the same address and last name and do not participate in electronic delivery of proxy materials will receive only one copy of our annual report and proxy statement unless one or more of these shareholders notify us that they wish to continue receiving individual copies. Shareholders who participate in householding will continue to receive separate proxy cards.
If a shareholder of record residing at such an address wishes to receive a separate document in the future, he or she may contact our transfer agent at 1-800-250-5016 or write to The Bank of New York Shareholder Relations, PO Box 11258, New York, NY 10286-1258. Shareholders of record receiving multiple copies of our annual report and proxy statement may request householding by contacting us in the same manner. If you own your shares through a bank, broker or other nominee, you can request householding by contacting the nominee.

- 3 -
Corporate Governance and Board Matters
Board of Directors
The Board of Directors is elected by and accountable to the shareholders and is responsible for the strategic direction, oversight and control of EDS. Regular meetings of the Board are generally held five times per year and special meetings are scheduled when necessary. The Board held nine meetings in 2006. All directors attended at least 85% of the meetings of the Board and the Board committees of which they were members during 2006.
Corporate Governance Guidelines
The Board has adopted the EDS Corporate Governance Guidelines to assist it in the performance of its duties and the exercise of its responsibilities and in accordance with the listing requirements of the NYSE. The Governance Committee of the Board is responsible for overseeing the Guidelines and periodically reviews them and makes recommendations to the Board concerning corporate governance matters. The Guidelines are posted on our website at www.EDS.com/investor/governance/guidelines.aspx. The Guidelines cover the following principal subjects:
Expectations of individual directors, including understanding EDS’ businesses and markets, review and understanding of materials provided to the Board, objective and constructive participation in meetings and strategic decision-making processes, regular attendance at Board and Board committee meetings, and attendance at annual shareholder meetings.
Board selection and composition, including Board size, independence of directors, process for determining director independence, number of independent directors, nomination and selection of directors, service on other boards, director retirement, separation of the Chairman and Chief Executive Officer (CEO) positions, director orientation and a mandatory continuing director education program.
Board operations, including number of meetings, requirement for executive sessions of non-management directors, the duties of the Presiding Director, Board access to management, annual CEO evaluation, annual Board and Committee evaluation, management development and succession planning, retention of independent advisors and operation and composition of Board committees.
Other matters, including director compensation, prohibition on consulting agreements with directors, restrictions on charitable contributions to director-affiliated organizations, procedures implementing the majority vote requirement for the election of directors described below, procedures for avoidance or minimization of conflicts of interest, including the related party transaction approval policy described under “Related Party Transactions” below, and the rights plan policy described below.
Executive Sessions. The Guidelines require the non-employee directors to meet in executive session without management present from time to time, and at least twice per year. Executive sessions are a normal part of the Board’s deliberations and activities. One of these meetings is devoted to the evaluation of the CEO and the recommendations of the Compensation and Benefits Committee regarding the CEO’s compensation.
Rights Plan Policy. The Board of Directors redeemed EDS’ shareholder rights plan, sometimes referred to as a “poison pill,” in February 2005. The Board also adopted a policy to obtain shareholder approval prior to adopting any rights plan in the future unless the Board, in the exercise of its fiduciary duties and through a committee comprised of all independent Directors, determines that, under the circumstances then existing, it would be in the best interest of EDS and its shareholders to adopt a rights plan without prior shareholder approval. This policy further provides that if a rights plan is adopted by the Board without prior shareholder approval, the plan must provide that it shall expire within one year of adoption unless ratified by shareholders.
Presiding Director. The Board has an independent Presiding Director who serves as chair of the regularly conducted executive sessions of the Board and all other sessions at which the Chairman is not present. The Presiding Director facilitates communication with the Board and, at the request of any independent director, serves as the liaison between the Chairman and the independent directors. When requested by any independent director or when the Presiding Director deems it appropriate, the Presiding Director can call meetings of the independent directors. The Presiding Director reviews and approves the agenda for each Board meeting and the nature and type of materials to be sent to the Board for each meeting based on that agenda. At least annually, the independent Directors evaluate the Board’s plan for agendas for each meeting in the upcoming year and the information provided at and in advance of meetings and discuss recommendations for any changes to that plan and information in executive session with the Presiding Director, who will communicate those recommendations to the Chairman.

- 4 -
The Presiding Director position is rotated on an annual basis among the Chairpersons of the Board’s three standing Committees. The Chairman of the Audit Committee, Ray J. Groves, currently serves as the Presiding Director through the date of the 2007 Annual Meeting of Shareholders, and the Chairman of the Compensation and Benefits Committee, Ellen M. Hancock, will serve as the Presiding Director thereafter until the 2008 Annual Meeting. The Corporate Governance Guidelines provide that if the position of Chairman is held by an independent director, all duties and responsibilities assigned to the Presiding Director shall be performed by that independent Chairman.
Majority Vote for Election of Directors. In February 2007, the Board amended our Bylaws to provide that in an uncontested election of directors (i.e., where the nominees for director equals the number of directors to be elected), a nominee must receive more votes for than against his or her election to be elected to the Board. The Board expects a director to tender his or her resignation if he or she fails to receive the required number of votes. The Governance Guidelines provide that the Board shall nominate as director only candidates who agree to tender, prior to nomination, irrevocable resignations that will be effective upon (i) the failure to receive the required vote and (ii) the Board’s acceptance of such resignation. Similarly, the Board will fill director resignations and new directorships only with candidates who agree to tender the same form of resignation prior to any subsequent nomination.
The Guidelines further provide that if an incumbent director fails to receive the required vote for election, the Governance Committee will promptly consider whether to accept or reject that director’s previously tendered resignation. The Governance Committee will consider all factors deemed relevant including, without limitation, the stated reasons why shareholders voted against the election of the director, the length of service and qualifications of the director whose resignation has been tendered, the director’s contributions to EDS, and the impact of the resignation on any contractual and regulatory requirements. The Board will act on the Governance Committee’s recommendation no later than 90 days following the date of the shareholders’ meeting when the election occurred. In considering the Governance Committee’s recommendation, the Board will review the factors considered by the Governance Committee and such additional information and factors the Board believes to be relevant. Absent a compelling reason for the director to remain on the Board, it is the Board’s intention to accept the resignation. We will promptly publicly disclose the Board's decision, together with an explanation of the process by which the decision was reached and, if applicable, the reasons for rejecting the tendered resignation.
Any director who tenders his or her resignation pursuant to this provision is expected to not participate in the Governance Committee recommendation or Board consideration regarding whether or not to accept the tendered resignation. If a majority of the members of the Governance Committee are not duly elected under the Bylaws at the same election, then the independent directors who are elected will designate a group amongst themselves to recommend to the remaining elected independent Directors whether to accept or reject the tendered resignations.
Director Independence
The Board assesses the independence of each non-employee director not less frequently than annually in accordance with the Corporate Governance Guidelines. Under the Guidelines for Assessing Independence of EDS’ Directors, a director cannot be independent unless the Board affirmatively determines that he or she has no material relationship with EDS, either directly or as a partner, shareholder or officer of an organization that has a relationship with EDS, and has none of the other relationships listed in the guidelines that would disqualify the director from being independent under the rules of the NYSE. As contemplated by the NYSE rules, the Board also adopted categorical standards to assist in determining whether any material relationship with EDS exists. Directors who have any of the relationships outlined in such categorical standards are considered to have relationships that require a “full facts and circumstances review” by the Board in order to determine whether it constitutes a material relationship with EDS for purposes of his or her independence. The Independence Guidelines, including such categorical standards, are posted on our website at www.EDS.com/investor/governance/independence.aspx.
In February 2007, the Board assessed the independence of each non-employee director under the Independence Guidelines. The Board determined, after careful review, that all non-employee directors (Mr. Dunbar, Mr. Enrico, Mr. Faga, Dr. Gillis, Mr. Groves, Ms. Hancock, Mr. Hunt, Mr. Kangas, Mr. Sims, and Mr. Yost) are independent. There were no relationships outlined in the categorical standards with any non-employee director that required a “full facts and circumstances review” by the Board. The Board also determined that each member of the Audit Committee meets the additional independence standards of the NYSE and SEC applicable to Audit Committee members. Such standards require that the director not be an affiliate of EDS and cannot accept from EDS, directly or indirectly, any consulting, advisory or other compensatory fee, other than fees for serving as a director.

- 5 -
Communications with the Board
Individuals may communicate with the Presiding Director by e-mail to [email protected] or in writing to Presiding Director, c/o Corporate Secretary, 5400 Legacy Drive, MS H3-3A-05, Plano, Texas 75024.
Communications intended for any other non-management director should also be sent to the above address. Further information regarding the procedures for communications with the Presiding Director is posted on our website at www.EDS.com/investor/governance/communication.aspx.
EDS Code of Business Conduct
EDS is committed to conducting its business ethically and with integrity. We believe that integrity is the sum of the ethical performance of the people of EDS and fosters successful long-term relationships with clients, a better overall work environment and a culture of compliance with both the letter and spirit of the law that ultimately brings value to our shareholders. The EDS Code of Business Conduct, first adopted over a decade ago, has been continually updated to reflect the values we expect of the directors, officers and employees of the entire EDS family of companies. The Code of Business Conduct meets the standards for a “code of ethics” applicable to our principal executive officer, principal financial officer, and principal accounting officer or controller for purposes of applicable SEC rules and satisfies the requirements of the NYSE for a code of business conduct applicable to all directors, officers and employees. The EDS Code of Business Conduct is posted on our website at www.EDS.com/investor/governance/code.aspx. You may also request a copy of the Code of Business Conduct by writing EDS Investor Relations at 5400 Legacy Drive, MS H1-2D-05, Plano, TX 75024, or by calling (888) 610-1122 or (972) 605-6661. We will disclose any amendment or waiver of a provision of the Code of Business Conduct that applies to our principal executive officer, principal financial officer, principal accounting officer or controller, or that relates to any element of the definition of a “code of ethics” under applicable SEC rules, as well as any amendment or waiver of the Code for any of our directors or any executive officer, on our website at www.EDS.com/investor/governance/code.aspx not later than five business days after the amendment or waiver.
Committees of the Board
The Board has established three Committees to assist it in discharging its responsibilities: the Audit Committee; the Compensation and Benefits Committee; and the Governance Committee. Each committee is composed entirely of independent directors. The Board has adopted a written charter for each committee. Copies of these charters are posted on our website at www.EDS.com/investor/governance/committee.aspx. Shareholders may also request a copy of any committee charter by contacting EDS Investor Relations at the above address or phone number.
Audit Committee. The Audit Committee, which met nine times in 2006, is composed of Ray J. Groves (Chair), W. Roy Dunbar, S. Malcolm Gillis and Edward A. Kangas. The Board of Directors has determined that Messrs. Groves and Kangas are audit committee financial experts within the meaning of SEC regulations, and that all members of the Audit Committee are independent within the meaning of the NYSE’s listing standards. The Audit Committee assists the Board in fulfilling its responsibilities for oversight of the integrity of EDS’ financial statements, EDS’ compliance with legal and regulatory requirements, the independent auditors’ qualifications and independence, and the performance of EDS’ internal audit function and independent auditors. Among other things, the Audit Committee appoints and determines the compensation of EDS’ independent auditors; reviews and evaluates the performance and independence of the independent auditors; reviews the scope and plans for the external and internal audits; reviews and discusses reports from the independent auditors regarding critical accounting policies, alternative treatments of financial information and other matters; reviews significant changes in the selection or application of accounting principles; reviews the internal control report of management, any issues regarding the adequacy of internal controls and any remediation efforts; reviews legal matters that could materially impact EDS’ financial statements; reviews the EDS Code of Business Conduct to determine whether it complies with applicable law and discusses reports from the Office of Ethics and Business Conduct concerning compliance with the Code of Business Conduct; and reviews EDS’ guidelines and policies with respect to risk assessment and risk management. The Audit Committee also reviews with management and the independent auditors EDS’ quarterly and annual financial statements and other public financial disclosures prior to their release. The report of the Audit Committee is included below.
Compensation and Benefits Committee. The Compensation and Benefits Committee (“CBC”), which met seven times in 2006, is composed of Ellen M. Hancock (Chair), Martin C. Faga, James K. Sims and R. David Yost. Messrs. Faga and Sims were appointed to the CBC in October 2006, at which time Roger A. Enrico resigned from the committee. The CBC reviews and approves annual goals and objectives relevant to the CEO’s compensation

- 6 -
and evaluates the CEO’s performance against such goals and objectives. The CBC approves all salary and other compensation for our other executive officers and the performance goals for our performance-based executive plans. It also reviews and approves all new benefit and equity compensation plans and programs, as well as amendments to existing plans and programs, and reviews and makes recommendations to the Board regarding director compensation. Each member of the CBC is an independent director, and no former employee of EDS serves on the CBC.
Governance Committee. The Governance Committee, which met five times in 2006, is composed of Roger A. Enrico (Chair), Ellen M. Hancock and Ray L. Hunt. The Governance Committee develops, and makes recommendations to the Board for approval of, our policies and practices related to corporate governance, including the EDS Corporate Governance Guidelines. In addition, the committee develops the criteria for the qualification and selection of candidates for election to the Board, including the standards and processes for determining director independence, and makes recommendation to the Board regarding such candidates as well as the appointment of directors to serve on Board committees. The committee is also responsible for the development and oversight of the company’s director orientation and education programs. The committee recommends to the Board the election of the Chairman and the CEO, reviews the CEO’s recommendations regarding the election of other principal officers, reviews and develops with the CEO management succession plans, and makes recommendations regarding shareholder proposals. The procedures for submission by a shareholder of a director nominee or other proposal are described under “Shareholder Proposals and Nomination of Directors” below.
Director Qualifications
The Governance Committee will select nominees for director on the basis of their integrity, experience, achievements, judgment, intelligence, personal character, ability to make independent analytical inquiries, willingness to devote adequate time to Board duties, and the likelihood that they will be able to serve on the Board for a sustained period. To be recommended by the Governance Committee for election to the Board, a nominee must also meet the expectations for individual directors set forth in the EDS Corporate Governance Guidelines, including understanding EDS’ businesses and the marketplaces in which it operates. In addition, a nominee must not have conflicts or commitments that would impair his or her ability to attend scheduled Board meetings or annual shareholders meetings, not hold positions that would result in a violation of legal requirements, and meet any applicable legal or regulatory requirements for directors of government contractors. In selecting nominees, the Governance Committee will also consider the nominee’s global experience, experience as a director of a large public company and knowledge of particular industries.
Identification and Evaluation of Director Candidates
The Governance Committee uses a variety of means for identifying nominees for director, including third-party search firms and recommendations from current Board members and shareholders. In determining whether to nominate a candidate, the Governance Committee considers the current composition and capabilities of serving Board members, as well as additional capabilities considered necessary or desirable in light of existing needs, and then assesses the need for new or additional members to provide those capabilities. In most instances, all members of the Governance Committee, as well as one or more other directors, will interview a prospective candidate. The Governance Committee will also contact any other sources, including persons serving on another board with the candidate, it deems appropriate to develop a well-rounded view of the candidate. Reports from the interview with the candidate and/or Governance Committee members with personal knowledge and experience with the candidate, information provided by other contacts, the candidate’s resume, and any other information deemed relevant by the Governance Committee will be considered in determining whether a candidate should be nominated.
In evaluating whether to nominate a director for re-election, the Governance Committee will consider the following: the director’s attendance at Board and Board Committee meetings; the director’s review and understanding of the materials provided in advance of meetings and other materials provided to the Board from time to time; whether the director actively, objectively and constructively participated in such meetings and in the company’s strategic decision-making process in general; the director’s compliance with the Corporate Governance Guidelines; and whether the director continues to possess the qualities and capabilities expected of Board members discussed above. The Governance Committee will also consider input from other Board members concerning the performance and independence of that director. Generally, the manner in which the Governance Committee evaluates nominees for director recommended by a shareholder will be the same as that for nominees from other sources. However, the Governance Committee will also seek and consider information concerning the relationship between a shareholder’s nominee and that shareholder to determine whether the nominee can effectively represent the interests of all shareholders.

- 7 -
Shareholder Proposals and Nomination of Directors
Shareholders may submit proposals, including director nominations, for consideration at future shareholder meetings.
Shareholder Proposals. For a shareholder proposal to be considered for inclusion in our proxy statement for an annual shareholders’ meeting, the written proposal must comply with the requirements of SEC Rule 14a-8 regarding the inclusion of shareholder proposals in company-sponsored proxy materials. Proposals should be addressed to:
Corporate Secretary, Electronic Data Systems Corporation 5400 Legacy Drive, Mail Stop H3-3A-05 Plano, Texas 75024 Fax: (972) 605-5610
Our 2008 Annual Meeting of Shareholders is currently scheduled for April 15, 2008. Under SEC rules, shareholder proposals to be considered for inclusion in our proxy statement for that meeting must be received by the Corporate Secretary not later than November 9, 2007. See “By-law Procedures” below for a description of procedures that shareholders must follow to introduce an item of business at an annual meeting in addition to the SEC Rule 14a-8 requirements to have the proposal included in our proxy statement.
Nomination of Director Candidates. The Governance Committee will consider candidates recommended by shareholders who beneficially own not less than 1% of the outstanding Common Stock. Eligible shareholders wishing to make such recommendations to the Governance Committee for its consideration may do so by submitting a completed “Shareholder Recommendation of Candidate for Director” form to the Secretary of the Governance Committee by e-mail to [email protected] or by mail to 5400 Legacy Drive, Mail Stop H3-3A-05, Plano, TX 75024. This form is posted on our website at www.EDS.com/investor/governance/nominations.aspx. Acopy of the form may also be requested from the Secretary of the Governance Committee. Eligible shareholders who wish to recommend a nominee for election as director at the 2008 annual meeting should submit a completed form not earlier than October 1, 2007, and not later than November 9, 2007. Generally, candidates recommended by an eligible shareholder will be evaluated by the Governance Committee under the same process described above. However, the Governance Committee will not evaluate a shareholder-recommended candidate unless and until the potential candidate has indicated a willingness to serve as a director, comply with the expectations and requirements for Board service described above and provide all information required to conduct an evaluation.
Shareholders who wish to nominate a person for election as a director at the next annual meeting may do so in accordance with the By-law procedures described below, either in addition to or in lieu of making a recommendation to the Governance Committee.
By-law Procedures. Our By-laws set forth procedures that shareholders must follow to introduce an item of business at an annual meeting or nominate persons for election as a director. These requirements are separate from and in addition to the SEC Rule 14a-8 requirements that a shareholder must satisfy to have a shareholder proposal included in our proxy statement. These requirements are also separate from the procedures described above that a shareholder must follow to recommend a director candidate to the Governance Committee. Generally, our By-laws require that a shareholder notify the Corporate Secretary of a proposal not less than 90 days nor more than 270 days before the scheduled meeting date. The notice must include the name and address of the shareholder and of any other shareholders known by such shareholder to be in favor of the proposal, as well as a description of the proposed business and reason for conducting the proposed business at the annual meeting. If the notice relates to a nomination for director, it must also set forth the name, age, principal occupation and business and residence address of any nominee(s), the number of shares of common stock beneficially owned by the nominee(s) and such other information regarding each nominee as would have been required to be included in a proxy statement under the SEC’s proxy rules. Our By-laws are posted on our website at www.EDS.com/investor/governance. Shareholders may also contact the Corporate Secretary at the above address for a copy of the relevant By-law provisions.
Compensation and Benefits Committee Interlocks and Insider Participation
None of the members of the Compensation and Benefits Committee are current or former officers or employees of EDS. No interlocking relationship exists between the members of our Board of Directors or our Compensation and Benefits Committee and the board of directors or compensation committee of any other company, nor has any such interlocking relationship existed in the past.

- 8 -
PROPOSALS TO BE VOTED ON
PROPOSAL 1: ELECTION OF DIRECTORS
Our Board of Directors currently has 12 members. Roger A. Enrico will resign as a director immediately following the Annual Meeting and is not standing for re-election. All other current directors are standing for re-election, to hold office until the next Annual Meeting of Shareholders or until their successors are elected and qualified. All nominees were previously elected by shareholders at the 2006 Annual Meeting, other than Messrs. Faga and Sims who were appointed to the Board in September 2006. Mr. Faga had been recommended to the Governance Committee by a non-management director. Mr. Sims had been recommended to the Governance Committee by the Chairman and CEO. If a director nominee becomes unavailable for election, the Board may substitute another person for the nominee, in which event your shares will be voted for that other person.
Pursuant to an amendment to our Bylaws approved by the Board in February 2007, each director nominee must receive more votes “for” than “against” his or her election in order to be elected.
The information below regarding the director nominees is as of February 26, 2007.
The Board of Directors recommends a vote FOR each director nominee.
W. ROY DUNBAR, 45, has been a director of EDS since 2004. He has been President Global Technology and Operations of Master Card International since September 2004. Mr. Dunbar had been president, intercontinental operations of Eli Lilly and Company, responsible for its Asia, Africa/Middle East, Latin America and the Confederation of Independent States operations from January 2004 to September 2004, and was a member of Eli Lilly’s senior management forum. He had served as vice president of information technology and chief information officer of Eli Lilly since 1999. Mr. Dunbar joined Eli Lilly in 1990. He is also a director of Humana Inc.
MARTIN C. FAGA, 65, has been a director of EDS since 2006. He served as the President and Chief Executive Officer of The MITRE Corporation, a non-profit organization providing engineering, research and development services to the U.S. Federal government, from May 2000 to June 2006 and is a current member of its Board of Trustees. He was Vice President at MITRE from 1993-2000. Mr. Faga served as the United States Department of Defense, Assistant Secretary of the Air Force for Space and Director, National Reconnaissance Office, from 1989 to 1993.
S. MALCOLM GILLIS, 66, has been a director of EDS since 2005. He has served as Zingler Professor of Economics and University Professor at Rice University since June 2004. Dr. Gillis was President of Rice University from 1993 to June 2004. He is also a director of Halliburton Company, Service Corporation International and Introgen Therapeutics, Inc.
RAY J. GROVES, 71, has been a director of EDS since 1996. He served as Senior Advisor of Marsh Inc., the insurance brokerage and risk management subsidiary of Marsh & McLennan Companies, Inc., from October 2004 to July 2005, Chairman and Chief Executive Officer from July 2003 to October 2004, President and Chief Executive Officer from January 2003 to June 2003, and President and Chief Operating Officer from October 2001 to January 2003. Mr. Groves was Chairman of Legg Mason Merchant Banking, Inc. from March 1995 to September 2001. He retired as Chairman and Chief Executive Officer of Ernst & Young LLP in September 1994, which position he held since 1977. Mr. Groves is also a director of Boston Scientific Corporation and Overstock.com, Inc.

- 9 -
ELLEN M. HANCOCK, 63, has been a director of EDS since 2004. She has been President and Chief Operating Officer of Jazz Technologies, Inc. and its predecessor Acquicor Technology Inc., since August 2005. Prior to its merger with Jazz Semiconductor, Inc., a wafer foundry, in February 2007, Jazz Technologies (then known as Acquicor) was a blank check company formed for the purpose of acquiring businesses in the technology, multimedia and networking sector. Ms. Hancock was Chairman of Exodus Communications, Inc., a computer network and internet systems company, from June 2000 to September 2001, Chief Executive Officer from September 1998 to September 2001 and President from March 1998 to June 2000. She was Executive Vice President, Research and Development, Chief Technology Officer of Apple Computer Inc. from July 1996 to July 1997. Ms. Hancock previously was Executive Vice President and Chief Operating Officer of National Semiconductor and a Senior Vice President and Group Executive of International Business Machines Corporation. She is also a director of Jazz Technologies, Inc., Aetna Inc. and Colgate-Palmolive Company.
JEFFREY M. HELLER, 67, rejoined EDS in March 2003. He has served as Vice Chairman of EDS since December 2006 and a director since 2003. He was President of EDS from March 2003 to December 2006 and Chief Operating Officer from March 2003 to October 2005. Mr. Heller retired from EDS in February 2002 as Vice Chairman, a position he had held since November 2000. He served as President and Chief Operating Officer of EDS from 1996 to 2000 and Senior Vice President from 1984 to 1996. Mr. Heller joined EDS in 1968 and has served in numerous technical and management capacities. He is also a director of Temple Inland Corp. and Mutual of Omaha.
RAY L. HUNT, 63, has been a director of EDS since 1996. Mr. Hunt has been Chairman of the Board, President and Chief Executive Officer of Hunt Consolidated Inc. and Chief Executive Officer of Hunt Oil Company for more than five years. He is a director of Halliburton Company, PepsiCo, Inc., Bessemer Securities LLC, Bessemer Securities Corporation and King Ranch, Inc. and a manager of Verde Group.
MICHAEL H. JORDAN, 70, has been Chairman and Chief Executive Officer of EDS since March 2003. He was Chairman and Chief Executive Officer of CBS Corporation (formerly Westinghouse Electric Corporation) from July 1993 until December 1998. Prior to joining Westinghouse, Mr. Jordan was a principal with the investment firm of Clayton, Dubilier and Rice from September 1992 through June 1993, Chairman of PepsiCo International from December 1990 through July 1992 and Chairman of PepsiCo World-Wide Foods from December 1986 to December 1990. Mr. Jordan has been chairman of the board of directors of eOriginal, Inc. (electronic document services) since June 1999. He is also a director of Aetna Inc.
EDWARD A. KANGAS, 62, has been a director of EDS since 2004. He was Chairman and Chief Executive Officer of Deloitte Touche Tohmatsu from 1989 to 2000 and Managing Partner of Deloitte & Touche (USA) from 1989 to 1994. Mr. Kangas began his career as a staff accountant at Touche Ross in 1967, where he became a partner in 1975. After his retirement from Deloitte in 2000, Mr. Kangas served as a consultant to Deloitte until 2004. He is also the Chairman of the National Multiple Sclerosis Society and a director of Eclipsys Corporation, Hovnanian Enterprises Inc., Oncology Therapeutics Networks and Tenet Healthcare Corporation (for which he has served as non-executive Chairman since July 2003).
- 10 -
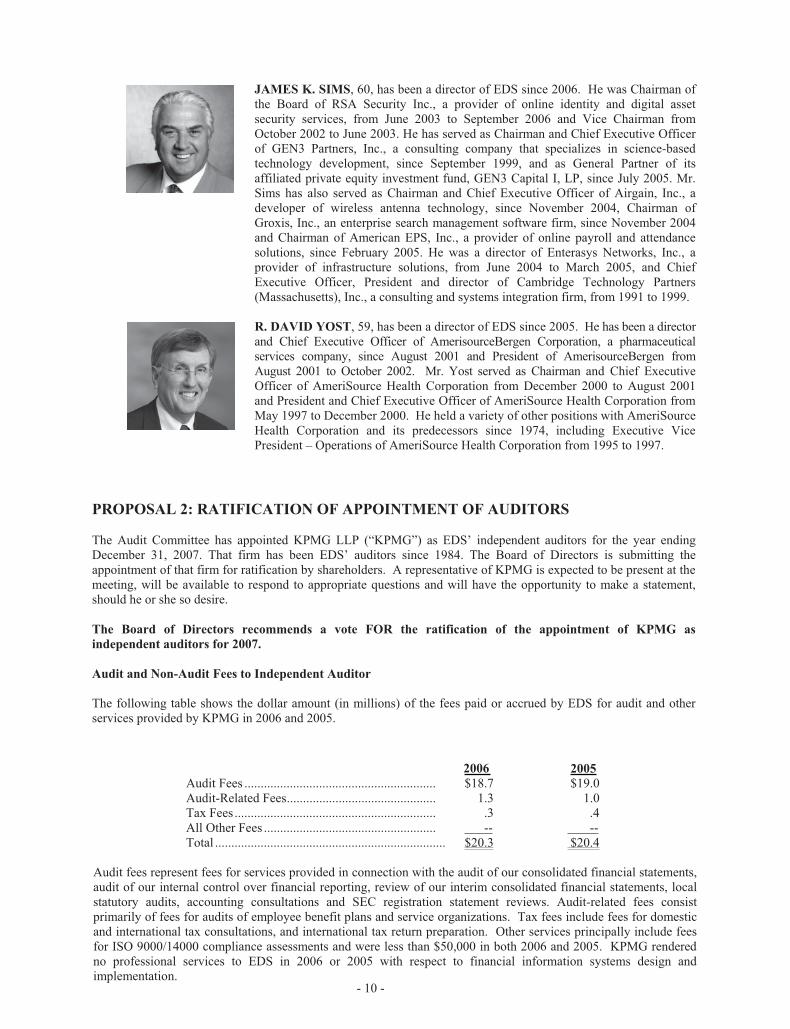
JAMES K. SIMS, 60, has been a director of EDS since 2006. He was Chairman of the Board of RSA Security Inc., a provider of online identity and digital asset security services, from June 2003 to September 2006 and Vice Chairman from October 2002 to June 2003. He has served as Chairman and Chief Executive Officer of GEN3 Partners, Inc., a consulting company that specializes in science-based technology development, since September 1999, and as General Partner of its affiliated private equity investment fund, GEN3 Capital I, LP, since July 2005. Mr. Sims has also served as Chairman and Chief Executive Officer of Airgain, Inc., a developer of wireless antenna technology, since November 2004, Chairman of Groxis, Inc., an enterprise search management software firm, since November 2004 and Chairman of American EPS, Inc., a provider of online payroll and attendance solutions, since February 2005. He was a director of Enterasys Networks, Inc., a provider of infrastructure solutions, from June 2004 to March 2005, and Chief Executive Officer, President and director of Cambridge Technology Partners (Massachusetts), Inc., a consulting and systems integration firm, from 1991 to 1999.
R. DAVID YOST, 59, has been a director of EDS since 2005. He has been a director and Chief Executive Officer of AmerisourceBergen Corporation, a pharmaceutical services company, since August 2001 and President of AmerisourceBergen from August 2001 to October 2002. Mr. Yost served as Chairman and Chief Executive Officer of AmeriSource Health Corporation from December 2000 to August 2001 and President and Chief Executive Officer of AmeriSource Health Corporation from May 1997 to December 2000. He held a variety of other positions with AmeriSource Health Corporation and its predecessors since 1974, including Executive Vice President – Operations of AmeriSource Health Corporation from 1995 to 1997.
PROPOSAL 2: RATIFICATION OF APPOINTMENT OF AUDITORS
The Audit Committee has appointed KPMG LLP (“KPMG”) as EDS’ independent auditors for the year ending December 31, 2007. That firm has been EDS’ auditors since 1984. The Board of Directors is submitting the appointment of that firm for ratification by shareholders. A representative of KPMG is expected to be present at the meeting, will be available to respond to appropriate questions and will have the opportunity to make a statement, should he or she so desire.
The Board of Directors recommends a vote FOR the ratification of the appointment of KPMG as
independent auditors for 2007.
Audit and Non-Audit Fees to Independent Auditor
The following table shows the dollar amount (in millions) of the fees paid or accrued by EDS for audit and other services provided by KPMG in 2006 and 2005.
2006 2005
Audit Fees ........................................................... $18.7 $19.0 Audit-Related Fees.............................................. 1.3 1.0 Tax Fees .............................................................. .3 .4 All Other Fees ..................................................... -- -- Total ....................................................................... $20.3 $20.4
Audit fees represent fees for services provided in connection with the audit of our consolidated financial statements, audit of our internal control over financial reporting, review of our interim consolidated financial statements, local statutory audits, accounting consultations and SEC registration statement reviews. Audit-related fees consist primarily of fees for audits of employee benefit plans and service organizations. Tax fees include fees for domestic and international tax consultations, and international tax return preparation. Other services principally include fees for ISO 9000/14000 compliance assessments and were less than $50,000 in both 2006 and 2005. KPMG rendered no professional services to EDS in 2006 or 2005 with respect to financial information systems design and implementation.
- 11 -
Policy on Pre-Approval of Audit and Non-Audit Services
All audit services, audit-related services, tax services and other services were pre-approved by the Audit Committee, which concluded that the provision of such services by KPMG was compatible with the maintenance of that firm’s independence in the conduct of its auditing functions. The Audit Committee charter provides for pre-approval of any audit or non-audit services provided to EDS by its independent auditors. However, pre-approval is not necessary for non-audit services if: (i) the aggregate amount of all such non-audit services provided to EDS constitutes not more than five percent of the total fees paid by EDS to its independent auditors during the fiscal year in which the non-audit services are provided; (ii) such services were not recognized by EDS at the time of the engagement to be non-audit services; and (iii) such services are promptly brought to the attention of the Audit Committee and approved prior to the completion of the audit by the Audit Committee. The Audit Committee may delegate to one or more of its members pre-approval authority with respect to all permitted audit and non-audit services, provided that any services pre-approved pursuant to such delegated authority shall be presented to the full Audit Committee at its next regular meeting.
Report of the Audit Committee
The Audit Committee reviewed and discussed with management of the company and KPMG LLP, independent auditors for the company, the audited financial statements to be included in the Annual Report on Form 10-K for the year ended December 31, 2006.
The Audit Committee discussed with KPMG LLP the matters required to be discussed by Statement on Auditing Standards No. 61, “Communications with Audit Committees”, as amended.
The Audit Committee received the written disclosures and the letter from KPMG LLP required by Independence Board Standard No. 1, “Independence Discussions With Audit Committees”, and has discussed with KPMG LLP its independence from the company.
In reliance on the reviews and discussions with management of the company and KPMG LLP referred to above, the Audit Committee has recommended to the Board of Directors that the audited financial statements be included in the company's Annual Report on Form 10-K for the year ended December 31, 2006, for filing with the Securities and Exchange Commission.
The Audit Committee reviewed management’s process to assess the adequacy of the company’s system of internal control over financial reporting and management’s conclusions on the effectiveness of the company’s internal control over financial reporting. The Audit Committee also discussed with KPMG LLP the company’s internal control assessment process, management’s assessment with respect thereto and KPMG LLP’s evaluation of the company’s system of internal control over financial reporting.
It is the responsibility of the company’s management to plan and conduct audits and determine that the company’s financial statements are complete and accurate and in accordance with generally accepted accounting principles. In giving its recommendation to the Board of Directors, the Audit Committee has relied on management’s representation that such financial statements have been prepared in conformity with generally accepted accounting principles, and the reports of the company’s independent accountants with respect to such financial statements.
Audit Committee
Ray J. Groves, Chair W. Roy Dunbar S. Malcolm Gillis Edward A. Kangas

- 12 -
SHAREHOLDER PROPOSALS
We expect Proposals 3 and 4 to be presented by a shareholder at the Annual Meeting. The proposals may contain assertions that we believe are incorrect. We have not attempted to refute any inaccuracy. However, the Board has recommended a vote against these proposals for the broader policy reasons set forth following each proposal.
Proposal 3: Shareholder Proposal Relating To Performance-Based Stock Options
John Chevedden, as proxy for William Steiner, has advised us that he intends to present the following resolution at the Annual Meeting:
Resolved, Shareholders request that our Board of Directors adopt a policy whereby at least 75% of future equity compensation (stock options and restricted stock) awarded to senior executives shall be performance-based, and the performance criteria adopted by the Board disclosed to shareowners.
“Performance-based” equity compensation is defined here as: (a) Indexed stock options, the exercise price of which is linked to an industry index; (b) Premium-priced stock options, the exercise price of which is substantially above the market price on the grant date; or (c) Performance-vesting options or restricted stock, which vest only when the market price of the stock exceeds a specific target for a substantial period.
This is not intended to unlawfully interfere with existing employment contracts. However, if there is a conflict with any existing employment contract, our Compensation Committee is urged for the good of our company to negotiate revised contracts that are consistent with this proposal.
As a long-term shareholder, I support compensation policies for senior executives that provide challenging performance objectives that motivate executives to achieve long-term shareowner value. I believe that a greater reliance on performance-based equity grants is particularly warranted at EDS given at least one major example of runaway executive pay.
When EDS showed its Chairman/CEO Dick Brown the door in 2003 it was later revealed that Brown was to receive $30 million in severance. His golden parachute angered investors, who saw the value of their shares tumble roughly 65% in the last year of Brown's reign, while contracts went awry and rivals narrowed the gap between their companies and his.
Many leading investors criticize standard options as inappropriately rewarding mediocre performance. Warren Buffett has characterized standard stock options as “a royalty on the passage of time” and has spoken in favor of indexed options.
In contrast, peer-indexed options reward executives for outperforming their direct competitors and discourage re-pricing. Premium-priced options reward executives who enhance overall shareholder value. Performance-vesting equity grants tie compensation more closely to key measures of shareholder value, such as share appreciation and net operating income, thereby encouraging executives to set and meet performance targets.
Performance Based Stock Options
Yes on 3
_______________
THE BOARD OF DIRECTORS RECOMMENDS
A VOTE AGAINST THIS PROPOSAL FOR THE FOLLOWING REASONS:
The Board of Directors and its Compensation and Benefits Committee (“CBC”) agree that a substantial portion of long-term incentive compensation should be performance-based and have already modified our long-term incentive compensation strategy to achieve that goal.
In 2004, the CBC launched a project to redesign our long-term incentive compensation strategy and considered alternatives which would, among other things, focus executives on long-term metrics that create sustained shareholder value. The CBC sought the input of many of our largest shareholders in connection with this project. As a result, in 2005 the CBC modified our long-term incentive compensation strategy for senior executives to grant an

- 13 -
equivalent value of performance-based restricted stock units (“P-RSUs”) and stock options. The number of P-RSUs that vest under the 2005 and 2006 grants, if any, will be based on EDS’ performance as measured by operating margin, net asset utilization and organic revenue growth over a three-year performance period. These metrics were chosen because of their relevance to our corporate strategy and objectives for the respective performance periods at the time of grant, the ability of executive officers to impact achievement of the performance goals and our belief that achieving or exceeding these goals should result in sustained increases to shareholder value over the longer-term. P-RSU vesting for senior executives can range from 0 to 200% of the “target” award. Stock options also vest three years following the grant date, and any options exercised in the 12 month period after vesting must be exercised for shares only and must be held for 12 months from the exercise date. This provision was implemented to hold senior executives accountable for company performance and stock price even after the stock options vest.
We believe that the narrow definition of “performance-based” in this proposal has significant practical limitations and would not reward the type of performance we are seeking to motivate. Under this proposal, a restricted stock award is not considered “performance-based” unless it provides for vesting when the stock price exceeds a specified target for a substantial period. We believe such a requirement could result in short vesting periods and the loss of the retentive value of the award when the stock price target is achieved. This would not necessarily promote the achievement of sustainable long-term stock price appreciation. By comparison, our P-RSUs, which provide for vesting only if we achieve specified financial performance objectives over a three-year performance period, promote the achievement of results over a sustained period of time that we believe drive long-term stock-price performance. If we do not meet the minimum performance targets required for vesting, the P-RSUs will have no value to our executives.
Similarly, the stock option component of our long-term incentive award is inherently performance-based because it provides no economic benefit unless the trading price for our stock exceeds the exercise price after the vesting requirement has been met. The three-year vesting requirement promotes a long-term focus and sustainable performance. The requirement in this proposal that stock options be “premium-priced” or “indexed” to be performance-based is currently not market competitive and the use of premium-priced options would increase share utilization since we would likely grant additional options to achieve market competitive compensation levels.
Additionally, the narrow definition of “performance-based” compensation in this proposal would not provide the CBC with flexibility to design an effective long-term incentive compensation strategy that takes into account changes in strategic goals, changing economic and industry conditions, modifications in tax laws and accounting requirements, competitive compensation practices, and other relevant factors.
For the foregoing reasons, we believe our long-term compensation strategy more effectively achieves the goal of tying our long-term incentive compensation to our company’s performance than the approach required by this proposal.
Accordingly, the Board unanimously recommends a vote AGAINST this proposal.
Proposal 4: Shareholder Proposal Relating To Special Shareholder Meetings
John Chevedden, as proxy for Nick Rossi, has advised us that he intends to present the following resolution at the Annual Meeting:
RESOLVED, shareholders ask our board of directors to amend our bylaws to give holders of at least 10% to 25% of the outstanding common stock the power to call a special shareholder meeting.
Shareholders should have the ability, within reasonable limits, to call a special meeting when they think a matter is sufficiently important to merit expeditious consideration. Shareholder control over timing is especially important in the context of a major acquisition or restructuring, when events unfold quickly and issues may become moot by the next annual meeting.
Thus this proposal asks our board to amend our bylaws to establish a process by which holders of 10% to 25% of our outstanding common shares may demand that a special meeting be called. The corporate laws of many states (though not Delaware, where our company is incorporated) provide that holders of only 10% of shares may call a special meeting, absent a contrary provision in the charter or bylaws. Accordingly, a 10% to 25% threshold strikes a reasonable balance between enhancing shareholder rights and avoiding excessive distraction at our company.

- 14 -
Prominent institutional investors and organizations support a shareholder right to call a special meeting. Fidelity, Vanguard, American Century and Massachusetts Financial Services are among the mutual fund companies supporting a shareholder right to call a special meeting. The proxy voting guidelines of many public employee pension funds, including the Connecticut Retirement Plans, the New York City Employees Retirement System and the Los Angeles County Employees Retirement Association, also favor preserving this right. Governance ratings services, such as The Corporate Library and Governance Metrics International, take special meeting rights into account when assigning company ratings.
This topic also won 65% support of JPMorgan Chase & Co. (JPM) shareholders at the 2006 JPM annual meeting.
Special Shareholder Meetings
Yes on 4
_______________
THE BOARD OF DIRECTORS RECOMMENDS
A VOTE AGAINST THIS PROPOSAL FOR THE FOLLOWING REASONS:
Under our Certificate of Incorporation and Bylaws, a special meeting of shareholders may be called at any time by a majority of the Board of Directors or by the Chairman of the Board. A special meeting of shareholders is an expensive and time-consuming event because of the costs in preparing and distributing required disclosure documents and the time commitment required of the Board and management to prepare for and conduct the meeting. We believe that the calling of a special meetings of shareholders should occur only when either fiduciary obligations or strategic concerns require that the matters to be addressed cannot wait until the next annual meeting of shareholders. We believe our existing governance mechanisms are appropriate for a public company of our size and afford management and the Board the opportunity to respond to shareholder proposals and concerns while allowing directors, consistent with their fiduciary duties, to determine when it is in the interests of the company to hold a special meeting of shareholders. The Board believes that enabling a small minority of shareholders to call an unlimited number of special meetings, particularly in the current environment in which hedge funds and others now “borrow” shares from other shareholders solely for voting purposes to advance their own interests, could be disruptive to our business, require significant attention from our management and employees and impose substantial administrative and financial burdens on our company.
Accordingly, the Board unanimously recommends a vote AGAINST this proposal.

- 15 -
Stock Ownership of Management and Certain Beneficial Owners
Stock Ownership of Directors and Executive Officers. The following table sets forth the number of shares of our Common Stock beneficially owned as of January 31, 2007, by (a) each director of EDS; (b) each current and former executive officer named in the Summary Compensation Table below; and (c) all current directors and executive officers as a group. Each of the individuals/groups listed below is the owner of less than one percent of our outstanding Common Stock.
Name
Amount and Nature of
Beneficial Ownership
W. Roy Dunbar ......................................................................... 9,642 (b)(c) Roger A. Enrico ........................................................................ 75,210 (a)(b) Martin C. Faga .......................................................................... 2,154 (b) S. Malcolm Gillis ...................................................................... 5,091 (b)(c) Ray J. Groves ............................................................................ 89,656 (a)(b) Ellen M. Hancock...................................................................... 32,744 (a)(b)(c) Ray L. Hunt............................................................................... 147,705 (a)(b) Edward A. Kangas..................................................................... 15,447 (b) James K. Sims ........................................................................... 4,307 (b) R. David Yost............................................................................ 18,189 (b) Michael H. Jordan ..................................................................... 1,185,920 (a)(c)(d)(e) Jeffrey M. Heller ....................................................................... 1,552,246 (a)(c)(d)(e) Ronald A. Rittenmeyer.............................................................. 2,186 (c)(d)(e) Charles S. Feld .......................................................................... 360,514 (a)(c)(d)(e) Ronald P. Vargo ........................................................................ 28,997 (a)(c)(d)(e) Thomas A. Haubenstricker........................................................ 30,388 (a)(c)-(f) Directors and executive officers as a group (20 persons).......... 4,012,928 (a)-(e)
Stephen F. Schuckenbrock ........................................................ 212,821 (g) Robert H. Swan ......................................................................... 148,406 (h)
___________________
(a) Includes shares of Common Stock which may be acquired on or before April 1, 2007, through the exercise of stock options as follows: Mr. Enrico—26,463 shares; Mr. Groves—29,882 shares; Ms. Hancock—13,468 shares; Mr. Hunt—36,116 shares; Mr. Jordan—1,033,336 shares; Mr. Heller—1,061,668 shares; Mr. Feld—319,838 shares; Mr. Vargo—20,000 shares; Mr. Haubenstricker—22,953 shares; and all directors and executive officers as a group—2,960,455 shares. Does not include shares subject to options vesting after April 1, 2007, regardless of whether such options may vest prior to that date if the share price appreciates to specified levels.
(b) Includes compensation deferrals treated as phantom stock under the Non-Employee Director Deferred Compensation Plan as follows: Mr. Dunbar—8,684 shares; Mr. Enrico—8,581 shares; Mr. Faga— 2,154; Dr. Gillis—5,091 shares; Mr. Groves—57,514 shares; Ms. Hancock—17,388 shares; Mr. Hunt—47,501 shares; Mr. Kangas—15,447 shares; Mr. Sims—4,307 shares, and Mr. Yost—13,189 shares.
(c) Excludes unvested restricted stock units granted under the 2003 Amended and Restated Incentive Plan (the “Incentive Plan”) as follows: Mr. Dunbar—12,719 units; Dr. Gillis—3,993 units; Ms. Hancock—8,217 units; Mr. Jordan—460,000 units; Mr. Heller—328,000 units; Mr. Rittenmeyer—91,000 units; Mr. Feld—218,895 units; Mr. Vargo—86,331 units; Mr. Haubenstricker—45,400 units; and all directors and executive officers as a group—1,619,487 units. The units will vest (subject to earlier vesting based on EDS’ achievement of performance goals) during the period from 2007 through the earlier of normal retirement or 2010, subject to earlier vesting under the terms of agreements with certain executives described below.
(d) Includes vested compensation deferrals treated as invested in Common Stock under the Executive Deferral Plan as follows: Mr. Jordan—6,763 shares; Mr. Heller—61,346 shares; Mr. Rittenmeyer—197 shares; Mr. Feld—6,117 shares; Mr. Vargo—1,263 shares; Mr. Haubenstricker—5,468 shares; and all executive officers as a group—93,678 shares.
(e) Includes vested compensation deferrals treated as invested in Common Stock under the 401(k) Plan as follows: Mr. Jordan—496 shares; Mr. Heller—574 shares; Mr. Rittenmeyer—one share; Mr. Feld—396 shares; Mr. Vargo—444 shares; Mr. Haubenstricker—604 shares; and all executive officers as a group—6,909 shares.
- 16 -
(f) Mr. Haubenstricker served as interim co-chief financial officer from March 15, 2006, to August 22, 2006. His share ownership is not included in the amounts reported above for all executive officers as a group as of January 31, 2007.
(g) Mr. Schuckenbrock was separated from EDS effective May 31, 2006. The total amount reported for him includes 212,379 shares of Common Stock which may be acquired on or before April 1, 2007, through the exercise of stock options and excludes 26,001 unvested restricted stock units granted under the Incentive Plan.
(h) Mr. Swan resigned as Executive Vice President and Chief Financial Officer on March 15, 2006. The total amount reported for him includes 105,767 vested compensation deferrals treated as invested in Common Stock under the Executive Deferral Plan and 285 vested compensation deferrals treated as invested in Common Stock under the 401(k) Plan.
Stock Ownership of Certain Beneficial Owners. Based on a review of filings with the SEC, we are aware of the following beneficial owners of more than 5% of the outstanding Common Stock at December 31, 2006:
Name and Address
of Beneficial Owner
Number of Shares
Beneficially Owned
Percentage of Common
Stock Outstanding
Dodge & Cox 555 California St., 40th Floor San Francisco, CA 94104 ........................... 65,269,806 (a) 12.6%
Hotchkiss and Wiley Capital Management, LLC 725 S. Figueroa St, 39th Floor Los Angeles, CA 90017.............................. 58,986,010 (b) 11.4%
AXA Financial, Inc. (c) 1290 Avenue of the Americas New York, NY 10104................................. 60,781,871 (c) 11.8%
State Street Bank and Trust Company 225 Franklin Street Boston, MA 02110...................................... 29,880,508 (d) 5.8%
(a) Dodge & Cox reported sole voting power over 61,085,906 shares, shared voting power over 651,800 shares, and sole dispositive power over all shares beneficially owned.
(b) Hotchkiss and Wiley reported sole voting power over 43,843,910 shares and sole dispositive power over all shares beneficially owned.
(c) A group comprised of AXA Financial, Inc. (including its subsidiaries Alliance Capital Management L.P. and AXA Equitable Life Insurance Company) and certain affiliated entities located in Paris, France, reported sole voting power over 46,482,732 shares, shared voting power over 4,092,933 shares, sole dispositive power over 60,763,940 shares and shared dispositive power over 17,931 shares.
(d) State Street reported sole voting power over 14,356,921 shares, shared voting power over 15,523,587 shares, and shared dispositive power over all shares beneficially owned.
Section 16(a) Beneficial Ownership Reporting Compliance
Our directors and executive officers are required under the Exchange Act to file with the SEC reports of ownership and changes in ownership in their holdings of Common Stock. We assist such persons with these filings. Based on an examination of these reports and on written representations provided to us, we believe that all such reports were timely filed in 2006, other than the final Form 4 filing for Stephen F. Schuckenbrock on June 5, 2006.

- 17 -
Non-Employee Director Compensation
Our compensation program for non-employee directors is designed to attract and retain qualified directors by offering compensation that is competitive with other large, global companies and recognizes the time, expertise and accountability required by Board service. Each year, the CBC reviews the current compensation program as well as director compensation data prepared by an external consulting firm. Based upon this review, the CBC recommends to the full Board of Directors what changes, if any, should be made to the director compensation program. The Board must approve any changes to the director compensation program.
Non-employee directors receive an annual cash retainer of $200,000 and an additional $15,000 for serving as chairperson of one of the Board’s three standing committees. No additional fees are paid for attending Board or Board committee meetings. Directors are also reimbursed for travel and out-of-pocket expenses incurred in connection with their service. We do not provide retirement benefits, perquisites or other benefits to non-employee directors. Director compensation is paid at the commencement of each annual director compensation period, which begins at the Annual Meeting of Shareholders in April.
Directors may elect to receive their annual compensation in one or a combination of the following three forms:
deferral to an interest bearing account and/or a “phantom” EDS stock unit account;
restricted stock; or
cash.
Compensation deferred into the interest bearing account earns interest at an annual rate equal to 120% of the applicable federal long-term rate published by the Internal Revenue Service (“IRS”). The number of units/shares granted is determined by dividing 110% of the elected compensation amount by the fair market value (average of the high and low trading prices) of EDS common stock on the date of grant. Compensation deferred into EDS stock units or granted as restricted stock receives a 10% premium to encourage directors to elect EDS equity as a form of compensation. Compensation elected in the form of deferred compensation vests immediately while restricted stock vests ratably over three years. With respect to both stock units and restricted stock, dividend equivalents are awarded at the same time and at the same rate as paid to EDS shareholders. If a director’s service terminates prior to completing 24 months of service (except due to death or disability), a pro-rata portion of cash, deferred compensation and/or restricted stock paid in respect of the compensation year in which the director’s service ended (based on months of service) will be forfeited, or, with respect to cash compensation, returned to EDS. If the director’s service terminated due to death or disability, compensation will not be pro-rated and any restricted stock will vest immediately.
A director’s deferred account balance is distributed in cash following separation from the Board. At the director’s election, the account balance can be distributed in a lump sum or annually in either three or five installments beginning on a director’s last day of service. The value of a director’s stock unit account for purposes of distribution is based on the fair market value of EDS common stock on the last day of Board service. This amount is converted to the interest bearing account if a director elects the installment option.
Directors are subject to stock ownership guidelines under which they will be expected to hold EDS equity valued at not less than $400,000 by the later to occur of (i) our Annual Meeting of Shareholders in 2009 or (ii) five years from their election to the Board.

- 18 -
The following table sets forth the compensation paid to non-employee directors in 2006. The amounts reported represent compensation for the 2006/2007 director compensation year and were paid at the commencement of such period or, for directors appointed thereafter, on a pro-rated basis following their appointment.
Non-Employee Director Summary Compensation Table
Name
Fees Earned or
Paid in Cash
Stock Awards
(c)
All Other
Compensation Total
W. Roy Dunbar $0 $105,996 $0 $105,996
Roger A. Enrico 107,500 123,455 0 230,955
Martin C. Faga (a) 71,978 55,004 0 126,982
S. Malcolm Gillis 80,000 46,458 0 126,458
Ray J. Groves 0 241,700 0 241,700
Ellen M. Hancock (b) 0 229,970 0 229,970
Ray L. Hunt 0 225,197 0 225,197
Edward A. Kangas 100,000 110,007 0 210,007
James K. Sims (a) 21,978 110,007 0 131,985
R. David Yost 0 220,014 0 220,014
(a) Compensation for Messrs. Faga and Sims was prorated based on their service commencement date of September 7, 2006.
(b) Compensation for Ms. Hancock reflects a prorated chairperson fee paid in 2006 of $7,458 for the 2005/2006 director compensation year. Ms. Hancock was appointed CBC Chair on October 21, 2005.
(c) Reflects the dollar amount recognized for financial statement reporting purposes for the fiscal year ended December 31, 2006, in accordance with Statement of Financial Accounting Standards (“SFAS”) No. 123(R), and thus includes amounts from awards granted in and prior to 2006. During 2006, each director was granted the following stock awards: Mr. Dunbar – 7,986 restricted stock units with a fair value of $220,014; Mr. Enrico – 4,293 phantom stock units with a fair value of $118,272; Mr. Faga – 2,149 phantom stock units with a fair value of $55,004; Mr. Gillis – 3,993 restricted stock units with a fair value of $110,007 and 799 phantom stock units with a fair value of $22,012; Mr. Groves – 8,585 phantom stock units with a fair value of $236,517; Ms. Hancock – 4,442 restricted stock units with a fair value of $122,377 and 4,442 phantom stock units with a fair value of $122,377; Mr. Hunt – 7,986 phantom stock units with a fair value of $220,014; Mr. Kangas – 3,993 phantom stock units with a fair value of $110,007; Mr. Sims – 4,298 phantom stock units with a fair value of $110,007; and Mr. Yost – 7,986 phantom stock units with a fair value of $220,014.
As of December 31, 2006, each director had the following number of options, restricted stock units and phantom stock units outstanding: Mr. Dunbar – no options, 12,719 restricted stock units and 8,684 phantom stock units; Mr. Enrico – 26,463 options, no restricted stock units and 8,581 phantom stock units; Mr. Faga – no options, no restricted stock units and 2,154 phantom stock units; Mr. Gillis – no options, 3,993 restricted stock units and 5,091 phantom stock units; Mr. Groves – 29,882 options, no restricted stock units and 57,514 phantom stock units; Ms. Hancock – 19,662 options, 8,217 restricted stock units and 17,388 phantom stock units; Mr. Hunt – 36,116 options, no restricted stock units and 47,501 phantom stock units; Mr. Kangas – no options, no restricted stock units and 15,447 phantom stock units; Mr. Sims – no options, no restricted stock units and 4,307 phantom stock units; and Mr. Yost – no options, no restricted stock units and 13,189 phantom stock units.
- 19 -
Executive Compensation
Compensation Discussion and Analysis
Executive Compensation Program Objectives
The primary objectives of our executive compensation program are to attract and retain accomplished and high-potential executives and to motivate those executives to achieve short- and long-term goals with the ultimate objective of creating sustainable improvements in shareholder value. Consistent with that objective, our executive compensation program includes both annual incentive and stock based-compensation that rewards performance as measured against the achievement of short-and long-term goals designed to align executives’ interest with those of our shareholders.
We seek to attract and retain executives by offering total compensation competitive with the market in which we compete for executive talent. We believe that the market is broader than the information technology (“IT”) industry in which we operate. Accordingly, the Compensation and Benefits Committee (“CBC”) reviews survey data from two comparator groups prepared by an external consulting firm. One group consists of large global corporations similar in revenue and/or market capitalization to EDS, most of which are outside the IT industry, with a sector weighting similar to the composition of the S&P 500. This group consists of 29 companies with median 2006 annual revenues of approximately $26 billion. The second group consists of 21 companies in the IT and related industries with median 2006 annual revenues of approximately $21 billion. The CBC reviews these comparator groups annually to ensure they are a representative cross-section of the businesses with which we compete for executive talent, and approves any changes to the companies that comprise each comparator group.
To motivate our executives to achieve short- and long-term goals designed to create sustainable shareholder value, we structure our annual bonus and long-term incentive programs to pay above the 50th percentile of the comparator groups when EDS exceeds such goals and below the 50th percentile when these goals are not achieved.
Our annual bonus program is designed to motivate executives to achieve short-term goals established by the CBC by linking the payment of an annual cash bonus to achievement of these goals. For our named executive officers, in 2006 the short-term goals related to earnings per share, free cash flow and revenue. We refer you to the discussion of “Annual Bonus” under “Elements of Compensation” below for a description of the performance goals established for each metric, the relative weightings assigned to each metric, the factors considered by the CBC in establishing such goals for 2006 and why we believe the achievement of such goals helps create sustainable shareholder value.
Our long-term incentive compensation program is designed to motivate executives to achieve long-term goals through the grant of stock options as well as performance-based restricted stock units (“P-RSUs”), the vesting of which is dependent on our achievement of three-year goals approved by the CBC. For the “named executive officers” in the Summary Compensation Table below, the long-term metrics for the 2006 P-RSU grant related to average annual operating margin, net asset utilization and organic revenue growth for the three-year period that began on January 1, 2006. We refer you to the discussion of “Long-Term Incentive Compensation” under “Elements of Compensation” below for a description of the relative weighting assigned to each metric, the factors considered by the CBC in establishing such goals for the three-year performance period and why we believe the achievement of such goals helps create sustainable shareholder value.
The combination of annual and long-term incentive programs is designed to provide a balanced total incentive opportunity that rewards executives for the quality of both their short- and long-term performance and decisions.
Role of the CBC and Management in Executive Compensation
The CBC determines the total compensation of our CEO and all other executive officers and oversees the design and administration of compensation and benefit plans for all EDS employees. The CBC is responsible for the review, establishment and approval of:
executive compensation and benefits strategy, programs and policies;
goals and objectives related to CEO performance, evaluating the CEO’s performance relative to such goals and objectives and approving the CEO’s total compensation based on such performance;

- 20 -
salary, annual bonus, equity-based compensation and other remuneration for executive officers;
performance metrics and goals for any performance-based cash or equity incentive compensation plan in which executive officers participate;
design of all compensation plans that include EDS equity as a component of the plan;
severance agreements for executive officers and change-of-control agreements for any EDS employee;
changes to employee benefit plans; and
making recommendations to the full Board regarding non-employee director compensation.
During CBC meetings, our internal human resources personnel present topical issues for discussion and education as well as specific recommendations for review. Certain executive officers, including the Chairman and CEO and the Senior Executive Vice President and Chief Administrative Officer attend a portion of most regularly scheduled CBC meetings, excluding executive sessions. The CBC also obtains input from our legal, finance and tax functions, as appropriate, as well as one or more executive compensation consulting firms regarding matters under consideration. The CBC has delegated to management certain responsibilities related to employee benefit matters. The CBC has formed three management committees that (i) oversee the investment of U.S. retirement plan assets and savings plan investment funds, (ii) approve the design/redesign of any employee benefit plan that does not result in a cost greater than $10 million in net present value over five years, and (iii) administer benefit plans for U.S. employees and former employees, their families and beneficiaries. These three committees are made up of EDS employees and report to the CBC on an annual basis. Additionally, the CBC has delegated to management the ability to periodically grant equity compensation to non-executive officers. These grants are generally for new hires, transitions and promotions and cannot exceed certain levels established by the CBC. All such grants are reported to the CBC at its next regularly scheduled meeting following the grant date.
The CBC utilizes two consulting firms for executive compensation matters. Mercer Human Resource Consulting has been retained by the CBC for periodic advice and projects as well as an annual review of the CEO’s compensation. Towers Perrin, which has been retained by management, provides market data to the CBC and management on competitive pay practices for executives at and above the Vice President level.
Elements of Executive Compensation
In addition to health/welfare benefit plans and programs generally available to all employees, our executive compensation program comprises the following principal elements:
base salary
annual bonus
long-term incentive compensation
perquisites
deferred compensation/retirement
executive severance and change-of-control agreements
In allocating between cash and non-cash compensation, and current and long-term compensation, we utilize the 50th
percentile of the comparator groups described above as a guideline, while seeking to maintain total compensation at the 50th percentile of the relevant position in the comparator groups. To consider all elements of compensation in total rather than each element in isolation, management has prepared total compensation “tally sheets” for executive officers for annual review by the CBC since 2005. These tally sheets summarize the value of each compensation element (including base salary, annual bonus, long-term incentive awards, deferred compensation, benefits and perquisites) plus the potential cost to us and benefit to the executive officers of change-of-control and severance payments. The information provided in the tally sheets is generally the same as the information reported, or to be reported, in our proxy statements.
Base Salary We utilize the 50th percentile base salary for each comparator group (adjusted using regression analysis to minimize differences in revenues) for comparable positions as a guideline to establish base salaries for executive officers. However, the CBC may establish an executive officer’s base salary higher or lower than the 50th percentile based on a number of factors, including individual performance, relevant experience, job responsibility, time interval since the last salary adjustment, the weight placed on base salary versus long-term incentive compensation and the executive officer’s salary as compared internally. For example, the CBC established 2006 base salary for Mr. Jordan below the 50th percentile for his position in order to place more weight on long-term incentive compensation. Mr. Jordan’s base salary will be increased effective April 1, 2007, to $1,400,000 per year to more closely approximate the 50th percentile for his position. This is the first increase in his base salary since joining EDS in March 2003.
Base salaries are generally reviewed annually during the first quarter and at other times if an executive officer’s responsibilities have materially changed. For example, Mr. Vargo’s base salary was reviewed and increased in

- 21 -
connection with his August 2006 appointment as Executive Vice President and Chief Financial Officer, and Mr. Rittenmeyer’s and Mr. Feld’s base salaries were increased upon their appointments as President and Chief Operating Officer and Senior Executive Vice President, Applications Services, respectively, in December 2006.
While we recognize performance-based compensation, such as annual bonus and long-term incentive compensation, more effectively motivates executive officers to achieve corporate goals, we believe the base salary element of total compensation is critical to attract and retain executive talent.
Annual Bonus
Executive officers and other senior leaders are eligible for an annual cash bonus under the Corporate Bonus Plan (“CBP”). The primary purpose of the CBP is to motivate participants to enable the company to achieve short-term financial goals designed to create sustainable shareholder value and reward them to the extent they achieve such goals. The CBP reflects our strategy that a significant portion of total compensation be contingent upon both company performance during the year and the executive’s contribution to that performance. As such, each executive officer is assigned an annual target bonus opportunity (expressed as a percentage of base salary) based on his or her level. For 2006, target bonus opportunity was 120% for the CEO, 110% for the Vice Chairman, 100% for the President and Chief Operating Officer, 85% for other Executive Vice Presidents, 65% for Vice President/General Managers, and 55% for Vice Presidents (Level 3). We seek to establish the targeted bonus opportunity at the 50th
percentile for similar positions at companies in the comparator groups.
CBP funding for 2006 could have ranged from 0 to 200% of target bonus opportunity and was based on financial metrics and goals for corporate, regional and account performance, depending on a participant’s role during the year. Funding for the named executive officers was based 100% on corporate performance as measured by earnings per share (“EPS”) (40% weight), free cash flow (40% weight) and revenue (20% weight). These metrics and weights were chosen because we believe executive officers directly impact these metrics, the combination of these metrics are the best indicator of EDS’ performance during a fiscal year, and these goals, if achieved, should result in sustained increases to shareholder value. The table below sets forth the performance goals established by the CBC for the named executive officers under the 2006 CBP.
Performance Goals Total Award Eligibility
Metric Weight Minimum Target Range Maximum Minimum Target Maximum
Free Cash Flow 40% $0.52B $0.80B - $1.00B $1.35B 0% 40% 80%
EPS 40% $0.68 $1.05 - $1.15 $1.55 0% 40% 80%
Revenue 20% $17.8B $19.8B - $20.8B $22.9B 0% 20% 40%
100% 0% 100% 200%
We define free cash flow as net cash provided by operating activities, less capital expenditures. Free cash flow is a non-GAAP measure and should be viewed together with our consolidated statement of cash flows. We refer you to the discussion of “Non-GAAP Financial Measures” in our Annual Report on Form 10-K for the year ended December 31, 2006 (“2006 Form 10-K”).
The CBC may reduce any bonus by up to 50% of the funded amount based on its assessment of individual performance against specific objectives. In determining funding for the CBP, the CBC can adjust actual results to exclude the impact of certain extraordinary items or events to more accurately reflect the overall performance of the management team. Free cash flow for purposes of our annual CBP target is automatically adjusted to exclude the impact of any client contract signed after the establishment of such target if the contract incurs negative free cash flow of more than $100 million during that year. Earnings per share is automatically adjusted to exclude the impact of any accounting changes, the impact of any new contract that results in more than $100 million in negative free cash flow during the year, the impact of expensing long-term incentive compensation, a significant gain or loss on divestiture of business units or assets, and the planned impact of significant acquisitions (with deviations to plan not excluded). Revenue is automatically adjusted to exclude the impact of any new contract that results in more than $100 million in negative free cash flow during the year, acquisitions or divestitures not contemplated in the annual financial plan and the impact of exchange rate deviations from plan rates.
In addition to the payment of an annual bonus under the CBP, the CBC may approve an additional discretionary bonus outside the CBP if an executive’s performance significantly exceeds his or her individual goals. For 2006, the CBC approved an additional discretionary bonus to Messrs. Jordan, Heller, Rittenmeyer, Feld and Vargo to recognize their contributions toward achieving extraordinary results during the year and the progress they made individually toward the company’s turnaround. The amount of such discretionary bonus is reported in the Summary Compensation Table under the “Bonus” column.

- 22 -
For 2006, the CBP funded in aggregate at 119% of the targeted payout for each named executive officer. This is based on results of $0.887 billion of free cash flow (100% of the target payout for free cash flow), $20.9 billion in annual revenue (105% of the target payout for revenue) and EPS of $1.33 (145% of the target payout for EPS). In determining the 2006 results for funding purposes, in addition to the automatic adjustment to the actual results described above, the CBC excluded from EPS (i.e., adjusted EPS upward) $0.12 per share, representing severance expense incurred in excess of the amount planned at the beginning of the year as a result of the acceleration of planned severance actions into 2006. This adjustment was made so participants would not be financially penalized for actions taken during the year to accelerate the implementation of the company’s multi-year plan. The CBP payment to each named executive officer for 2006 is reported in the Summary Compensation Table under the “Non-Equity Incentive Plan Compensation” column.
Long-Term Incentive Compensation
The primary purpose of our long-term incentive compensation program is to motivate executives to achieve long-term goals designed to create sustainable shareholder value and reward them to the extent they achieve such goals. Long-term incentive compensation is delivered through stock-based awards made under the Amended and Restated 2003 Incentive Plan (the “Incentive Plan”), which authorizes awards of stock options, stock appreciation rights, restricted stock and other stock-based awards, and the EDS Executive Deferral Plan (the “EDP”).
Since 2005, our long-term incentive compensation program for executive officers has focused on annual stock-based grants in the form of non-qualified stock options and performance-based restricted stock units (“P-RSUs”), with each grant having approximately the same economic value and accounting cost to the company. This strategy was implemented to balance the CBC’s interest in (i) focusing executive officers on long-term metrics that create sustained shareholder value, (ii) addressing shareholder concerns regarding the exclusive use of stock options and shareholder dilution, (iii) more efficiently aligning long-term incentive costs with perceived value, (iv) attracting and retaining talent globally and (v) remaining competitive with market changes and compensation practices.
Stock options vest 100% in three years from the date of grant while P-RSU vesting is variable based on our results during the three-year performance period. The performance metrics for P-RSU grants in 2005 and 2006 were operating margin (50% weight), net asset utilization (25% weight) and organic revenue growth (25% weight). Performance goals for each metric are established by the CBC in the first quarter of the three-year performance period and will be adjusted at the end of the performance period to exclude the impact of expensing long-term incentive compensation, changes in accounting principles during the performance period, and significant gains or losses on the divestiture (greater than $100 million) of business units or assets. P-RSU vesting can range from 0 to 200% of the target award. These metrics were chosen because of their relevance to our corporate strategy and objectives for the respective performance periods at the time of grant, the ability of executive officers to impact achievement of the performance goals and our belief that achieving or exceeding these goals should result in sustained increases to shareholder value over the longer-term. For the 2007 P-RSU grants, we changed the performance metrics to free cash flow per share, return on net assets and revenue because of the relevance of these metrics to our corporate strategy and objectives for the three-year performance period beginning on January 1, 2007.
We establish the specific performance targets for each financial metric with the intent that (i) the likelihood of a payout at the targeted amount is greater than 50%, (ii) it is likely we will achieve the minimum performance levels required for any payout and (iii) it is unlikely we will achieve the performance levels required for the maximum payout. We also generally establish the performance targets at levels requiring year-over-year financial improvement. Consistent with the foregoing approach, we believe there is a high probability that we will achieve performance over the three-year periods beginning on January 1, 2005 (for the 2005 P-RSU grant) and January 1, 2006 (for the 2006 P-RSU grant) to allow vesting of approximately 90-100% of the target award.
We may periodically grant supplemental time or performance-vesting restricted/deferred stock units to executive officers. These grants are typically made to attract new executives or as a retention device for current executives. Such awards typically vest over three or four years. For example, in 2006 we granted 300,000 deferred stock units (DSUs) to President and Chief Operating Officer Ronald A. Rittenmeyer. The award, in the form of additional discretionary credits issued under the EDP, comprises 150,000 time-vesting DSUs and a target award of 150,000 performance-vesting DSUs. We also granted 41,331 time-vesting restricted stock units to Mr. Vargo upon his promotion to Executive Vice President and Chief Financial Officer and 129,895 time-vesting restricted share units to Mr. Feld upon his promotion to Senior Executive Vice President, Applications Services. We refer you to the description of such awards under the Grants of Plan-Based Awards table below.
Dividend equivalents are not paid on unvested P-RSUs but are paid prior to vesting on time-vesting RSUs and DSUs since they are intended to put the executive in the same economic position as a shareholder from the time of grant.

- 23 -
We consider several factors when establishing the size of long-term incentive compensation grants to executive officers, including long-term incentive compensation awarded within the IT industry comparator group, the number of unvested stock-based awards held by the executive, the executive’s performance during the prior year and the executive’s expected contribution to our long-term performance. Based on these factors, the CBC may decide to increase or decrease an executive’s award relative to the 50th percentile of the IT comparator group. For example, if the value of an executive’s unvested stock-based awards are lower than his or her peers and the executive has performed well during the prior year, the CBC may decide to grant a larger long-term incentive award to help motivate and retain the executive. We also consider the expected shareholder dilution and accounting cost attributable to our long-term incentive programs in establishing the total number of shares/units of common stock we make available through stock-based awards.
It has been our practice to grant stock-based awards to executive officers on an annual basis. Award levels and grant dates are approved by the CBC, and grants are made on or following the date of the CBC’s approval. The CBC will also approve any option grants in connection with the hiring or promotion of an executive officer.
The CBC, together with the Audit Committee, has approved the recommendation of management to continue to grant annual stock-based awards to executive officers on March 15 of each year (or, if that date is not a trading day, the immediately preceding day), with CBC approval of such awards to occur at its regularly scheduled meeting in February. The annual stock option grants have an exercise price equal to the average of the high and low trading prices of our common stock on the date of grant. This date was selected to allow time to complete individual performance assessments for the prior year and to provide for a grant date following filing of our Annual Report on Form 10-K. Annual grants to non-U.S. employees may occur on a date other than March 15 for tax or regulatory reasons. Grants outside of the annual award process, such as grants to a newly hired or promoted executive officer, generally occur on the first trading day of the month following the date of the hiring or promotion. Stock option grants outside of the annual award process also have an exercise price equal to the average of the high and low trading prices of our common stock on the date of grant.
Deferred Compensation
The EDP, a non-qualified deferred compensation plan, provides executive officers and other eligible employees the ability to defer base salary and annual bonus compensation into deferred stock units or a fixed income accumulation account. The purpose of this plan is to allow executives the opportunity to accumulate additional ownership of EDS equity, provide a tax-efficient way to defer compensation to future years, and make up for any company match not made in respect of the executive’s 401(k) plan contributions due to IRS limitations.
Retirement
The named executive officers, all of whom reside in the U.S., participate in the same tax-qualified defined benefit retirement plan, the Amended and Restated EDS Retirement Plan (“Retirement Plan”), as other U.S. employees. They also participate in the EDS Benefit Restoration Plan (the “Restoration Plan”), a non-qualified and unfunded retirement plan intended to pay benefits to employees whose benefits under the Retirement Plan are reduced due to certain IRS limitations. We believe these benefits are competitive with comparator company practices and allow us to attract and retain executive talent.
We also provide a Supplemental Executive Retirement Plan (“SERP”) to certain named executive officers, excluding the CEO and Chief Financial Officer, and a small group of other executives. The SERP, a non-qualified, unfunded retirement plan, is intended to provide a target retirement income based on final average earnings (base salary plus bonus) during a 60 consecutive month period prior to retirement, offset by benefits under the Retirement Plan and Restoration Plan. The SERP was established several years ago to provide competitive retirement income benefits and to retain certain executives. In 2005, in response to changes in comparator company practices, the CBC approved a policy under which no new participants could be added to the SERP without its approval. The CBC also expressed its intent to not approve new SERP participants except in extraordinary new-hire or retention situations.
The CBC may approve the award of additional years of service to an executive officer for the calculation of benefits and vesting purposes under the SERP. For example, we agreed to provide to Mr. Rittenmeyer an enhanced benefit as an inducement of employment and to make up for retirement benefits and economic value forfeited as a result of his joining the company. We refer you to the discussion of this agreement under “Pension Benefits” below.
Perquisites
We make available four primary perquisites for executive officers: personal use of aircraft; for the CEO, a car and driver for transportation in the Dallas area; financial counseling and tax preparation services; and annual physicals. The CBC has approved the use of corporate aircraft by the CEO for all personal air travel and the use of a company

- 24 -
provided car and driver for ground travel in the Dallas area to facilitate his personal travel in as safe a manner as possible and with the most efficient use of his time. The CBC has delegated to the CEO the authority to approve all requests for personal air travel for other executive officers. We offer an Executive Physical Program that reimburses executive officers for the cost of an annual physical, up to $1,500. This benefit is provided to encourage executives to focus on their physical health and well-being. We also offer an Executive Financial Counseling Program which provides an annual allowance of up to $13,000 in the first year and $7,500 in subsequent years for financial counseling, plus reimbursement for tax preparation services. This program is intended to maximize the value of compensation provided by EDS and minimize an executive’s time spent managing personal affairs. Executives do not receive a “gross-up” payment for any taxes associated with perquisites.
With the exception of personal use of aircraft, the value of which is highly dependent on an executive officer’s usage, perquisites are intended to be competitive with comparator company practices. The CBC considers the total value of perquisites when establishing the amounts of other forms of compensation.
Executive Severance and Change-of-Control Agreements
We have entered into an Executive Severance Benefit Agreement with each named executive officer other than Messrs. Jordan, Heller and Haubenstricker, and a Change-of-Control Employment Agreement with each named executive officer other than Mr. Haubenstricker. An executive entitled to receive benefits following a termination of employment under an Executive Severance Benefit Agreement or a Change-of-Control Employment Agreement may elect to receive benefits under either agreement, but not both. We believe these agreements enable us to retain executive officers during times of unforeseen events when the executive’s future is uncertain but continued employment of the executive may be necessary for the company. We also believe it is beneficial to have agreements in place that specify the exact terms and benefits an executive receives if we elect to separate an executive officer involuntarily from the company.
The agreements with named executive officers include an expiration or “sunset” date which may not be extended without CBC approval. Benefits payable under these agreements are benchmarked periodically, including prior to any extension, relative to comparator company practices. During 2006, we reviewed the prevalence of severance and change-of-control agreements among our comparator groups’ executives as well as the provisions of such agreements to benchmark the competitiveness of EDS’ agreements. Specifically, we reviewed the cash severance multiplier, equity vesting provisions, benefit continuation practices, excise tax gross-up prevalence, and the length of the protection period in the event of a change-of-control. Based upon our review, we believe our agreements are generally consistent with those of our comparator groups.
The CBC has established a policy requiring shareholder approval before we can agree to provide a separation benefit to an executive officer that exceeds 2.99 times annual base salary plus target bonus. This limitation applies to cash severance and the present value of retirement/fringe benefits in excess of what would normally be provided under the terms of the relevant plans. The value of continued or accelerated vesting of stock-based awards is not subject to this limit.
Additional information regarding the terms of the Executive Severance Benefit and Change-of-Control Employment Agreements with the named executive officers, including estimates of the amounts payable under such agreements assuming termination of employment as of December 31, 2006, is set forth under the heading “Agreements Related to Potential Payments Upon Termination or Change-of-Control” below.
Stock Ownership Guidelines
Executive officers are subject to stock ownership guidelines under which they will be expected to hold EDS equity valued at not less than the following amount (expressed as a multiple of annual base salary) by the later of (i) December 31, 2008, or (ii) five years from an executive’s change of level.
Executive Level Stock Ownership Guideline
Office of the Chairman 5x annual base salary
Senior Executive Vice President/Executive Vice President
3x annual base salary
Senior Vice President/ Vice President & General Manager
2x annual base salary
Vice President (Level 3) 1x annual base salary

- 25 -
All forms of direct and indirect ownership are included in determining stock ownership, including shares held outright, unvested restricted stock units, vested and unvested deferred stock units, and units held in a 401(k) account. As of December 31, 2006, all named executive officers had sufficient ownership to achieve the relevant stock ownership multiple.
Policy on Stock Trading and Hedging
We have in place a pre-clearance process for all trades in EDS securities which all executive officers must follow. Executive officers and other insiders are also prohibited from engaging in any transaction involving a put, call or other option on EDS securities (other than exercises of an option granted under an EDS incentive plan) at any time.
Recovery of Incentive Compensation in the Event of a Financial Restatement
The CBC does not have a policy that would recover cash or equity compensation received by an executive officer if the company’s performance upon which the payments were based is adjusted or restated and the adjusted performance would have resulted in reduced compensation. However, the CBC would consider any such event when making future compensation decisions for executive officers who continue to be employed by the company.
Section 162(m) Compliance
We generally seek to grant stock options and establish performance goals under our bonus and long-term incentive compensation plans in a manner that qualifies as “performance-based” under Section 162(m) of the Internal Revenue Code, which provides that we may not deduct compensation of more than $1,000,000 paid to certain individuals. However, certain forms and amounts of compensation may not be performance-based and may result in our exceeding the $1 million deduction limitation from year to year, including time-vesting RSUs, any cash bonus outside of the CBP, and base salary in excess of $1 million.
The $1 million performance-based level was exceeded in 2006 with respect to each of the CEO, the Vice Chairman, the President and Chief Operating Officer, and the Senior Executive Vice President, Applications Services principally as a result of (i) the additional discretionary bonus paid outside the CBP described above, (ii) for the CEO and the Vice Chairman, the vesting of restricted stock units granted in 2003 (see “Stock Option Exercises and Restricted Stock Vesting” table below) and (iii) for the Senior Executive Vice President, Applications Services, the two retention payments made in 2006 related to EDS’ acquisition of The Feld Group.
Report of the Compensation and Benefits Committee
The Compensation and Benefits Committee reviewed and discussed with management of EDS the foregoing Compensation Discussion and Analysis. Based on such review and discussion, the Compensation and Benefits Committee has recommended to the Board of Directors that the Compensation Discussion and Analysis be included in this proxy statement and in EDS’ Annual Report on Form 10-K for the year ended December 31, 2006.
Compensation and Benefits Committee
Ellen M. Hancock, Chair Martin C. Faga James K. Sims R. David Yost
Notwithstanding any statement in any of our filings with the SEC that might incorporate part or all of any future filings with the SEC by reference, including this Proxy Statement, the foregoing Report of the Compensation and Benefits Committee is not incorporated by reference into any such filings.

- 26 -
Summary Compensation Table
The following table sets forth information with respect to the compensation for 2006 of our Chief Executive Officer, each individual who served as Chief Financial Officer during 2006, our three other most highly compensated executive officers as of the end of 2006, and one former executive officer (the “named executive officers”).
Name and Principal Position
(a) Year Salary ($)
Bonus ($)
(b)
Stock
Awards ($)
(c)
Option
Awards ($)
(d)
Non-Equity
Incentive Plan
Compensation ($)
(e)
Change in
Pension Value &
Nonqualified
Deferred
Compensation
Earnings ($)
(f)
All Other
Compensation ($)
(g) Total ($)
Michael H. Jordan 2006 $1,000,000 $572,000 $3,215,263 $6,770,495 $1,428,000 $365,428 $288,525 $13,639,711
Chairman and CEO
Jeffrey M. Heller 2006 850,000 87,350 1,205,791 2,190,061 1,112,650 0 46,767 5,492,619
Vice Chairman
Ronald A. Rittenmeyer 2006 770,833 310,000 1,373,374 1,169,566 1,190,000 451,274 134,480 5,399,527
President and Chief Operating OfficerCharles S. Feld 2006 727,083 538,337 1,724,120 1,988,542 834,488 478,392 10,800 6,301,762
Senior Executive Vice President, Applications ServicesRonald P. Vargo 2006 390,833 263,250 460,649 122,392 386,750 77,632 35,031 1,736,537
Executive Vice President and Chief Financial OfficerThomas A. Haubenstricker 2006 305,000 200,000 314,691 227,827 225,000 82,350 2,900 1,357,768
Vice President and Former Interim Co-Chief Financial OfficerStephen F. Schuckenbrock 2006 312,500 354,618 1,054,413 1,400,260 0 278,767 3,221,348 6,621,906
Former Co-Chief Operating Officer
Robert H. Swan 2006 135,417 0 -94,955 115,898 0 0 9,035 165,395
Former Executive Vice President and Chief Financial Officer
(a) Messrs. Vargo and Haubenstricker served as interim co-chief financial officers from March 15, 2006, to August 22, 2006. Mr. Vargo was appointed Executive Vice President and Chief Financial Officer on August 22, 2006. Mr. Swan resigned from EDS effective March 15, 2006, and Mr. Schuckenbrock separated from EDS effective May 31, 2006.
(b) Amounts in this column include the following discretionary bonus payments outside of the Corporate Bonus Plan: Mr. Jordan - $572,000; Mr. Heller - $87,350; Mr. Rittenmeyer - $310,000; Mr. Feld - $65,512; and Mr. Vargo - $63,250.
For Messrs. Vargo and Haubenstricker: Also includes a $200,000 bonus awarded pursuant to agreements with these executives related to their service as interim co-chief financial officers from March 15, 2006, to August 22, 2006, paid one-half in August 2006 and one-half in February 2007.
For Messrs. Feld and Schuckenbrock: Also includes the following retention payments related to EDS’ acquisition of The Feld Group: Mr. Feld – two payments of $236,412; and Mr. Schuckenbrock, two payments of $177,309.
(c) Amounts reported reflect the dollar amount recognized for financial statement reporting purposes for the fiscal year ended December 31, 2006, calculated in accordance with SFAS No. 123R. We refer you to the discussion of the assumptions used in such valuation in Note 11 of Notes to Consolidated Financial Statements in our 2006 Form 10-K. Includes P-RSU grants (target award), performance-vesting deferred stock unit grants (target award), and time-vesting restricted stock awards granted in and prior to 2006.
For Mr. Schuckenbrock: Amounts reported include the accelerated vesting of 25,622 restricted shares granted on December 30, 2003, with a grant price of $23.503.
For Mr. Swan: Amounts reported reflect the forfeiture of 33,000 P-RSUs (target award) granted in March 2005 (value forfeited $157,495).

- 27 -
(d) Amounts reported reflect the dollar amount required to be recognized for financial statement reporting purposes in 2006 for stock option awards granted in and prior to 2006 calculated in accordance with SFAS No. 123R (includes $3,740,333 recognized in 2005). We refer you to the discussion of the assumptions used in such valuation in Note 11 of Notes to Consolidated Financial Statements in our 2006 Form 10-K.
For Mr. Schuckenbrock: Amounts reported include the accelerated vesting of 60,714 stock options granted on January 9, 2004, with an exercise price of $23.955 and 50,000 stock options granted on March 24, 2004, with an exercise price of $19.175.
For Mr. Swan: Amounts reported reflect the forfeiture of 100,000 stock options granted in March 2004 (value forfeited $378,583) and 75,000 stock options granted in March 2005 (value forfeited $206,164).
(e) Represents awards paid in February 2007 under the Corporate Bonus Plan for 2006 performance.
(f) Represents the change in pension value under the Retirement Plan, the Restoration Plan and the SERP.
For Mr. Heller: Mr. Heller originally retired from EDS in 2002 and continues to draw monthly benefits. While he is eligible for increased benefit payments as a result of his current employment, it is unlikely his retirement income benefit will increase as a result of his subsequent retirement.
For Mr. Swan: Due to Mr. Swan’s resignation on March 15, 2006, he forfeited his retirement benefits. Therefore, the change in his pension value for 2006 was negative $272,573.
(g) Amounts reported include the following executive perquisites, employer 401(k) Plan contributions and, for Mr. Schuckenbrock, payments as a result of his termination of employment:
For Mr. Jordan: $141,971 for personal use of corporate aircraft; $38,569 for reimbursement of financial planning and tax return preparation expenses; $104,585 for a car and driver provided by EDS for ground transportation in the Dallas area (includes driver’s salary, vehicle lease cost, fuel expense and other variable costs); and matching award under the 401(k) Plan of $3,400. We estimate the personal use of such car and driver at 25% of total usage; however, the amount reported above reflects 100% of the total cost to EDS.
For Mr. Heller: $36,013 for personal use of corporate aircraft; $7,500 for reimbursement of financial planning and tax return preparation expenses; and matching award under the 401(k) Plan of $3,254.
For Mr. Rittenmeyer: $108,855 for personal use of corporate aircraft; $22,026 for reimbursement of financial planning and tax return preparation expenses; $1,039 for catering related to personal use of a company stadium suite (no other incremental cost is attributable to such use); and matching award under the 401(k) Plan of $2,560.
For Mr. Feld: $7,500 for reimbursement of financial planning and tax return preparation expenses; and matching award under the 401(k) Plan of $3,300.
For Mr. Vargo: $24,898 for personal use of corporate aircraft; $6,833 for reimbursement of financial planning and tax return preparation expenses; and matching award under the 401(k) Plan of $3,300.
For Mr. Haubenstricker: Matching award under the 401(k) Plan of $2,900.
For Mr. Schuckenbrock: $18,251 for personal use of corporate aircraft; matching award under the 401(k) Plan of $1,406; $7,500 for reimbursement of financial planning and tax return preparation expenses; and $1,592 for reimbursement of executive physical expenses. Also includes the following severance payments: two times base salary and target bonus ($3,000,000 total); payment of the 3rd installment of a retention award in connection with EDS’ acquisition of The Feld Group ($177,309); continuation of financial counseling for one year ($7,500); and COBRA coverage ($7,790).
For Mr. Swan: $1,875 for reimbursement of financial planning and tax return preparation expenses; matching award under the 401(k) Plan of $3,400; and a commemorative gift upon his resignation from EDS valued at $3,760 (including related tax gross-up).
Valuation of Personal Use of Corporate Aircraft: The value of personal aircraft usage reported above is based on EDS’ direct operating cost per flight hour. This methodology calculates incremental cost based on the weighted average cost of fuel, on-board catering, aircraft maintenance, landing fees, trip-related hangar and parking costs, and smaller variable costs. Since the corporate aircraft are used primarily for business travel, the methodology excludes fixed costs which do not change based on usage, such as pilots’ and other employees’ salaries, purchase costs of the aircraft and non-trip-related hangar expenses. Flight hours for personal aircraft usage reflected in the amounts reported above do not include hours for any related “deadhead” positioning of aircraft. On certain occasions, an executive’s spouse or other guest may accompany the executive on a flight. No additional direct operating cost is incurred in such situations. A portion of the incremental costs for personal aircraft usage reported above is not deductible by the company for U.S. federal income tax purposes.

- 28 -
Grants of Plan-Based Awards
Threshold Target Maximum Threshold Target Maximum
M. H. 2/6/2006 3/15/2006 $0 $1,200,000 $2,400,000 n/a
Jordan 2/6/2006 3/15/2006 0 210,000 420,000 $5,342,400
2/6/2006 3/15/2006 600,000 $27.475 $27.50 5,304,000
J.M. 2/6/2006 3/15/2006 0 935,000 1,870,000 n/a
Heller 2/6/2006 3/15/2006 0 90,000 180,000 2,289,600
2/6/2006 3/15/2006 250,000 27.475 27.50 2,210,000
R.A. 2/6/2006 3/15/2006 0 1,000,000 2,000,000 n/a
Rittenmeyer 2/6/2006 3/15/2006 0 58,000 116,000 1,475,520
2/6/2006 3/15/2006 175,000 27.475 27.50 1,547,000
8/25/2006 9/1/2006 0 150,000 300,000 3,445,500
8/25/2006 9/1/2006 150,000 3,445,500
C.S. 2/6/2006 3/15/2006 0 701,250 1,402,500 n/a
Feld 2/6/2006 3/15/2006 0 45,000 90,000 1,144,800
2/6/2006 3/15/2006 130,000 27.475 27.50 1,149,200
12/4/2006 12/4/2006 129,895 3,500,021
R.P. 2/6/2006 3/15/2006 0 325,000 650,000 n/a
Vargo 2/6/2006 3/15/2006 12,500 25,000 50,000 636,000
8/21/2006 9/1/2006 41,331 1,000,004
T.A. 2/6/2006 3/15/2006 0 170,500 341,000 n/a
Haubenstricker 2/6/2006 3/15/2006 12,500 25,000 50,000 636,000
S.F. 2/6/2006 3/15/2006 0 58,000 116,000 1,475,520
Schuckenbrock 2/6/2006 3/15/2006 175,000 27.475 27.50 1,547,000
R.H. -- -- -- -- -- -- -- -- -- -- -- -- --
Swan
Name
Committee
Approval
Date Grant Date
Estimated Future Payouts Under
Non-Equity Incentive Plan Awards
(a)
Grant Date
Fair Value
of Stock
and Option
Awards
Closing
Market
Price on
Grant
Date
Estimated Future Payouts
Under Equity Incentive Plan
Awards (b)
All Other
Stock
Awards:
Number
of Shares
of Stock
or Units
(c)
All Other
Option
Awards:
Number of
Securities
Underlying
Options (d)
Exercise
Price of
Options
Awards
($/Share)
(a) Amounts shown represent the threshold, target and maximum awards that could be earned by the named executive officer under the CBP for 2006. Funding is based 100% on corporate performance as measured by earnings per share, free cash flow, and revenue. Actual bonuses paid for 2006 are shown in the Summary Compensation Table in the “Non-Equity Incentive Plan Compensation” column.
(b) Represents P-RSUs granted under the Incentive Plan and, for Mr. Rittenmeyer, a performance-vesting DSU award on September 1, 2006, under the EDP. P-RSUs are restricted stock units that vest approximately three years from the date of grant based on EDS’ performance as measured by Operating Margin (50% weight), Net Asset Utilization (25% weight), and Organic Revenue Growth (25% weight). The performance period for the 2006 grant is the three-year period commencing on January 1, 2006. Following vesting of any P-RSUs, a participant will be prohibited from selling 50% of the vested shares for 12 months following the vesting date. Dividends or dividend equivalents are not paid or accrued on P-RSUs. The 2006 P-RSU grant minimum vesting for Messrs. Vargo and Haubenstricker is 50% of the target award since neither was an executive officer at the time of grant. For all other named executive officers, the 2006 P-RSU grant minimum vesting is 0% of the target award. Mr. Rittenmeyer’s DSU award will vest on September 1, 2009, subject to the achievement of pre-established three-year average productivity yield (50% weight) and organic revenue growth (50% weight) targets. Vesting can range from 0 to 200% of the target award. Dividend equivalents will be credited on the vesting date and will be retroactively calculated as though periodically credited at the same time as on EDS common stock.
(c) For Mr. Rittenmeyer: Represents a time-vesting DSU award on September 1, 2006, pursuant to the EDP. The award will vest on September 1, 2009. Dividend equivalents will be credited at the same time dividends are paid on EDS common stock.
For Mr. Feld: Represents a grant of 129,895 time-vesting restricted stock units on December 4, 2006, upon his promotion to Senior Executive Vice President, Applications Services. The award will vest on November 30, 2009. The fair value of the award is $26.945 per stock unit (the fair market value of the EDS common stock on

- 29 -
the grant date). Dividend equivalents will be paid in cash at the same rate and time as dividends are paid on EDS common stock.
For Mr. Vargo: Represents a time-vesting restricted stock unit award granted on September 1, 2006, pursuant to the Incentive Plan upon his appointment as Executive Vice President and Chief Financial Officer. The award will vest in 25% increments on September 4, 2007, September 2, 2008, September 1, 2009, and September 1, 2010. Dividend equivalents will be credited at the same time dividends are paid on EDS common stock.
(d) Stock options were granted pursuant to the Incentive Plan on March 15, 2006, with an exercise price of $27.475, the average of high/low trading prices on the date of grant, which is the “fair market value” of the common stock on such date under the terms of that plan. The closing price of the common stock on that date was $27.50. Stock options vest on February 27, 2009, and have a seven-year term. Stock options issued to executive officers exercised within 12 months of vesting can only be exercised for shares and must be held for 12 months following the exercise date.
Option Awards Stock Awards
Name
Number of
Securities
Underlying
Unexercised
Options
Exercisable
Number of
Securities
Underlying
Unexercised
Options
Unexercisable
Option
Exercise
Price Vesting Date
Option
Expiration
Date
Market
Value of
Shares or
Units of
Stock that
have not
Vested
Equity
Incentive
Plan
Awards:
Number of
Unearned
Shares,
Units or
Other Rights
that have
not Vested
(b)
Incentive
Plan
Awards:
Market or
Payout
Value of
Unearned
Shares, Units
or Other
Rights that
have not
Vested Vesting Date
M.H. Jordan 600,000 $27.4750 2/27/2009 3/15/2013 210,000 $5,785,500 2/27/2009
550,000 20.6650 2/29/2008 3/31/2012 250,000 6,887,500 2/29/2008
550,000 24.9275 3/23/2007 3/24/2014
550,000 19.1750 3/23/2007 3/24/2014
500,000 15.5800 3/20/2013
500,000 20.2540 3/20/2013
J.M. Heller 250,000 27.4750 2/27/2009 3/15/2013 90,000 2,479,500 2/27/2009
188,000 20.6650 2/29/2008 3/31/2012 83,000 2,286,650 2/29/2008
150,000 24.9275 3/23/2007 3/24/2014 25,000 $688,750 3/2/2007
150,000 19.1750 3/23/2007 3/24/2014 130,000 3,581,500 3/1/2010
25,870(a)
15.5800 2/9/2007
125,000 20.2540 3/20/2013
125,000 15.5800 3/20/2013
175,000 68.8125 3/8/2007
120,000 40.5938 3/1/2008
500,000 45.0600 12/17/2011
R.A. Rittenmeyer 175,000 27.4750 2/27/2009 3/15/2013 150,000 4,132,500 9/1/2009
200,000 19.1900 7/6/2009 7/7/2012 558(c)
15,366 9/1/2009
75,000 19.1900 2/29/2008 7/7/2012 58,000 1,597,900 2/27/2009
33,000 909,150 2/29/2008
150,000 4,132,500 9/1/2009
C.S. Feld 130,000 27.4750 2/27/2009 3/15/2013 45,000 1,239,750 2/27/2009
99,000 20.6650 2/29/2008 3/31/2012 44,000 1,212,200 2/29/2008
50,000 50,000 19.1750 3/24/2008 3/24/2014 34,162 941,163 1/9/2007
188,887 80,951 23.9550 1/9/2007 1/1/2009 129,895 3,578,607 11/30/2009
R.P. Vargo 20,000 20,000 19.1750 3/24/2008 3/24/2014 41,331 1,138,669 25% increments
on 9/4/07, 9/2/08,
9/1/09, 9/1/10
3,333 91,824 1/26/2007
25,000 688,750 2/27/2009
20,000 551,000 2/29/2008
T.A. Haubenstricker 17,000 5,667 19.1750 3/24/2007 3/24/2010 25,000 688,750 2/27/2009
286 19.1750 3/24/2008 20,000 551,000 2/29/2008
15,000 19.1750 3/24/2008 3/24/2014 400 11,020 3/2/2007
S.F. Schuckenbrock 10,000 27.4750 5/31/2007 8,056 221,943 2/27/2009
202,379 23.9550 5/31/2007 17,945 494,385 2/29/2008
R.H. Swan
Number of
Shares or
Units of
Stock that
have not
Vested
(a) These stock options were exercised on January 30, 2007, at a weighted average exercise price of $26.112 per share.
(b) Amounts shown reflect target P-RSU award levels.
(c) Represents unvested dividend equivalents credited to Mr. Rittenmeyer pursuant to his September 1, 2006, DSU award.
Outstanding Equity Awards as of December 31, 2006:
-- -- -- -- -- -- -- -- -- --

- 30 -
Stock Option Exercises and Restricted Stock Vesting
The following table contains information about stock options exercised by the named executive officers and the vesting of stock awards held by the named executive officers in 2006.
Number of Shares
Acquired on
Exercise
Value Realized
on Exercise
Number of Shares
Acquired on
Vesting
Value Realized
on Vesting
M. H. Jordan(a)
40,500 $404,328 150,000 $4,164,000
J.M. Heller - - 25,000 684,875
- - 50,000 1,388,000
R.A. Rittenmeyer - - - -
C.S. Feld - - 34,163 850,659
- - 7,666 185,556
R.P. Vargo - - 3,333 82,408
T.A. Haubenstricker(b)
30,000 237,414 400 10,958
S.F. Schuckenbrock (c)
134,000 812,070 25,622 631,582
R.H. Swan (d)
393,000 4,041,804 23,141 593,335
Name
Option Awards Stock Awards
(a) Value based on 40,500 options with an exercise price of $15.58 and exercised at $25.5634.
(b) Value based on 15,000 options with an exercise price of $16.205 and exercised at $25.5822 and 15,000 options with an exercise price of $19.175 and exercised at $25.6254.
(c) Upon Mr. Schuckenbrock’s separation, 25,622 restricted shares vested at $24.65. In addition, his 2005 and 2006 target P-RSU awards were prorated based on months of service as follows: 17,945 P-RSUs granted in 2005 were earned upon separation but will vest based on EDS’ performance as determined in February 2008; and 8,058 P-RSUs granted in 2006 were earned upon separation but will vest based on EDS’ performance as determined in February 2009. Value of stock options is based on 100,000 options with an exercise price of $19.175 and exercised at $25.6008 and 34,000 options with an exercise price of $20.665 and exercised at $25.65.
(d) Includes the following stock options exercised by Mr. Swan following his resignation: (1) 275,000 options granted at $16.205 and exercised at $27.2399; (2) 18,000 options granted at $16.205 and exercised at $27.3237; and (3) 100,000 options granted at $19.175 and exercised at $27.2457.

- 31 -
Pension Benefits
The table below shows the present value of accumulated benefits payable to each named executive officer, including the number of years of service credited, as of October 31, 2006, under each of the Retirement Plan, the Restoration Plan and the SERP determined using the assumptions set forth in Note 13 of the Notes to Consolidated Financial Statements in our 2006 Form 10-K.
Name Plan Name
Number of Years
Credited Service (a)
Present Value of
Accumulated Benefit
Payments During
Last Fiscal Year
M.H. Jordan Retirement Plan 3 $107,224 $0
Restoration Plan 3 886,615 0
SERP n/a n/a n/a
J.M. Heller (b) Retirement Plan 37 1,395,717 118,839
Restoration Plan 37 5,905,055 502,785
SERP 37 6,459,085 549,955
R.A. Rittenmeyer Retirement Plan 3 51,940 0
Restoration Plan 3 197,928 0
SERP 3 237,079 0
C.S. Feld Retirement Plan 14 86,873 0
Restoration Plan 14 401,498 0
SERP 14 2,410,434 0
R.P. Vargo Retirement Plan 2 55,826 0
Restoration Plan 2 95,081 0
SERP n/a n/a n/a
T.A. Haubenstricker Retirement Plan 22 214,132 0
Restoration Plan 22 196,421 0
SERP n/a n/a n/a
S.F. Schuckenbrock Retirement Plan 8 56,492 0
Restoration Plan 8 247,425 0
SERP 8 433,664 0
R.H. Swan Retirement Plan 3 0 0
Restoration Plan 3 0 0
SERP 3 0 0
(a) Under the terms of his employment agreement, Mr. Rittenmeyer will be awarded an additional one and one-half (1.5) years of credited service (a total of 2.5 years of credited service) under the SERP for each full year of service completed during his first four years of employment, and two (2) additional years of credited service (a total of 3 years credited service) for each full year of employment completed during the following three years. Pursuant to this agreement, his SERP benefit will fully vest on the five-year anniversary of his employment, or earlier if he is involuntarily terminated without cause. These additional years of credited service are used to calculate his SERP benefit if he becomes vested under the plan but are not used to determine vesting. Without the extra service credit in the SERP, Mr. Rittenmeyer would not have an accrued benefit under the SERP (the value of the Retirement and Restoration plan benefit values are not impacted by the extra service grant). In addition, Mr. Swan had been awarded an additional nine years of service for purposes of the SERP that would have become effective for vesting and benefit calculation purposes when he attained age 55. However, because he resigned from EDS prior to the five-year vesting applicable to all retirement plans at that time, he will not receive any retirement benefits from EDS.
(b) Mr. Heller, who originally retired from EDS in 2002, continues to draw monthly benefits from the Retirement Plan, the Restoration Plan, and the SERP of $9,903.25, $41,898.75 and $45,829.60 respectively, all payable as a 75% joint and survivor annuity. While he is eligible for increased benefit payments as a result of his current employment, it is unlikely his retirement income benefit will increase as a result of his subsequent retirement. Mr. Heller’s employment agreement provides that his service will not result in a decrease in the retirement benefit he had been entitled to receive at the time he rejoined the company.

- 32 -
Benefits under the Retirement Plan provide for accruals, which are expressed as monthly credits added to participants’ “personal pension accounts,” or PPA. The Restoration Plan provides for a supplemental benefit to employees equal to the amount they would have received under the Retirement Plan if compensation and annual accruals were not limited under the Internal Revenue Code. Under the Restoration Plan, EDS maintains a “restoration account,” or RA, reflecting benefit and interest credits made on behalf of a participant. Monthly credits are based on a participant’s credited years of service together with age, divided by 12. The resulting quotient is the monthly allocation percentage, which is multiplied by the participant’s monthly earnings to determine the monthly amount credited to the PPA and RA. Participants receive additional credits (i) if annual compensation exceeded $94,200 (Social Security wage base) and (ii) generally if the participant was hired or rehired by EDS after age 35.
The annual benefit payable under the SERP for normal retirement will generally equal (i) 55% of the average of the participant’s total compensation (based on the highest five consecutive years within the last 10 years of employment) less (ii) the maximum covered compensation offset allowance, then prorated downward for service less than 30 years and reduced for commencement date beginning prior to age 62. The resulting benefit is then offset by any benefit accrued under the Retirement Plan and the Restoration Plan. The normal form of payment under the SERP is a single life annuity but the plan provides several actuarial equivalent forms of payment.
The final average compensation as defined under the SERP for the highest five consecutive years over the last 10-year period was as follows: Mr. Rittenmeyer, $1,343,750; Mr. Feld, $1,093,118; and Mr. Schuckenbrock, $1,160,186. Messrs. Jordan, Vargo and Haubenstricker do not participate in the SERP but do participate in the Retirement Plan and the Restoration Plan. Compensation under the retirement plans refers to total annual cash compensation plus any contributions to the EDS 401(k) Plan and EDS Flexible Benefits Plan, but excludes stock-based compensation under the Incentive Plan (except stock options granted in 2003 under the annual bonus plan and subsequently exercised) and extraordinary compensation (such as moving allowances and retention bonuses). For the Retirement Plan, compensation is limited to $220,000 for 2006 by the Internal Revenue Code.
Calculations are based on the 1994 group annuity mortality table, a 6% annual discount rate and 5.50% interest crediting rate. Mr. Jordan’s calculations assume that he is currently eligible to retire. Mr. Rittenmeyer’s calculations assume an age 64 plus one month retirement, which is the age he is eligible for unreduced benefits. Messrs. Vargo and Haubenstricker’s calculations are based on an age 65 retirement assumption. Although Mr. Schuckenbrock is no longer employed by EDS, he remains eligible to receive unreduced benefits at age 62.
Mr. Feld is eligible for an early retirement benefit from the Retirement Plan, the Restoration Plan, and the SERP. Had he retired January 1, 2007, Mr. Feld's annual retirement benefits (paid for his life only without cost of living adjustment) would have been $8,490 from the Retirement Plan, $41,201 from the Restoration Plan and $221,460 from the SERP. Employees are eligible for early retirement if they are age 55, have five years of service, and their age plus service is greater than or equal to 70. Benefits under the Retirement and Restoration plans are determined based on the participant’s cash balance converted to an annuity. SERP benefits are based on average pay, the maximum covered compensation offset allowance and service at retirement, offset by Retirement and Restoration Plan benefits. SERP benefits are unreduced at age 62.
Non-Qualified Deferred Compensation
Under the EDP, named executive officers may defer up to 50% of base salary and 100% of any bonus in 1% increments. The executive must decide to defer in the year prior to the year in which the compensation is payable. Executives can allocate their account balance between two recordkeeping accounts. The fixed income account provides a rate of interest equal to the return on 30-year U.S. treasury securities in effect as of the first business day in September of the prior year plus 50 basis points. The other account is deferred stock units under which executives do not have voting rights but receive dividend equivalents in the form of additional deferred stock units. The plan also provides a 401(k) make-up contribution in the form of additional deferred stock units. We provide a 1.5% match on the amount of compensation that exceeds the federal compensation limits on the 401(k) plan ($220,000 for 2006) if the executive defers an amount in deferred stock units under the EDP at least equal to the matching contribution. For 2006, Mr. Vargo was the only named executive officer to receive the 401(k) make-up contribution.
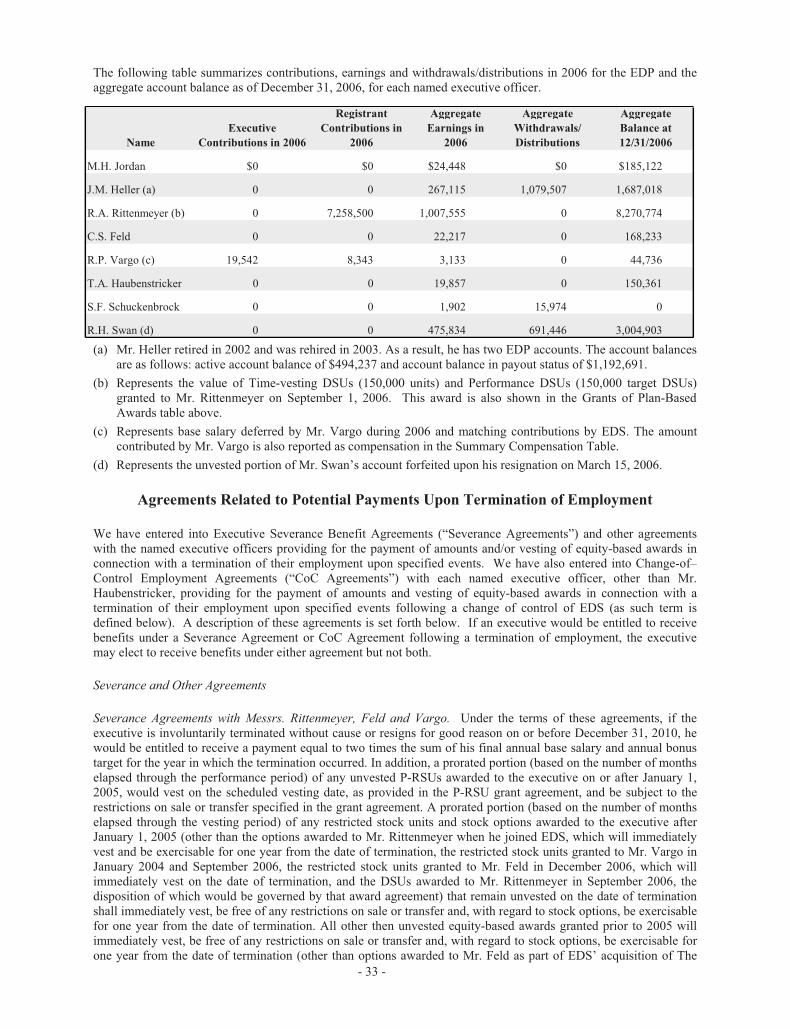
- 33 -
The following table summarizes contributions, earnings and withdrawals/distributions in 2006 for the EDP and the aggregate account balance as of December 31, 2006, for each named executive officer.
Name
Executive
Contributions in 2006
Registrant
Contributions in
2006
Aggregate
Earnings in
2006
Aggregate
Withdrawals/
Distributions
Aggregate
Balance at
12/31/2006
M.H. Jordan $0 $0 $24,448 $0 $185,122
J.M. Heller (a) 0 0 267,115 1,079,507 1,687,018
R.A. Rittenmeyer (b) 0 7,258,500 1,007,555 0 8,270,774
C.S. Feld 0 0 22,217 0 168,233
R.P. Vargo (c) 19,542 8,343 3,133 0 44,736
T.A. Haubenstricker 0 0 19,857 0 150,361
S.F. Schuckenbrock 0 0 1,902 15,974 0
R.H. Swan (d) 0 0 475,834 691,446 3,004,903
(a) Mr. Heller retired in 2002 and was rehired in 2003. As a result, he has two EDP accounts. The account balances are as follows: active account balance of $494,237 and account balance in payout status of $1,192,691.
(b) Represents the value of Time-vesting DSUs (150,000 units) and Performance DSUs (150,000 target DSUs) granted to Mr. Rittenmeyer on September 1, 2006. This award is also shown in the Grants of Plan-Based Awards table above.
(c) Represents base salary deferred by Mr. Vargo during 2006 and matching contributions by EDS. The amount contributed by Mr. Vargo is also reported as compensation in the Summary Compensation Table.
(d) Represents the unvested portion of Mr. Swan’s account forfeited upon his resignation on March 15, 2006.
Agreements Related to Potential Payments Upon Termination of Employment
We have entered into Executive Severance Benefit Agreements (“Severance Agreements”) and other agreements with the named executive officers providing for the payment of amounts and/or vesting of equity-based awards in connection with a termination of their employment upon specified events. We have also entered into Change-of–Control Employment Agreements (“CoC Agreements”) with each named executive officer, other than Mr. Haubenstricker, providing for the payment of amounts and vesting of equity-based awards in connection with a termination of their employment upon specified events following a change of control of EDS (as such term is defined below). A description of these agreements is set forth below. If an executive would be entitled to receive benefits under a Severance Agreement or CoC Agreement following a termination of employment, the executive may elect to receive benefits under either agreement but not both.
Severance and Other Agreements
Severance Agreements with Messrs. Rittenmeyer, Feld and Vargo. Under the terms of these agreements, if the executive is involuntarily terminated without cause or resigns for good reason on or before December 31, 2010, he would be entitled to receive a payment equal to two times the sum of his final annual base salary and annual bonus target for the year in which the termination occurred. In addition, a prorated portion (based on the number of months elapsed through the performance period) of any unvested P-RSUs awarded to the executive on or after January 1, 2005, would vest on the scheduled vesting date, as provided in the P-RSU grant agreement, and be subject to the restrictions on sale or transfer specified in the grant agreement. A prorated portion (based on the number of months elapsed through the vesting period) of any restricted stock units and stock options awarded to the executive after January 1, 2005 (other than the options awarded to Mr. Rittenmeyer when he joined EDS, which will immediately vest and be exercisable for one year from the date of termination, the restricted stock units granted to Mr. Vargo in January 2004 and September 2006, the restricted stock units granted to Mr. Feld in December 2006, which will immediately vest on the date of termination, and the DSUs awarded to Mr. Rittenmeyer in September 2006, the disposition of which would be governed by that award agreement) that remain unvested on the date of termination shall immediately vest, be free of any restrictions on sale or transfer and, with regard to stock options, be exercisable for one year from the date of termination. All other then unvested equity-based awards granted prior to 2005 will immediately vest, be free of any restrictions on sale or transfer and, with regard to stock options, be exercisable for one year from the date of termination (other than options awarded to Mr. Feld as part of EDS’ acquisition of The

- 34 -
Feld Group, which would be exercisable for the period provided for in that award agreement). These agreements also provide for the payment of $7,500 as equivalent to the annual amount for financial planning/counseling services currently provided to the executive and a payment equal to the estimated cost of 18 months of health care premiums.
In addition, with respect to Mr. Rittenmeyer, if he is involuntarily terminated without cause or resigns for good reason prior to his five-year anniversary of employment (excluding an involuntary termination following a change of control), his SERP benefit will immediately vest but will be limited to 99% of his then current base salary plus annual target bonus. Mr. Rittenmeyer is provided an enhanced benefit under the SERP described under “Pension Benefits” above.
For purposes of these Severance Agreements, “good reason” means a reduction in the executive’s base salary or annual target bonus (other than a reduction in which he is treated no less favorably than similarly situated executives). “Cause” means the executive has: (a) been convicted of, or pleaded guilty to, a felony involving theft or moral turpitude; (b) willfully and materially failed to follow EDS’ lawful and appropriate policies, directives or orders applicable to employees holding comparable positions that resulted in significant harm to EDS; (c) willfully and intentionally destroyed or stolen EDS property or falsified EDS documents; (d) willfully and materially violated the EDS Code of Business Conduct that resulted in significant harm to EDS; or (e) engaged in conduct that constitutes willful gross neglect with respect to employment duties that resulted in significant harm to EDS.
Employment Agreements with Messrs. Jordan and Heller. Under the terms of our employment agreements with each of Mr. Jordan and Mr. Heller, if we terminate the executive’s employment without cause, or if he voluntarily terminates his employment after Mr. Jordan’s replacement as CEO is appointed or the executive becomes subject to total disability or dies, the executive would be entitled to a payment equal to the pro rata portion (through his termination date) of any bonus payable under the CBP if and when payment is made to other executives. For purposes of these agreements, “cause” has the same meaning as in the Severance Agreements described above.
Employment Agreement with Mr. Feld. Mr. Feld joined EDS in connection with the acquisition of The Feld Group in January 2004. Under the terms of our employment agreement with Mr. Feld, he was entitled to receive a retention payment of $709,237, two-thirds of which has already been paid and the remaining one-third of which is to be paid when the closing trading price of EDS common stock exceeds $28.3808, contingent on his remaining employed at that time (unless his employment is terminated by us without cause or by him for good reason or due to death or disability). In connection with that acquisition, Mr. Feld received 113,875 shares of restricted common stock and options to purchase 269,838 shares of common stock with an exercise price of $23.96 per share. The restricted stock vested 40% on January 9, 2005, 30% on January 9, 2006, and 30% on January 9, 2007. The options had a five-year term and vested 8% on January 9, 2004, 32% on January 9, 2005, 30% on January 9, 2006, and 30% on January 9, 2007. If his employment is terminated for any reason other than termination by us without cause, termination by him for good reason or his death or disability, then he will forfeit all restricted stock and options that have not yet vested as of the date of termination. If his employment is terminated by us without cause, or by him for good reason, any then unvested restricted stock or options will immediately vest.
Change of Control Employment Agreements
Pursuant to the CoC Agreement with each named executive officer, in the event of the occurrence of a “change of control” of EDS, the executive’s employment will be continued for a period of two years and, in the case of Messrs. Jordan, Heller and Rittenmeyer, all then unvested equity-based awards would immediately vest (with P-RSUs and DSUs vesting at the targeted amount), be free of any restrictions on sale or transfer and, with respect to stock options, be exercisable for one year. Throughout the two-year employment period, the executive will continue to receive at least the same base salary and target bonus he was receiving immediately prior to the change of control and will remain eligible to participate in all incentive and benefit plans generally available to peer executives until the end of the employment period. If during the employment period the executive’s employment is terminated other than for “cause” or disability, or by the executive for “good reason,” he would receive his unpaid salary through the date of termination and a lump sum payment equal to 2.99 times the sum of his final annual base salary and annual performance bonus target for the year in which he is terminated. In addition (except for Messrs. Jordan, Heller and Rittenmeyer, whose equity-based awards will have vested at the time of the change of control as noted above), all equity-based awards held by the executive on the date of termination will vest (with P-RSUs vesting at the targeted amount), be free of any restrictions on sale or transfer and, with regard to stock options, be exercisable for one year from the date of termination (other than those awarded to Mr. Feld as part of EDS’ acquisition of The Feld Group, which would be exercisable for the period provided for in the award). If the executive’s employment is terminated for cause or he voluntarily terminates his employment other than for good reason during the employment period, he

- 35 -
will receive all accrued but unpaid salary through the date of termination and be entitled to no other severance under the CoC Agreement. If any payment under the CoC Agreement is subject to federal excise taxes imposed on excess parachute payments, the executive will receive an additional amount to cover any such tax payable by him as well as a gross-up payment on all taxes due. The CoC Agreements have a termination date of December 31, 2010.
For purposes of the CoC Agreements, a “change of control” of EDS includes the following: (i) any person, other than exempt persons, becomes a beneficial owner of more than 50% of EDS’ voting stock; (ii) a change in a majority of the Board of Directors, unless approved by a majority of the incumbent board members; or (iii) consummation of a reorganization, merger or sale of all or substantially all of EDS’ assets, unless following the transaction (x) the EDS shareholders prior to the transaction own more than 50% of the common stock and voting stock of the resulting entity, (y) no person owns 40% or more of the common stock or voting stock of the resulting entity and (z) at least a majority of the board of the resulting entity were members of the EDS Board prior to the transaction. “Good Reason” means: (i) a reduction in the executive’s base salary or annual target bonus opportunity; (ii) requiring the executive to be based at a location more than 50 miles from his principal work location preceding the change of control; or (iii) a reduction in the executive’s title, position, authority, duties or responsibilities inconsistent with his role prior to the change of control. “Cause” shall have the same meaning as in the Severance Agreements described above.
Potential Payments Upon Termination or Change of Control
The following table sets forth the payments required to be made to each named executive officer in connection with the termination of their employment upon specified events assuming a $27.55 per share price for our common stock (the closing price on December 29, 2006). The amounts shown also assume that the termination was effective December 31, 2006, and thus include amounts earned through such time and are estimates of the amounts which would be paid out to the executives upon their termination. The actual amounts paid can only be determined at the time of the termination of the executive’s employment.

- 36 -
Executive Benefits and Payments
Upon Termination
Voluntary
Termination
(a)
Involuntary Not for Cause
Termination
(non-Change of Control)
(a)(b)
For Cause
Termination
Involuntary or Good
Reason Termination
(Change of Control)
Death or Disability
(c)
Base Salary and
Target Bonus
M.H. Jordan $0 $1,200,000 $0 $6,578,000 $0
J.M. Heller $0 $935,000 $0 $5,337,150 $0
R.A. Rittenmeyer $0 $4,000,000 $0 $5,980,000 $0
C.S. Feld $0 $3,288,912 $0 $4,799,900 $236,412
R.P. Vargo $0 $1,950,000 $0 $2,865,750 $100,000
T. A. Haubenstricker $0 $219,231 $0 $100,000 $100,000
Stock Options
M.H. Jordan $9,880,375 $9,880,375 $0 $9,880,375 $8,333,175
J.M. Heller $2,977,755 $2,977,755 $0 $2,977,755 $2,446,461
R.A. Rittenmeyer $0 $2,028,438 $0 $2,312,125 $983,333C.S. Feld $411,677 $1,121,446 $0 $1,401,134 $1,121,446
R.P. Vargo $0 $167,500 $0 $167,500 $167,500T. A. Haubenstricker $0 $0 $0 $0 $173,086
Restricted and Deferred Stock
M.H. Jordan $12,673,000 $12,673,000 $0 $12,673,000 $6,520,167
J.M. Heller $4,766,150 $4,766,150 $0 $4,766,150 $2,350,933
R.A. Rittenmeyer $0 $9,403,733 $0 $10,772,050 $5,271,233
C.S. Feld $1,221,383 $5,741,154 $0 $6,971,720 $2,261,952
R.P. Vargo $0 $1,827,410 $0 $2,470,243 $1,827,410
T. A. Haubenstricker $0 $0 $0 $1,250,770 $607,937
Incremental Non-qualified
Pension
M.H. Jordan $0 $0 $0 $0 $0
J.M. Heller $0 $0 $0 $0 $0
R.A. Rittenmeyer $0 $432,699 $0 $0 $0
C.S. Feld $0 $0 $0 $0 $0
R.P. Vargo $0 $0 $0 $0 $0
T. A. Haubenstricker $0 $0 $0 $0 $0
Health/Welfare, Tax/Financial
Planning
M.H. Jordan $0 $0 $0 $0 $0
J.M. Heller $0 $0 $0 $0 $0
R.A. Rittenmeyer $0 $7,500 $0 $0 $0
C.S. Feld $0 $18,884 $0 $0 $0
R.P. Vargo $0 $9,300 $0 $0 $0
T. A. Haubenstricker $0 $1,347 $0 $0 $0
Tax Gross-up
M.H. Jordan $0 $0 $0 $8,737,599 $0
J.M. Heller $0 $0 $0 $3,635,006 $0
R.A. Rittenmeyer $0 $0 $0 $6,751,427 $0
C.S. Feld $0 $0 $0 $3,653,659 $0
R.P. Vargo $0 $0 $0 $1,644,093 $0
T. A. Haubenstricker $0 $0 $0 $0 $0
Total
M.H. Jordan $22,553,375 $23,753,375 $0 $37,868,974 $14,853,342
J.M. Heller $7,743,905 $8,678,905 $0 $16,716,061 $4,797,394
R.A. Rittenmeyer $0 $15,872,370 $0 $25,815,602 $6,254,566
C.S. Feld $1,633,060 $10,170,396 $0 $16,826,413 $3,619,810
R.P. Vargo $0 $3,954,210 $0 $7,147,586 $2,094,910
T. A. Haubenstricker $0 $220,578 $0 $1,350,770 $881,023
(a) For Mr. Jordan.
Assumes for purposes of his 2004 stock option agreements that a successor CEO has been named and he voluntarily terminates his employment/retires or involuntarily separates, in which event such options will immediately vest, be free of any restrictions on sale and be exercisable for the remaining term. If a successor

- 37 -
CEO has not been named and Mr. Jordan voluntarily terminates his employment, then such options are forfeited.
Assumes for purposes of his 2005 equity agreements that a successor CEO has been named and he voluntarily terminates his employment/retires or involuntarily separates with Board consent, in which event his 2005 P-RSU target award will be earned (with vesting based on actual results during the performance period) and his 2005 stock option award will immediately vest, with one-third exercisable on the vesting date and one-third exercisable on the one- and two-year anniversaries thereof. If a successor CEO has not been named and Mr. Jordan voluntarily terminates his employment/retires or involuntarily separates with Board consent, a prorated portion of his 2005 P-RSU target award will be earned (with vesting based on actual results during the performance period) and a prorated portion of his 2005 stock option award will immediately vest, be free of any restrictions on sale, and be exercisable for two years.
Assumes for purposes of his 2006 equity agreements that he voluntarily terminates his employment/retires with Board consent, in which event his 2006 P-RSU target award will be earned (with vesting based on actual results during the performance period), and his 2006 stock option award will vest on the scheduled vesting date and be exercisable for the remaining term. If Mr. Jordan is involuntarily separated, a prorated portion of his 2006 P-RSU target award will be earned (with vesting based on actual results during the performance period) and a prorated portion of his 2006 stock option award will immediately vest, be free of any restrictions on sale, and be exercisable for two years.
For Mr. Heller.
Assumes for purposes of his 2004 stock option agreements that a successor CEO has been named and he voluntarily terminates his employment/retires or involuntarily separates, in which event such options will immediately vest, be free of any restrictions on sale, and be exercisable for the remaining term. If a successor CEO has not been named and Mr. Heller voluntarily terminates his employment, then such options are forfeited.
Assumes for purposes of his 2005 equity agreements that a successor CEO has been named and he voluntarily terminates his employment/retires or involuntarily separates with Board consent, in which event his 2005 P-RSU target award will be earned (with vesting based on actual results during the performance period) and his 2005 stock option award will immediately vest, with one-third exercisable on the vesting date and one-third exercisable on the one- and two-year anniversaries thereof. If a successor CEO has not been named and Mr. Heller voluntarily terminates his employment/retires or involuntarily separates with Board consent, a prorated portion of his 2005 P-RSU target award will be earned (with vesting based on actual results during the performance period) and a prorated portion of his 2005 stock option award will immediately vest, be free of any restrictions on sale, and be exercisable for two years.
Assumes for purposes of his 2006 equity agreements that he voluntarily terminates his employment/retires with Board consent, his 2006 P-RSU target award will be earned (with vesting based on actual results during the performance period) and his 2006 stock option award will vest as scheduled and be exercisable for the remaining term. If He is involuntarily separated, a prorated portion of his 2006 P-RSU target award will be earned (with vesting based on actual results during the performance period) and a prorated portion of his 2006 stock option award will immediately vest, be free of any restrictions on sale and be exercisable for two years.
For Mr. Feld.
Assumes that any unvested P-RSU, and/or stock option awards granted to Mr. Feld in 2005 and 2006 will be prorated based on completed months of service and will immediately vest and be free of any restrictions regarding their sale or transfer.
(b) For Mr. Rittenmeyer.
Assumes that, under the terms of his 2006 DSU award agreements, his 2006 DSU awards will be forfeited if he voluntarily terminates his employment prior to vesting, other than for good reason or for any reason prior to the six-month anniversary of a new CEO, other than Mr. Rittenmeyer, being hired. If he voluntarily terminates his employment for good reason or six months after a new CEO is hired, his 2006 time-vesting DSUs will immediately vest (value of $4,132,500 based on the closing price of the common stock on December 31, 2006). If he voluntarily terminates his employment for good reason or six months after a new CEO is hired, his 2006 performance DSUs will immediately be earned based on actual EDS results during a portion of the performance period. The earned/vested portion of DSU awards will be distributed in shares of common stock on the later to occur of (i) January 31 in the year following the date of his separation or (ii) the first day of the month

- 38 -
following six completed calendar months after the date of such separation. All other unvested equity awards are forfeited upon voluntary termination.
Incremental non-qualified pension value shown represents value of additional years of credited service under SERP as of December 31, 2006, pursuant to the agreement with Mr. Rittenmeyer described in note (a) under “Pension Benefits” above. If Mr. Rittenmeyer is involuntarily terminated without cause or resigns for good reason prior to the five-year anniversary of his employment (excluding an involuntary termination following a change of control), his SERP benefit will immediately vest but will be limited to 99% of his then current base salary plus annual target bonus.
For Mr. Feld. Base salary and target bonus amounts include $236,412 for the third installment of Mr. Feld’s retention award related to EDS’ acquisition of The Feld Group.
For Mr. Haubenstricker.
Pursuant to the EDS Severance Program, in the event of involuntarily separation he would be entitled to a payment equal to two weeks of base salary for each year of service, not to exceed a total of 20 weeks and a payment equal to one month of COBRA benefits.
(c) For Mr. Jordan:
Reflects immediate vesting of his 2004 equity awards and a prorated vesting of his 2005/2006 P-RSU target awards and stock option awards.
For Mr. Heller:
Assumes immediate vesting of his 2004 equity awards and a prorated vesting of his 2005/2006 P-RSU target awards and stock option awards.
For Mr. Rittenmeyer:Reflects prorated vesting of DSUs and RSUs, performance DSUs and P-RSUs, and stock options. Pursuant to the terms of his time-vesting and performance DSUs, a minimum of 50% of the target award is assumed vested.
For Mr. Feld:
Base salary and target bonus amounts include $236,412 for the third installment of Mr. Feld’s retention award related to EDS’ acquisition of The Feld Group.
Assumes that any unvested DSU, RSU and/or stock option awards granted as part of the acquisition of The Feld Group will immediately vest and be free of any restrictions regarding their sale or transfer.
Assumes that any unvested DSU, RSU, P-RSU, and/or stock option awards granted that are not part of the acquisition of The Feld Group will be prorated based on completed months of service and will immediately vest and be free of any restrictions regarding their sale or transfer.
For Mr. Vargo:
Base salary and target bonus amounts include $100,000 for the second installment of a special cash retention award related to his appointment as interim co-chief financial officer.
Reflects immediate vesting of RSU and stock option awards and prorated vesting of P-RSUs and DSUs.
For Mr. Haubenstricker:
Base salary and target bonus amounts include $100,000 for the second installment of a special cash retention award related to his appointment as interim co-chief financial officer.
Reflects immediate vesting of RSU and stock option awards and prorated vesting of P-RSUs and DSUs.

- 39 -
Related Party Transactions
Related Party Transaction Approval Policy
The Board recognizes that related party transactions can present conflicts of interest and questions as to whether the transactions are in the best interest of EDS. Accordingly, effective as of January 1, 2007, the Board amended the Corporate Governance Guidelines to incorporate a policy and procedures for the review, approval and ratification of such transactions. For purposes of this policy, a “related party transaction” is a transaction or relationship involving a director, executive officer or 5% shareholder or their immediate family members that is reportable under the SEC’s rules regarding such transactions.
Under this policy, a related party transaction should be approved or ratified based upon a determination that the transaction is in, or not opposed to, the best interest of EDS. The policy provides for the Governance Committee to review and approve a transaction involving a director, the CEO or 5% shareholder, and for the CEO to review and approve a transaction involving any executive officer (other than the CEO and any executive who is also a director). Notice of a decision by the CEO to approve a related party transaction should be sent to the Governance Committee prior to finalizing the transaction, which may seek more information or call a meeting to review the transaction in greater detail. If a director or executive officer becomes aware of a transaction that should have been but was not approved in advance under this policy, he or she should report the transaction to whomever would have approved the transaction had it been submitted for advance approval. If the transaction is ongoing and revocable, it should be reviewed to determine whether ratification or other action should be taken. If the transaction is completed and not revocable, it should be evaluated to determine if any mitigation or other action should be taken.
The employment of an immediate family member of an executive officer (other than the CEO) does not need to be reported to the Governance Committee prior to approval unless the employee is “pay-banded” under EDS’ compensation structure or his or her compensation is reasonably expected to exceed $200,000 per year. In all other circumstances, the hiring should be approved in accordance with the process described above.
Management is expected to report to the Governance Committee any transaction with a related party that is not covered by this policy because it is not reportable under the SEC rules or that involves employment of an immediate family member not reported to the Governance Committee in advance as described above.
Certain Relationships and Related Party Transactions
In 2005 we retained Navigator Systems, Inc. to provide staff augmentation services related to our development of a Business Intelligence team to support our corporate metrics, analytics and dashboards initiatives. This engagement, which was entered into prior to the adoption of the related party transaction approval policy described above, followed a competitive bid process conducted by our purchasing organization. The project was expanded to include our ExcellerateHRO business in 2006. Jon Feld, a son of Senior Executive Vice President Charles Feld, is a co-founder, director, Chief Executive Officer and approximately 20% shareholder of Navigator. In February 2006, substantially all of the business and assets of Navigator were sold to Hitachi Consulting Corporation. Following that transaction, Jon Feld became a Vice President of Hitachi Consulting and, in his capacity as a shareholder of Navigator, will have an economic interest through 2007 in revenues of Hitachi Consulting attributable to the former Navigator business. In 2006, we retained Hitachi Consulting for services related to the strategy and planning of a new and expanded knowledge management program following a competitive bid process. We paid or will pay Navigator and Hitachi Consulting approximately $506,125 and $7,070,062, respectively, in respect of services provided in 2006 and expect to pay additional amounts to Hitachi Consulting in 2007.
Senior Executive Vice President Charles Feld’s son, Kenny Feld, is an employee of EDS. Kenny Feld and Charles Feld joined EDS in connection with our purchase of The Feld Group in January 2004. Kenny Feld received a salary of $300,000 in 2006 and a bonus of $160,700 in respect of 2006 performance. He was awarded 8,000 PRSUs in connection with our 2006 long-term incentive grant. Charles Feld disclaims any interest in his son’s compensation.
President and Chief Operating Officer Ronald Rittenmeyer’s son, Chris Rittenmeyer, has been employed by EDS since 2001, prior to Ronald Rittenmeyer’s joining the company in July 2005. Chris Rittenmeyer received a salary of $125,000 in 2006 and a bonus of $47,600 in respect of 2006 performance. Ronald Rittenmeyer disclaims any interest in his son’s compensation.

Business .................................................................................................................................................................................... AR-1
Trading Prices of Common Stock and Related Shareholder Matters ...........................................................................AR-4
Selected Financial Data .........................................................................................................................................................AR-5
Management’s Discussion and Analysis of Financial Condition and Results of Operations ....................................AR-6
Quantitative and Qualitative Disclosures About Market Risk .....................................................................................AR-20
Risk Factors ...........................................................................................................................................................................AR-20
Financial Statements and Supplementary Data .............................................................................................................AR-24
Management Report .......................................................................................................................................................AR-24
Report of Independent Registered Public Accounting Firm ...................................................................................AR-25
Consolidated Statements of Operations .....................................................................................................................AR-27
Consolidated Balance Sheets ........................................................................................................................................AR-28
Consolidated Statements of Shareholders’ Equity and Comprehensive Income (Loss) ....................................AR-29
Consolidated Statements of Cash Flows ....................................................................................................................AR-30
Notes to Consolidated Financial Statements ..............................................................................................................AR-31
Leadership Information ...................................................................................................................................................... AR-64
Shareholder Information .....................................................................................................................................................AR-65
Table of Contents — 2006 Annual Report

AR-1
2006 Annual Report
This Annual Report contains an overview of our business and information regarding our operations during 2006 and other information that our shareholders may find useful.
BUSINESS
Overview
Electronic Data Systems Corporation, or EDS, is a leading global technology services company that delivers business solutions. EDS founded the information technology outsourcing industry more than 40 years ago. Today, we deliver a broad portfolio of information technology and business process outsourcing services to clients in the manufacturing, financial services, healthcare,communications, energy, transportation, and consumer and retail industries and to governments around the world.
As of January 31, 2007, EDS and its subsidiaries employed approximately 131,000 persons in the United States and 63 other countries around the world. Our principal executive offices are located at 5400 Legacy Drive, Plano, Texas 75024, telephone number: (972) 604-6000.
We make available free of charge on our Web site at www.eds.com/investor our Annual Report on Form 10-K, Quarterly Reports on Form 10-Q, Current Reports on Form 8-K and all amendments to those reports as soon as reasonably practicable after such material is electronically filed with the Securities and Exchange Commission, or SEC. We also make available on our Web site other reports filed with, or furnished to, the SEC under the Securities Exchange Act of 1934, including our proxy statements andreports filed by officers and directors under Section 16(a) of that Act. We do not intend for information contained on our Web siteto be part of our Form 10-K or this Annual Report.
EDS Services
Infrastructure Services. EDS Infrastructure Services delivers hosting, workplace (desktop), storage, security and privacy, and communications services that enable clients to drive down their total cost of ownership and increase the productivity of their information technology (IT) environment across the globe. Infrastructure Services include:
Data Center Services. EDS Data Center Services address the business and technology needs of our clients for hosting and storage services. These services establish the client’s infrastructure using a set of highly modular, standard components that can be provisioned quickly and easily, serving as the integrated base platform to support business processes and applications. Data Center Services is composed of 6 principal offerings:
– Managed Server. This service delivers secure midrange hosting within an EDS or client data center. EDS provides high-valued managed services by leveraging standardization, increased automation and virtualization. Services are provided in a fixed rate or a variable rate utility model.
– Enterprise Application Hosting Services. EDS’ Application Hosting Services provides data center services including managed servers, storage, network and support for mission-critical, packaged enterprise applications. This service extends EDS’ full continuum of application support, providing our clients’ application infrastructure and enabling security, privacy, and compliancy.
– Web Hosting Services. This service includes the operational management and infrastructure for Web-enabled environments including managed servers, storage, network, and support. EDS Web Hosting Services offers clients base and uplift services provided in EDS leveraged data centers as well as in client data centers.
– Managed Mainframe. These services include migration to a leveraged EDS service management center with processing environments for dedicated or shared logical partitions. Higher value services include the z/OS platform which provides the client standardization and increased automation in a utility model.
– Data Center Modernization. These transformational services rationalize, consolidate, automate and virtualize the client’s IT infrastructure and applications environment for reduced cost, increased quality of service and greater flexibility.

AR-2
– Storage Management Services. We provide a fully managed suite of enterprise-wide services for storage management, information protection (backup and recovery) and information optimization (archival services) from the data center to the desktop.
EDS Workplace Services. EDS Workplace Services delivers expert management and support of the end user’s work environment from the software applications that support the client’s business practices to the supporting network communications infrastructure. Workplace Services include:
– Workplace Management Services. We offer comprehensive management of a client’s total desktop environment, from acquisition to retirement, including infrastructure technology, software and support for all end user devices.
– Mobile Workplace Services. EDS Mobile Workplace Services provide an end-to-end managed mobility solution that delivers voice and enterprise data regardless of a user’s locality, device, network or application.
– Workplace Messaging and Collaboration Services. Messaging solutions provide mailbox service as a base service to users through a hosted, locally or remotely managed messaging system. This service includes Antivirus and Security, and also includes migrating to more current releases and/or consolidating e-mail systems. Collaboration Services secure Instant Messaging and virtual team workspace to enable an organization to improve collaboration.
– Workplace Support Services. EDS’ Workplace Support Services provide a single point of contact for resolving IT issues in the desktop environment. Service Desk services may be accessed by various channels including telephone, the Web, e-mail and facsimile. Site support is provided for local, on-site technical assistance and troubleshooting when incidents cannot be resolved using remote diagnostic tools or through Service Desk support.
Security and Privacy Services. We offer defined security, privacy and business continuity features embedded at the onset in every EDS offering. These features are the people, tools, processes and controls used by EDS across all portfolio offerings to meet clients’ expectations and industry-specific standards and regulations for security, privacy, business continuity management and risk management.
EDS Networking Services. EDS Networking Services help organizations manage the growing complexities of aligning their communications and network needs with their overall IT outsourcing strategies. Our capabilities include a global managed services environment targeting a joint compute/network space. This allows our clients to control the risk curve associated with transformation as we use the full breadth of service management to move them to a utility core.
– Network Management Services. EDS’ Network Management Services delivers scalable solutions, from design and deployment to monitoring and management, to simplify network operations and improve network performance. Our Enterprise Networking Services provide the management of multi-carrier wide area networks.
– IP Communications Services. Our solutions enable secure, integrated enterprise-wide convergence of voice, data and communications applications and reduce the complexity of enterprise communications. Services include project management, site assessment, engineering, call plan development, migration planning, implementation to operation, asset and operating system management, hardware and software upgrades and ongoing support services with focus on device management.
– EDS Global Services Network. This managed, end-to-end connection links EDS facilities to each other or to client sites and helps us deliver services reliably and securely to clients. The Global Services Network includes the local network within each EDS facility, the mesh of circuits connecting these facilities and the point where EDS assets interconnect with a carrier partner for final delivery to the client site.
Applications Services. EDS Applications Services helps organizations plan, develop, integrate and manage custom applications, packaged software and industry-specific solutions. We offer applications development and management services on an outsourced or project basis. Services range from outsourcing of all applications development and systems integration to the management andimplementation of EDS-owned or third-party industry applications. Benefits to clients for these services can include reduced costs, extended value of technology investments, information sharing and enhanced ability to adapt to market changes. Our ApplicationsServices include the following:
Applications Development Services. We create new applications, providing full lifecycle support through delivery. We define the application requirements, analyze application characteristics, implement to a production environment and monitor performance for a warranted time. Services include custom application development, application testing, mobile applications, workforce enhancement, and enterprise application integration.
Application Management Services. We offer outsourcing support for specific applications or entire applications portfolios, both custom and packaged, including services for enterprise applications and support for SAP®, Oracle® and PeopleSoft® software. We assess the specified applications, plan the transition and provide ongoing management to improve client productivity and operating efficiency. We also provide applications rationalization, content management integration and legacy application migration services.

AR-3
Integrated Applications Services. We engineer offerings such as Business Intelligence Services, Portals and Dashboards Services, Web Services and Enterprise Applications Integration Services to support the overall integration of the client’s architecture or our own Agile Application Architecture. These services integrate and extend existing packaged and legacy applications.
Industry-Specific Application Solutions. These solutions are designed to support industry-specific needs. Our industry solutions span eight vertical industry segments: communications, energy, financial, government, healthcare, manufacturing, retail and transportation.
Applications Services offerings and capabilities are available via the EDS Global Delivery Model, including the EDS Best ShoreSM
delivery approach which offers clients the ability to develop and manage applications in one or more of our Solution Centres strategically located in cost-effective countries. The delivery of our services offers a lifecycle approach to on-shore, near-shore and offshore applications development and management with globally integrated, consistent work processes and tools and project-sharing at multiple facilities on a 24 hours a day, seven days a week basis.
Business Process Outsourcing Services. Business Process Outsourcing (BPO) services help clients to achieve economies of scale and improve business performance. By leveraging a shared-services operating model, clients can reduce operational risk and control costs while improving control effectiveness and standardization.
Enterprise Services are or will be sold across multiple industries and include Customer Relationship Management (CRM), Human Resources (HR), and Finance and Accounting services. For each of these services, EDS manages all components from technology, administration and customer service to business intelligence and third-party relationships. Our integrated solutions combine best-practice business processes, leading technologies and experienced professionals along with skilled domain partners.
EDS also delivers industry-specific offerings and provides industry experts to assist clients in key process improvement redesign. One example is our suite of Government BPO Services. For more than 40 years EDS has provided Medicare and Medicaid claims processing to the U.S. federal and state governments helping to lower program costs while increasing efficiency and performance.EDS’ offerings to governments also include fiscal agent services; decision support services; fraud, waste and abuse protection services; integrated pharmacy services; Health Insurance Portability and Accountability Act (HIPAA) compliance services; immunization registry and tracking services; and case management services. We also offer Internet-based enrollment and eligibility inquiry capabilities. Other industries supported by our industry-specific BPO offerings include financial services,manufacturing, healthcare, transportation, communications, energy and consumer/retail.
Many BPO services are supported by our reusable, multi-client utility platform. This platform is comprised of key components of the BPO portfolio, including CRM and call center services; financial process services such as credit services and insurance services, payment and settlement, card processing and billing and clearing transactions and content management services.
ExcellerateHRO LLP, our 85% owned joint venture with Towers Perrin, offers a comprehensive set of HR outsourcing solutions on a global basis across the core areas of benefits administration, compensation administration, payroll, recruitment and staffing, relocation, work force administration and work force development.
EDS Agile Enterprise
A key component of our multi-year operating plan is the development of the EDS Agile Enterprise technology platform, a network-based utility architecture intended to create a more flexible, open and cost-effective technology foundation for the delivery of a significant portion of our infrastructure outsourcing, applications, and BPO services. As part of this strategy, we have established alliance relationships with a number of leading technology companies to develop the Agile Enterprise technology platform. We refer to this “federation” of technology companies as the EDS Agility Alliance. In addition to the development of the Agile Enterprise Platform, we are integrating our alliance members’ products and services into the EDS portfolio. We also jointlygo to market by engaging in operational business planning and other initiatives related to new and existing clients with AgilityAlliance members and others. See “Risk Factors” below for a discussion of certain risks relating to our multi-year operating plan.

AR-4
TRADING PRICES OF COMMON STOCK AND RELATED SHAREHOLDER MATTERS
Our common stock is listed on the New York Stock Exchange (the “NYSE”) under the symbol “EDS.” The table below shows the range of reported per share sales prices on the NYSE Composite Tape for the common stock for the periods indicated.
Calendar Year High Low
2005
First Quarter ...................................................................................................................... $ 23.35 $ 19.59 Second Quarter .................................................................................................................. 21.11 18.59 Third Quarter..................................................................................................................... 23.95 19.00 Fourth Quarter ................................................................................................................... 24.82 21.16
2006
First Quarter ...................................................................................................................... $ 28.09 $ 23.83 Second Quarter .................................................................................................................. 27.86 23.31 Third Quarter..................................................................................................................... 24.59 22.42 Fourth Quarter ................................................................................................................... 27.93 23.80
The last reported sale price of the common stock on the NYSE on February 21, 2007 was $29.32 per share. As of that date, there were approximately 103,531 record holders of common stock.
We declared quarterly dividends on our common stock at the rate of $0.05 per share in 2005 and 2006.
The following graph compares the cumulative total shareholder return on EDS Common Stock, including reinvestment of dividends, for the last five fiscal years with the cumulative total return of the Standard & Poor’s 500 Stock Index and the Goldman Sachs Technology Services Index assuming an investment of $100 on January 1, 2002. This graph is presented in accordance
with SEC requirements. You are cautioned against drawing any conclusions from this information, as past results are not
necessarily indicative of future performance. This graph in no way reflects a forecast of future financial performance.
Comparison of Five Year Cumulative Return
38
63
90
111 117
3844
36
100
28
78
10285100
100
78
135
100
10
60
110
160
1/1/02 1/1/03 1/1/04 1/1/05 1/1/06 1/1/07
EDS Common StockGoldman Sachs Technology Services IndexS&P 500 Index

AR-5
SELECTED FINANCIAL DATA
(in millions, except per share amounts)
As of and for the Years Ended December 31,
2006(1)
2005(1)
2004(2)
2003(2)
2002(2)(3)
Operating results Revenues............................................................. $ 21,268 $ 19,757 $ 19,863 $ 19,758 $ 19,538 Cost of revenues ................................................. 18,579 17,422 18,224 18,261 16,352 Selling, general and administrative..................... 1,858 1,819 1,571 1,577 1,532 Other operating (income) expense...................... 15 (26) 170 175 (2) Other income (expense)(4)................................... (60) (103) (272) (262) (331) Provision (benefit) for income taxes................... 257 153 (103) (205) 451 Income (loss) from continuing operations .......... 499 286 (271) (312) 874 Income (loss) from discontinued operations....... (29) (136) 429 46 242 Cumulative effect on prior years of changes in
accounting principles, net of income taxes ..... – – – (1,432) – Net income (loss)................................................ 470 150 158 (1,698) 1,116
Per share data Basic earnings per share of common stock:
Income (loss) from continuing operations... $ 0.96 $ 0.55 $ (0.54) $ (0.65) $ 1.82 Net income (loss)......................................... 0.91 0.29 0.32 (3.55) 2.33
Diluted earnings per share of common stock: Income (loss) from continuing operations... 0.94 0.54 (0.54) (0.65) 1.79 Net income (loss)......................................... 0.89 0.28 0.32 (3.55) 2.28
Cash dividends per share of common stock........ 0.20 0.20 0.40 0.60 0.60
Financial position Total assets ......................................................... $ 17,954 $ 17,087 $ 17,744 $ 18,616 $ 18,880 Long-term debt, less current portion................... 2,965 2,939 3,168 4,148 4,148 Shareholders’ equity ........................................... 7,896 7,512 7,440 7,022 7,022
(1) We adopted a new method of accounting for share-based payments as of January 1, 2005. This change in accounting resulted in the recognition
of pre-tax compensation expense of $123 million ($83 million net of tax) and $160 million ($110 million net of tax) for the years ended December 31, 2006 and 2005, respectively.
(2) Operating results for each of the years in the three year period ended December 31, 2004 have been restated to conform to the currentpresentation to reflect certain activities as discontinued operations during 2005.
(3) We adopted a new method of accounting for revenue recognition on long-term contracts effective January 1, 2003. Amounts for prior years are reported in accordance with our previous method of accounting for revenue recognition. Revenues for the year ended December 31, 2002 were $18,311 million on a comparable pro forma basis as if the aforementioned accounting change had been applied to all contracts at inception. Net income for the year ended December 31, 2002 was $460 million on a comparable pro forma basis as if the aforementioned accounting change had been applied to all contracts at inception.
(4) Other income (expense) includes net investment gains (losses) in the pre-tax amounts of $17 million, $(41) million, $6 million, $6 million and $(119) million for the years ended December 31, 2006, 2005, 2004, 2003 and 2002, respectively.

AR-6
MANAGEMENT’S DISCUSSION AND ANALYSIS OF FINANCIAL CONDITION AND RESULTS OF OPERATIONS
The following discussion should be read in conjunction with the consolidated financial statements and related notes that appearelsewhere in this document.
Overview
We are a leading provider of IT infrastructure, applications development and business process outsourcing services to corporateand government clients around the world. This section provides an overview of the principal factors and events that impacted our2006 financial results and may impact our future financial results.
Results. We reported revenues of $21.3 billion in 2006, an increase of 8% over 2005 revenues of $19.8 billion. Revenues in 2006 increased 7% on an organic basis which excludes the impact of currency fluctuations, acquisitions and divestitures. Income fromcontinuing operations increased $213 million in 2006 to $499 million compared with $286 million in 2005. Net income increased $320 million in 2006 to $470 million compared with $150 million in 2005.
The improvement in our results in 2006 is primarily due to the success of our initiatives outlined at the beginning of the year to achieve profitable growth through continued focus on cost competitiveness and service quality. Refer to “Results of Operations”below for additional information about our results for 2006, 2005 and 2004.
Investments in Infrastructure and Workforce Alignment. We continued to invest significant amounts in our infrastructure and workforce alignment initiatives in 2006. These investments represented approximately $0.80 per share of expenses during the yearended December 31, 2006, compared to approximately $0.44 per share during the year ended December 31, 2005.
The principal focus of our infrastructure investments in 2006 continued to be the development of our “Agile Enterprise” platform, a network-based utility architecture designed to create a flexible, open and cost-effective technology foundation for the delivery of a significant portion of our IT outsourcing and BPO services, and investments in automation and monitoring tools and products toimprove productivity. This initiative includes investments to drive standardization and automation in our service delivery platforms. We migrated certain large clients to our new service delivery platforms in 2006 and expect to migrate additional clients in 2007. Our infrastructure investments also included the build-out of our global services network, which was substantially completed in 2006. Our infrastructure investments represented approximately $0.46 per share of expenses in 2006.
Our workforce alignment investments are focused on increasing our capabilities in lower-cost, Best ShoreSM geographies, including India, Latin America, Hungary and China. These investments, which were principally comprised of severance payments, reflected the reduction in force of approximately 5,000 employees in higher cost geographies in 2006. We more than doubled the number of employees in Best ShoreSM locations in 2006 from approximately 14,000 to 32,000 persons, including approximately 18,000 in India. Our Indian workforce includes approximately 13,000 employees of MphasiS Limited (“MphasiS”). We acquired a majority equity interest in MphasiS in June 2006. Our initiatives to increase capabilities in Best ShoreSM locations also include the transfer of certain internal administrative functions, which are a principal component of our efforts to reduce our selling, general and administrative (“SG&A”) expenses as a percentage of revenue while allowing for additional focus on sales resources. Our labor cost management initiatives in 2006 also benefited from increased productivity and our investments in automation and monitoring described above. These investments in workforce alignment represented approximately $0.34 per share of expenses in 2006.
Total Contract Value of New Contract Signings. A significant portion of our revenue is generated by long-term IT services contracts. Accordingly, the total contract value, or TCV, of new business signings is a key metric used by management to monitornew business activity. We refer you to the discussion of our calculation of TCV under the heading “Non-GAAP Financial Measures” below. The TCV of our new contract signings in 2006 was approximately $26.5 billion, compared to approximately $20.1 billion and $14.0 billion in 2005 and 2004, respectively. The increase for 2006 was driven by the $3.6 billion TCV related to our new contract with GM and the $3.9 billion TCV related to the extension of our NMCI contract, each discussed below. It also reflects an increase in “new logos” as a percentage of overall TCV in 2006 compared to 2005. See “2007 Priorities and Expectations” below for our expectations regarding the TCV of new contract signings in 2007.
Following is a quarterly summary of the TCV of contract signings (excluding contracts related to discontinued operations), for each of the last five years (in billions):
First
Quarter
Second
Quarter
Third
Quarter
Fourth
Quarter Year
2002 .................................................................... $ 6.7 $ 5.6 $ 2.6 $ 7.6 $ 22.5 2003 .................................................................... 2.6 3.0 3.1 3.9 12.6 2004 .................................................................... 3.6 3.8 2.9 3.7 14.0 2005 .................................................................... 6.9 2.6 5.3 5.3 20.1 2006 .................................................................... 10.0 5.4 3.5 7.6 26.5
The TCV of contract signings can fluctuate significantly from year to year depending on a number of factors, including the numberand timing of significant new and renewal contracts (sometimes referred to as “mega-deals”) and the length of those contracts.
AR-7
Acquisition of Majority Equity Interest in MphasiS. In June 2006, we acquired a majority interest (approximately 51%) in MphasiS, an applications and business process outsourcing services company based in Bangalore, India. The cash purchase price of the controlling interest, net of cash acquired, was $352 million. The acquisition of MphasiS enhances our delivery capabilities in priority growth areas of applications development and business process outsourcing services. We refer you to Note 16 in the accompanying Notes to Consolidated Financial Statements. Subsequent to the acquisition of MphasiS, the MphasiS board of directors and the board of directors of our wholly-owned Indian subsidiary approved the merger of that subsidiary into MphasiS,pending applicable approvals. If approved, the merger will enable us to consolidate our operations in India. The operational integration of the two entities is expected to be completed in the first quarter of 2007. The proposal is subject to approval of the stock exchanges in India, shareholders of both companies and court approval. Based on an independent valuation of the two entities, the merger would result in increasing our stake in MphasiS to approximately 62% from approximately 51% at present. InOctober 2006, we announced an open offer to acquire additional MphasiS common shares, which we expect to be completed in the first quarter of 2007. However, because the offer price is lower than the current trading price for such shares, we do not expect to acquire a significant number of additional shares pursuant to this offer.
General Motors Recompete. GM is our largest single client. Our 10-year Master Service Agreement, or MSA, with GM expired in June 2006. The MSA served as a framework for the negotiation and operation of service agreements representing a substantial majority of our revenues from GM. Following a recompete process, in February 2006 we were awarded approximately 70% of the contracts we bid on with a total contract value then estimated at approximately $3.6 billion over five years. Revenues from GM,which include revenues under the MSA through June 7, 2006, were approximately $1.7 billion, or 8% of our total revenues, in 2006. We expect annualized revenue from GM of approximately $1.3 billion to $1.5 billion over the remaining term of the new agreement, including the business awarded in the recompete and additional business not part of the recompete. Due to improvements in our cost structure already achieved and expected to be achieved in part through the implementation of our multi-year plan, we do not expect a significant change over the term of the new agreement in our operating margins attributable to thisclient compared to recent historical results.
NMCI Contract. We provide end-to-end IT infrastructure on a seat management basis to the Department of Navy (the “DoN”), which includes the U.S. Navy and Marine Corps, under a contract that has been extended through September 2010. Prior to 2006, this contract had a significant adverse impact on our operating results. In 2003, we incurred operating losses of $389 million,excluding a deferred contract cost write off of $559 million, and reported free cash flow usage of $824 million associated with this contract. In 2004, we incurred operating losses of $487 million, exclusive of a $375 million non-cash impairment charge to writedown long-lived assets to estimated fair value, and reported free cash flow usage of $423 million (excluding the $522 million cash payment for the purchase of financial assets associated with a securitization facility referred to below) associated with this contract. In 2005, we incurred operating losses of $75 million and reported free cash flow of $125 million associated with thiscontract.
On March 24, 2006, we entered into a contract modification with the DoN pursuant to which the DoN exercised its option to extend this contract by three years through September 2010. The contract was also amended to, among other things, incorporate pricing for legacy support, restructure client satisfaction incentive methods to allow for objective metrics, extend the refresh period for a majority of desktop seats, establish the economic lives and valuation methodology for equipment and related infrastructurepayable in the event of the DoN’s election to purchase such equipment at contract termination, increase the DoN’s minimum purchase requirements by an aggregate of $500 million over program years 2006 through 2010, provide for the payment to EDS of $100 million in cash (which was received in the second quarter of 2006), and provide for the release by EDS of certain claims related to the contract. The $100 million cash payment was allocated to future services and will be recognized as revenue on a straight-line basis over the remaining term of the contract. As a result of the contract modification, in compliance with Emerging Issues Task Force 01-8, Determining Whether an Arrangement Contains a Lease, we recognized sales-type capital lease revenue of $116 million in the first quarter of 2006 associated with certain assets previously accounted for as operating leases, and certainassets previously accounted for as capital leases with an aggregate net investment balance of $113 million are now accounted foras operating leases based on revised estimates of economic lives as agreed in the contract modification (20 years). We expect torecover a significant portion of our investment in this contract through the sale of NMCI infrastructure and desktop assets to the client at the end of the contract term, including amounts in excess of the expected carrying amounts of contract assets. Long-lived assets and lease receivables associated with the contract totaled approximately $278 million and $295 million, respectively, atDecember 31, 2006. As a result of the activity on the contract during the first quarter of 2006, including the sales-type capital lease revenue resulting from the contract modification, we recognized net non-recurring income of $0.02 per share during the first quarter. Operating profit for the contract during 2006 improved significantly over prior years as a result of higher levels of seatdeployment and service delivery improvements. As part of the March 24, 2006 contract modification, we also became eligible to be compensated for certain communications costs when required to supplement the Government communications network, and we received orders of $40 million from the DoN related to the fourth quarter of 2005 through the third quarter of 2006. This amount is included in revenues in our consolidated statement of operations for the year ended December 31, 2006.
U.K. Ministry of Defence Contract. In March 2005, a consortium led by us was awarded a 10-year contract for the first increment of the U.K. Ministry of Defence (MoD) project to consolidate numerous existing information networks into a single next-generation infrastructure (the Defence Information Infrastructure Future project). The total contract value of the initial contract

AR-8
was approximately $3.9 billion over 10 years. In December 2006, the contract was amended to include the second increment of such project, increasing the total contract value by approximately $1.27 billion over the remaining eight years of the contract. Our upfront expenditure and capital investment requirements for this contract have adversely impacted our free cash flow and earnings during certain fiscal periods since inception of the contract and may continue to do so in the future. Many of the services andservice delivery challenges required by this contract are similar to those required by the NMCI contract discussed above, and accordingly, many of the risks are the same. We have applied lessons learned from our experience with the NMCI contract to thiscontract, including contract terms with clearly defined client and EDS accountability and improved program management. There have occurred and may occur in the future program changes and inabilities to achieve certain related dependencies that extend the initial development timeline. This contract provides for adjustments to be made to reflect the financial impact to EDS of certain program changes and any inability to achieve dependencies. During 2006, we reached a mutually satisfactory agreement with the client regarding some initial billing adjustments under the contract to reflect part of the financial impact to us of an extended initial development timeline. We will continue in the ongoing course of this contract to work with the client to agree upon any future appropriate adjustments under the contract which may be necessary. If we are unable to reach agreement with the client regardingsuch adjustments, our revenues, earnings and free cash flow for this contract, or the timing of the recognition thereof, could beadversely impacted.
Verizon. We provided IT services to MCI, Inc. pursuant to an IT services agreement that included minimum annual purchase obligations through January 2008. We also procured network telecommunications services from MCI pursuant to an agreement that included minimum annual purchase obligations through 2010. MCI was acquired by Verizon Communications, Inc. in January 2006. In December 2006, Verizon in-sourced most of the IT services we had been providing to MCI. We received a $90 million payment from Verizon in the fourth quarter of 2006 for assets and transition services. We also received a payment of $225 millionin the first quarter of 2007 related to the termination of these services. As a result of this payment and certain services we will continue to provide and bill for in 2007, we do not expect that our free cash flow or income for this contract for the 2007 fiscalyear will be significantly different from the results we would have experienced had the contract continued unchanged through January 2008. However, we do not expect to recognize any significant revenue or earnings from this client after 2007. Although the $225 million payment will be reflected in our first quarter 2007 free cash flow, the payment is expected to be reflected in our revenue and earnings for the first and third quarters of 2007 due to certain contingencies in our agreement with this client. Inaddition to the changes to our IT services agreement, the agreement pursuant to which we procure telecommunications network services was also amended to, among other things, reduce our minimum annual spend commitment by approximately 50% and provide additional flexibility in our ability to meet that commitment.
Divestiture of Global Field Services. On November 15, 2006, we completed the sale of Global Field Services, our desktop support services business located in Europe. As a result of this disposition, we incurred a pre-tax loss in the fourth quarter of 2006 of $23 million.
Divestiture of A. T. Kearney. We completed the sale of our A.T. Kearney management consulting subsidiary to the firm’s management effective January 20, 2006. That subsidiary is classified as “held for sale” at December 31, 2005 and its results areincluded in income (loss) from discontinued operations. A.T. Kearney’s results for the year ended December 31, 2005 include a pre-tax impairment charge of $118 million to write-down the carrying value of its long-lived assets, including tradename intangible, to estimated fair value less cost to sell. The estimated fair value was determined based on the terms of the sale. The impairment charge was partially offset by the recognition of $8 million previously unrecognized tax assets that were expected tobe realized as a result of the sale. Income (loss) from discontinued operations also includes the net results of the maintenance,repair and operations (MRO) management services business which was transferred by A.T. Kearney to us prior to the divestiture of A.T. Kearney in January 2006. We refer you to Note 17 in the accompanying Notes to Consolidated Financial Statements.
Share Count. The weighted-average number of shares used to compute basic and diluted earnings per share were 519 million and 529 million, respectively, for the year ended December 31, 2006. On February 21, 2006, we announced that the Board of Directorshad authorized a $1 billion share repurchase program over 18 months. Through December 31, 2006, we had purchased 26.2 million shares at a cost of $683 million under this repurchase program, including the shares purchased under a $400 million accelerated share repurchase (“ASR”) agreement entered into in February 2006 (see Note 1 in the accompanying Notes to Consolidated Financial Statements). Our share count reflects the share repurchases referred to above, as well as shares issued under our employee stock-based compensation programs. Factors that could affect basic and dilutive share counts in the future include the share price and additional repurchases of shares under the authorization referred to above, offset by the dilutive effects of all our employee stock-based compensation plans and our contingently convertible senior notes. We are evaluating a “share neutral” approach, the objective of which would be to repurchase sufficient additional shares to approximately offset the dilutive effects of our employee stock-based compensation plans. Assuming we adopt such an approach, we expect the weighted-average number of shares used to compute diluted earnings per share to be approximately 545 million shares (which includes the dilutiveimpact of our contingently convertible senior notes).
Accounting Change. We adopted Statement of Financial Accounting Standards (“SFAS”) No. 158 in 2006. We refer you to Note 1 in the accompanying Notes to Consolidated Financial Statements for additional information about this accounting change.

AR-9
2007 Priorities and Expectations
In 2007, we will continue our initiatives to achieve profitable growth through focus on cost competitiveness and service quality. We expect to show continued improvement in our financial results as we benefit from our prior investments in infrastructure andworkforce realignment, a reduction in the level of those investments compared to 2006 and our initiatives to further improve productivity and performance at the account level, leverage service delivery and reduce selling, general and administrative expense as a percent of revenues. In addition, we will continue our focus on improving service quality, client satisfaction and client innovation.
We currently expect 2007 revenues of approximately $22.0 billion to $22.5 billion, which would represent an increase in organicrevenues of approximately 4% from 2006, driven principally by the increased level of contract signings in 2006.
We currently expect 2007 adjusted earnings per share of approximately $1.60, which excludes the impact of discontinued operations, gains and losses from divestitures, reversals of previously recognized restructuring expense and other identified items that management believes are not reflective of our core operating business. We refer you to the discussion of adjusted net income and adjusted earnings per share under “Non-GAAP Financial Measures” below. The expected increase in 2007 adjusted earnings per share reflects an anticipated improvement in operating margins.
We currently expect to generate free cash flow of $1.0 billion to $1.1 billion in 2007, an improvement from 2006 driven principally by the forecasted improvement in our operating margins. Refer to “Non-GAAP Financial Measures” below for a definition and discussion of free cash flow.
We currently expect the TCV of new contract signings in 2007 to be approximately $23 billion. We refer you to the discussion ofthe calculation of TCV under the heading “Non-GAAP Financial Measures” below.
The estimates for 2007 financial performance set forth in this Management’s Discussion and Analysis of Financial Condition and Results of Operations rely on management’s current assumptions, including assumptions concerning future events, and are subjectto a number of uncertainties and other factors, many of which are outside the control of management, that could cause actual results to differ materially from such estimates. For a discussion of certain of these factors, we refer you to the discussion under “Risk Factors” below.
Non-GAAP Financial Measures
In addition to generally accepted accounting principles, or GAAP, results, we disclose the non-GAAP measures of adjusted net income, adjusted earnings per share (EPS), and free cash flow. Adjusted net income and adjusted earnings per share exclude the impact of certain special amounts, specifically earnings/losses from discontinued operations net of taxes, gains and losses fromdivestitures, reversals of previously recognized restructuring expense and other identified items that management believes are not reflective of our core operating business. Such amounts may have a material impact on our net income and earnings per share. Wedefine free cash flow as net cash provided by operating activities, less capital expenditures. Capital expenditures is the sum of (i) net cash used in investing activities, excluding proceeds from sales of marketable securities, proceeds related to divested assets and non-marketable equity investments, payments for acquisitions, net of cash acquired, and non-marketable equity investments, and payments for purchases of marketable securities, and (ii) payments on capital leases. Free cash flow excludes items that are actual expenditures that impact cash available to EDS for other uses and should not be considered a measure of liquidity or an alternative to the cash flow measurements required by GAAP, such as net cash provided by operating activities or net increase/decrease in cash and cash equivalents. Refer to “Liquidity and Capital Resources” below for a reconciliation of free cash flow to the net increase (decrease) in cash and cash equivalents for the years ended December 31, 2006, 2005 and 2004. Management considers these non-GAAP measures an important measure of EDS’ performance. Management uses these measures to evaluate EDS’ core operating performance period over period, analyze underlying trends in EDS’ business and establish operational goals and forecasts, including targets for performance-based compensation. EDS may not define adjusted net income, adjusted earnings per share or free cash flow in the same manner as other companies and, accordingly, the amounts reported by EDS for such measures may not be comparable to similarly titled measures reported by other companies.
We also disclose the total contract value, or TCV, of new business signings. Management considers TCV to be an important metricto monitor new business activity. There are no third-party standards or requirements governing the calculation of TCV. The TCV of a client contract represents our estimate at contract signing of the total revenue expected over the term of that contract. Contractsignings include contracts with new clients and renewals, extensions and add-on business with existing clients. TCV does not include potential revenues that could be earned from a client relationship as a result of future expansion of service offerings to that client, nor does it reflect option years under non-governmental contracts that are subject to client discretion. TCV reflects anumber of management estimates and judgments regarding the contract, including assumptions regarding demand-driven usage, scope of work and client requirements. In addition, our contracts may be subject to currency fluctuations and, for contracts withthe U.S. federal government, annual funding constraints and indefinite delivery/indefinite quantity characteristics. Accordingly, the TCV we report should not be considered firm orders or predictive of future operating results.
Non-GAAP measures are a supplement to, and not a replacement for, GAAP financial measures. To gain a complete picture of our performance, management does (and investors should) rely on our GAAP financial statements.

AR-10
Results of Operations
Revenues. As-reported growth percentages are calculated using revenues reported in the consolidated statements of operations. Organic growth percentages are calculated by removing from current year as-reported revenues the impact of the change in exchange rates between the local currency and the U.S. dollar from the current period and the comparable prior period. It further excludes revenue growth due to acquisitions in the period presented if the comparable prior period had no revenue from the sameacquisition, and revenue decreases due to businesses divested in the period presented or the comparable prior period. Segment revenues for non-U.S. operations are measured using fixed currency exchange rates. Differences between the fixed and actual exchange rates are included in the “all other” category.
Following is a summary of revenues for the years ended December 31, 2006 and 2005 (in millions):
As-Reported Organic
Consolidated revenues: 2006 2005 Growth % Growth %
Revenues........................................................................ $ 21,268 $ 19,757 8% 7%
% Increase
Segment revenues: 2006 2005 (Decrease)
Americas........................................................................ $ 9,588 $ 9,239 4% EMEA............................................................................ 6,448 5,935 9% Asia Pacific.................................................................... 1,479 1,377 7% U.S. Government ........................................................... 3,350 2,842 18% Other .............................................................................. 23 22 –
Total Outsourcing................................................... 20,888 19,415 8% All other......................................................................... 380 342
Total ....................................................................... $ 21,268 $ 19,757 8%
Revenue growth in the Americas was primarily attributable to contracts with new clients in our retail, energy and transportationindustry groups, add-on business with existing clients in our financial services industry group and in Latin America, and our ExcellerateHRO business which began operations in March 2005. Americas revenues in 2006 includes the recognition of a $90 million payment for assets and transition services related to the in-sourcing of services by Verizon described above. Revenue growth in EMEA was primarily attributable to increased revenues from the U.K. MoD contract and clients in North and South EMEA, partially offset by a decline in revenues from clients in Central EMEA and the U.K. Revenue growth in Asia Pacific was primarily attributable to our acquisition of MphasiS in the second quarter of 2006, partially offset by a decline in revenues from a client in the financial services industry in Australia. Revenue growth in U.S. Government was primarily attributable to the NMCIcontract and several state Medicaid contracts, partially offset by the impact of the completion of a large federal contract in 2005. Refer to the “Overview” section above for a further discussion of the U.K. MoD, NMCI and Verizon contracts and of our acquisition of MphasiS.
Following is a summary of revenues for the years ended December 31, 2005 and 2004 (in millions):
As-Reported Organic
Consolidated revenues: 2005 2004 Growth % Growth %
Revenues........................................................................ $ 19,757 $ 19,863 (1)% (3)%
% Increase
Segment revenues: 2005 2004 (Decrease)
Americas........................................................................ $ 9,239 $ 9,251 – EMEA............................................................................ 5,935 6,247 (5)% Asia Pacific.................................................................... 1,377 1,289 7% U.S. Government ........................................................... 2,842 2,893 (2)% Other .............................................................................. 22 24 –
Total Outsourcing................................................... 19,415 19,704 (1)% All other......................................................................... 342 159
Total ....................................................................... $ 19,757 $ 19,863 (1)%
The decrease in revenues in the Americas was primarily due to the termination of a significant commercial contract in August 2004 (see Note 3 in the accompanying Notes to Consolidated Financial Statements). The decrease in revenues in EMEA was

AR-11
primarily due to the termination of our contract with the U.K. Government’s Inland Revenue department effective June 2004, offset by an increase in revenue from other government and commercial clients, including our contract with the U.K. MoD. Revenue growth in Asia Pacific was primarily due to an increase in revenues from a client in the financial services industry inAustralia. The decrease in the U.S. Government was primarily attributable to the completion of a large federal contract in early2005, partially offset by an increase in revenue from our NMCI contract.
Gross margin. Our gross margin percentages [(revenues less cost of revenues)/revenues] were 12.6%, 11.8% and 8.3% in 2006, 2005 and 2004, respectively. The increase in our gross margin percentage in 2006 was primarily attributable to our enterprise-wide productivity initiatives, including improved performance on significant contracts, better sourcing and other cost structure improvements (240 basis points) and a pension obligation settlement loss associated with the termination of the Inland Revenue contract in 2005 (40 basis points), partially offset by incremental costs related to investments in our infrastructure, new service offerings and severance (190 basis points). Contracts with improved performance in 2006 include, among others, the NMCI contract (140 basis points), which includes the impact of the contract modification discussed above, and the Verizon contract (35 basis points), which includes the impact of the $90 million payment for assets and transition assistance services discussed above. The increase in our gross margin percentage in 2005 was primarily attributable to an improvement in the performance of the NMCI contract which had operating losses of $75 million in 2005 compared with operating losses of $487 million and an asset impairment charge of $375 million in 2004. Refer to Note 3 in the accompanying Notes to Consolidated Financial Statements. The NMCI contract had a 480 basis point negative impact on our 2004 gross margin percentage compared to a 90 basis point negative impact in 2005. Other items affecting our 2005 gross margin include a pension obligation settlement loss associated with the termination of the Inland Revenue contract (40 basis points), an increase in compensation expense attributable to the change inaccounting for share-based payments (50 basis points), a deferred cost impairment charge associated with a large IT commercial contract (20 basis points) and litigation costs (20 basis points). These items were partially offset by favorable resolution of certain customer contract matters that permitted recognition of previously deferred revenue (40 basis points). Our gross margin in 2005was also adversely affected by investments in our infrastructure and new service offerings and a decrease in revenues, includingthe termination of our contract with the U.K. Government’s Inland Revenue department. An additional item affecting our 2004 gross margin was operating losses and other charges on our “other commercial contract” (150 basis points).
Selling, general and administrative. SG&A expenses as a percentage of revenues were 8.7%, 9.2% and 7.9% in 2006, 2005 and 2004, respectively. The decrease in our SG&A percentage in 2006 was primarily attributable to an increase in revenues (70 basispoints) and a decrease in legal costs (20 basis points), including costs associated with the settlement of a consolidated securitiesaction in 2005, partially offset by an increase in selling costs associated with increasing TCV of new business signings (10 basispoints). The increase in our SG&A percentage in 2005 was primarily attributable to an increase in compensation expense resultingfrom the change in accounting for share-based payments, and performance-based RSUs (30 basis points) and incremental legal and regulatory costs (20 basis points), including costs associated with the settlement of a consolidated securities action. Our SG&Aexpense in 2005 was also impacted by higher sales and marketing costs, including commissions associated with increasing TCV of new business signings (40 basis points), and by certain investment initiatives (10 basis points).
We expect our operating margin [(revenues less costs and expenses)/revenues] to improve in 2007 driven by the benefits of our key productivity initiatives, the performance of significant contracts and a reduction in the level of spending on our investmentinitiatives.
Other operating (income) expense. Following is a summary of other operating (income) expense for the years ended December 31, 2006, 2005 and 2004 (in millions):
2006 2005 2004
Other operating (income) expense: Restructuring costs, net of reversals ................................................................... $ (7) $ 68 $ 226 Early retirement offer ......................................................................................... – – 50 Pre-tax loss (gain) on disposal of businesses:
Global Field Services .................................................................................. 23 – – European wireless clearing.......................................................................... – (93) – U.S. wireless clearing .................................................................................. (1) – (35) Automotive Retail Group ............................................................................ – – (66) Credit Union Industry Group....................................................................... – – (4)
Other ................................................................................................................... – (1) (1) Total ............................................................................................................ $ 15 $ (26) $ 170
We refer you to Note 19 in the accompanying Notes to Consolidated Financial Statements for a further discussion of the components of other operating (income) expense.

AR-12
Other income (expense). Other income (expense) includes interest expense, interest and dividend income, investment gains and losses, minority interest expense, and foreign currency transaction gains and losses. Following is a summary of other income (expense) for the years ended December 31, 2006, 2005 and 2004 (in millions):
2006 2005 2004
Other income (expense): Interest expense .................................................................................................. $ (239) $ (241) $ (321) Interest income and other, net............................................................................. 179 138 49
Total ............................................................................................................ $ (60) $ (103) $ (272)
Interest income and other in 2006 includes net investment gains of $17 million compared to net investment losses of $41 million in 2005, including a write-down of $35 million relating to our leveraged lease investments. Interest income and other in 2006 compared with 2005 reflects an increase in interest and dividend income of $22 million, offset by an increase in net foreign currency transaction losses of $24 million. The increase in interest income and other in 2005 was primarily due to interest income on increased levels of cash and marketable securities, and foreign currency transaction gains. Interest income and other in 2004includes net investment losses of $28 million, including a write-down of $34 million relating to our leveraged lease investments. The decrease in interest expense in 2005 was primarily due to the extinguishment of debt resulting from our debt exchange offercompleted in 2004 and other scheduled debt repayments. See “Financial Position” and “Liquidity and Capital Resources” for a further discussion of our outstanding debt balance. Interest expense in 2004 includes $36 million in expenses resulting from ourdebt exchange offer. See Note 8 in the accompanying Notes to Consolidated Financial Statements for a further discussion of the exchange offer.
Income taxes. Our effective income tax rates on income from continuing operations were 34.0%, 34.9% and 27.5% for the years ended December 31, 2006, 2005 and 2004, respectively. The effective tax rate for 2006 was impacted by (i) the passage of a new Texas tax system requiring a $19 million write-off of net deferred tax assets, (ii) the recognition of additional valuation allowances of $44 million for losses incurred in certain foreign tax jurisdictions due to underperforming operations, and (iii) favorable changes to the liabilities for tax contingencies of $48 million, including settlements with the U.S. Internal Revenue Service (“IRS”). The effective tax rate in 2005 was impacted by (i) recognition of additional valuation allowances of $115 million for losses incurred in certain foreign tax jurisdictions due to underperforming operations, and (ii) reversal of certain tax contingency accruals of $40 million due to progress made in jurisdictional tax audits. Our effective tax rate could fluctuate periodically as a result of our adoption of SFAS No. 123R. As we record expense under SFAS No. 123R, a deferred tax asset is recorded. The realization of that asset is dependent upon the intrinsic value of an option on the date of exercise. Any unrealized deferred tax asset is charged to tax expense in the period of exercise or expiration and, accordingly, would result in a higher effective tax rate in such period. See“Application of Critical Accounting Policies” for a discussion of factors affecting income tax expense.
In June 2006, we agreed with the IRS on a settlement related to the R&D tax credit for years 1996-2002 and the closure of the audit of our 1996-1998 federal income tax returns. We had previously estimated the amount of the R&D credit that would be disallowed for each year and recorded a tax liability for such amount. Our analysis included the fact that the IRS had proposeddisallowances of the entire R&D credit for tax years 1996-1998 and a portion of the R&D credit for tax years 1999-2002. The settlement resulted in a $50 million reduction of such liability in the second quarter of 2006.
Discontinued operations. Income (loss) from discontinued operations is comprised primarily of the net results of A.T. Kearney which was sold in 2006 and UGS PLM Solutions which was sold in 2005. Refer to Note 17 in the accompanying Notes to Consolidated Financial Statements for additional information related to discontinued operations.
Segment information. Refer to Note 12 in the accompanying Notes to Consolidated Financial Statements for a summary of certain financial information related to our reportable segments for 2006, 2005 and 2004, as well as certain financial information related to our operations by geographic region and by service line for such years.
Financial Position
At December 31, 2006, we held cash and marketable securities of $3.0 billion, had working capital of $3.0 billion, and had a current ratio (current assets/current liabilities) of 1.58-to-1. This compares to cash and marketable securities of $3.2 billion,working capital of $3.5 billion, and a current ratio of 1.68-to-1 at December 31, 2005. Approximately 5% of our cash and cash equivalents and marketable securities at December 31, 2006 were not available for debt repayment due to various commercial limitations on the use of these assets.
Days sales outstanding for trade receivables were 56 days at December 31, 2006 compared to 58 days at December 31, 2005. Days payable outstanding were 21 days at December 31, 2006 compared to 19 days at December 31, 2005.
Total debt was $3.1 billion at December 31, 2006 versus $3.3 billion at December 31, 2005. Total debt consists of notes payableand capital leases. The total debt-to-capital ratio (which includes total debt and minority interests as components of capital) was 28% at December 31, 2006 and 30% at December 31, 2005.

AR-13
Off-Balance Sheet Arrangements and Contractual Obligations
In connection with certain service contracts, we may arrange a client supported financing transaction (“CSFT”) with our client and an independent third-party financial institution or its designee. The use of these transactions enables us to offer clients morefavorable financing terms. These transactions also enable the preservation of our capital and allow us to avoid client credit risk relating to the repayment of the financed amounts. Under these transactions, the independent third-party financial institution finances the purchase of certain IT-related assets and simultaneously leases those assets for use in connection with the servicecontract. The use of a CSFT on a service contract results in lower contract revenue and expense to EDS over the contract term.
In CSFTs, client payments are made directly to the financial institution providing the financing. If the client does not make the required payments under the service contract, under no circumstances do we have an ultimate obligation to acquire the underlyingassets unless our nonperformance under the service contract would permit its termination, or we fail to comply with certain customary terms under the financing agreements, including, for example, covenants we have undertaken regarding the use of the assets for their intended purpose. We consider the possibility of our failure to comply with any of these terms to be remote.
The aggregate dollar values of assets purchased under our CSFT arrangements were $16 million, $8 million and $65 million during 2006, 2005 and 2004, respectively. No future asset purchases are expected to be financed under existing arrangements. Asof December 31, 2006, there were outstanding an aggregate of $136 million under CSFTs yet to be paid by our clients. In the event a client contract is terminated due to nonperformance, we would be required to acquire only those assets associated with the outstanding amounts for that contract. Net of repayments, the estimated future maximum amount outstanding under existing financing arrangements is not expected to exceed $150 million. We believe we have sufficient alternative sources of capital to directly finance the purchase of capital assets to be used for our current and future client contracts without the use of thesearrangements.
Performance guarantees. In the normal course of business, we may provide certain clients, principally governmental entities, with financial performance guarantees, which are generally backed by standby letters of credit or surety bonds. In general, we would be liable for the amounts of these guarantees in the event our nonperformance permits termination of the related contract by our client, the likelihood of which we believe is remote. We believe we are in compliance with our performance obligations under allservice contracts for which there is a performance guarantee.
Following is a summary of the estimated expiration of financial guarantees outstanding as of December 31, 2006 (in millions): Estimated Expiration Per Period
Total 2007 2008 2009 Thereafter
Performance guarantees: CSFT transactions........................................... $ 136 $ 107 $ 20 $ 7 $ 2 Standby letters of credit, surety bonds and
other............................................................. 574 276 25 14 259 Other guarantees ................................................. 19 13 6 – –
Total ............................................................ $ 729 $ 396 $ 51 $ 21 $ 261
Contractual obligations. Following is a summary of payments due in specified periods related to our contractual obligations as of December 31, 2006 (in millions):
Payments Due by Period
Total 2007 2008-2009 2010-2011 After 2011
Long-term debt, including current portion and interest(1).......................................................... $ 4,638 $ 336 $ 1,252 $ 979 $ 2,071
Operating lease obligations................................. 1,516 343 517 288 368 Purchase obligations(2) ........................................ 2,599 1,318 981 298 2
Total(3) ......................................................... $ 8,753 $ 1,997 $ 2,750 $ 1,565 $ 2,441
(1) Amounts represent the expected cash payments (principal and interest) of our long-term debt and do not include any fair value adjustments or bond premiums or discounts. Amounts also include capital lease payments (principal and interest).
(2) Purchase obligations include material agreements to purchase goods or services, principally software and telecommunications services, that are enforceable and legally binding on EDS and that specify all significant terms, including: fixed or minimum quantities to be purchased; fixed, minimum or variable price provisions; and the approximate timing of the transaction. Purchase obligations exclude agreements that are cancelable without penalty. Purchase obligations also exclude our obligation to repurchase minority interests in joint ventures, including our obligation to repurchase Towers Perrin’s minority interest in ExcellerateHRO. See Note 16 of the accompanying consolidated financial statements.
(3) We contributed $240 million and $346 million to our qualified and nonqualified pension plans in 2006 and 2005, respectively, and we expect to contribute approximately $100 million to these plans in 2007, including discretionary and statutory contributions. Our U.S. funding policy is to contribute amounts that fall within the range of deductible contributions for U.S. federal income tax purposes. See Note 13 of the accompanying consolidated financial statements for additional information about our retirement plans.

AR-14
Liquidity and Capital Resources
Following is a summary of our cash flows for the years ended December 31, 2006, 2005 and 2004 (in millions):
2006 2005 2004
Cash flows: Net cash provided by operating activities........................................................... $ 1,933 $ 1,296 $ 1,278 Net cash used in investing activities ................................................................... (33) (797) (758) Net cash used in financing activities................................................................... (834) (681) (663) Free cash flow..................................................................................................... 887 619 304
Operating activities. The increase in cash provided by operating activities in 2006 compared to 2005 was due to a $48 million increase in cash provided by earnings (i.e., net income less non-cash operating items) and a $589 million change in operating assets and liabilities. The change in operating assets and liabilities resulted primarily from an improvement in receivable collections and lower vendor and tax payments, partially offset by an increase in contract costs and vendor prepayments and a decrease in customer prepayments. The change in operating liabilities was also impacted by various severance accruals recognizedin 2006 that will be paid in 2007, and certain significant vendor payments in 2005 that had been recognized as expense in 2004.The increase in net cash provided by operating activities in 2005 compared to 2004 was due to a $150 million increase in earnings, adjusted to exclude non-cash operating items, offset by a $132 million change in operating assets and liabilities. The change inoperating assets and liabilities resulted primarily from a decrease in receivables collections and an increase in tax payments, offset by an increase in deferred revenue.
Investing activities. The change in net cash used in investing activities in 2006 compared to 2005 was primarily due to an increase in net proceeds from sales of marketable securities, partially offset by a decrease in net proceeds from investments and real estateand an increase in payments for software. Payments for acquisitions relate primarily to the purchases of MphasiS in 2006 and theTowers Perrin pension, health and welfare administration services business in 2005. Refer to Note 16 in the accompanying Notes to Consolidated Financial Statements for additional information related to our acquisitions. Net proceeds from real estate salesresulted from the sales of real estate properties and land held for development. Refer to Notes 3 and 5 in the accompanying Notesto Consolidated Financial Statements for additional information related to our real estate sales. The change in net cash used ininvesting activities in 2005 compared to 2004 was primarily due to a decrease in proceeds from divestitures in 2005, and an increase in acquisition payments related to 2005 acquisitions (see Notes 16, 17 and 19 in the accompanying Notes to ConsolidatedFinancial Statements). In addition, we realized net proceeds of $178 million in 2005 resulting from sales of real estate. Net cash used in investing activities in 2004 includes the proceeds from the divestitures of our U.S. wireless clearing business, UGS PLMSolutions and Automotive Retail Group (“ARG”). Divestiture proceeds were somewhat offset by net purchases of marketable securities. Net cash used in investing activities in 2004 also includes a $522 million cash payment related to the purchase of financial assets associated with the NMCI securitization facility.
Financing activities. The increase in net cash used in financing activities in 2006 was primarily due to purchases of treasury stock, partially offset by a reduction in debt payments and an increase in cash provided by employee stock transactions. Refer to the “Overview” section above and Note 1 in the accompanying Notes to Consolidated Financial Statements for additional information about our share repurchase authorization. Refer to “Off-Balance Sheet Arrangements and Contractual Obligations” above for a summary of expected payments related to our outstanding debt at December 31, 2006. The increase in net cash used in financing activities in 2005 compared to 2004 was primarily due to proceeds from our common stock issuance associated with a debt exchange in 2004. The increase in net cash used in financing activities in 2004 was primarily due to an increase in net payments on long-term debt and capital lease obligations, partially offset by proceeds from our common stock issuance associated with a debtexchange and by a reduction in dividend payments.
Free cash flow. We define free cash flow as net cash provided by operating activities, less capital expenditures. Capital expenditures is the sum of (i) net cash used in investing activities, excluding proceeds from sales of marketable securities, proceeds related to divested assets and non-marketable equity investments, payments related to acquisitions, net of cash acquired, and non-marketable equity investments, and payments for purchases of marketable securities, and (ii) capital lease payments. During 2004, we sold our UGS PLM Solutions subsidiary and repurchased financial assets outstanding under the NMCI contract securitization facility. Due to the significance of these transactions, the calculation of free cash flow for 2004 was adjusted to exclude $14 million in transaction fees paid during 2004 related to the UGS PLM Solutions disposition, and the $522 million cashpayment related to the repurchase of financial assets associated with the NMCI securitization facility. The calculation of free cash flow for 2004 was also adjusted to include $85 million in cash generated through utilization of operating tax credits, predominantly related to 2004, to offset income tax associated with the UGS PLM Solutions disposition (such tax credits would otherwise have been available to offset future taxable income generated by operations). Free cash flow is a non-GAAP measure and should be viewed together with our consolidated statements of cash flows.
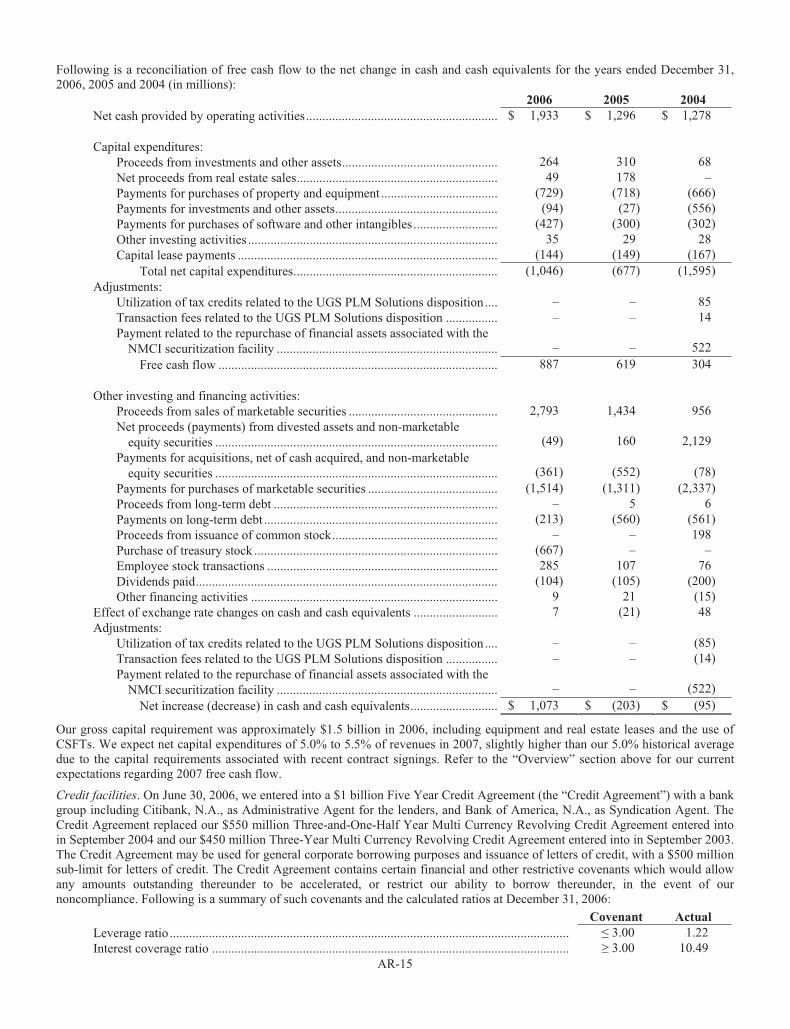
AR-15
Following is a reconciliation of free cash flow to the net change in cash and cash equivalents for the years ended December 31,2006, 2005 and 2004 (in millions):
2006 2005 2004
Net cash provided by operating activities........................................................... $ 1,933 $ 1,296 $ 1,278
Capital expenditures: Proceeds from investments and other assets................................................ 264 310 68 Net proceeds from real estate sales.............................................................. 49 178 – Payments for purchases of property and equipment .................................... (729) (718) (666) Payments for investments and other assets.................................................. (94) (27) (556) Payments for purchases of software and other intangibles.......................... (427) (300) (302) Other investing activities ............................................................................. 35 29 28 Capital lease payments ................................................................................ (144) (149) (167)
Total net capital expenditures............................................................... (1,046) (677) (1,595) Adjustments:
Utilization of tax credits related to the UGS PLM Solutions disposition .... – – 85 Transaction fees related to the UGS PLM Solutions disposition ................ – – 14 Payment related to the repurchase of financial assets associated with the
NMCI securitization facility .................................................................... – – 522 Free cash flow ...................................................................................... 887 619 304
Other investing and financing activities:
Proceeds from sales of marketable securities .............................................. 2,793 1,434 956 Net proceeds (payments) from divested assets and non-marketable
equity securities ....................................................................................... (49) 160 2,129 Payments for acquisitions, net of cash acquired, and non-marketable
equity securities ....................................................................................... (361) (552) (78) Payments for purchases of marketable securities ........................................ (1,514) (1,311) (2,337) Proceeds from long-term debt ..................................................................... – 5 6 Payments on long-term debt ........................................................................ (213) (560) (561) Proceeds from issuance of common stock................................................... – – 198 Purchase of treasury stock ........................................................................... (667) – – Employee stock transactions ....................................................................... 285 107 76 Dividends paid............................................................................................. (104) (105) (200) Other financing activities ............................................................................ 9 21 (15)
Effect of exchange rate changes on cash and cash equivalents .......................... 7 (21) 48 Adjustments:
Utilization of tax credits related to the UGS PLM Solutions disposition .... – – (85) Transaction fees related to the UGS PLM Solutions disposition ................ – – (14) Payment related to the repurchase of financial assets associated with the
NMCI securitization facility .................................................................... – – (522) Net increase (decrease) in cash and cash equivalents........................... $ 1,073 $ (203) $ (95)
Our gross capital requirement was approximately $1.5 billion in 2006, including equipment and real estate leases and the use ofCSFTs. We expect net capital expenditures of 5.0% to 5.5% of revenues in 2007, slightly higher than our 5.0% historical averagedue to the capital requirements associated with recent contract signings. Refer to the “Overview” section above for our currentexpectations regarding 2007 free cash flow.
Credit facilities. On June 30, 2006, we entered into a $1 billion Five Year Credit Agreement (the “Credit Agreement”) with a bank group including Citibank, N.A., as Administrative Agent for the lenders, and Bank of America, N.A., as Syndication Agent. The Credit Agreement replaced our $550 million Three-and-One-Half Year Multi Currency Revolving Credit Agreement entered into in September 2004 and our $450 million Three-Year Multi Currency Revolving Credit Agreement entered into in September 2003. The Credit Agreement may be used for general corporate borrowing purposes and issuance of letters of credit, with a $500 millionsub-limit for letters of credit. The Credit Agreement contains certain financial and other restrictive covenants which would allow any amounts outstanding thereunder to be accelerated, or restrict our ability to borrow thereunder, in the event of our noncompliance. Following is a summary of such covenants and the calculated ratios at December 31, 2006:
Covenant Actual
Leverage ratio ........................................................................................................................... 3.00 1.22 Interest coverage ratio .............................................................................................................. 3.00 10.49

AR-16
At December 31, 2006, there were no amounts outstanding under the Credit Agreement. We anticipate utilizing the Credit Agreement principally for the issuance of letters of credit, including the replacement of letters of credit issued under the replaced facilities which aggregated $171 million at December 31, 2006. The issuance of letters of credit under the Credit Agreement utilizes availability under the Credit Agreement, as was the case with the replaced facilities.
Credit ratings. Following is a summary of our senior long-term debt credit ratings by Moody’s Investor Services, Inc. (“Moody’s”), Standard & Poor’s Rating Services (“S&P”) and Fitch Ratings (“Fitch”) at February 23, 2007:
Moody’s S&P Fitch
Senior long-term debt ......................................................................................... Ba1 BBB– BBB– Outlook............................................................................................................... Positive Stable Positive
On February 8, 2007, S&P revised our rating outlook from negative to stable. On November 21, 2006, Fitch revised our rating outlook to positive from stable. On November 14, 2006, Moody’s revised our rating outlook to positive from stable. At December 31, 2006, we had no recognized or contingent material liabilities that would be subject to accelerated payment due to aratings downgrade. We do not believe a negative change in our credit rating would have a material adverse impact on us under theterms of our existing client agreements.
Liquidity. At December 31, 2006, we had total liquidity of $3.7 billion, comprised of unrestricted cash and marketable securities of $2.9 billion and availability under our unsecured credit facilities of $829 million. Management currently intends to maintain unrestricted cash and marketable securities in an amount equal to at least 12 months of forecasted capital expenditures (as defined under “Free Cash Flow” above), interest payments, debt maturities and dividend payments.
Change in dividend rate. On July 27, 2004, our Board of Directors reduced the quarterly dividend on our common stock from $0.15 to $0.05 per share.
New Accounting Pronouncements
In September 2006, the Financial Accounting Standards Board (“FASB”) issued Statement No. 157, Fair Value Measurements.This new standard defines fair value, establishes a framework for measuring fair value in generally accepted accounting principles, and expands disclosures about fair value measurements. The new standard is effective for financial statements issued for fiscalyears beginning after November 15, 2007, and interim periods within those years. The provisions of the new standard are to be applied prospectively for most financial instruments and retrospectively for others as of the beginning of the fiscal year in which the standard is initially applied. We will be required to adopt this new standard in the first quarter of 2008. We are currentlyevaluating the requirements of Statement No. 157 and have not yet determined the impact on our consolidated financial statements.
In July 2006, the FASB issued Interpretation No. (“FIN”) 48, Accounting for Uncertainty in Income Taxes – an interpretation of FASB Statement No. 109. This interpretation clarifies the accounting for uncertainty in income taxes recognized in an entity’s financial statements in accordance with SFAS No. 109, Accounting for Income Taxes. It prescribes a recognition threshold and measurement attribute for financial statement disclosure of tax positions taken or expected to be taken on a tax return. This interpretation is effective for fiscal years beginning after December 15, 2006. We will be required to adopt this interpretation in the first quarter of 2007. We are currently evaluating the requirements of FIN 48 and have not yet determined the impact on our consolidated financial statements.
We adopted SFAS No. 158 in 2006. We refer you to Note 1 in the accompanying Notes to Consolidated Financial Statements for additional information about these accounting changes.
Application of Critical Accounting Policies
The preparation of our financial statements in conformity with generally accepted accounting principles in the United States (“GAAP”) requires us to make estimates, judgments and assumptions that affect the reported amounts of assets and liabilities anddisclosure of contingent assets and liabilities at the date of the consolidated financial statements and the reported amounts ofrevenues and expenses during the reporting period. Our estimates, judgments and assumptions are continually evaluated based on available information and experience. Because of the use of estimates inherent in the financial reporting process, actual resultscould differ from those estimates. Areas in which significant judgments and estimates are used include, but are not limited to,revenue recognition, accounts receivable collectibility, accounting for long-lived assets, deferred income taxes, retirement plans, performance guarantees and litigation.
Revenue recognition and associated cost deferral. We provide IT and business process outsourcing services under time-and-material, unit-price and fixed-price contracts, which may extend up to 10 or more years. Services provided over the term of these

AR-17
arrangements may include one or more of the following: IT infrastructure support and management; IT system and software maintenance; application hosting; the design, development, or construction of software and systems (“Construct Service”); transaction processing; and business process management.
If a contract involves the provision of a single element, revenue is generally recognized when the product or service is providedand the amount earned is not contingent upon any future event. If the service is provided evenly during the contract term but service billings are irregular, revenue is recognized on a straight-line basis over the contract term. However, if the single service is a Construct Service, revenue is recognized under the percentage-of-completion method using a zero-profit methodology. Under this method, costs are deferred until contractual milestones are met, at which time the milestone billing is recognized as revenue and an amount of deferred costs is recognized as expense so that cumulative profit equals zero. If the milestone billing exceedsdeferred costs, then the excess is recorded as deferred revenue. When the Construct Service is completed and the final milestonemet, all unrecognized costs, milestone billings and profit are recognized in full. If the contract does not contain contractualmilestones, costs are expensed as incurred and revenue is recognized in an amount equal to costs incurred until completion of the Construct Service, at which time any profit would be recognized in full. If total costs are estimated to exceed revenue for theConstruct Service, then a provision for the estimated loss is made in the period in which the loss first becomes apparent.
If a contract involves the provision of multiple service elements, total estimated contract revenue is allocated to each elementbased on the relative fair value of each element. The amount of revenue allocated to each element is limited to the amount that is not contingent upon the delivery of another element in the future. Revenue is then recognized for each element as described abovefor single-element contracts, except revenue recognized on a straight-line basis for a non-Construct Service will not exceed amounts currently billable unless the excess revenue is recoverable from the client upon any contract termination event. If theamount of revenue allocated to a Construct Service is less than its relative fair value, costs to deliver such service equal to the difference between allocated revenue and the relative fair value are deferred and amortized over the contract term. If total Construct Service costs are estimated to exceed the relative fair value for the Construct Service contained in a multiple-element arrangement, then a provision for the estimated loss is made in the period in which the loss first becomes apparent.
In the rare event that fair value is not determinable for each service element of a multiple-element contract, the contract is considered one accounting unit, and revenue is recognized using the proportional performance method. Under this method, contract revenue is recognized for each service element based on the proportional performance of each service element to the total expected performance of each service element over the life of the contract.
We also defer and subsequently amortize certain set-up costs related to activities that enable the provision of contracted services to the client. Such activities include the relocation of transitioned employees, the migration of client systems or processes, and the exit of client facilities. Deferred contract costs, including set-up costs, are amortized on a straight-line basis over the remaining original contract term unless billing patterns indicate a more accelerated method is appropriate. The recoverability of deferredcontract costs associated with a particular contract is analyzed whenever events or circumstances indicate that their carrying value may not be recoverable using the undiscounted estimated cash flows of the whole contract over its remaining contract term. If such undiscounted cash flows are insufficient to recover the long-lived assets and deferred contract costs, including contract concessions paid to the client, the deferred contract costs and contract concessions are written down by the amount of the cashflow deficiency. If a cash flow deficiency remains after reducing the balance of the deferred contract costs and contract concessions to zero, any remaining long-lived assets are evaluated for impairment. Any such impairment recognized would equal the amount by which the carrying value of the long-lived assets exceeds the fair value of those assets.
Accounts receivable. Reserves for uncollectible trade receivables are established when collection of amounts due from clients is deemed improbable. Indicators of improbable collection include client bankruptcy, client litigation, industry downturns, client cash flow difficulties or ongoing service or billing disputes. Receivables more than 180 days past due are automatically reserved unlesspersuasive evidence of probable collection exists. Our allowances for doubtful accounts as a percentage of total gross trade receivables were 1.9% and 2.0% at December 31, 2006 and 2005, respectively.
Long-lived assets. Our property and equipment, software and definite-lived intangible asset policies require the amortization or depreciation of assets over their estimated useful lives. An asset’s useful life is the period over which the asset is expected to contribute directly or indirectly to our future cash flows. The useful lives of property and equipment are limited to the standarddepreciable lives or, for certain assets dedicated to client contracts, the related contract term. The useful lives of capitalized software are limited to the shorter of the license period or the related contract term. The estimated useful lives of definite-lived intangible assets are based on the expected use of the asset and factors that may limit the use of the asset. We may utilize theassistance of a third-party appraiser in the assessment of the useful life of an intangible asset.
Goodwill is not amortized, but instead tested for impairment at least annually. The goodwill impairment test requires us to identify our reporting units, obtain estimates of the fair values of those units as of the testing date and compare the estimated fair value of each unit to its carrying value. Our reporting units are identified based on a review of our internal reporting structure and are

AR-18
comprised of the components of our operating segments that share similar economic characteristics. The fair value of a reportingunit is the amount at which the unit as a whole could be bought or sold in a current transaction between willing parties. We estimate the fair values of our reporting units using discounted cash flow valuation models. Those models require estimates of future revenues, profits, capital expenditures and working capital for each unit. We estimate these amounts by evaluating historicaltrends, current budgets, operating plans and industry data. We utilize our weighted-average cost of capital to discount the estimated expected future cash flows of each unit. We conducted our annual goodwill impairment test for 2006 as of December 1, 2006. The estimated fair value of each of our reporting units exceeded its respective carrying value in 2006 indicating the underlying goodwill of each unit was not impaired.
We plan to conduct our annual impairment test as of December 1st of each year when our budgets and operating plans for the forthcoming year are expected to be finalized. The timing and frequency of additional goodwill impairment tests are based on anongoing assessment of events and circumstances that would more than likely reduce the fair value of a reporting unit below its carrying value. We will continue to monitor our goodwill balance for impairment and conduct formal tests when impairment indicators are present. A decline in the fair value of any of our reporting units below its carrying value is an indicator that the underlying goodwill of the unit is potentially impaired. This situation would require the second step of the goodwill impairmenttest to determine whether the unit’s goodwill is impaired. The second step of the goodwill impairment test is a comparison of the implied fair value of a reporting unit’s goodwill to its carrying value. An impairment loss is required for the amount which thecarrying value of a reporting unit’s goodwill exceeds its implied fair value. The implied fair value of the reporting unit’s goodwill would become the new cost basis of the unit’s goodwill.
Deferred income taxes. We must make certain estimates and judgments in determining income tax expense for financial statement purposes. These estimates and judgments occur in the calculation of certain tax assets and liabilities, which arise from differences in the timing of recognition of revenue and expense for tax and financial statement purposes. We must assess the likelihood thatwe will be able to recover our deferred tax assets. In assessing the realizability of deferred tax assets, we consider whether it is more likely than not that some portion or all of the deferred tax assets will not be realized and adjust the valuation allowances accordingly. Factors considered in making this determination include the period of expiration of the tax asset, planned use of the tax asset, tax planning strategies and historical and projected taxable income as well as tax liabilities for the tax jurisdiction in which the tax asset is located. Valuation allowances will be subject to change in each future reporting period as a result of changes in one or more of these factors. A majority of the tax assets are associated with tax jurisdictions in which we have a large scale of operations and long history of generating taxable income, thereby reducing the estimation risk associated with recoverability analysis. However, in smaller tax jurisdictions in which we have less historical experience or smaller scale of operations, theassessment of recoverability of tax assets is largely based on projections of taxable income over the expiration period of the tax asset and is subject to greater estimation risk. Accordingly, it is reasonably possible the recoverability of tax assets in these smaller jurisdictions could be impaired as a result of poor operating performance over extended periods of time or a future decision toreduce or eliminate operating activity in such jurisdictions. Such an impairment would result in an increase in our effective tax rate and related tax expense in the period of impairment.
Liabilities for tax contingencies. We have recorded liabilities for tax contingencies related to positions we have taken that could be challenged by taxing authorities. These potential exposures result from the uncertainties in application of statutes, rules, regulations and interpretations. We recognize liabilities for anticipated tax audit issues in the U.S. and other tax jurisdictions based on our estimate of whether and the extent to which additional taxes will be due. Our estimate of the ultimate tax liability contains assumptions based on past experiences, judgments about potential actions by taxing jurisdictions as well as judgments about thelikely outcome of issues that have been raised by taxing jurisdictions. Although we believe our reserves for tax contingencies are reasonable, they may change in the future due to new developments with each issue. We record an additional charge or benefit inour provision for taxes in the period in which we determine that the recorded tax liability is more or less than we expect the ultimate assessment to be.
Retirement plans. We offer pension and other postretirement benefits to our employees through multiple global pension plans. Our largest pension plans are funded through our cash contributions and earnings on plan assets. We use the actuarial models required by SFAS No. 87, Employers’ Accounting for Pensions, to account for our pension plans. Two of the most significant actuarial assumptions used to calculate the net periodic pension benefit expense and the related pension benefit obligation for our defined pension benefit plans are the expected long-term rate of return on plan assets and the discount rate assumptions.
SFAS No. 87 requires the use of an expected long-term rate of return that, over time, will approximate the actual long-term returnsearned on pension plan assets. We base this assumption on historical actual returns as well as anticipated future returns based on our investment mix. Given our relatively young workforce, we are able to take a long-term view of our pension investment strategy. Accordingly, plan assets are weighted heavily towards equity investments. Equity investments are susceptible to significant short-term fluctuations but have historically outperformed most other investment alternatives on a long-term basis. At December 31, 2006, 85% of pension assets were invested in public and private equity and real estate investments with the remaining assets being invested in fixed income securities. Such mix is consistent with that assumed in determining the expected
AR-19
long-term rate of return on plan assets. Rebalancing our actual asset allocations to our planned allocations based on actual performance has not been a significant issue.
An 8.4% and 8.6% weighted-average expected long-term rate of return on plan assets assumption was used for the pension plan actuarial valuations in 2006 and 2005, respectively. A 100 basis point increase or decrease in this assumption results in an estimated pension expense decrease or increase, respectively, of $79 million in the subsequent year’s pension expense (based onthe most recent pension valuation and assuming all other variables are constant).
An assumed discount rate is required to be used in each pension plan actuarial valuation. This rate reflects the underlying ratedetermined on the measurement date at which the pension benefits could effectively be settled. High-quality bond yields on our measurement date, October 31, 2006, with maturities consistent with expected pension payment periods are used to determine the appropriate discount rate assumption. For the countries with the largest pension plans, actual participant data is used by our actuaries to determine the maturity of the benefit obligation which is matched to bonds available at the measurement date. In other countries, we use the average age of the participants to determine the maturity of the benefit obligation. A 5.4% weighted-average discount rate assumption was used for the 2006 pension plan actuarial valuations. The methodology used to determine the appropriate discount rate assumption has been consistently applied. A 100 basis point increase in the discount rate assumption will result in an estimated decrease of approximately $121 million in the subsequent year’s pension expense, and a 100 basis point decrease in the discount rate assumption will result in an estimated increase of approximately $221 million in the subsequent year’s pension expense (based on the most recent pension valuation and assuming all other variables are constant).
Our long-standing policy of making consistent cash pension plan contributions provided some protection against negative short-term market returns. In addition, positive investment returns from 2003 to 2006 resulted in our actual pension plan asset returns exceeding expected returns reflected in our assumptions. However, the impact of contributions and positive returns has been offsetby declining discount rates in some recent years. Our pension plans’ funded status, as of October 31, 2006 reflected total planassets of $7.9 billion and total projected benefit obligations under all plans of $9.4 billion. As a result, under the requirements of SFAS No. 158, we have pension liabilities of $1.4 billion at December 31, 2006 with a corresponding reduction, net of tax, in theaccumulated other comprehensive loss component of shareholders’ equity of $684 million.
Our weighted-average long-term rate of return assumption for plan assets as of January 1, 2007 is 8.5%. Our 2007 net periodic benefit cost is expected to decrease from 2006 due to additional cash contributions made in recent years, returns on plan assets in excess of expectations and small increases in the discount rates of certain countries. Our required minimum amount of 2007 contributions will not exceed actual contributions made in 2006.
Stock-based compensation. We estimate the fair value of stock options using a Black-Scholes-Merton pricing model. The outstanding term of an option is estimated based on the vesting term and contractual term of the option, as well as expected exercise behavior of the employee who receives the option. Expected volatility during the estimated outstanding term of the option is based on historical volatility during a period equivalent to the estimated outstanding term of the option and implied volatility as determined based on observed market prices of our publicly traded options. Expected dividends during the estimated outstanding term of the option are based on recent dividend activity. Risk-free interest rates are based on the U.S. Treasury yield in effect at the time of the grant. We estimate the fair value of restricted stock units based on the market value of our stock on the date of grant, adjusted for any restrictive provisions affecting fair value, such as required holding periods after the date of vesting. Compensation expense for share-based payment is charged to operations over the vesting period of the award, and includes an estimate for thenumber of awards expected to vest. The initial estimate is based on historical results, and compensation expense is adjusted foractual results. If vesting of such an award is conditioned upon the achievement of performance goals, compensation expense during the performance period is estimated using the most probable outcome of the performance goals, and adjusted as the expected outcome changes.
Other liabilities. In the normal course of business, we may provide certain clients, principally governmental entities, with financial performance guarantees, which are generally backed by standby letters of credit or surety bonds. In general, we would only be liable for the amounts of these guarantees in the event that our nonperformance permits termination of the related contract by our client, the likelihood of which we believe is remote. We believe we are in compliance with our performance obligations under allservice contracts for which there is a performance guarantee.
There are various claims and pending actions against EDS arising in the ordinary course of our business. See Note 15 in the accompanying Notes to Consolidated Financial Statements for a discussion of certain current litigation. Certain of these actionsseek damages in significant amounts. In determining whether a loss accrual or disclosure in our consolidated financial statements is required, we consider, among other things, the degree to which we can make a reasonable estimate of the loss, the degree of probability of an unfavorable outcome, and the applicability of insurance coverage for a loss. The degree of probability and theloss related to a particular claim are typically estimated with the assistance of legal counsel.

AR-20
QUANTITATIVE AND QUALITATIVE DISCLOSURES ABOUT MARKET RISK
We are exposed to market risk from changes in interest rates and foreign currency exchange rates. We enter into various hedgingtransactions to manage this risk. We do not hold or issue derivative financial instruments for trading purposes. A discussion of our accounting policies for financial instruments, and further disclosure relating to financial instruments, are included in the notes to the consolidated financial statements.
Interest rate risk. Interest rate risk is managed through our debt portfolio of fixed- and variable-rate instruments including interest rate swaps. Risk can be estimated by measuring the impact of a near-term adverse movement of 10% in short-term market interest rates. If these rates average 10% more in 2007 than in 2006, there would be no material adverse impact on our results of operations or financial position. During 2006, had short-term market interest rates averaged 10% more than in 2005, there would have been no material adverse impact on our results of operations or financial position.
Foreign exchange risk. We conduct business in the United States and around the world. Our most significant foreign currency transaction exposures relate to Canada, Mexico, the United Kingdom, Western European countries that use the euro as a common currency, Australia, India and Switzerland. The primary purpose of our foreign currency hedging activities is to protect againstforeign currency exchange risk from intercompany financing and trading transactions. We enter into foreign currency forward contracts and may enter into currency options with durations of generally less than 30 days to hedge such transactions. We havenot entered into foreign currency forward contracts for speculative or trading purposes.
Generally, foreign currency forward contracts are not designated as hedges for accounting purposes and changes in the fair valueof these instruments are recognized immediately in earnings. In addition, since we enter into forward contracts only as an economic hedge, any change in currency rates would not result in any material gain or loss, as any gain or loss on the underlying foreign-denominated balance would be offset by the loss or gain on the forward contract. Risk can be estimated by measuring theimpact of a near-term adverse movement of 10% in foreign currency rates against the U.S. dollar. If these rates average 10% morein 2007 than in 2006, there would be no material adverse impact on our results of operations or financial position. During 2006,had foreign currency rates averaged 10% more than in 2005, there would have been no material adverse impact on our results of operations or financial position.
RISK FACTORS
Because of the followin factors, as well as other variables affecting our operating results, past financial performance may not be a reliable indicator of future performance, and historical trends should not be used to anticipate results or trends in future periods.
Our engagements with clients may not be profitable. The pricing and other terms of our client contracts, particularly our long-term IT outsourcing agreements, require us to make estimates and assumptions at the time we enter into these contracts that could differ from actual results. These estimates reflect our best judgments regarding the nature of the engagement and our expected costs toprovide the contracted services. Any increased or unexpected costs or unanticipated delays in connection with the performance ofthese engagements, including delays caused by factors outside our control, could make these contracts less profitable or unprofitable, which would have an adverse affect on our profit margin. Our exposure to this risk increases generally in proportionto the scope of the client contract and is higher in the early stages of such contract. In addition, a majority of our IT outsourcing contracts contain some fixed-price, incentive-based or other pricing terms that condition our fee on our ability to meet definedgoals. Our failure to meet a client’s expectations in any type of contract may result in an unprofitable engagement.
Our ability to recover significant capital investments in certain construct contracts is subject to risks. Some of our client contracts require significant investment, including asset purchases and operating losses, in the early stages which is recovered through billings over the life of the respective contract. These contracts often involve the construction of new computer systems and communications networks and the development and deployment of new technologies. Substantial performance risk exists in each contract with these characteristics, and some or all elements of service delivery under these contracts are dependent upon successful completion of the development, construction and deployment phases. At December 31, 2006, we had net deferred contract and set-up costs of $807 million, of which $487 million related to 20 contracts with active construct activities. Theseactive construct contracts had other assets, including receivables, prepaid expenses, equipment and software, of $574 million atDecember 31, 2006. Some of these contracts have experienced delays in their development and construction phases, and certain milestones have been missed. It is reasonably possible that deferred costs associated with one or more of these contracts couldbecome impaired due to changes in estimates of future contract cash flows.
Our exposure to certain industries and financially troubled customers may adversely affect our financial results. Our exposure to certain industries and financially troubled customers has had, and could in the future have, a material adverse affect on our
AR-21
financial position and our results of operations. For example, we are a leading provider of IT outsourcing services to the UnitedStates automobile and airline industries, which sectors have been experiencing significant financial difficulties.
A decline in revenues from or loss of significant clients could reduce our revenues and profitability. Our success is to a significant degree dependent on our ability to retain our significant clients and maintain or increase the level of revenues from these clients,including in particular revenues from certain “mega-deal” long-term IT outsourcing agreements. We may lose clients due to theirmerger or acquisition, business failure, contract expiration or their conversion to a competing service provider or decision to in-source services. We may not be able to retain or renew relationships with our significant clients in the future. As a result ofbusiness downturns or for other business reasons, we are also vulnerable to reduced processing volumes from our clients, which can reduce the scope of services provided and the prices for those services. We may not be able to replace the revenue and earnings from any such lost client or reduction in services in the short or long-term. In addition, our contracts may allow a client to terminate the contract for convenience. In these cases we seek, through the terms of the contract, to recover our investment in the contract. There is no assurance we will be able to fully recover our investments in such circumstances.
Impact of rating agency downgrades. Any adverse action by Moody’s, S&P or Fitch with respect to our long-term credit ratings could materially adversely impact our ability to compete for new business, our cost of capital and our ability to access capital.
Some of our contracts contain benchmarking provisions that could decrease our revenues and profitability. Some of our IT outsourcing agreements contain pricing provisions that permit a client to request a benchmark study by a mutually acceptable third-party benchmarker. Typically, benchmarking may not be conducted during the initial years of the contract term but may be requested by a client periodically thereafter, subject to restrictions which limit benchmarking to certain groupings of services and limit the number of times benchmarking may be conducted during the term of the contract. Generally, the benchmarking compares the contractual price of our services against the price of similar services offered by other specified providers in a peer comparison group, subject to agreed upon adjustment and normalization factors. Generally, if the benchmarking study shows that our pricinghas a difference outside a specified range, and the difference is not due to the unique requirements of the client, then the partieswill negotiate in good faith any appropriate adjustments to the pricing. This may result in the reduction of our rates for the benchmarked services. Due to the enhanced focus of our clients on reducing their technology costs, as well as the uncertainties and complexities inherent in benchmarking comparisons, our clients may increasingly attempt to obtain additional price reductions beyond those already embedded in our contract rates through the exercise of benchmarking provisions. Also, if we can not agree with our client on post-benchmarking pricing adjustments, the contract may permit the client to exercise an early termination right, which may or may not involve payment of a termination fee. Such activities could negatively impact our results of operations orcash flow in 2007 or thereafter to a greater extent than has been our prior experience.
Pending litigation could have a material adverse affect on our liquidity and financial condition. We are defendants in various claims and pending actions arising in the ordinary course of business or otherwise. We refer you to the discussion of “Pending Litigation and Proceedings” under Note 15 of the notes to the accompanying consolidated financial statements for a description ofcertain of these matters. We are not able to predict the ultimate impact of these matters on us or our consolidated financial statements. However, we may be required to pay judgments or settlements and incur expenses in aggregate amounts that could have a material adverse affect on our liquidity and earnings.
The markets in which we operate are highly competitive, and we may not be able to compete effectively. The markets in which we operate include a large number of participants and are highly competitive. Our primary competitors are IT service providers, large accounting, consulting and other professional service firms, application service providers, telecommunications companies, packaged software vendors and resellers and service groups of computer equipment companies. We also experience competition from numerous smaller, niche-oriented and regionalized service providers. Our business is experiencing rapid changes in its competitive landscape. We increasingly see our competitors moving operations offshore to reduce their costs as well as increasing direct competition from niche offshore providers, primarily India-based competitors. The competition from India-based companiesis growing in intensity due to the abundance of highly skilled workers in the country, a pro-business regulatory environment andsignificantly lower costs of labor, which may allow these competitors to offer lower prices than we are able to offer. Any of these factors may impose additional pricing pressure on us, which could have an adverse affect on our revenues and profit margin.
Market changes may result in decreased profitability. The IT outsourcing market is commoditizing, which is shrinking margins on many of our core offerings. In addition, that market has experienced slower growth and lower margins in recent years. We are continuing to invest in new service offerings in the higher-margin segments such as BPO and applications development. However, if we are unable to implement our strategies to more effectively compete in such markets, our margins and profitability could beadversely affected.

AR-22
We may not achieve the benefits we expect from our multi-year plan. We have implemented a multi-year plan designed to make significant changes in the way we do business. This plan includes the development of a new technology platform for the deliveryof our services which we refer to as the “Agile Enterprise” as well as other initiatives intended to substantially reduce our cost structure. We have invested significant capital in the implementation of the multi-year plan and will invest additional capital in 2007. Although we believe this plan will enable us to achieve sustainable, profitable growth over the longer term, there can be no assurance as to the acceptance of our technology initiatives in the marketplace or our ability to recognize a return on our investment. Our ability to achieve the anticipated cost savings and other benefits from these initiatives on a timely basis is subjectto many estimates and assumptions, including assumptions regarding the costs and timing of activities in connection with these initiatives. These estimates and assumptions are subject to significant economic, competitive and other uncertainties some of which are beyond our control. In addition, service pricing contained in certain of our contracts, including our contracts with GM and the U.K. Government’s Department of Works and Pension, assume successful completion of our EDS Agile Enterprise initiatives on a timely basis. If these assumptions are not realized and we experience delays beyond those already experienced withrespect to certain segments of these initiatives, or if other unforeseen events occur, our business and results of operations could be adversely affected and there could be a material adverse affect on the price of our securities.
Unanticipated changes in our tax provisions or exposure to additional tax liabilities could affect our profitability. We are subject to income taxes in the United States and numerous foreign jurisdictions. We are subject to ongoing tax audits in various jurisdictions. Tax authorities may disagree with our intercompany charges or other matters and assess additional taxes. Our provision for income taxes and cash tax liability in the future could be adversely affected by numerous factors including, but not limited to, income before taxes being lower than anticipated in countries with accumulated tax losses and higher than anticipated in countries with higher statutory tax rates, changes in the valuation of deferred tax assets and liabilities, changes in tax laws,regulations, accounting principles or interpretations thereof, and the discovery of new information in the course of our tax return preparation process, which could adversely impact our results of operations and financial condition in future periods. In particular,the carrying value of deferred tax assets is dependent on our ability to generate future taxable income over the expiration period of the tax asset. An impairment of deferred tax assets would result in an increase in our effective tax rate and related tax expense in the period of impairment and could affect our profitability.
Risks associated with our international operations could negatively affect our earnings. International operations accounted for approximately one-half of our revenues in 2006 and will continue to represent a significant opportunity for growth in the IT industry. Our results of operations are affected by our ability to manage risks inherent in doing business abroad. These risks include exchange rate fluctuation, regulatory concerns, terrorist activity, restrictions with respect to the movement of currency,access to highly skilled workers, political and economic instability and our ability to protect our intellectual property. Any of these risks could impede our ability to increase our presence in certain jurisdictions or enter new jurisdictions. In addition, these risks could result in increased costs which could materially adversely affect our results of operations.
In June 2006, we acquired a majority interest (approximately 51%) in MphasiS Limited (“MphasiS”), a publicly traded applications and business process outsourcing services company based in Bangalore, India. In connection with this investment, we are exposed to additional international risks, including being subject to Indian securities laws and regulations. If we fail to comply with the requirements of the Stock Exchange Board of India, the stock exchanges upon which MphasiS is listed or any of the otherapplicable Indian regulatory authorities, our investment in MphasiS could be materially adversely affected, and such violation could result in significant legal consequences to us.
Our services or products may infringe upon the intellectual property rights of others. We cannot be sure that our services and products, or the products of others that we offer to our clients, do not infringe on the intellectual property rights of third parties, and we may have infringement claims asserted against us. These claims may harm our reputation, cost us money and prevent us from offering some services or products. We generally agree in our contracts to indemnify our clients for any expenses or liabilities they may incur resulting from claimed infringements of the intellectual property rights of third parties. In some instances, the amount of these indemnities may be greater than the revenues we receive from the client. Any claims or litigation in this area,whether we ultimately win or lose, could be time-consuming and costly, injure our reputation or require us to enter into royalty or licensing arrangements. We may, in limited cases, be required to forego rights to the use of intellectual property we help create,which limits our ability to also provide that intellectual property to other clients. Any limitation on our ability to provide a service or product could cause us to lose revenue-generating opportunities and require us to incur additional expenses to develop new ormodified solutions for future projects.
A material weakness in our internal controls could have a material adverse affect on us. Effective internal controls are necessary for us to provide reasonable assurance with respect to our financial reports and to effectively prevent fraud. If we cannot provide reasonable assurance with respect to our financial reports and effectively prevent fraud, our reputation and operating results could be harmed. Pursuant to the Sarbanes-Oxley Act of 2002, we are required to furnish a report by management on internal control over financial reporting, including management’s assessment of the effectiveness of such control. Internal control over financial

AR-23
reporting may not prevent or detect misstatements because of its inherent limitations, including the possibility of human error, the circumvention or overriding of controls, or fraud. Therefore, even effective internal controls can provide only reasonable assurance with respect to the preparation and fair presentation of financial statements. In addition, projections of any evaluation of effectiveness of internal control over financial reporting to future periods are subject to the risk that the control may becomeinadequate because of changes in conditions, or that the degree of compliance with the policies or procedures may deteriorate. If we fail to maintain the adequacy of our internal controls, including any failure to implement required new or improved controls, or if we experience difficulties in their implementation, our business and operating results could be adversely impacted, we could fail to meet our reporting obligations, and our business and stock price could be adversely affected.
In connection with our efforts to improve the processing efficiency of our general accounting functions, we implemented the SAPaccounting system in the United States effective as of January 1, 2007, requiring changes in the processing of general ledger transactions, including journal entries, as of that date. We expect this implementation to be complete during the first quarter of 2007. With limited exceptions, our other accounting operations had already been using this system. We expect to implement otherSAP systems in the United States, including for procurement, accounts payable and asset management, in the future. In addition,commencing in the first quarter of 2007, we will transition certain transaction and journal entry processing and preparation ofgeneral ledger account reconciliations from the existing accounting workforce to a newly hired workforce in lower cost Best ShoreSM locations. We expect these actions will improve our internal controls over financial reporting by enabling us to conform general ledger processing to a single, global standard and operate a more centralized accounting function. We have taken steps to mitigate the control risks created by these actions, including establishment of monitoring controls and workforce management andtraining programs. However, if we are unable to timely and effectively complete these actions, our ability to maintain adequateinternal control over financial reporting could be adversely impacted, we could fail to meet our reporting obligations, and ourbusiness and stock price could be adversely affected.
Cautionary Statement Regarding Forward-Looking Statements
The statements in this Report that are not historical statements are “forward-looking statements” within the meaning of the Private Securities Litigation Reform Act of 1995. These forward-looking statements include statements regarding estimated revenues, earnings, free cash flow, total contract value (“TCV”) of new contract signings, operating margins and other forward-looking financial information. In addition, we have made in the past and may make in the future other written or oral forward-looking statements, including statements regarding future financial and operating performance, short- and long-term revenue, future costsavings, earnings and free cash flow, the timing of the revenue, earnings and free cash flow impact of new and existing contracts,liquidity, estimated future revenues from existing clients, the TCV of new contract signings, business pipeline, industry growthrates and our performance relative thereto, the impact of acquisitions and divestitures, and the impact of client bankruptcies. Any forward-looking statement may rely on a number of assumptions concerning future events and be subject to a number of uncertainties and other factors, many of which are outside our control, that could cause actual results to differ materially from such statements. In addition to the factors outlined above, these factors include, but are not limited to, the following: the performance of current and future client contracts in accordance with our cost, revenue and cash flow estimates, including our ability to achieve any operational efficiencies in our estimates; for contracts with U.S. federal government clients, including our NMCI contract, the government’s ability to cancel the contract or impose additional terms and conditions due to changes in government funding, deployment schedules, military action or otherwise; our ability to access the capital markets, including our ability to obtain capital leases, surety bonds and letters of credit; the impact of third-party benchmarking provisions in certain client contracts; the impact on a historical and prospective basis of accounting rules and pronouncements; the impact of claims, litigation and governmentalinvestigations; the success of our multi-year plan and cost-cutting initiatives and the timing and amount of any resulting benefits; the impact of acquisitions and divestitures; a reduction in the carrying value of our assets; the impact of a bankruptcy or financial difficulty of a significant client on the financial and other terms of our agreements with that client; with respect to the funding of pension plan obligations, the performance of our investments relative to our assumed rate of return; changes in tax laws and interpretations and failure to obtain treaty relief from double taxation; failure to obtain or protect intellectual property rights; fluctuations in foreign currency, exchange rates and interest rates; the impact of competition on pricing, revenues and margins; and the degree to which third parties continue to outsource IT and business processes.
We disclaim any intention or obligation to update or revise any forward-looking statements whether as a result of new information, future events or otherwise, except as may be required by law.

AR-24
FINANCIAL STATEMENTS AND SUPPLEMENTARY DATA
MANAGEMENT REPORT
MANAGEMENT RESPONSIBILITY FOR FINANCIAL INFORMATION
Responsibility for the objectivity, integrity, and presentation of the accompanying financial statements and other financial information presented in this report rests with EDS management. The accompanying financial statements have been prepared in accordance with accounting principles generally accepted in the United States. The financial statements include amounts that arebased on estimates and judgments which management believes are reasonable under the circumstances.
KPMG LLP, independent auditors, is retained to audit EDS’ consolidated financial statements and management’s assessment of the effectiveness of the company’s internal control over financial reporting. Its accompanying report is based on audits conducted in accordance with the standards of the Public Company Accounting Oversight Board (United States).
The Audit Committee of the Board of Directors is composed solely of independent, non-employee directors, and is responsible forrecommending to the Board the independent auditing firm to be retained for the coming year. The Audit Committee meets regularly and privately with the independent auditors, with the company’s internal auditors, and with management to review accounting, auditing, internal control and financial reporting matters.
MANAGEMENT’S REPORT ON INTERNAL CONTROL OVER FINANCIAL REPORTING
Management of EDS is responsible for establishing and maintaining adequate internal control over financial reporting as definedin Rule 13a-15(f) or 15d-15(f) promulgated under the Securities Exchange Act of 1934. Those rules define internal control over financial reporting as a process designed to provide reasonable assurance regarding the reliability of financial reporting and the preparation of financial statements for external purposes in accordance with accounting principles generally accepted in the United States of America. EDS’ internal control over financial reporting includes those policies and procedures that:
pertain to the maintenance of records that, in reasonable detail, accurately and fairly reflect the transactions and dispositions of the assets of EDS; provide reasonable assurance that transactions are recorded as necessary to permit preparation of financial statements in accordance with accounting principles generally accepted in the United States of America; provide reasonable assurance that receipts and expenditures of EDS are being made only in accordance with authorization of management and directors of EDS; and provide reasonable assurance regarding prevention or timely detection of unauthorized acquisition, use or disposition of EDS’ assets that could have a material effect on the consolidated financial statements.
Because of its inherent limitations, internal control over financial reporting may not prevent or detect misstatements. Also, projections of any evaluation of effectiveness to future periods are subject to the risk that controls may become inadequate because of changes in conditions, or that the degree of compliance with the policies or procedures may deteriorate. EDS management assessed the effectiveness of EDS’ internal control over financial reporting as of December 31, 2006. In making this assessment, management used the criteria described in “Internal Control – Integrated Framework” issued by the Committee of Sponsoring Organizations of the Treadway Commission. Management’s assessment included an evaluation of the design of EDS’ internal control over financial reporting and testing of the operational effectiveness of its internal control over financial reporting. Management reviewed the results of its assessment with the Audit Committee of our Board of Directors.
Based on this assessment and those criteria, management believes that EDS maintained, in all material respects, effective internal control over financial reporting as of December 31, 2006.
KPMG LLP, independent registered public accounting firm, who audited and reported on EDS’ consolidated financial statements included in this report, has issued an attestation report on management’s assessment of internal control over financial reporting.
Michael H. Jordan CHAIRMAN OF THE BOARD AND CHIEF EXECUTIVE OFFICER March 1, 2007
Ronald P. Vargo EXECUTIVE VICE PRESIDENT AND CHIEF FINANCIAL OFFICER March 1, 2007

AR-25
REPORT OF INDEPENDENT REGISTERED PUBLIC ACCOUNTING FIRM
The Board of Directors Electronic Data Systems Corporation:
We have audited management’s assessment, included in the accompanying Management’s Report on Internal Control Over Financial Reporting, that Electronic Data Systems Corporation and subsidiaries (the “Company”) maintained effective internal control over financial reporting as of December 31, 2006, based on criteria established in Internal Control – Integrated Frameworkissued by the Committee of Sponsoring Organizations of the Treadway Commission (“COSO”). The Company’s management is responsible for maintaining effective internal control over financial reporting and for its assessment of the effectiveness of internal control over financial reporting. Our responsibility is to express an opinion on management’s assessment and an opinion on the effectiveness of the Company’s internal control over financial reporting based on our audit.
We conducted our audit in accordance with the standards of the Public Company Accounting Oversight Board (United States). Those standards require that we plan and perform the audit to obtain reasonable assurance about whether effective internal control over financial reporting was maintained in all material respects. Our audit included obtaining an understanding of internal control over financial reporting, evaluating management’s assessment, testing and evaluating the design and operating effectiveness of internal control, and performing such other procedures as we considered necessary in the circumstances. We believe that our auditprovides a reasonable basis for our opinion.
A company’s internal control over financial reporting is a process designed to provide reasonable assurance regarding the reliability of financial reporting and the preparation of financial statements for external purposes in accordance with generally accepted accounting principles. A company’s internal control over financial reporting includes those policies and procedures that(1) pertain to the maintenance of records that, in reasonable detail, accurately and fairly reflect the transactions and dispositions of the assets of the company; (2) provide reasonable assurance that transactions are recorded as necessary to permit preparation offinancial statements in accordance with generally accepted accounting principles, and that receipts and expenditures of the company are being made only in accordance with authorizations of management and directors of the company; and (3) provide reasonable assurance regarding prevention or timely detection of unauthorized acquisition, use, or disposition of the company’sassets that could have a material effect on the financial statements.
Because of its inherent limitations, internal control over financial reporting may not prevent or detect misstatements. Also, projections of any evaluation of effectiveness to future periods are subject to the risk that controls may become inadequate because of changes in conditions, or that the degree of compliance with the policies or procedures may deteriorate.
In our opinion, management’s assessment that the Company maintained effective internal control over financial reporting as of December 31, 2006, is fairly stated, in all material respects, based on criteria established in Internal Control – Integrated Framework issued by COSO. Also, in our opinion, the Company maintained, in all material respects, effective internal control over financial reporting as of December 31, 2006, based on criteria established in Internal Control – Integrated Framework issued by COSO.
We also have audited, in accordance with the standards of the Public Company Accounting Oversight Board (United States), the consolidated balance sheets of Electronic Data Systems Corporation and subsidiaries as of December 31, 2006 and 2005, and the related consolidated statements of operations, shareholders’ equity and comprehensive income (loss), and cash flows for each ofthe years in the three-year period ended December 31, 2006, and the related financial statement schedule, and our report dated March 1, 2007 expressed an unqualified opinion on those consolidated financial statements and schedule.
KPMG LLP Dallas, Texas March 1, 2007

AR-26
REPORT OF INDEPENDENT REGISTERED PUBLIC ACCOUNTING FIRM
The Board of Directors Electronic Data Systems Corporation:
We have audited the accompanying consolidated balance sheets of Electronic Data Systems Corporation and subsidiaries as of December 31, 2006 and 2005, and the related consolidated statements of operations, shareholders’ equity and comprehensive income (loss), and cash flows for each of the years in the three-year period ended December 31, 2006. In connection with our audits of the consolidated financial statements, we have also audited the related financial statement schedule. These consolidated financial statements and financial statement schedule are the responsibility of the Company’s management. Our responsibility is to express an opinion on these consolidated financial statements based on our audits.
We conducted our audits in accordance with the standards of the Public Company Accounting Oversight Board (United States). Those standards require that we plan and perform the audit to obtain reasonable assurance about whether the financial statementsare free of material misstatement. An audit includes examining, on a test basis, evidence supporting the amounts and disclosures in the financial statements. An audit also includes assessing the accounting principles used and significant estimates made by management, as well as evaluating the overall financial statement presentation. We believe that our audits provide a reasonablebasis for our opinion.
In our opinion, the consolidated financial statements referred to above present fairly, in all material respects, the financial position of Electronic Data Systems Corporation and subsidiaries as of December 31, 2006 and 2005, and the results of their operations and their cash flows for each of the years in the three-year period ended December 31, 2006, in conformity with U.S. generally accepted accounting principles. Also in our opinion, the related financial statement schedule, when considered in relation to thebasic consolidated financial statements taken as a whole, presents fairly, in all material respects, the information set forth therein.
As discussed in Note 1 to the consolidated financial statements, during 2006, the Company adopted Statement of Financial Accounting Standards (“SFAS”) No. 158, Employers’ Accounting for Defined Benefit Pension and Other Postretirement Plans – An Amendment of FASB Statements No. 87, 88, 106, and 132R, and during 2005, the Company adopted SFAS No. 123R, Share-Based Payment.
We also have audited, in accordance with the standards of the Public Company Accounting Oversight Board (United States), the effectiveness of Electronic Data Systems Corporation and subsidiaries’ internal control over financial reporting as of December31, 2006, based on criteria established in Internal Control – Integrated Framework issued by the Committee of Sponsoring Organizations of the Treadway Commission (COSO), and our report dated March 1, 2007 expressed an unqualified opinion on management’s assessment of, and the effective operation of, internal control over financial reporting.
KPMG LLP Dallas, Texas March 1, 2007

AR-27
ELECTRONIC DATA SYSTEMS CORPORATION AND SUBSIDIARIES
CONSOLIDATED STATEMENTS OF OPERATIONS
(in millions, except per share amounts)
Years Ended December 31,
2006 2005 2004
Revenues........................................................................................................................... $ 21,268 $ 19,757 $ 19,863
Costs and expenses
Cost of revenues ........................................................................................................ 18,579 17,422 18,224 Selling, general and administrative............................................................................ 1,858 1,819 1,571 Other operating (income) expense ............................................................................. 15 (26) 170
Total costs and expenses..................................................................................... 20,452 19,215 19,965
Operating income (loss)...................................................................................... 816 542 (102)
Interest expense................................................................................................................. (239) (241) (321) Interest income and other, net ........................................................................................... 179 138 49
Other income (expense)...................................................................................... (60) (103) (272)
Income (loss) from continuing operations before income taxes ......................... 756 439 (374)
Provision (benefit) for income taxes................................................................................. 257 153 (103) Income (loss) from continuing operations .......................................................... 499 286 (271)
Income (loss) from discontinued operations, net of income taxes .................................... (29) (136) 429 Net income.......................................................................................................... $ 470 $ 150 $ 158
Basic earnings per share of common stock
Income (loss) from continuing operations .......................................................... $ 0.96 $ 0.55 $ (0.54) Income (loss) from discontinued operations....................................................... (0.05) (0.26) 0.86 Net income.......................................................................................................... $ 0.91 $ 0.29 $ 0.32
Diluted earnings per share of common stock
Income (loss) from continuing operations .......................................................... $ 0.94 $ 0.54 $ (0.54) Income (loss) from discontinued operations....................................................... (0.05) (0.26) 0.86 Net income.......................................................................................................... $ 0.89 $ 0.28 $ 0.32
See accompanying notes to consolidated financial statements.
As discussed in Note 1, the Company adopted SFAS No. 123R as of January 1, 2005 resulting in a change in the Company’s method of recognizing stock-based compensation to employees.

AR-28
ELECTRONIC DATA SYSTEMS CORPORATION AND SUBSIDIARIES
CONSOLIDATED BALANCE SHEETS
(in millions, except share and per share amounts)
December 31,
2006 2005
ASSETS Current assets
Cash and cash equivalents................................................................................................................... $ 2,972 $ 1,899 Marketable securities........................................................................................................................... 45 1,321 Accounts receivable, net...................................................................................................................... 3,647 3,311 Prepaids and other ............................................................................................................................... 866 848 Deferred income taxes......................................................................................................................... 727 778 Assets held for sale.............................................................................................................................. – 345
Total current assets .......................................................................................................................... 8,257 8,502
Property and equipment, net ................................................................................................................... 2,179 1,967 Deferred contract costs, net..................................................................................................................... 807 638 Investments and other assets ................................................................................................................... 636 684 Goodwill ................................................................................................................................................. 4,365 3,832 Other intangible assets, net ..................................................................................................................... 749 640 Deferred income taxes ............................................................................................................................ 961 824
Total assets................................................................................................................................... $ 17,954 $ 17,087
LIABILITIES AND SHAREHOLDERS’ EQUITY Current liabilities
Accounts payable ................................................................................................................................ $ 677 $ 492 Accrued liabilities ............................................................................................................................... 2,689 2,430 Deferred revenue ................................................................................................................................. 1,669 1,329 Income taxes........................................................................................................................................ 72 208 Current portion of long-term debt ....................................................................................................... 127 314 Liabilities held for sale ........................................................................................................................ – 275
Total current liabilities..................................................................................................................... 5,234 5,048
Pension benefit liability .......................................................................................................................... 1,404 1,173 Long-term debt, less current portion....................................................................................................... 2,965 2,939 Minority interests and other long-term liabilities.................................................................................... 455 415 Commitments and contingencies Shareholders’ equity
Preferred stock, $.01 par value; authorized 200,000,000 shares; none issued..................................... – – Common stock, $.01 par value; authorized 2,000,000,000 shares; 531,975,655 and 526,199,617
shares issued at December 31, 2006 and 2005, respectively ........................................................... 5 5 Additional paid-in capital .................................................................................................................... 2,973 2,682 Retained earnings ................................................................................................................................ 5,630 5,371 Accumulated other comprehensive loss .............................................................................................. (182) (367) Treasury stock, at cost, 17,658,428 and 2,913,605 shares at December 31, 2006 and 2005,
respectively...................................................................................................................................... (530) (179) Total shareholders’ equity ............................................................................................................... 7,896 7,512
Total liabilities and shareholders’ equity ..................................................................................... $ 17,954 $ 17,087
See accompanying notes to consolidated financial statements.

AR-29
ELECTRONIC DATA SYSTEMS CORPORATION AND SUBSIDIARIES
CONSOLIDATED STATEMENTS OF SHAREHOLDERS’ EQUITY AND COMPREHENSIVE INCOME (LOSS)
(in millions)
Accumu-
lated
Other
Common Stock Additional Compre- Treasury Stock Share-
Shares Paid-In Retained hensive Shares holders’
Issued Amount Capital Earnings Loss Held Amount Equity
Balance at December 31, 2003 .......... 496 $ 5 $ 917 $ 5,812 $ (131) 15 $ (889) $ 5,714
Comprehensive income: Net income................................. – – – 158 – – – 158 Currency translation
adjustment, net of tax effect of $75..................................... – – – – 256 – – 256
Unrealized losses on securities, net of tax effect of $(3), and reclassification adjustment..... – – – – (5) – – (5)
Change in minimum pension liability, net of tax effect of $(83) ...................................... – – – – (179) – – (179)
Total comprehensive income ..... 230 Dividends....................................... – – – (200) – – – (200) Issuance of common stock............. 27 – 1,601 – – – – 1,601 Stock award transactions ............... – – (85) (278) – (8) 458 95
Balance at December 31, 2004 .......... 523 $ 5 $ 2,433 $ 5,492 $ (59) 7 $ (431) $ 7,440 Comprehensive loss:
Net income................................. – – – 150 – – – 150 Currency translation
adjustment, net of tax effect of $(75) .................................. –
– – – (293) – – (293) Unrealized losses on securities,
net of tax effect of $(3), and reclassification adjustment..... – – – – (1) – – (1)
Change in minimum pension liability, net of tax effect of $(7) ........................................ –
– – – (14) – – (14) Total comprehensive loss .......... (158)
Dividends....................................... – – – (105) – – – (105) Stock award transactions ............... 3 – 249 (166) – (4) 252 335
Balance at December 31, 2005 .......... 526 $ 5 $ 2,682 $ 5,371 $ (367) 3 $ (179) $ 7,512 Comprehensive income:
Net income................................. – – – 470 – – – 470 Currency translation
adjustment, net of tax effect of $70..................................... –
– – – 313 – – 313 Unrealized losses on securities,
net of tax effect of $4, and reclassification adjustment..... – – – – 4 – – 4
Change in minimum pension liability, net of tax effect of $229 ....................................... –
– – – 434 – – 434 Total comprehensive income ..... 1,221
Adjustment to initially apply FASB Statement No. 158, net of tax effect of $(255) .................... – – – – (566) – – (566)
Dividends....................................... – – – (104) – – – (104) Purchase of treasury shares............ – – – – – 26 (683) (683) Stock award transactions ............... 6 – 291 (107) – (11) 332 516
Balance at December 31, 2006 .......... 532 $ 5 $ 2,973 $ 5,630 $ (182) 18 $ (530) $ 7,896 See accompanying notes to consolidated financial statements.

AR-30
ELECTRONIC DATA SYSTEMS CORPORATION AND SUBSIDIARIES
CONSOLIDATED STATEMENTS OF CASH FLOWS
(in millions)
Years Ended December 31,
2006 2005 2004
Cash Flows from Operating Activities Net income................................................................................................................. $ 470 $ 150 $ 158 Adjustments to reconcile net income to net cash provided by operating activities:
Depreciation and amortization and deferred cost charges...................................... 1,337 1,384 1,896 Deferred compensation .......................................................................................... 209 224 42 Other long-lived asset write-downs........................................................................ 19 164 537 Other (including pre-tax gain on sale of business of $844 in 2004)....................... 15 80 (781) Changes in operating assets and liabilities, net of effects of acquired companies:
Accounts receivable............................................................................................ 51 (310) 97 Prepaids and other .............................................................................................. (155) 20 153 Deferred contract costs ....................................................................................... (285) (161) (126) Accounts payable and accrued liabilities............................................................ 312 (207) (466) Deferred revenue ................................................................................................ 194 299 (51) Income taxes....................................................................................................... (234) (347) (181)
Total adjustments ........................................................................................ 1,463 1,146 1,120 Net cash provided by operating activities .................................................................. 1,933 1,296 1,278
Cash Flows from Investing Activities
Proceeds from sales of marketable securities ............................................................ 2,793 1,434 956 Proceeds from investments and other assets .............................................................. 264 310 68 Net proceeds (payments) from divested assets and non-marketable equity
securities................................................................................................................. (49) 160 2,129 Net proceeds from real estate sales............................................................................ 49 178 – Payments for purchases of property and equipment .................................................. (729) (718) (666) Payments for investments and other assets ................................................................ (94) (27) (556) Payments for acquisitions, net of cash acquired, and non-marketable equity
securities................................................................................................................. (361) (552) (78) Payments for purchases of software and other intangibles ........................................ (427) (300) (302) Payments for purchases of marketable securities ...................................................... (1,514) (1,311) (2,337) Other .......................................................................................................................... 35 29 28 Net cash used in investing activities .......................................................................... (33) (797) (758)
Cash Flows from Financing Activities
Proceeds from long-term debt.................................................................................... – 5 6 Payments on long-term debt ...................................................................................... (213) (560) (561) Capital lease payments............................................................................................... (144) (149) (167) Proceeds from issuance of common stock ................................................................. – – 198 Purchase of treasury stock ......................................................................................... (667) – – Employee stock transactions...................................................................................... 285 107 76 Dividends paid ........................................................................................................... (104) (105) (200) Other .......................................................................................................................... 9 21 (15) Net cash used in financing activities.......................................................................... (834) (681) (663)
Effect of exchange rate changes on cash and cash equivalents......................................... 7 (21) 48 Net increase (decrease) in cash and cash equivalents ....................................................... 1,073 (203) (95) Cash and cash equivalents at beginning of year................................................................ 1,899 2,102 2,197 Cash and cash equivalents at end of year.......................................................................... $ 2,972 $ 1,899 $ 2,102
See accompanying notes to consolidated financial statements.

AR-31
NOTES TO CONSOLIDATED FINANCIAL STATEMENTS
NOTE 1: SUMMARY OF SIGNIFICANT ACCOUNTING POLICIES
Description of Business
Electronic Data Systems Corporation is a professional services firm that offers its clients a portfolio of related services worldwide within the broad categories of infrastructure, applications and business process outsourcing services. The Company also providedmanagement consulting services through its A.T. Kearney subsidiary which was sold in January 2006 (see Note 17). Services include the design, construction or management of computer networks, information systems, information processing facilities andbusiness processes. As used herein, the terms “EDS” and the “Company” refer to Electronic Data Systems Corporation and its consolidated subsidiaries.
Principles of Consolidation
The consolidated financial statements include the accounts of EDS and its controlled subsidiaries. The Company defines control asa non-shared, non-temporary ability to make decisions that enable it to guide the ongoing activities of a subsidiary and the ability to use that power to increase the benefits or limit the losses from the activities of that subsidiary. Subsidiaries in which other shareholders effectively participate in significant operating decisions through voting or contractual rights are not consideredcontrolled subsidiaries. The Company’s investments in entities it does not control, but in which it has the ability to exercisesignificant influence over operating and financial policies, are accounted for under the equity method. Under such method, the Company recognizes its share of the subsidiaries’ income (loss) in other income (expense). If the Company is the primary beneficiary of variable interest entities, the consolidated financial statements include the accounts of such entities. No variableinterest entities were consolidated during the periods presented.
Earnings Per Share
Basic earnings per share of common stock is computed using the weighted-average number of common shares outstanding during the period. Diluted earnings per share amounts reflect the incremental increase in common shares outstanding assuming the exercise of all employee stock options and stock purchase contracts and the issuance of shares in respect of restricted stock units that would have had a dilutive effect on earnings per share. Diluted earnings per share also assumes that any dilutive convertible debt outstanding was converted at the later of the date of issuance or the beginning of the period, with related interest and outstanding common shares adjusted accordingly. Following is a reconciliation of the number of shares used in the calculation ofbasic and diluted earnings per share for the years ended December 31, 2006, 2005 and 2004 (in millions):
2006 2005 2004
Basic earnings per share of common stock: Weighted-average common shares outstanding .......................................... 519 519 501
Effect of dilutive securities (Note 11): Restricted stock units................................................................................... 2 2 – Stock options ............................................................................................... 8 5 –
Diluted earnings per share of common stock: Weighted-average common and common equivalent shares outstanding ... 529 526 501
All common stock options, restricted stock units, the assumed conversion of convertible debt and the effect of forward purchasecontracts were excluded from the computation of diluted earnings per share for 2004 because their inclusion would have been antidilutive.
Securities that were outstanding but were not included in the computation of diluted earnings per share because their effect wasantidilutive are as follows for the years ended December 31, 2006, 2005 and 2004 (in millions):
2006 2005 2004
Common stock options and warrants.................................................................. 15 42 75 Restricted stock units.......................................................................................... – – 7 Convertible debt and forward purchase contracts............................................... 20 20 28

AR-32
Accounting Changes
The Company adopted Statement of Financial Accounting Standards (“SFAS”) No. 158, Employers’ Accounting for Defined Benefit Pension and Other Postretirement Plans – An Amendment of FASB Statements No. 87, 88, 106, and 132R, effective December 31, 2006. This Statement requires recognition of the funded status of a defined benefit plan in the statement of financialposition as an asset or liability if the plan is overfunded or underfunded, respectively. Changes in the funded status of a plan are required to be recognized in the year in which the changes occur, and reported in comprehensive income as a separate component of stockholders’ equity. Further, certain gains and losses that were not previously recognized in the financial statements are required to be reported in comprehensive income, and certain disclosure requirements were changed. These changes are effective for fiscal years ending after December 15, 2006, with no retroactive restatement of prior periods. SFAS No. 158 also requires companies to measure a plan’s assets and obligations that determine its funded status as of the end of the employer’s fiscal yearinstead of the October 31 early measurement date the Company currently uses. This change is effective for fiscal years ending after December 15, 2008. The Company has not yet determined the impact of this change. Adoption of this standard did not impactthe Company’s compliance with financial debt covenants.
Following is the incremental impact of applying SFAS No. 158 on individual line items in the consolidated balance sheet at December 31, 2006 (in millions):
Before
Application of
SFAS 158 Adjustments
After
Application of
SFAS 158
Investments and other assets...................................................................... $ 872 $ (236) $ 636 Deferred income taxes ............................................................................... 706 255 961 Total assets ................................................................................................ 17,935 19 17,954 Accrued liabilities...................................................................................... 2,653 36 2,689 Total current liabilities............................................................................... 5,198 36 5,234 Pension benefit liability ............................................................................. 855 549 1,404 Accumulated other comprehensive income (loss) ..................................... 384 (566) (182) Total shareholders’ equity ......................................................................... 8,462 (566) 7,896 Total liabilities and shareholders’ equity................................................... 17,935 19 17,954
The Company adopted SFAS No. 123R, Share-Based Payment, as of January 1, 2005, using the modified prospective application method. This statement requires the recognition of compensation expense when an entity obtains employee services in stock-basedpayment transactions. This change in accounting resulted in the recognition of compensation expense of $123 million ($83 millionnet of tax) and $160 million ($110 million net of tax), respectively, for the years ended December 31, 2006 and 2005. Compensation expense presented in the 2006 consolidated statement of operations includes $75 million in cost of revenues, $32 million in selling, general and administrative, and $16 million in income (loss) from discontinued operations. Compensation expense presented in the 2005 consolidated statement of operations includes $94 million in cost of revenues, $40 million in selling, general and administrative, and $26 million in income (loss) from discontinued operations.
Prior to January 1, 2005, the Company recognized compensation cost associated with stock-based awards under the recognition and measurement principles of Accounting Principles Board (“APB”) Opinion No. 25, Accounting for Stock Issued to Employees,and related interpretations. Under APB No. 25, the difference between the quoted market price as of the date of the grant and thecontractual purchase price of shares was charged to operations over the vesting period on a straight-line basis. No compensationcost was recognized for fixed stock options with exercise prices equal to the market price of the stock on the dates of grant and shares acquired by employees under the EDS Stock Purchase Plan or Nonqualified Stock Purchase Plan.

AR-33
Pro forma net income and earnings per share disclosures as if the Company recorded compensation expense based on fair value forstock-based awards have been presented in accordance with the provisions of SFAS No. 148, Accounting for Stock-Based Compensation – Transition and Disclosure, and are as follows for the year ended December 31, 2004 (in millions, except per share amounts):
2004
Net income: As reported ....................................................................................................................................................... $ 158 Stock-based compensation costs included in reported net income, net of related tax effects........................... 27 Total stock-based employee compensation expense determined under fair value-based method for all
awards, net of related tax effects................................................................................................................... (165) Pro forma.......................................................................................................................................................... $ 20
Basic earnings per share of common stock: As reported ................................................................................................................................................ $ 0.32 Pro forma................................................................................................................................................... 0.04
Diluted earnings per share of common stock: As reported ................................................................................................................................................ $ 0.32 Pro forma................................................................................................................................................... 0.04
Accounts Receivable
Reserves for uncollectible trade receivables are established when collection of amounts due from clients is deemed improbable. Indicators of improbable collection include client bankruptcy, client litigation, industry downturns, client cash flow difficulties, or ongoing service or billing disputes. Receivables more than 180 days past due are automatically reserved unless persuasive evidence of probable collection exists. Accounts receivable are shown net of allowances of $71 million and $69 million at December 31, 2006 and 2005, respectively.
Marketable Securities
Marketable securities consist of government and agency obligations, corporate debt and corporate equity securities. The Companyclassifies all of its debt and marketable equity securities as trading or available-for-sale. All such investments are recorded at fair value. Changes in net unrealized holding gains (losses) on trading securities are recognized in income, whereas changes in net unrealized holding gains (losses) on available-for-sale securities are reported as a component of accumulated other comprehensiveloss, net of tax, in shareholders’ equity until realized.
Investments in marketable securities are monitored for impairment and written down to fair value with a charge to earnings if adecline in fair value is judged to be other than temporary. The Company considers several factors to determine whether a declinein the fair value of an equity security is other than temporary, including the length of time and the extent to which the fair value has been less than carrying value, the financial condition of the investee, and the intent and ability of the Company to retain the investment for a period of time sufficient to allow a recovery in value.
Property and Equipment
Property and equipment are carried at cost. Depreciation of property and equipment is calculated using the straight-line methodover the shorter of the asset’s estimated useful life or the term of the lease in the case of leasehold improvements. The ranges of estimated useful lives are as follows:
Years
Buildings........................................................................................................................................................... 40-50 Facilities ........................................................................................................................................................... 5-20 Computer equipment ........................................................................................................................................ 3-5 Other equipment and furniture.......................................................................................................................... 5-20
The Company reviews its property and equipment for impairment whenever events or changes in circumstances indicate the carrying values of such assets may not be recoverable. For property and equipment to be held and used, impairment is determinedby a comparison of the carrying value of the asset to the future undiscounted net cash flows expected to be generated by the asset.If such assets are determined to be impaired, the impairment recognized is the amount by which the carrying value of the assetsexceeds the fair value of the assets. Property and equipment to be disposed of by sale is carried at the lower of then current carrying value or fair value less cost to sell.

AR-34
Investments and Other Assets
Investments in non-marketable equity securities are monitored for impairment and written down to fair value with a charge to earnings if a decline in fair value is judged to be other than temporary. The fair values of non-marketable equity securities aredetermined based on quoted market prices. If quoted market prices are not available, fair values are estimated based on an evaluation of numerous indicators including, but not limited to, offering prices of recent issuances of the same or similar equity instruments, quoted market prices for similar companies and comparisons of recent financial information, operating plans, budgets,market studies and client information to the information used to support the initial valuation of the investment. The Company considers several factors to determine whether a decline in the fair value of a non-marketable equity security is other than temporary, including the length of time and the extent to which the fair value has been less than carrying value, the financialcondition of the investee, and the intent and ability of the Company to retain the investment for a period of time sufficient to allow a recovery in value.
Goodwill and Other Intangibles
The cost of acquired companies is allocated to the assets acquired and liabilities assumed based on estimated fair values at the date of acquisition. Costs allocated to identifiable intangible assets with finite lives, other than purchased software, are generallyamortized on a straight-line basis over the remaining estimated useful lives of the assets, as determined by underlying contractterms or appraisals. Such lives range from one to 14 years. Identifiable intangible assets with indefinite useful lives are notamortized but instead tested for impairment annually, or more frequently if events or changes in circumstances indicate that theasset might be impaired. Intangible assets with indefinite useful lives are impaired when the carrying value of the asset exceedstheir fair value.
The excess of the cost of acquired companies over the net amounts assigned to assets acquired and liabilities assumed is recorded as goodwill. Goodwill is not amortized but instead tested for impairment at least annually. The first step of the impairment test is a comparison of the fair value of a reporting unit to its carrying value. Reporting units are the geographic components of its reportable segments that share similar economic characteristics. The fair value of a reporting unit is estimated using the Company’s projections of discounted future operating cash flows of the unit. Goodwill allocated to a reporting unit whose fair value is equal to or greater than its carrying value is not impaired and no further testing is required. A reporting unit whose fair value is less than its carrying value requires a second step to determine whether the goodwill allocated to the unit is impaired. The second step of the goodwill impairment test is a comparison of the implied fair value of a reporting unit’s goodwill to its carrying value. The implied fair value of a reporting unit’s goodwill is determined by allocating the fair value of the entire reporting unit to the assets and liabilities of that unit, including any unrecognized intangible assets, based on fair value. The excess of the fair value of the entire reporting unit over the amounts allocated to the identifiable assets and liabilities of the unit is the implied fair value of the reporting unit’s goodwill. Goodwill of a reporting unit is impaired when its carrying value exceeds its implied fair value.Impaired goodwill is written down to its implied fair value with a charge to expense in the period the impairment is identified. As this impairment test is based on the Company’s assessment of the fair value of its reporting units, future changes to these estimates could also cause an impairment of a portion of the Company’s goodwill balance.
The Company conducts an annual impairment test for goodwill as of December 1st. The Company determines the timing and frequency of additional goodwill impairment tests based on an ongoing assessment of events and circumstances that would more than likely reduce the fair value of a reporting unit below its carrying value. Events or circumstances that might require the need for more frequent tests include, but are not limited to: the loss of a number of significant clients, the identification of otherimpaired assets within a reporting unit, the disposition of a significant portion of a reporting unit, or a significant adverse change in business climate or regulations. The Company also considers the amount by which the fair value of a particular reporting unit exceeded its carrying value in the most recent goodwill impairment test to determine whether more frequent tests are necessary.
Purchased or licensed software not subject to a subscription agreement is capitalized and amortized on a straight-line basis, generally over two to five years. Costs of developing and maintaining software systems incurred primarily in connection with client contracts are considered contract costs. Purchased software and certain development costs for computer software sold, leasedor otherwise marketed as a separate product or as part of a product or process are capitalized and amortized on a product-by-product basis over their remaining estimated useful lives at the greater of straight-line or the ratio that current gross revenues for a product bear to the total of current and anticipated future gross revenues for that product. Estimated useful lives of softwareproducts to be sold, leased or otherwise marketed range from three to seven years. Software development costs incurred to meet the Company’s internal needs are capitalized and amortized on a straight-line basis over three to five years. Software under subscription arrangements, whereby the software provider makes available current software products as well as products developed or acquired during the term of the arrangement, are executory contracts and expensed ratably over the subscription term.

AR-35
Sales of Financial Assets
The Company accounts for the sale of financial assets when control over the financial asset is relinquished. The Company sold $51 million of financial assets, primarily lease receivables, during 2004. In most cases, the Company sold lease receivables to a legallyisolated securitization trust. If a trust is not used, the receivables are sold to an independent substantive financial institution. None of these transactions resulted in any significant gain or loss, or servicing asset or servicing liability. No financial assets were sold by the Company during 2006 and 2005.
Revenue Recognition and Deferred Contract Costs
The Company provides IT and business process outsourcing services under time-and-material, unit-price and fixed-price contracts,which may extend up to 10 or more years. Services provided over the term of these arrangements may include one or more of the following: IT infrastructure support and management; IT system and software maintenance; application hosting; the design, development, and/or construction of software and systems (“Construct Service”); transaction processing; business process management and consulting services.
If a contract involves the provision of a single element, revenue is generally recognized when the product or service is providedand the amount earned is not contingent upon any future event. If the service is provided evenly during the contract term but service billings are irregular, revenue is recognized on a straight-line basis over the contract term. However, if the single service is a Construct Service, revenue is recognized under the percentage-of-completion method using a zero-profit methodology. Under this method, costs are deferred until contractual milestones are met, at which time the milestone billing is recognized as revenue and an amount of deferred costs is recognized as expense so that cumulative profit equals zero. If the milestone billing exceedsdeferred costs, then the excess is recorded as deferred revenue. When the Construct Service is completed and the final milestonemet, all unrecognized costs, milestone billings, and profit are recognized in full. If the contract does not contain contractualmilestones, costs are expensed as incurred and revenue is recognized in an amount equal to costs incurred until completion of the Construct Service, at which time any profit would be recognized in full. If total costs are estimated to exceed revenue for theConstruct Service, then a provision for the estimated loss is made in the period in which the loss first becomes apparent.
If a contract involves the provision of multiple service elements, total estimated contract revenue is allocated to each elementbased on the relative fair value of each element. The amount of revenue allocated to each element is limited to the amount that is not contingent upon the delivery of another element in the future. Revenue is then recognized for each element as described abovefor single-element contracts, except revenue recognized on a straight-line basis for a non-Construct Service will not exceed amounts currently billable unless the excess revenue is recoverable from the client upon any contract termination event. If theamount of revenue allocated to a Construct Service is less than its relative fair value, costs to deliver such service equal to the difference between allocated revenue and the relative fair value are deferred and amortized over the contract term. If total Construct Service costs are estimated to exceed the relative fair value for the Construct Service contained in a multiple-element arrangement, then a provision for the estimated loss is made in the period in which the loss first becomes apparent. If fair value is not determinable for all elements, the contract is treated as one accounting unit and revenue is recognized using the proportional performance method.
The Company also defers and subsequently amortizes certain set-up costs related to activities that enable the provision of contracted services to the client. Such activities include the relocation of transitioned employees, the migration of client systems or processes, and the exit of client facilities acquired upon entering into the client contract. Deferred contract costs, including set-up costs, are amortized on a straight-line basis over the remaining original contract term unless billing patterns indicate a moreaccelerated method is appropriate. The recoverability of deferred contract costs associated with a particular contract is analyzed on a periodic basis using the undiscounted estimated cash flows of the whole contract over its remaining contract term. If such undiscounted cash flows are insufficient to recover the long-lived assets and deferred contract costs, including contract concessions paid to the client, the deferred contract costs and contract concessions are written down by the amount of the cashflow deficiency. If a cash flow deficiency remains after reducing the balance of the deferred contract costs and contract concessions to zero, any remaining long-lived assets are evaluated for impairment. Any such impairment recognized would equal the amount by which the carrying value of the long-lived assets exceeds the fair value of those assets.
The Company’s software licensing arrangements typically include multiple elements, such as software products, post-contract customer support, consulting and training. The aggregate arrangement fee is allocated to each of the undelivered elements in anamount equal to its fair value, with the residual of the arrangement fee allocated to the delivered elements. Fair values are based upon vendor-specific objective evidence. Fees allocated to each software element of the arrangement are recognized as revenue when the following criteria have been met: a) a written contract for the license of software has been executed, b) the Company has delivered the product to the customer, c) the license fee is fixed or determinable, and d) collectibility of the resulting receivable is deemed probable. If evidence of fair value of the undelivered elements of the arrangement does not exist, all revenue from the arrangement is deferred until such time evidence of fair value does exist, or until all elements of the arrangement are delivered.

AR-36
Fees allocated to post-contract customer support are recognized as revenue ratably over the support period. Fees allocated to other services are recognized as revenue as the service is performed.
Deferred revenue of $1,669 million and $1,329 million at December 31, 2006 and 2005, respectively, represented billings in excess of amounts earned on certain contracts.
Currency Translation
Assets and liabilities of non-U.S. subsidiaries whose functional currency is not the U.S. dollar are translated at current exchange rates. Revenue and expense accounts are translated using an average rate for the period. Translation gains and losses are reflectedin the accumulated other comprehensive loss component of shareholders’ equity net of income taxes. Cumulative currency translation adjustment gains included in shareholders’ equity were $502 million, $189 million and $482 million at December 31, 2006, 2005 and 2004, respectively. Net currency transaction gains (losses) are reflected in other income (expense) in the consolidated statements of operations and were $(18) million, $6 million and $(20) million, respectively, for the years ended December 31, 2006, 2005 and 2004.
Financial Instruments and Risk Management
Following is a summary of the carrying amounts and fair values of the Company’s significant financial instruments at December 31, 2006 and 2005 (in millions):
2006 2005
Carrying
Amount
Estimated
Fair Value
Carrying
Amount
Estimated
Fair Value
Available-for-sale marketable securities (Note 2) ..................... $ 45 $ 45 $ 1,321 $ 1,321 Investments in securities, joint ventures and partnerships,
excluding equity method investments (Note 5)...................... 10 10 23 23 Long-term debt (Note 8)............................................................ (3,092) (3,196) (3,253) (3,351) Foreign currency forward contracts, net asset (liability) ........... 29 29 (5) (5) Interest rate swap agreements, net liability................................ (97) (97) (98) (98)
Current marketable securities are carried at their estimated fair value based on current market quotes. The fair values of certainlong-term investments are estimated based on quoted market prices for these or similar investments. For other investments, various methods are used to estimate fair value, including external valuations and discounted cash flows. The fair value of long-term debt is estimated based on the quoted market prices for the same or similar issues or based on the current rates offered to the Company for instruments with similar terms, degree of risk and remaining maturities. The fair value of foreign currency forward and interest rate swap contracts represents the estimated amount required to settle the contracts using current market exchange or interest rates. The carrying values of other financial instruments, such as cash equivalents, accounts and notes receivable, and accounts payable,approximate their fair value.
The Company makes investments, receives revenues and incurs expenses in many countries and has exposure to market risks arising from changes in interest rates, foreign exchange rates and equity prices. The Company has also invested in start-up companies to gain access to technology and marketplaces in which the Company intended to grow its business. The Company’s ability to sell these investments may be constrained by market or other factors. Derivative financial instruments are used to hedgeagainst these risks by creating offsetting market positions. The Company does not hold or issue derivative financial instruments for trading purposes.
The notional amounts of derivative contracts, summarized below as part of the description of the instruments utilized, do not necessarily represent the amounts exchanged by the parties and thus are not necessarily a measure of the exposure of the Companyresulting from its use of derivatives. The amounts exchanged by the parties are normally calculated on the basis of the notionalamounts and the other terms of the derivatives.
Foreign Currency Risk
The Company has significant international sales and purchase transactions in foreign currencies. The Company enters into foreigncurrency forward contracts and may enter into currency options with durations of generally less than 30 days to hedge such transactions. These derivative instruments are employed to eliminate or minimize certain foreign currency exposures that can beconfidently identified and quantified. Generally, these instruments are not designated as hedges for accounting purposes, and changes in the fair value of these instruments are recognized immediately in other income (expense). The Company’s currency hedging activities are focused on exchange rate movements, primarily in Canada, Mexico, the United Kingdom, Western European

AR-37
countries that use the euro as a common currency, Australia, India, Israel and Switzerland. At December 31, 2006 and 2005, the Company had forward exchange contracts to purchase various foreign currencies in the amount of $1.9 billion and $1.9 billion, respectively, and to sell various foreign currencies in the amount of $1.0 billion and $1.2 billion, respectively.
Interest Rate Risk
The Company enters into interest rate swap agreements that convert fixed-rate instruments to variable-rate instruments to manageinterest rate risk. The derivative financial instruments are designated and documented as fair value hedges at the inception of the contract. Changes in fair value of derivative financial instruments are recognized in earnings as an offset to changes in fair value of the underlying exposure which are also recognized in other income (expense). The impact on earnings from recognizing the fair value of these instruments depends on their intended use, their hedge designation, and their effectiveness in offsetting the underlying exposure they are designed to hedge.
The Company had interest rate swap fair value hedges outstanding in the notional amount of $1.8 billion in connection with its long-term notes payable at December 31, 2006 and 2005 (see Note 8). Under the swaps, the Company receives fixed rates ranging from 6.0% to 7.125% and pays floating rates tied to the London Interbank Offering Rate (“LIBOR”). The weighted-average floating rates were 7.64% and 6.39% at December 31, 2006 and 2005, respectively. At December 31, 2006 and 2005, respectively, the Company had $700 million of swaps and related debt which contained the same critical terms. Accordingly, no gain or loss relating to the change in fair value of the swap and related hedged item was recognized in earnings. At December 31, 2006 and 2005, $1.1 billion of the interest rate swaps contained different terms than the related underlying debt. Accordingly, the Companyrecognized in earnings the change in fair value of the interest rate swap and underlying debt which amounted to gains (losses) of$2.8 million and $(5.5) million during 2006 and 2005, respectively. Such gains are included in other income (expense) in the accompanying consolidated statements of operations.
Comprehensive Income (Loss) and Shareholders’ Equity
Comprehensive income (loss) includes all changes in equity during a period, except those resulting from investments by and distributions to owners. For the years ended December 31, 2006, 2005 and 2004, reclassifications from accumulated other comprehensive loss to net income of net gains (losses) recognized on marketable security transactions were $(7) million, $(3) million and $1 million, net of the related tax expense (benefit) of $(4) million, $(1) million and $0.4 million, respectively.
Following is a summary of changes within each classification of accumulated other comprehensive loss for the years ended December 31, 2006 and 2005 (in millions):
Cumulative
Translation
Adjustments
Unrealized
Gains
(Losses) on
Securities
Defined
Benefit
Pension
Plans
Accumulated
Other
Compre-
hensive
Loss
Balance at December 31, 2004 .............................................. $ 482 $ (3) $ (538) $ (59) Change............................................................................ (293) (1) (14) (308)
Balance at December 31, 2005 .............................................. 189 (4) (552) (367) Change............................................................................ 313 4 (132) 185
Balance at December 31, 2006 .............................................. $ 502 $ – $ (684) $ (182)
In connection with its employee stock incentive plans, the Company issued 11.4 million, 4.5 million and 7.6 million shares of treasury stock at a cost of $332 million, $252 million and $458 million during 2006, 2005 and 2004, respectively. The differencebetween the cost and fair value at the date of issuance of such shares has been recognized as a charge to retained earnings of $107 million, $166 million and $278 million in the consolidated statements of shareholders’ equity and comprehensive income (loss) during 2006, 2005 and 2004, respectively.
On February 21, 2006, the Company announced that its Board of Directors had authorized the Company to repurchase up to $1 billion of its outstanding common stock over the next 18 months in open market purchases or privately negotiated transactions. Inconnection with the share repurchase authorization, on February 23, 2006, the Company entered into a $400 million accelerated share repurchase agreement with a financial institution pursuant to which the Company expected to repurchase approximately 15.0million shares of its common stock at a price of $26.61 per share. Under the final settlement of the agreement, the financial institution repurchased 15.3 million shares of common stock in the open market during the repurchase period which ended on May 31, 2006. The final amount paid under the arrangement was $26.16 per share, excluding fees and commissions. The Company also repurchased 10.9 million shares in the open market at a cost of $283 million, before commissions, during the year ended December31, 2006.
AR-38
During 2006, cumulative translation adjustments of approximately $40 million were transferred from accumulated other comprehensive loss to net income due to the divestitures of certain non-U.S. investments (see Notes 17 and 19).
Income Taxes
The Company provides for deferred taxes under the asset and liability method. Deferred tax assets and liabilities are recognized for the future tax consequences attributable to differences between the financial statement carrying amounts of existing assets andliabilities and their respective tax bases. Deferred tax assets and liabilities are measured using enacted tax rates expected to apply to taxable income in the years in which those temporary differences are expected to be reversed. The deferral method is used toaccount for investment tax credits. Valuation allowances are recorded to reduce deferred tax assets to an amount whose realization is more likely than not. Income tax liabilities are recorded whenever there is a difference between amounts reported by the Company in its tax returns and the amounts the Company believes it would likely pay in the event of an examination by taxing authorities. The Company accrues interest on such amounts and includes the associated expense in provision (benefit) for incometaxes in the accompanying consolidated statements of operations. Income taxes payable are classified in the accompanying consolidated balance sheets based on their estimated payment date.
Statements of Cash Flows
The Company considers the following asset classes with original maturities of three months or less to be cash equivalents: certificates of deposit, commercial paper, repurchase agreements and money market funds.
Use of Estimates
The preparation of the consolidated financial statements in conformity with generally accepted accounting principles in the UnitedStates requires management to make estimates, judgments and assumptions that affect the reported amounts of assets and liabilitiesand disclosure of contingent assets and liabilities at the date of the consolidated financial statements and the reported amounts of revenues and expenses during the reporting period. Because of the use of estimates inherent in the financial reporting process,actual results could differ from those estimates. Areas in which significant judgments and estimates are used include, but are not limited to, cost estimation for Construct Service elements, projected cash flows associated with recoverability of deferred contract costs, contract concessions and long-lived assets, liabilities associated with pensions and performance guarantees, receivablescollectibility, and loss accruals for litigation, exclusive of legal fees which are expensed as services are received. It is reasonably possible that events and circumstances could occur in the near term that would cause such estimates to change in a manner that would be material to the consolidated financial statements.
Concentration of Credit Risk
Accounts receivable, net, from General Motors (“GM”) and its affiliates totaled $342 million and $256 million as of December 31,2006 and 2005, respectively. In addition, the Company has several large contracts with major U.S. and foreign corporations, eachof which may result in the Company carrying a receivable balance between $50 million and $300 million at any point in time. At December 31, 2006 and 2005, the Company had net operating receivables of $137 million and $169 million, respectively, and investments in leveraged leases of $28 million and $55 million, respectively, associated with travel-related industry clients, primarily airlines. Other than operating receivables from GM and aforementioned contracts, concentrations of credit risk with respect to accounts receivable are generally limited due to the large number of clients forming the Company’s client base and their dispersion across different industries and geographic areas.
The Company is exposed to credit risk in the event of nonperformance by counterparties to derivative contracts. Because the Company deals only with major commercial banks with high-quality credit ratings, the Company believes the risk of nonperformance by any of these counterparties is remote.
Reclassifications
Certain reclassifications have been made to the 2005 and 2004 consolidated financial statements to conform to the 2006 presentation.
AR-39
NOTE 2: MARKETABLE SECURITIES
Following is a summary of current available-for-sale marketable securities at December 31, 2006 and 2005 (in millions):
2006
Amortized
Cost
Gross
Unrealized
Gains
Gross
Unrealized
Losses
Estimated
Fair Value
Equity securities ........................................................................ $ 45 $ 1 $ (1) $ 45 Total current available-for-sale securities .......................... $ 45 $ 1 $ (1) $ 45
2005
Amortized
Cost
Gross
Unrealized
Gains
Gross
Unrealized
Losses
Estimated
Fair Value
Government and agency obligations.......................................... $ 192 $ – $ (1) $ 191 Obligations of states and political subdivisions......................... 19 – – 19 Corporate debt securities ........................................................... 319 – (2) 317 Mortgage-backed securities ....................................................... 306 – (4) 302 Asset-backed securities.............................................................. 454 – (4) 450
Total debt securities............................................................ 1,290 – (11) 1,279 Equity securities ........................................................................ 43 – (1) 42
Total current available-for-sale securities .......................... $ 1,333 $ – $ (12) $ 1,321
Following is a summary of sales of available-for-sale securities for the years ended December 31, 2006, 2005 and 2004 (in millions). Specific identification was used to determine cost in computing realized gain or loss.
2006 2005 2004
Proceeds from sales ............................................................................................ $ 2,793 $ 1,434 $ 956 Gross realized gains............................................................................................ 10 1 3 Gross realized losses........................................................................................... (12) (8) (4)
NOTE 3: PROPERTY AND EQUIPMENT
Following is a summary of property and equipment, net, at December 31, 2006 and 2005 (in millions):
2006 2005
Land.......................................................................................................................................... $ 89 $ 86 Buildings and facilities ............................................................................................................. 1,460 1,599 Computer equipment ................................................................................................................ 4,586 4,620 Other equipment and furniture.................................................................................................. 429 424
Subtotal.............................................................................................................................. 6,564 6,729 Less accumulated depreciation ................................................................................................. (4,385) (4,762)
Total .................................................................................................................................. $ 2,179 $ 1,967
During 2005, the Company sold sixteen domestic and international real estate properties in connection with its efforts to improve its cost competitiveness and enhance workplace capacity usage. Net proceeds from the sale were $178 million. Fourteen propertiesinvolved in the sale have been leased back by the Company for various extended periods. A deferred net gain of $14 million has been allocated to the various leased properties and will be recognized by the Company over the respective term of each lease. The Company recognized a net gain of $3 million on the sale of the remaining properties which is included in other income in the 2005consolidated statement of operations.

AR-40
The Company recorded a non-cash impairment charge of $375 million in 2004 to write-down long-lived assets used on the Company’s Navy Marine Corps Intranet (“NMCI”) contract to estimated fair value. The impairment charge is reported as a component of cost of revenues in the consolidated statement of operations and is reflected in the results of the U.S. Governmentsegment. Fair value was measured by probability weighting future contract pre-tax cash flows discounted at a pre-tax risk free discount rate. The decline in the fair value of these assets is primarily a result of lower estimates of future revenues as a result of several events occurring during 2004. Such events include the failure to meet seat cutover schedules, a revision of the timeline for meeting performance service levels contained in a contract amendment signed September 30, 2004, a deceleration in customer satisfaction improvement rates, and delays in signing certain anticipated contract modifications and additions. Remaining long-lived assets and lease receivables associated with the contract totaled approximately $278 million and $295 million, respectively,at December 31, 2006.
The Company had a significant commercial contract under which it provided various IT services using the legacy IT systems acquired from the client while developing and deploying a new IT system dedicated to that client. This contract experienced delays in its development and construction phases, and milestones in the contract had been missed. Throughout the contract period, theCompany negotiated with the client to resolve critical issues, including those associated with the pricing and technical specifications for the new IT system. In July 2004, the Company and the client reached an agreement to terminate the existing contract effective as of August 1, 2004, provide transition services for a limited period thereafter and settle each party’s outstanding claims. During 2004, the Company recognized impairment charges of $128 million to write-down certain assets to fairvalue. In addition, the Company recognized $14 million of shutdown costs during 2004 to record contract-related vendor commitments and employee severance obligations associated with the contract. All of the aforementioned amounts associated with this contract are included in cost of revenues in the consolidated statements of operations and are reflected in the results of the Americas segment.
NOTE 4: DEFERRED CONTRACT COSTS
The Company defers certain costs relating to construction and set-up activities on client contracts. Following is a summary of deferred costs for the years ended December 31, 2006 and 2005 (in millions):
Gross
Carrying
Amount
Accumulated
Amortization Total
Balance at December 31, 2004 ........................................................................ $ 1,594 $ (886) $ 708 Net Change ............................................................................................... (50) (20) (70)
Balance at December 31, 2005 ........................................................................ 1,544 (906) 638 Net Change ............................................................................................... 367 (198) 169
Balance at December 31, 2006 ........................................................................ $ 1,911 $ (1,104) $ 807
During 2005, the Company identified deterioration in the projected performance of one of its commercial contracts based on, among other things, a change in management’s judgment regarding the amount and likelihood of achieving anticipated benefits from contract-specific productivity initiatives, primarily related to the length of time necessary to achieve cost savings fromplanned infrastructure optimization initiatives. The Company determined that the estimated undiscounted cash flows of the contract over its remaining term were insufficient to recover the contract’s deferred contract costs. As a result, the Company recognized a non-cash impairment charge of $37 million in the second quarter of 2005 to write-off the contract’s deferred contractcosts. The impairment charge is reported as a component of cost of revenues in the 2005 consolidated statement of operations andis included in the results of the Americas segment. Remaining long-lived assets associated with this contract totaled $168 million at December 31, 2006. The current estimate of cash flows includes cost reductions resulting from the expected optimization of thecontract’s service delivery infrastructure based on project plans and anticipated vendor rate reductions based on historical andindustry trends. Some of the project plans have near-term milestones that are critical to meeting overall cost reduction goals. It is reasonably possible that these milestones may not be met or actual cost savings from these and other planned initiatives may notmaterialize in the near-term and, as a result, remaining long-lived assets associated with this contract will become fully impaired. The Company continues to pursue several opportunities to improve the financial performance of this contract, including leveraging the infrastructure through the addition of new business opportunities with the client.
Estimated amortization expense related to deferred costs at December 31, 2006 for each of the years in the five-year period ending December 31, 2011 and thereafter is (in millions): 2007 – $215; 2008 – $164; 2009 – $153; 2010 – $113; 2011 – $60; and thereafter – $102.

AR-41
NOTE 5: INVESTMENTS AND OTHER ASSETS
Following is a summary of investments and other assets at December 31, 2006 and 2005 (in millions):
2006 2005
Lease contracts receivable (net of principal and interest on non-recourse debt) ...................... $ 45 $ 52 Estimated residual values of leased assets (not guaranteed)..................................................... 22 22 Unearned income, including deferred investment tax credits................................................... (20) (25)
Total investment in leveraged leases (excluding deferred taxes of $17 million at December 31, 2006 and $18 million at December 31, 2005) ............................................ 47 49
Leveraged lease partnership investment ................................................................................... 28 55 Investments in equipment for lease .......................................................................................... 142 182 Investments in joint ventures and partnerships......................................................................... 44 58 Deferred pension costs.............................................................................................................. 92 72 Other ......................................................................................................................................... 283 268
Total .................................................................................................................................. $ 636 $ 684
The Company holds interests in various equipment leases financed with non-recourse borrowings at lease inception accounted for as leveraged leases. The Company’s investment in leveraged leases is comprised of a fiber optic equipment leveraged lease with asubsidiary of Verizon signed in 1988. For U.S. federal income tax purposes, the Company receives the investment tax credit (if available) at lease inception and has the benefit of tax deductions for depreciation on the leased asset and for interest on the non-recourse debt. All non-recourse borrowings have been satisfied in relation to these leases.
The Company holds an equity interest in a partnership which holds leveraged aircraft lease investments. The Company accounts for its interest in the partnership under the equity method. The carrying amounts of the Company’s remaining equity interest in the partnership were $28 million and $55 million, respectively, at December 31, 2006 and 2005. The decrease in the carrying amount in 2006 was due to the sale of certain lease investments in the partnership and a related cash distribution to the Company. During 2005, the Company recorded write-downs of its investment in the partnership due to uncertainties regarding the recoverability ofthe partnership’s investments in aircraft leased to Delta Air Lines which filed for bankruptcy on September 14, 2005, and the proposed sale of certain lease investments in the partnership. These write-downs were partially offset by the accelerated recognition of previously deferred investment tax credits associated with the investment. These write-downs totaled $35 millionand are reflected in other income (expense) in the Company’s 2005 consolidated statement of operations. During 2004, the Company recorded a write-down of $34 million of its investment in the partnership due to a reduction in the expected cash flowsfrom the partnership. This reduction included a renegotiation of leases with a U.S. airline. These write-downs are reflected in other income (expense) in the Company’s 2004 consolidated statement of operations. The partnership’s remaining leveraged lease investments include leases with American Airlines and one non-U.S. airline. The Company’s ability to recover its remaining investment in the partnership is dependent upon the continued payment of rentals by the lessees and the realization of expectedfuture aircraft values. In the event such lessees are relieved from their obligation to pay such rentals as a result of bankruptcy, the investment in the partnership would be partially or wholly impaired.
Investments in securities, joint ventures and partnerships includes investments accounted for under the equity method of $34 million and $35 million at December 31, 2006 and 2005, respectively. The Company recognized impairment losses totaling $1 million in 2005 and 2004 due to other than temporary declines in the fair values of certain non-marketable equity securities. Noimpairment losses were recognized in 2006. These losses are reflected in other income (expense) in the Company’s consolidated statements of operations.
Investments in equipment for lease is comprised of equipment to be leased to clients under long-term IT contracts and net investment in leased equipment associated with such contracts. On March 24, 2006, the Company and the Department of the Navy reached an agreement on the modification of the NMCI contract which, among other things, extended the contract term from 2007 to 2010 and defined the economic lives of certain desktop and infrastructure assets. As a result of the contract modification which changed lease payment terms, the Company recognized sales-type capital lease revenue of $116 million associated with certain assets previously accounted for as operating leases, and certain assets previously accounted for as capital leases with an aggregate net investment balance of $113 million are now being accounted for as operating leases. The net investment in leased equipment associated with the NMCI contract was $295 million and $408 million at December 31, 2006 and 2005, respectively. Future minimum lease payments to be received under the NMCI contract were $314 million and $358 million at December 31, 2006 and 2005, respectively. The unguaranteed residual values accruing to the Company were $3 million and $78 million, and unearned interest income related to these leases was $22 million and $28 million at December 31, 2006 and 2005, respectively. The net lease receivable balance is classified as components of prepaids and other and investments and other assets in the consolidated balance

AR-42
sheets. Future minimum lease payments to be received were as follows: 2007 – $171 million; 2008 – $101 million; 2009 – $32 million; 2010 – $10 million.
During 2006, the Company sold land held for development to a real estate joint venture for cash and a minority equity interest in the joint venture. Net proceeds from the sale were $49 million. The Company recognized a net gain of $8 million on the sale which is included in other income (expense) in the consolidated statement of operations for the year ended December 31, 2006.
NOTE 6: GOODWILL AND OTHER INTANGIBLE ASSETS
Following is a summary of changes in the carrying amount of goodwill by segment for the years ended December 31, 2006 and 2005 (in millions):
Americas EMEA
Asia
Pacific Total
Balance at December 31, 2004 ..................................................... $ 1,965 $ 1,595 $ 75 $ 3,635 Additions ............................................................................... 368 48 – 416 Deletions................................................................................ – (45) – (45) Other...................................................................................... 32 (199) (7) (174)
Balance at December 31, 2005 ..................................................... 2,365 1,399 68 3,832 Additions ............................................................................... 18 – 352 370 Deletions................................................................................ (1) – – (1) Other...................................................................................... 1 153 10 164
Balance at December 31, 2006 ..................................................... $ 2,383 $ 1,552 $ 430 $ 4,365
Goodwill additions resulted from acquisitions completed in 2006 and 2005 and include adjustments to the preliminary purchase price allocations (see Note 16). Goodwill deletions resulted from divestitures completed in 2005 (see Notes 17 and 19). Other changes to the carrying amount of goodwill were primarily due to foreign currency translation adjustments. The Company conducted its annual goodwill impairment tests as of December 1, 2006 and 2005. No impairment losses were identified as a resultof these tests.
Intangible assets with definite useful lives are amortized over their respective estimated useful lives to their estimated residual values. Intangible assets with indefinite useful lives are not amortized but instead tested for impairment at least annually. Following is a summary of intangible assets at December 31, 2006 and 2005 (in millions):
2006
Gross
Carrying
Amount
Accumulated
Amortization Total
Definite Useful Lives Software.............................................................................................................. $ 2,322 $ (1,771) $ 551 Customer accounts.............................................................................................. 179 (100) 79 Other ................................................................................................................... 354 (235) 119
Total ............................................................................................................ $ 2,855 $ (2,106) $ 749
2005
Gross
Carrying
Amount
Accumulated
Amortization Total
Definite Useful Lives Software.............................................................................................................. $ 2,101 $ (1,665) $ 436 Customer accounts.............................................................................................. 192 (90) 102 Other ................................................................................................................... 393 (291) 102
Total ............................................................................................................ $ 2,686 $ (2,046) $ 640

AR-43
Amortization expense related to intangible assets, including amounts pertaining to discontinued operations, was $394 million and$373 million for the years ended December 31, 2006 and 2005, respectively. Estimated amortization expense related to intangibleassets subject to amortization at December 31, 2006 for each of the years in the five-year period ending December 31, 2011 and thereafter is (in millions): 2007 – $366; 2008 – $214; 2009 – $94; 2010 – $23; 2011 – $15; and thereafter – $37.
NOTE 7: ACCRUED LIABILITIES
Following is a summary of accrued liabilities at December 31, 2006 and 2005 (in millions):
2006 2005
Accrued liabilities relating to: Contracts................................................................................................................................... $ 674 $ 609 Payroll ...................................................................................................................................... 815 694 Restructuring activities ............................................................................................................. 5 66 Property, sales and franchise taxes ........................................................................................... 333 266 Other ......................................................................................................................................... 862 795
Total .................................................................................................................................. $ 2,689 $ 2,430
NOTE 8: LONG-TERM DEBT
Following is a summary of long-term debt at December 31, 2006 and 2005 (in millions):
2006 2005
Amount
Weighted-
Average
Rate Amount
Weighted-
Average
Rate
Senior notes due 2013................................................................ $ 1,089 6.50% $ 1,087 6.50% Senior notes due 2009................................................................ 700 7.12% 700 7.12% Convertible notes due 2023 ....................................................... 690 3.88% 690 3.88% Senior notes due 2006 to 2029................................................... 299 7.45% 497 7.01% Other, including capital lease obligations.................................. 314 – 279 –
Total ................................................................................... 3,092 3,253 Less current portion of long-term debt ...................................... (127) (314)
Long-term debt ................................................................... $ 2,965 $ 2,939
The Company had $1.1 billion aggregate principal amount of 6.0% unsecured Senior Notes due 2013 outstanding at December 31, 2006. Interest on the notes is payable semiannually. In the event the credit ratings assigned to the notes are below the Baa3 ratingof Moody’s or the rating BBB– of S&P, the interest rate payable on the notes will be 6.5%. On July 15, 2004, Moody’s lowered the Company’s long-term credit rating to Ba1 from Baa3. As a result of Moody’s rating action, the interest rate payable on $1.1billion of the Company’s senior unsecured debt was increased from 6.0% to 6.5%. Further downgrades in the Company’s credit rating will not affect this rate. However, in the event the Company’s credit rating is subsequently increased to Baa3 or above by Moody’s and its S&P credit rating remains at or above BBB–, this rate will return to 6.0%. The Company may redeem some or all of the notes at any time prior to maturity. In conjunction with the issuance of the Senior Notes, the Company entered into interest rate swaps with a notional amount of $1.1 billion under which the Company receives fixed rates of 6.0% and pays floating rates equal to the six-month LIBOR (5.37% at December 31, 2006) plus 2.275% to 2.494%. These interest rate swaps are accounted for as fair value hedges (see Note 1).
The Company had $690 million aggregate principal amount of 3.875% unsecured Convertible Senior Notes due 2023 outstanding at December 31, 2006. Interest on the notes is payable semiannually. Contingent interest is payable during any six-month periodbeginning July 2010 in which the average trading price of a note for the applicable five trading day reference period equals orexceeds 120% of the principal amount of the note as of the day immediately preceding the first day of the applicable six-month period. The five trading day reference period means the five trading days ending on the second trading day immediately precedingthe relevant six-month interest period. The notes are convertible by holders into shares of the Company’s common stock at an initial conversion rate of 29.2912 shares of common stock per $1,000 principal amount, representing an initial conversion price of $34.14 per share of common stock, under the following circumstances: a) during any calendar quarter, if the last reported sale price of EDS common stock for at least 20 trading days during the period of 30 consecutive trading days ending on the last trading day of the previous calendar quarter is greater than or equal to 120% or, following July 15, 2010, 110% of the conversion price per

AR-44
share of EDS common stock on such last trading day; b) if the notes have been called for redemption; c) during any period in which the credit ratings assigned to the notes by either Moody’s or S&P is lower than Ba2 or BB, respectively, or the notes are no longer rated by at least one of these rating services or their successors; or d) upon the occurrence of specified corporate transactions. The Company may redeem for cash some or all of the notes at any time on or after July 15, 2010. Holders have the right to require the Company to purchase the notes at a price equal to 100% of the principal amount of the notes plus accrued interest, including contingent interest and additional amounts, if any, on July 15, 2010, July 15, 2013 and July 15, 2018, or upon a fundamental change in the Company’s ownership, control or the marketability of the Company’s common stock prior to July 15, 2010.
In June 2001, the Company completed the public offering of 32.2 million units of a security, initially referred to as Income PRIDES, each with a stated price of $50 before underwriting discount. Each unit initially consisted of $50 principal amount of EDS senior notes due August 2006 and a purchase contract which obligated the investor to purchase $50 of EDS common stock no later than August 17, 2004 at a price ranging from $59.31 to $71.47 per share. On May 12, 2004, the Company completed an offer to exchange 0.843 shares of EDS common stock plus $1.58 in cash for each validly tendered and accepted Income PRIDES. The Company accepted all of the 28.2 million Income PRIDES tendered pursuant to the offer and issued 23.8 million shares plus $45 million in cash to the holders. The notes relating to the 4.0 million units not tendered totaling $198 million were remarketed on May 12, 2004 at an interest rate of 6.334% per annum and matured on August 17, 2006. Investors who did not tender their Income PRIDES in the exchange offer were obligated to purchase EDS common stock on August 17, 2004. On that date, the Company issued 3.3 million shares of common stock for consideration of $198 million.
As a result of the exchange, the Company increased shareholders’ equity by $1,403 million in 2004 for the fair value of the purchase contracts and the fair value of the common stock issued. The remaining consideration was accounted for as an extinguishment of debt. Accordingly, the Company decreased liabilities by $1,418 million for the carrying value of the notes exchanged and the unpaid portion of contract adjustment payments that were recorded when the units were originally issued. In addition, the Company paid cash of $50 million and recognized a loss on debt extinguishment of $36 million in interest expense as a result of the exchange in 2004.
During 1999, the Company completed the public offering of senior notes in the principal amount of $1.5 billion. These notes included $500 million of 6.85% notes that matured on October 15, 2004, $700 million of 7.125% notes that mature in 2009, and $300 million of 7.45% notes that mature in 2029. The balance of the 7.45% notes was $299 million at December 31, 2006.
On June 30, 2006, the Company entered into a $1 billion Five Year Credit Agreement (the “Credit Agreement”) with a bank group including Citibank, N.A., as Administrative Agent for the lenders, and Bank of America, N.A., as Syndication Agent. The Credit Agreement replaced the Company’s $550 million Three-and-One-Half Year Multi Currency Revolving Credit Agreement entered into in September 2004 and its $450 million Three-Year Multi Currency Revolving Credit Agreement entered into in September 2003. The Credit Agreement may be used for general corporate borrowing purposes and issuance of letters of credit, with a $500 million sub-limit for letters of credit. The Credit Agreement contains certain financial and other restrictive covenants with which non-compliance would allow any amounts outstanding to be accelerated and would prohibit further borrowings. The Company pays an annual facility fee based on a percentage of the $1 billion commitment (0.125% at December 31, 2006). No amounts were outstanding under the Credit Agreement or the facilities it replaced at December 31, 2006 and 2005. The Company anticipates utilizing the Credit Agreement principally for the issuance of letters of credit which aggregated approximately $171 million atDecember 31, 2006. The issuance of letters of credit under the Credit Agreement utilizes availability under the Credit Agreement,as was the case with the replaced facilities.
The Company’s Credit Agreement and the indentures governing its long-term notes contain certain financial and other restrictivecovenants that would allow any amounts outstanding under the facilities to be accelerated, or restrict the Company’s ability toborrow thereunder, in the event of noncompliance. The Company was in compliance with all covenants at December 31, 2006.
In addition to compliance with these financial covenants, it is a condition to the Company’s ability to borrow under its CreditAgreement that certain of its representations and warranties under that agreement be true and correct as of the date of the borrowing. The Company’s Credit Agreement, the indentures governing its long-term notes and certain other debt instruments alsocontain cross-default provisions with respect to a default in any payment under, or events resulting in or permitting the accelerationof, indebtedness greater than $50 million.
AR-45
Expected maturities of long-term debt for years subsequent to December 31, 2006 are as follows (in millions):
2007 .................................................................................................................................................................. $ 127 2008 .................................................................................................................................................................. 95 2009 .................................................................................................................................................................. 768 2010 .................................................................................................................................................................. 718 2011 .................................................................................................................................................................. 8 Thereafter ......................................................................................................................................................... 1,376
Total .......................................................................................................................................................... $ 3,092
NOTE 9: MINORITY INTERESTS AND OTHER LONG-TERM LIABILITIES
Other long-term liabilities were $305 million and $337 million at December 31, 2006 and 2005, respectively. Other long-term liabilities include liabilities related to the Company’s purchased or licensed software, tax liabilities and interest rate swapagreements. Minority interests were $150 million and $78 million at December 31, 2006 and 2005, respectively. The increase in minority interests in 2006 was primarily due to the Company’s purchase of a controlling interest in an Indian subsidiary (see Note 16).
NOTE 10: INCOME TAXES
Following is a summary of income tax expense for the years ended December 31, 2006, 2005 and 2004 (in millions):
2006 2005 2004
Income (loss) from continuing operations .......................................................... $ 257 $ 153 $ (103) Income (loss) from discontinued operations....................................................... (26) (38) 329 Shareholders’ equity ........................................................................................... 34 (101) (20)
Total ............................................................................................................ $ 265 $ 14 $ 206
Following is a summary of the provision (benefit) for income taxes on income (loss) from continuing operations for the years ended December 31, 2006, 2005 and 2004 (in millions):
United States
Federal State Non-U.S. Total
2006 Current....................................................................................... $ 91 $ 22 $ 226 $ 339 Deferred..................................................................................... (116) (9) 43 (82)
Total ................................................................................... $ (25) $ 13 $ 269 $ 257 2005 Current....................................................................................... $ 127 $ 13 $ 87 $ 227 Deferred..................................................................................... (233) (29) 188 (74)
Total ................................................................................... $ (106) $ (16) $ 275 $ 153 2004 Current....................................................................................... $ (377) $ 2 $ 145 $ (230) Deferred..................................................................................... 31 (7) 103 127
Total ................................................................................... $ (346) $ (5) $ 248 $ (103)
Following is a summary of the components of income (loss) from continuing operations before income taxes for the years ended December 31, 2006, 2005 and 2004 (in millions):
2006 2005 2004
U.S. income ........................................................................................................ $ 75 $ (170) $ (814) Non-U.S. income ................................................................................................ 681 609 440
Total ............................................................................................................ $ 756 $ 439 $ (374)

AR-46
Following is a reconciliation of income tax expense using the statutory U.S. federal income tax rate of 35.0% to actual income tax expense for the years ended December 31, 2006, 2005 and 2004 (in millions):
2006 2005 2004
Statutory federal income tax............................................................................... $ 265 $ 154 $ (131) State income tax, net........................................................................................... 8 (10) (17) Foreign losses ..................................................................................................... 50 75 64 Research tax credits ............................................................................................ (29) (54) (45) Tax reserves........................................................................................................ (48) (7) 31 Other ................................................................................................................... 11 (5) (5)
Total ............................................................................................................ $ 257 $ 153 $ (103) Effective income tax rate............................................................................. 34.0% 34.9% 27.5%
Following is a summary of the tax effects of significant types of temporary differences and carryforwards which result in deferred tax assets and liabilities as of December 31, 2006 and 2005 (in millions):
2006 2005
Assets Liabilities Assets Liabilities
Leasing basis differences........................................................... $ – $ 111 $ – $ 178 Other accrual accounting differences ........................................ 429 10 429 21 Employee benefit plans ............................................................. 352 31 337 18 Depreciation/amortization differences....................................... 385 391 337 257 Net operating loss and tax credit carryforwards ........................ 1,432 – 996 – Employee-related compensation................................................ 312 3 233 – Other .......................................................................................... 176 476 294 269
Subtotal 3,086 1,022 2,626 743 Less valuation allowances ......................................................... (376) – (281) –
Total deferred taxes ............................................................ $ 2,710 $ 1,022 $ 2,345 $ 743
The net changes in the valuation allowances for the years ended December 31, 2006 and 2005 were increases of $95 million and $48 million, respectively. Of the net change in 2006, $40 million was an increase in valuation allowances for losses incurred incertain foreign tax jurisdictions, which increased current year income tax expense from continuing operations. The remaining change in the valuation allowance in 2006 was primarily due to the sale of A.T. Kearney in January 2006 (see Note 17) and foreign currency translation adjustments. Approximately three-fourths of the Company’s net operating loss and tax carryforwardsexpire over various periods from 2007 through 2026, and the remainder are unlimited.
In assessing the realizability of deferred tax assets, the Company considers whether it is more likely than not that some portion or all of the deferred tax assets will not be realized and adjusts the valuation allowance accordingly. Factors considered in making this determination include the period of expiration of the tax asset, planned use of the tax asset, tax planning strategies andhistorical and projected taxable income as well as tax liabilities for the tax jurisdiction in which the tax asset is located. The ultimate realization of deferred tax assets is dependent on the generation of future taxable income during the periods in whichthose temporary differences become deductible. Based on tax planning strategies, the level of historical taxable income and projections for future taxable income over the periods in which the deferred tax assets are deductible, the Company believes it is more likely than not it will realize the benefits of the deductible differences, net of existing valuation allowances at December 31, 2006. The amount of the deferred tax asset considered realizable, however, could be reduced in the near term if estimates of future taxable income during the carryforward period are reduced.
U.S. income taxes have not been provided for on $697 million of undistributed earnings of certain foreign subsidiaries, as suchearnings have been permanently reinvested in the business. As of December 31, 2006, the unrecognized deferred tax liability associated with these earnings amounted to approximately $101 million.

AR-47
NOTE 11: STOCK PURCHASE AND INCENTIVE PLANS
Stock Purchase Plan
Under the Stock Purchase Plan, eligible employees may purchase EDS common stock at the end of each fiscal quarter at a purchase price equal to 85% of the lower of the market price on the first or last trading day of the quarter, through payroll deductions of up to 10% of their compensation, not to exceed $25,000 per year in market value. Shares of EDS common stock purchased under the plan may not be sold or transferred within one year of the date of purchase. The number of shares originallyauthorized for issuance under this plan is 57.5 million. Total compensation expense recognized under this plan was $6 million and$6 million, respectively, during the years ended December 31, 2006 and 2005. See Note 1 for pro forma expense associated with stock-based incentive compensation for the year ended December 31, 2004.
PerformanceShare and EDS Global Share Plans
PerformanceShare and Global Share are “broad-based” plans that permit the grant of stock options to any eligible employee of EDS or its participating subsidiaries other than executive officers. As of December 31, 2006, options for 16.0 million shares had been granted under PerformanceShare (principally in a broad-based grant in May 1997) and options for 25.9 million shares had been granted under Global Share (principally in two broad-based grants in July 2000 and February 2002). The number of shares originally authorized for issuance under PerformanceShare and Global Share is 20 million and 27 million, respectively. As of December 31, 2006, no shares were available for future issuance under these plans.
Incentive Plan
The Incentive Plan is authorized to issue up to 136.5 million shares of common stock. The Incentive Plan permits the granting ofstock-based awards in the form of stock grants, restricted shares, restricted stock units, stock options or stock appreciation rights to eligible employees and non-employee directors. A restricted stock unit is the right to receive shares. The exercise price for stock options granted under this plan must be equal to or greater than the fair market value on the date of the grant.
Transition Incentive Plan
The Transition Incentive Plan permits the grant of nonqualified stock options to eligible employees. This plan was intended to beused exclusively for the grant of stock options to former employees of Structural Dynamics Research Corporation (“SDRC”), which was acquired in August 2001, and UGS PLM Solutions Inc., which became a wholly owned subsidiary in September 2001, and was used exclusively for that purpose. UGS PLM Solutions (which was the successor by merger to SDRC) was sold by the Company in May 2004. Such options have an exercise price equal to the fair market value per share of common stock on the grant date, vested in May 2004 in connection with the sale of UGS PLM Solutions, and were exercisable for two years from the date of such sale. The number of options originally authorized for issuance under this plan is 3.7 million.
Transition Inducement Plan
The Transition Inducement Plan permits awards in the form of nonqualified stock options, stock appreciation rights, restricted stock units, restricted stock awards or stock grants to eligible employees. This plan was adopted in October 2002 in anticipation of then proposed New York Stock Exchange rules which provide that awards issued to induce new employment or in exchange for awards under an “acquired” plan are not subject to shareholder approval. All options granted under this plan must have an exerciseprice not less than the fair market value per share of common stock on the grant date. The maximum number of shares that can beissued under this plan is 7.0 million, of which not more than 2.0 million are available for awards other than in the form of stock options.
Stock Options
The fair value of each stock option award is estimated on the date of grant using the Black-Scholes-Merton valuation model thatuses the assumptions noted below. Estimates of fair value are not intended to predict actual future events or the value ultimatelyrealized by employees who receive equity awards, and subsequent events are not indicative of the reasonableness of the originalestimates of fair value made by the Company under SFAS No. 123R. The outstanding term of an option is estimated based on the vesting term and contractual term of the option, as well as expected exercise behavior of the employee who receives the option.Expected volatility during the estimated outstanding term of the option is based on historical volatility during a period equivalent to the estimated outstanding term of the option and implied volatility as determined based on observed market prices of the Company’s publicly traded options. Expected dividends during the estimated outstanding term of the option are based on recent dividend activity. Risk-free interest rates are based on the U.S. Treasury yield in effect at the time of the grant. The weighted-average fair values of options granted were $8.87, $10.46 and $8.60 for the years ended December 31, 2006, 2005 and 2004,
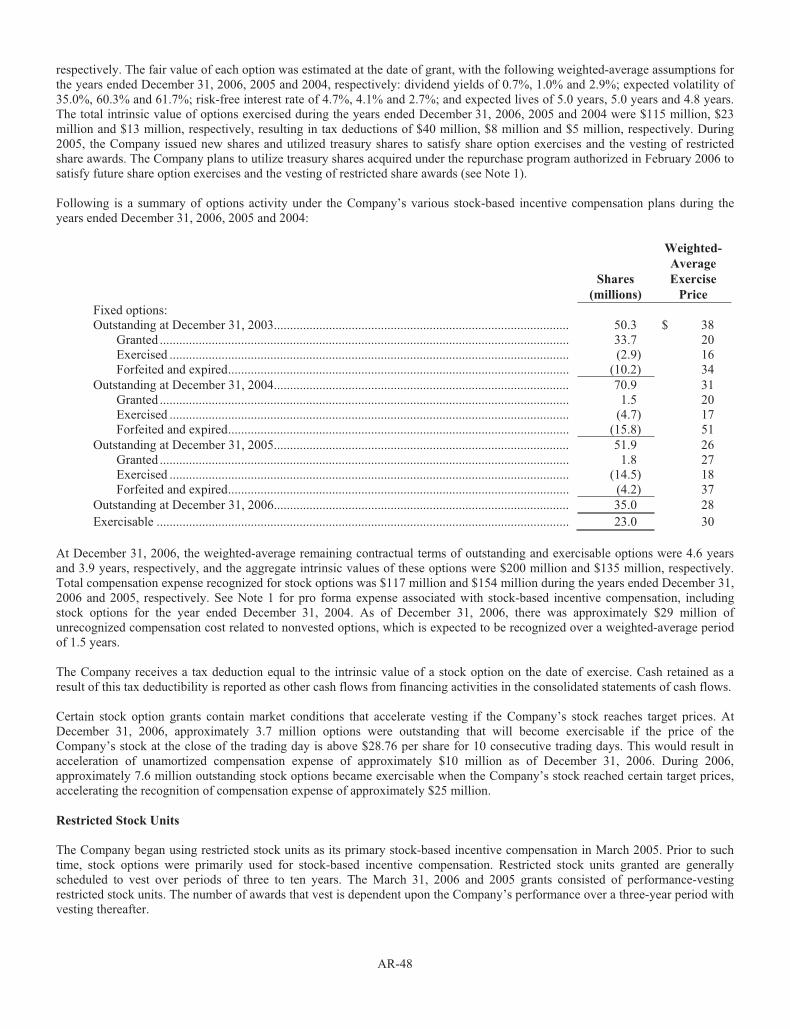
AR-48
respectively. The fair value of each option was estimated at the date of grant, with the following weighted-average assumptions for the years ended December 31, 2006, 2005 and 2004, respectively: dividend yields of 0.7%, 1.0% and 2.9%; expected volatility of 35.0%, 60.3% and 61.7%; risk-free interest rate of 4.7%, 4.1% and 2.7%; and expected lives of 5.0 years, 5.0 years and 4.8 years.The total intrinsic value of options exercised during the years ended December 31, 2006, 2005 and 2004 were $115 million, $23 million and $13 million, respectively, resulting in tax deductions of $40 million, $8 million and $5 million, respectively. During2005, the Company issued new shares and utilized treasury shares to satisfy share option exercises and the vesting of restrictedshare awards. The Company plans to utilize treasury shares acquired under the repurchase program authorized in February 2006 tosatisfy future share option exercises and the vesting of restricted share awards (see Note 1).
Following is a summary of options activity under the Company’s various stock-based incentive compensation plans during the years ended December 31, 2006, 2005 and 2004:
Shares
(millions)
Weighted-
Average
Exercise
Price
Fixed options: Outstanding at December 31, 2003........................................................................................... 50.3 $ 38
Granted .............................................................................................................................. 33.7 20 Exercised ........................................................................................................................... (2.9) 16 Forfeited and expired......................................................................................................... (10.2) 34
Outstanding at December 31, 2004........................................................................................... 70.9 31 Granted .............................................................................................................................. 1.5 20 Exercised ........................................................................................................................... (4.7) 17 Forfeited and expired......................................................................................................... (15.8) 51
Outstanding at December 31, 2005........................................................................................... 51.9 26 Granted .............................................................................................................................. 1.8 27 Exercised ........................................................................................................................... (14.5) 18 Forfeited and expired......................................................................................................... (4.2) 37
Outstanding at December 31, 2006........................................................................................... 35.0 28 Exercisable ............................................................................................................................... 23.0 30
At December 31, 2006, the weighted-average remaining contractual terms of outstanding and exercisable options were 4.6 years and 3.9 years, respectively, and the aggregate intrinsic values of these options were $200 million and $135 million, respectively.Total compensation expense recognized for stock options was $117 million and $154 million during the years ended December 31, 2006 and 2005, respectively. See Note 1 for pro forma expense associated with stock-based incentive compensation, including stock options for the year ended December 31, 2004. As of December 31, 2006, there was approximately $29 million of unrecognized compensation cost related to nonvested options, which is expected to be recognized over a weighted-average period of 1.5 years.
The Company receives a tax deduction equal to the intrinsic value of a stock option on the date of exercise. Cash retained as aresult of this tax deductibility is reported as other cash flows from financing activities in the consolidated statements of cash flows.
Certain stock option grants contain market conditions that accelerate vesting if the Company’s stock reaches target prices. At December 31, 2006, approximately 3.7 million options were outstanding that will become exercisable if the price of the Company’s stock at the close of the trading day is above $28.76 per share for 10 consecutive trading days. This would result inacceleration of unamortized compensation expense of approximately $10 million as of December 31, 2006. During 2006, approximately 7.6 million outstanding stock options became exercisable when the Company’s stock reached certain target prices, accelerating the recognition of compensation expense of approximately $25 million.
Restricted Stock Units
The Company began using restricted stock units as its primary stock-based incentive compensation in March 2005. Prior to such time, stock options were primarily used for stock-based incentive compensation. Restricted stock units granted are generally scheduled to vest over periods of three to ten years. The March 31, 2006 and 2005 grants consisted of performance-vesting restricted stock units. The number of awards that vest is dependent upon the Company’s performance over a three-year period withvesting thereafter.

AR-49
The fair value of each restricted stock unit is generally the market price of the Company’s stock on the date of grant. However, if the shares have a mandatory holding period after the date of vesting, a discount is provided based on the length of the holdingperiod. A discount was applied in determining the fair value of all restricted stock unit awards to adjust for the present value of foregone dividends during the period the award is outstanding and unvested. An additional discount of 10% and 15% was applied during 2006 and 2005, respectively, in determining the fair value of all units subject to transfer restrictions for a one-year period following vesting. This transferability discount was derived based on the value of a one-year average-strike lookback put option.
Following is a summary of the status of the Company’s nonvested restricted stock units as of December 31, 2006, and changes during the years ended December 31, 2006, 2005 and 2004:
Shares
(millions)
Weighted-
Average
Grant Date
Fair Value
Nonvested restricted stock units: Nonvested at December 31, 2003............................................................................................. 4.8 $ 38
Granted .............................................................................................................................. 1.2 22 Vested................................................................................................................................ (2.1) 38 Forfeited ............................................................................................................................ (0.4) 41
Nonvested at December 31, 2004............................................................................................. 3.5 33 Granted .............................................................................................................................. 7.3 19 Vested................................................................................................................................ (1.5) 34 Forfeited ............................................................................................................................ (0.4) 18
Nonvested at December 31, 2005............................................................................................. 8.9 22 Granted .............................................................................................................................. 7.1 25 Vested................................................................................................................................ (1.2) 30 Forfeited ............................................................................................................................ (1.4) 22
Nonvested at December 31, 2006............................................................................................. 13.4 23
As of December 31, 2006, there was approximately $169 million of total unrecognized compensation cost related to nonvested restricted stock units. Such cost is expected to be recognized over a weighted-average period of 1.9 years. Total compensation expense for restricted stock units was $86 million ($59 million net of tax), $64 million ($42 million net of tax) and $42 million ($27 million net of tax), respectively, for the years ended December 31, 2006, 2005 and 2004. The aggregate fair value of sharesvested during the years ended December 31, 2006, 2005 and 2004 were $33 million, $33 million and $41 million, respectively, at the date of vesting, resulting in tax deductions to realize benefits of $10 million, $12 million and $14 million, respectively, as compared to aggregate fair values of $38 million, $52 million and $80 million, respectively, on the dates of their grants.
Executive Deferral Plan
The Executive Deferral Plan is a nonqualified deferred compensation plan established for a select group of management and highlycompensated employees which allows participants to contribute a percentage of their cash compensation and restricted stock unitsinto the plan and defer income taxes until the time of distribution. The plan is a nonqualified plan for U.S. federal income taxpurposes and as such, its assets are part of the Company’s general assets. The Company makes matching contributions on a portionof amounts deferred by plan participants that are invested in EDS stock units. Matching contributions vest upon contribution. Thefair market price of common stock on the date of matching contributions is charged to operations in the period made. The Company also makes discretionary contributions that vest over periods up to five years as determined by the Board of Directors.The fair market price of common stock on the date of discretionary contributions is charged to operations over the vesting period. During the years ended December 31, 2006, 2005 and 2004, employer contributions to the plan were 4 thousand, 31 thousand and 37 thousand shares, respectively, with a weighted-average fair value of $24.06, $23.13 and $23.10, respectively.
During September 2006, the Company granted 150 thousand time-vesting deferred stock units and 150 thousand performance-based deferred stock units to an employee each with a grant date fair value of $22.97 per unit. The grant date fair value of deferred stock units is determined using the same method as restricted stock units. The time-vesting units and performance-based units arescheduled to vest in September 2009. The number of performance-based deferred stock units that will vest will be from 0-200% ofthe number of units granted, and is dependent upon the Company’s achievement of certain financial performance metrics over a three-year performance period and the employee’s continued employment. The Company estimates the number of units that will vest based on the Company’s financial performance since inception of the performance period and current expectations of the Company’s future financial performance over the remainder of the performance period. Compensation expense for units is recorded on a straight-line basis over the vesting period. Cumulative compensation expense for each grant is adjusted in the period

AR-50
in which there is a change in the estimated number of units that will vest. As of December 31, 2006, there was approximately $6million of total unrecognized compensation cost related to the 300 thousand nonvested deferred stock units. Such cost is expectedto be recognized over a period of 2.7 years. Total compensation expense for deferred stock units was $766 thousand ($498 thousand net of tax) for the year ended December 31, 2006.
NOTE 12: SEGMENT INFORMATION
The Company uses operating income (loss) to measure segment profit or loss. Segment information for non-U.S. operations is measured using fixed currency exchange rates in all periods presented. The Company adjusts its fixed currency exchange rates ifand when the statutory rate differs significantly from the fixed rate to better align the two rates. Prior period segment information presented below has been restated to reflect a change in the fixed exchange rates of certain non-U.S. currencies and other segmentattribute changes in 2006. The Asia Pacific segment includes the operations of MphasiS Limited, of which the Company acquired a controlling interest (approximately 51%) on June 20, 2006, and the Company’s other EDS India operations which collectively represented $139 million in revenues and $20 million in operating income for the year ended December 31, 2006. The “all other” category is primarily comprised of corporate expenses, including stock-based compensation, and also includes differences betweenfixed and actual exchange rates. Operating segments that have similar economic and other characteristics have been aggregated toform the Company’s reportable segments. The accompanying segment information excludes the net results of A.T. Kearney which are included in discontinued operations in the consolidated statements of operations (see Note 17). The results of the NMCI contract are included in the U.S. Government segment.
Following is a summary of certain financial information by reportable segment as of and for the years ended December 31, 2006, 2005 and 2004 (in millions):
2006
Revenues
Operating
Income
(Loss)
Total
Assets
Americas............................................................................................................. $ 9,588 $ 1,509 $ 4,351 EMEA................................................................................................................. 6,448 945 3,335 Asia Pacific......................................................................................................... 1,479 173 1,000 U.S. Government ................................................................................................ 3,350 618 1,350 Other ................................................................................................................... 23 (642) 2,070
Total Outsourcing........................................................................................ 20,888 2,603 12,106 All other.............................................................................................................. 380 (1,787) 5,848
Total ............................................................................................................ $ 21,268 $ 816 $ 17,954
2005
Revenues
Operating
Income
(Loss)
Total
Assets
Americas............................................................................................................. $ 9,239 $ 1,353 $ 4,261 EMEA................................................................................................................. 5,935 818 3,569 Asia Pacific......................................................................................................... 1,377 103 529 U.S. Government ................................................................................................ 2,842 305 1,441 Other ................................................................................................................... 22 (533) 1,993
Total Outsourcing........................................................................................ 19,415 2,046 11,793 All other.............................................................................................................. 342 (1,504) 5,294
Total ............................................................................................................ $ 19,757 $ 542 $ 17,087
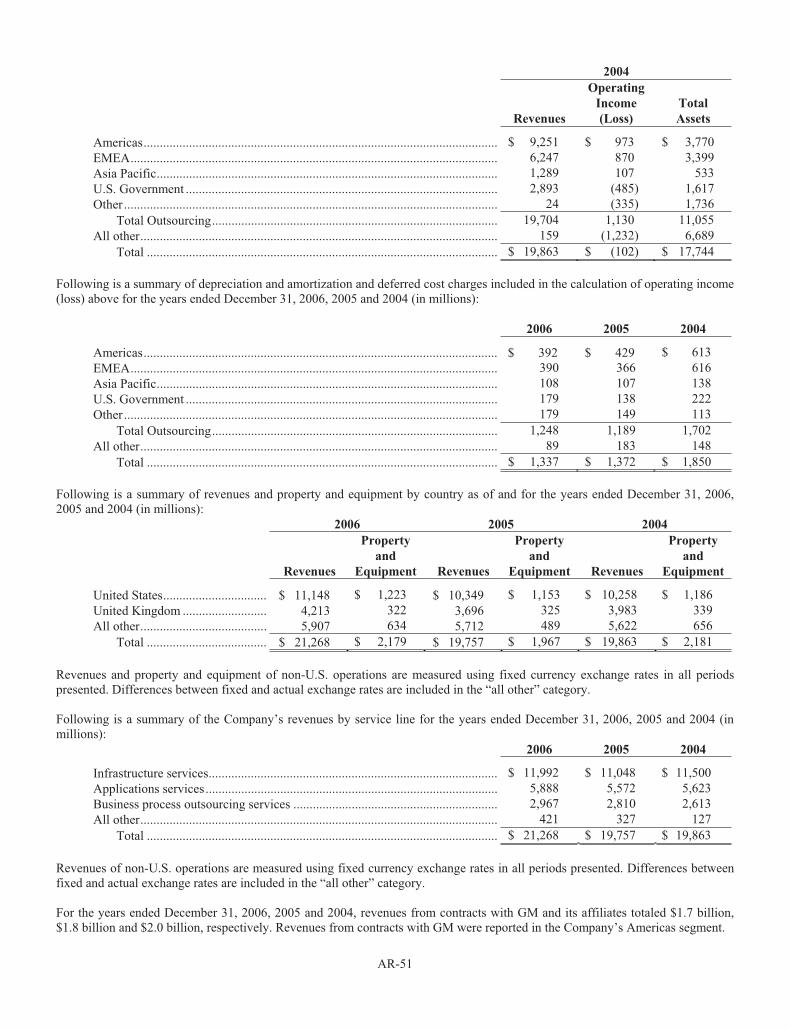
AR-51
2004
Revenues
Operating
Income
(Loss)
Total
Assets
Americas............................................................................................................. $ 9,251 $ 973 $ 3,770 EMEA................................................................................................................. 6,247 870 3,399 Asia Pacific......................................................................................................... 1,289 107 533 U.S. Government ................................................................................................ 2,893 (485) 1,617 Other ................................................................................................................... 24 (335) 1,736
Total Outsourcing........................................................................................ 19,704 1,130 11,055 All other.............................................................................................................. 159 (1,232) 6,689
Total ............................................................................................................ $ 19,863 $ (102) $ 17,744
Following is a summary of depreciation and amortization and deferred cost charges included in the calculation of operating income (loss) above for the years ended December 31, 2006, 2005 and 2004 (in millions):
2006 2005 2004
Americas............................................................................................................. $ 392 $ 429 $ 613 EMEA................................................................................................................. 390 366 616 Asia Pacific......................................................................................................... 108 107 138 U.S. Government ................................................................................................ 179 138 222 Other ................................................................................................................... 179 149 113
Total Outsourcing........................................................................................ 1,248 1,189 1,702 All other.............................................................................................................. 89 183 148
Total ............................................................................................................ $ 1,337 $ 1,372 $ 1,850
Following is a summary of revenues and property and equipment by country as of and for the years ended December 31, 2006, 2005 and 2004 (in millions):
2006 2005 2004
Revenues
Property
and
Equipment Revenues
Property
and
Equipment Revenues
Property
and
Equipment
United States................................ $ 11,148 $ 1,223 $ 10,349 $ 1,153 $ 10,258 $ 1,186 United Kingdom .......................... 4,213 322 3,696 325 3,983 339 All other....................................... 5,907 634 5,712 489 5,622 656
Total ..................................... $ 21,268 $ 2,179 $ 19,757 $ 1,967 $ 19,863 $ 2,181
Revenues and property and equipment of non-U.S. operations are measured using fixed currency exchange rates in all periods presented. Differences between fixed and actual exchange rates are included in the “all other” category.
Following is a summary of the Company’s revenues by service line for the years ended December 31, 2006, 2005 and 2004 (in millions):
2006 2005 2004
Infrastructure services......................................................................................... $ 11,992 $ 11,048 $ 11,500 Applications services.......................................................................................... 5,888 5,572 5,623 Business process outsourcing services ............................................................... 2,967 2,810 2,613 All other.............................................................................................................. 421 327 127
Total ............................................................................................................ $ 21,268 $ 19,757 $ 19,863
Revenues of non-U.S. operations are measured using fixed currency exchange rates in all periods presented. Differences between fixed and actual exchange rates are included in the “all other” category.
For the years ended December 31, 2006, 2005 and 2004, revenues from contracts with GM and its affiliates totaled $1.7 billion, $1.8 billion and $2.0 billion, respectively. Revenues from contracts with GM were reported in the Company’s Americas segment.

AR-52
NOTE 13: RETIREMENT PLANS
The Company has several qualified and nonqualified pension plans (the “Plans”) covering substantially all its employees. The majority of the Plans are noncontributory. In general, employees become fully vested upon attaining two to five years of service,and benefits are based on years of service and earnings. The actuarial cost method currently used is the projected unit credit cost method. The Company’s U.S. funding policy is to contribute amounts that fall within the range of deductible contributions for U.S. federal income tax purposes.
Following is a reconciliation of the changes in the Plans’ benefit obligations and fair value of assets (using October 31, 2006 and 2005 measurement dates), and a statement of the funded status as of December 31, 2006 and 2005 (in millions):
2006 2005
Reconciliation of Benefit Obligation:
Benefit obligation at beginning of year .................................................................................... $ 8,310 $ 7,837 Service cost........................................................................................................................ 354 344 Interest cost........................................................................................................................ 471 456 Employee contributions..................................................................................................... 25 33 Actuarial loss..................................................................................................................... 81 532 Curtailments and settlements............................................................................................. (69) (280) Plan amendments............................................................................................................... (57) – Business divestitures ......................................................................................................... (46) – Foreign currency exchange rate changes........................................................................... 500 (441) Benefit payments ............................................................................................................... (237) (223) Special termination benefit................................................................................................ – 15 Other.................................................................................................................................. 28 37
Benefit obligation at end of year .............................................................................................. 9,360 8,310
Reconciliation of Fair Value of Plan Assets:
Fair value of plan assets at beginning of year........................................................................... 6,404 5,895 Actual return on plan assets............................................................................................... 1,185 912 Foreign currency exchange rate changes........................................................................... 355 (289) Employer contributions ..................................................................................................... 248 324 Employee contributions..................................................................................................... 25 33 Benefit payments ............................................................................................................... (237) (223) Business divestitures ......................................................................................................... (66) – Settlements ........................................................................................................................ (18) (270) Other.................................................................................................................................. 14 22
Fair value of plan assets at end of year..................................................................................... 7,910 6,404 Funded status at end of year ..................................................................................................... (1,450) (1,906)
Unrecognized transition obligation ................................................................................... – 9 Unrecognized prior service cost ........................................................................................ – (185) Unrecognized net actuarial loss ......................................................................................... – 1,686 Adjustments from October 31 to December 31 ................................................................. 112 120
$ (1,338) $ (276)

AR-53
Following is a summary of the amounts reflected on the Company’s consolidated balance sheets for pension benefits as of December 31, 2006 and 2005 (in millions):
2006 2005
Prepaid benefit cost .................................................................................................................. $ 86 $ 53 Intangible asset ......................................................................................................................... – 19 Current liability ........................................................................................................................ (36) – Long-term liability.................................................................................................................... (1,388) (1,183) Minimum pension liability ....................................................................................................... – 835
$ (1,338) $ (276)
Following is a summary of amounts in accumulated other comprehensive loss as of December 31, 2006 and 2005 that have not yet been recognized in the consolidated statements of operations as components of net periodic benefit cost (in millions):
2006 2005
Net actuarial loss ...................................................................................................................... $ 1,199 $ – Prior service credit.................................................................................................................... (213) – Transition obligation................................................................................................................. 7 – Minimum pension liability ....................................................................................................... – 835
$ 993 $ 835
The tables above include plans that transitioned to A.T. Kearney in January 2006 (see Note 17). The pension benefit liabilitiesrelated to these plans are presented in the consolidated balance sheets as “held for sale” and was $26 million at December 31, 2005. Settlement gains of $23 million were recognized in 2006 for these plans. The projected benefit obligation, accumulated benefit obligation, and fair value of plan assets for these plans were $63 million, $54 million and $61 million, respectively, atDecember 31, 2005. Net periodic benefit cost for these plans was $8 million and $7 million, respectively, for the years ended December 31, 2005 and 2004.
The Company has additional defined benefit retirement plans outside the U.S. not included in the tables above due to their individual insignificance. These plans collectively represent an additional pension benefit liability of approximately $16 millionand plan assets of approximately $4 million.
The accumulated benefit obligation for all defined benefit pension plans was $8,513 million and $7,542 million at October 31, 2006 and 2005, respectively. The projected benefit obligation and fair value of plan assets for pension plans with projected benefit obligations in excess of plan assets were $8,713 million and $7,251 million, respectively, at December 31, 2006, and $7,933 million and $5,971 million, respectively, at December 31, 2005. The projected benefit obligation, accumulated benefit obligation, and fair value of plan assets for pension plans with accumulated benefit obligations in excess of plan assets were $3,326 million,$2,795 million and $1,995 million, respectively, at December 31, 2006, and $7,624 million, $6,963 million and $5,721 million, respectively, at December 31, 2005.
Following is a summary of the components of net periodic benefit cost recognized in the consolidated statements of operations for the years ended December 31, 2006, 2005 and 2004 (in millions):
2006 2005 2004
Service cost......................................................................................................... $ 354 $ 344 $ 321 Interest cost......................................................................................................... 471 456 413 Expected return on plan assets............................................................................ (555) (522) (440) Amortization of transition obligation ................................................................. 2 2 2 Amortization of prior-service cost...................................................................... (36) (32) (32) Amortization of net actuarial loss....................................................................... 83 55 66
Net periodic benefit cost.............................................................................. 319 303 330 Curtailment (gain) loss ....................................................................................... (5) 1 3 Special termination benefit ................................................................................. – 15 48 Settlement (gain) loss ......................................................................................... (57) 71 2
Net periodic benefit cost after curtailments and settlements ....................... $ 257 $ 390 $ 383
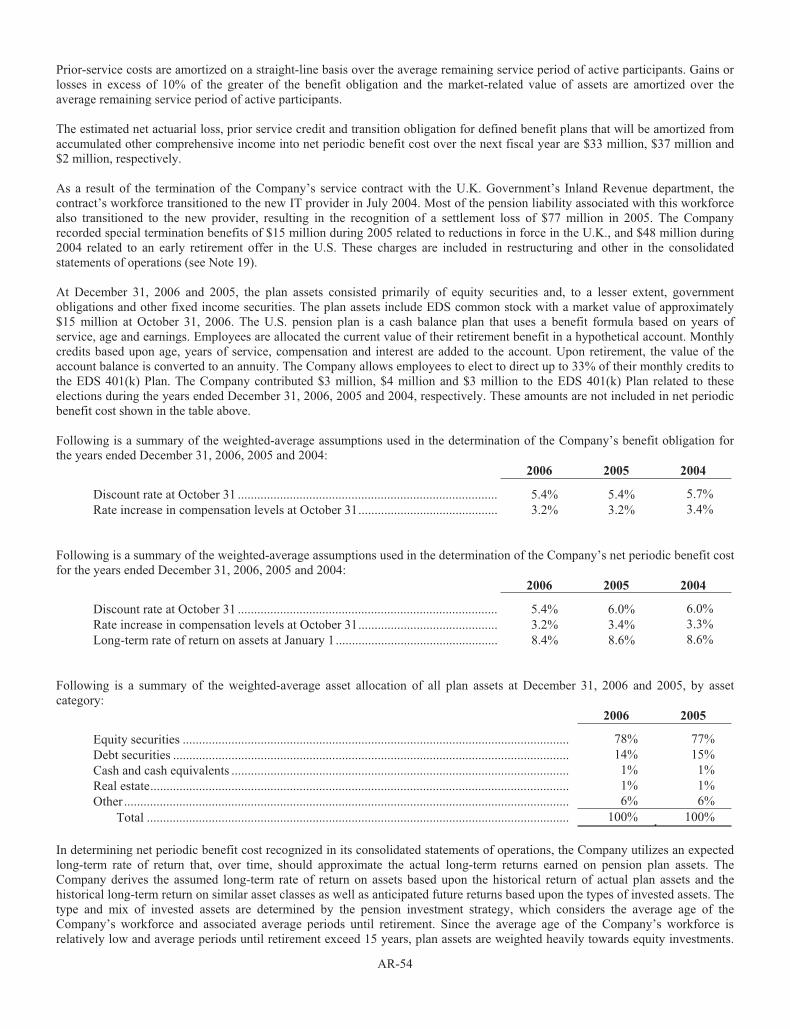
AR-54
Prior-service costs are amortized on a straight-line basis over the average remaining service period of active participants. Gains or losses in excess of 10% of the greater of the benefit obligation and the market-related value of assets are amortized over the average remaining service period of active participants.
The estimated net actuarial loss, prior service credit and transition obligation for defined benefit plans that will be amortized from accumulated other comprehensive income into net periodic benefit cost over the next fiscal year are $33 million, $37 million and$2 million, respectively.
As a result of the termination of the Company’s service contract with the U.K. Government’s Inland Revenue department, the contract’s workforce transitioned to the new IT provider in July 2004. Most of the pension liability associated with this workforce also transitioned to the new provider, resulting in the recognition of a settlement loss of $77 million in 2005. The Company recorded special termination benefits of $15 million during 2005 related to reductions in force in the U.K., and $48 million during 2004 related to an early retirement offer in the U.S. These charges are included in restructuring and other in the consolidatedstatements of operations (see Note 19).
At December 31, 2006 and 2005, the plan assets consisted primarily of equity securities and, to a lesser extent, government obligations and other fixed income securities. The plan assets include EDS common stock with a market value of approximately $15 million at October 31, 2006. The U.S. pension plan is a cash balance plan that uses a benefit formula based on years of service, age and earnings. Employees are allocated the current value of their retirement benefit in a hypothetical account. Monthly credits based upon age, years of service, compensation and interest are added to the account. Upon retirement, the value of theaccount balance is converted to an annuity. The Company allows employees to elect to direct up to 33% of their monthly credits to the EDS 401(k) Plan. The Company contributed $3 million, $4 million and $3 million to the EDS 401(k) Plan related to these elections during the years ended December 31, 2006, 2005 and 2004, respectively. These amounts are not included in net periodicbenefit cost shown in the table above.
Following is a summary of the weighted-average assumptions used in the determination of the Company’s benefit obligation for the years ended December 31, 2006, 2005 and 2004:
2006 2005 2004
Discount rate at October 31 ................................................................................ 5.4% 5.4% 5.7% Rate increase in compensation levels at October 31........................................... 3.2% 3.2% 3.4%
Following is a summary of the weighted-average assumptions used in the determination of the Company’s net periodic benefit costfor the years ended December 31, 2006, 2005 and 2004:
2006 2005 2004
Discount rate at October 31 ................................................................................ 5.4% 6.0% 6.0% Rate increase in compensation levels at October 31........................................... 3.2% 3.4% 3.3% Long-term rate of return on assets at January 1.................................................. 8.4% 8.6% 8.6%
Following is a summary of the weighted-average asset allocation of all plan assets at December 31, 2006 and 2005, by asset category:
2006 2005
Equity securities ....................................................................................................................... 78% 77% Debt securities .......................................................................................................................... 14% 15% Cash and cash equivalents ........................................................................................................ 1% 1% Real estate................................................................................................................................. 1% 1% Other ......................................................................................................................................... 6% 6%
Total .................................................................................................................................. 100% 100%
In determining net periodic benefit cost recognized in its consolidated statements of operations, the Company utilizes an expectedlong-term rate of return that, over time, should approximate the actual long-term returns earned on pension plan assets. The Company derives the assumed long-term rate of return on assets based upon the historical return of actual plan assets and the historical long-term return on similar asset classes as well as anticipated future returns based upon the types of invested assets. The type and mix of invested assets are determined by the pension investment strategy, which considers the average age of the Company’s workforce and associated average periods until retirement. Since the average age of the Company’s workforce is relatively low and average periods until retirement exceed 15 years, plan assets are weighted heavily towards equity investments.

AR-55
Equity investments, while susceptible to significant short-term fluctuations, have historically outperformed most other investment alternatives on a long-term basis. The Company utilizes an active management strategy through third-party investment managers to maximize asset returns. As of December 31, 2006, the weighted-average target asset allocation for all plans was 78% equity; 15% fixed income; 1% real estate; and 6% other. The Company expects to contribute approximately $100 million to its pension plans during fiscal year 2007, including discretionary and statutory contributions.
Estimated benefit payments, which include amounts to be earned by active plan employees through expected future service for allpension plans over the next 10 years are: 2007 – $257 million; 2008 – $222 million; 2009 – $241 million; 2010 – $262 million; 2011 – $328 million; and 2012 through 2016 – $1,934 million.
In addition to the plans described above, the EDS 401(k) Plan provides a long-term savings program for participants. The EDS 401(k) Plan allows eligible employees to contribute a percentage of their compensation to a savings program and to defer incometaxes until the time of distribution. Participants may invest their contributions in various publicly traded investment funds or EDS common stock. The EDS 401(k) Plan also provides for employer-matching contributions. Until December 31, 2006, employer contributions were made in the form of EDS common stock, which participants could elect to transfer to another investment optionwithin the EDS 401(k) Plan after two years from the date of contribution. Participants were 40% vested in the employer-matchingcontributions after two years of service, vested another 20% per year of service thereafter, and were fully vested after five years of service. Beginning January 1, 2007, participants’ employer-matching contributions follow the investment allocation of their salary deferrals. Participants will be 40% vested after two years of service, and 100% vested after three years of service. Participants with more than three but less than five years of service at January 1, 2007 will be fully vested at that date. Participants with more than two but less than three years of service at January 1, 2007 will fully vest after three years of service. Participants hired after January 1, 2007 will fully vest after three years of service. During the years ended December 31, 2006, 2005 and 2004, employer-matching contributions totaled $40 million, $37 million and $40 million, respectively.
NOTE 14: COMMITMENTS AND RENTAL EXPENSE
Total rentals under cancelable and non-cancelable leases of tangible property and equipment included in costs and charged to expenses were $557 million, $552 million and $580 million for the years ended December 31, 2006, 2005 and 2004, respectively. Commitments for rental payments under non-cancelable operating leases of tangible property and equipment net of sublease rentalincome are: 2007 – $343 million; 2008 – $300 million; 2009 – $217 million; 2010 – $166 million; 2011 – $122 million; and all years thereafter – $368 million.
The Company has signed certain service agreements with terms of up to ten years with certain vendors to obtain favorable pricingand commercial terms for services that are necessary for the ongoing operation of its business. These agreements relate to software and telecommunications services. Under the terms of these agreements, the Company has committed to contractually specified minimums over the contractual periods. The contractual minimums are: 2007 – $1,318 million; 2008 – $609 million; 2009 – $372 million; 2010 – $251 million; 2011 – $47 million; and all years thereafter – $2 million. Amounts paid under these agreements were$1,452 million, $991 million and $821 million during the years ended December 31, 2006, 2005 and 2004, respectively. To the extent that the Company does not purchase the contractual minimum amount of services, the Company must pay the vendors the shortfall. The Company believes that it will meet the contractual minimums through the normal course of business.
NOTE 15: CONTINGENCIES
In connection with certain service contracts, the Company may arrange a client supported financing transaction (“CSFT”) with a client and an independent third-party financial institution or its designee. Under CSFT arrangements, the financial institutionfinances the purchase of certain IT-related assets and simultaneously leases those assets for use in connection with the servicecontract.
In a CSFT, all client contract payments are made directly to the financial institution providing the financing. After the predetermined monthly obligations to the financial institution are met, the remaining portion of the customer payment is made available to the Company. If the client does not make the required payments under the service contract, under no circumstances does the Company have any obligation to acquire the underlying assets unless nonperformance under the service contract would permit its termination, or the Company fails to comply with certain customary terms under the financing agreements, including, for example, covenants the Company has undertaken regarding the use of the assets for their intended purpose. The Company considers the likelihood of its failure to comply with any of these terms to be remote. In the event of nonperformance under applicable contracts which would permit their termination, the Company would have no additional or incremental performance risk with respect to the ownership of the assets, because it would have owned or leased the same or substantially equivalent assets in order to fulfill its obligations under its service contracts. Performance under the Company’s service contracts is generallymeasured by contract terms relating to project deadlines, IT system deliverables or level-of-effort measurements.

AR-56
As of December 31, 2006, an aggregate of $136 million was outstanding under CSFTs yet to be paid by the Company’s clients. The Company believes it is in compliance with performance obligations under all service contracts for which there is a related CSFT and the ultimate liability, if any, incurred in connection with such financings will not have a material adverse affect on its consolidated results of operations or financial position.
In the normal course of business, the Company may provide certain clients, principally governmental entities, with financial performance guarantees, which are generally backed by standby letters of credit or surety bonds. In general, the Company would only be liable for the amounts of these guarantees in the event that nonperformance by the Company permits termination of the related contract by the Company’s client, which the Company believes is remote. At December 31, 2006, the Company had $574 million outstanding standby letters of credit and surety bonds relating to these performance guarantees. The Company believes it is in compliance with its performance obligations under all service contracts for which there is a financial performance guarantee,and the ultimate liability, if any, incurred in connection with these guarantees will not have a material adverse affect on itsconsolidated results of operations or financial position. In addition, the Company had $19 million of other financial guaranteesoutstanding at December 31, 2006 relating to indebtedness of others.
At December 31, 2006, the Company had net deferred contract and set-up costs of $807 million, of which $487 million related to 20 contracts with active construct activities. These active construct contracts had other assets, including receivables, prepaid expenses, equipment and software, of $574 million at December 31, 2006. Some of the Company’s client contracts require significant investment in the early stages which is expected to be recovered through billings over the life of the respective contracts. These contracts often involve the construction of new computer systems and communications networks and the development and deployment of new technologies. Substantial performance risk exists in each contract with these characteristics,and some or all elements of service delivery under these contracts are dependent upon successful completion of the development,construction and deployment phases. Some of these contracts have experienced delays in their development and construction phases, and certain milestones have been missed. It is reasonably possible that deferred costs associated with one or more of thesecontracts could become impaired due to changes in estimates of future contract cash flows.
The Company provides IT services to Delphi Corporation (“Delphi”) through a long-term agreement. On October 8, 2005, Delphi filed for protection under Chapter 11 of the United States Bankruptcy Code. Due to uncertainties regarding the recoverability ofcertain pre-bankruptcy receivables associated with the Delphi contract, the Company recorded receivable reserves of $17 millionduring the year ended December 31, 2005. This amount is reflected in cost of revenues in the Company’s 2005 consolidated statements of operations. The Company recognized revenues of approximately $150 million under the Delphi services agreement during the year ended December 31, 2006. Total receivables outstanding under the Delphi agreement were $43 million at December 31, 2006. In addition, the Company had equipment and other assets with a net book value of approximately $18 million at December 31, 2006 deployed on the Delphi agreement. The assets associated with the Company’s agreement with Delphi are expected to be recovered through collection or future operations.
The Company has received tax assessments from various taxing authorities and is currently at varying stages of appeals regardingthese matters. The Company has provided for the amounts it believes will ultimately result from those proceedings. In June 2006,the Company agreed with the U.S. Internal Revenue Services (“IRS”) on a settlement related to research tax credits for years 1996-2002 and the closure of the audit of its 1996-1998 federal income tax returns. In February 2007, the Company reached a tentativeagreement with the Appeals Office of the IRS for all outstanding issues for the period 1999-2002 consistent with the Company’s tax reserves as of December 31, 2006.
Pending Litigation and Proceedings
The Company and certain of its former officers are defendants in numerous shareholder class action suits filed from September through December 2002 in response to its September 18, 2002 earnings pre-announcement, publicity about certain equity hedging transactions that it had entered into, and the drop in the price of EDS common stock. The cases allege violations of various federal securities laws and common law fraud based upon purported misstatements or omissions of material facts regarding the Company’s financial condition. In addition, five class action suits were filed on behalf of participants in the EDS 401(k) Planagainst the Company, certain of its current and former officers and, in some cases, its directors, alleging the defendants breached their fiduciary duties under the Employee Retirement Income Security Act (“ERISA”) and made misrepresentations to the class regarding the value of EDS shares. All of the foregoing cases have been centralized in the U.S. District Court for the Eastern District of Texas (the “District Court”). In addition, representatives of two committees responsible for administering the EDS 401(k) Plan notified the Company of their demand for payment of amounts they believe are owing to plan participants under Section 12(a)(1) of the Securities Act of 1933 (the “Securities Act”) as a result of an alleged failure to register certain shares of EDS common stock sold pursuant to the plan during a period of approximately one year ending on November 18, 2002.

AR-57
On July 7, 2003, the lead plaintiff in the consolidated securities action and the lead plaintiffs in the consolidated ERISA action each filed a consolidated class action complaint. The amended consolidated complaint in the securities action alleges violations of Section 10(b) of the Securities Exchange Act of 1934 (the “Exchange Act”), Rule 10b-5 thereunder and Section 20(a) of the Exchange Act. The plaintiffs allege that the Company and certain of its former officers made false and misleading statements about the financial condition of EDS, particularly with respect to the NMCI contract and the accounting for that contract. The consolidated complaint in the ERISA action alleges violation of fiduciary duties under ERISA by some or all of the defendants and violation of Section 12(a)(1) of the Securities Act by selling unregistered EDS shares to plan participants. The defendants in the ERISA claims are EDS, certain current and former officers of EDS, members of the Compensation and Benefits Committee of its Board of Directors, and certain current and former members of the two committees responsible for administering the plan.
On November 1, 2005, the Company entered into a memorandum of understanding with the lead plaintiff and class representative to settle the consolidated securities action, subject to final approval of the settlement by the District Court. The District Court approved that settlement on March 7, 2006. The terms of the settlement provide for a cash payment of $137.5 million, substantially all of which was paid during the first quarter of 2006. The amount paid by the Company aggregated $77.5 million, with the remainder paid by its insurers (in addition to amounts paid by such insurers in respect of legal fees related to this action). The Company recorded incremental reserves of $24 million in 2005 in connection with this settlement. The remaining cost of the settlement was recognized in the Company’s financial statements prior to 2004. Two appeals have been filed with respect to the District Court’s approval of this settlement. One appeal challenges the amount of attorneys fees awarded to the counsel for plaintiffs. The other appeal challenges the approval of the settlement on the grounds that there is a subclass who receives no economic benefit, the release is overbroad, and the claims form was overly burdensome.
On November 8, 2004, the District Court certified a class in the ERISA action on certain of the allegations of breach of fiduciary duty, of all participants in the EDS 401(k) Plan and their beneficiaries, excluding the defendants, for whose accounts the planmade or maintained investments in EDS stock through the EDS Stock Fund between September 7, 1999 and October 9, 2002. Also on that date the court certified a class in the ERISA action on the allegations of violation of Section 12(a)(1) of the Securities Act of all participants in the Plan and their beneficiaries, excluding the defendants, for whose accounts the Plan purchased EDS stock through the EDS Stock Fund between October 20, 2001 and November 18, 2002. On December 29, 2004, the Fifth Circuit Court of Appeal granted the Company’s petition to appeal the class certification order from the District Court, and oral arguments were heard on the appeal on April 5, 2005. On January 18, 2007, the Fifth Circuit Court of Appeal issued its decision vacating the district court’s class certification decision and remanding the matter to the district court to re-evaluate whether the action may be maintained as a class certification in light of the Fifth Circuit’s opinion and instructions. The Company intends to defend thisaction vigorously.
In addition, there are three derivative complaints filed by shareholders in the District Court of Collin County, Texas against certain current and former Company directors and officers and naming EDS as a nominal defendant. The actions allege breach of fiduciary duties, abuse of control and gross mismanagement based upon purported misstatements or omissions of material facts regarding the Company’s financial condition similar to those raised in the class actions described above. These cases have beenconsolidated into a single action. This action will be defended vigorously.
On February 25, 2004, a derivative complaint was filed by a shareholder against certain current and former directors and officersof the Company in the District Court. The plaintiff relies upon substantially the same factual allegations as the consolidated securities action discussed above. However, the plaintiff brings the suit on behalf of the Company against the named defendantsclaiming that they breached their fiduciary duties by failing in their oversight responsibilities and by making and/or permittingmaterial, false and misleading statements to be made concerning the Company’s business prospects, financial condition and expected financial results which artificially inflated its stock and resulted in numerous class action suits. Plaintiff seeks contribution and indemnification for the claims and litigation resulting from the defendants’ alleged breach of their fiduciaryduties. This action had been stayed pending the outcome of the consolidated securities action. On March 13, 2006, the District Court filed an order lifting the stay in this action based upon that court’s final approval of the settlement of the consolidated securities action. This action will be defended vigorously.
In October 2004, two derivative complaints were filed in the District Court by shareholders against certain current and former directors and officers of the Company. The allegations against the Company include breach of fiduciary duties, abuse of control,gross mismanagement, constructive fraud, waste and unjust enrichment based upon purported misstatements or omissions of material facts regarding the Company’s financial condition similar to those raised in the class actions described above. Plaintiffsseek damages, disgorgement by individual defendants, governance reforms, and punitive damages. The actions had also been stayed pending resolution of the above referenced securities action. On March 13, 2006, the District Court filed an order lifting the stay in this action based upon that court’s final approval of the settlement of the consolidated securities action. These actions will be defended vigorously.

AR-58
The Company does not expect these actions to have a material adverse impact on its consolidated results of operations or financial position.
The SEC staff is conducting a formal investigation of matters relating to the Company’s derivatives contracts in connection withits program to manage the future stock issuance requirements of its employee stock incentive plans, the Company’s NMCI contract, a contract with a client of the Company that contained a prepayment provision, and the Company’s guidance and other events leading up to its third quarter 2002 earnings announcement. The SEC has deposed current and former members of the Company’s management and the NMCI account team as well as other witnesses regarding these issues. The SEC staff is also investigating allegations that a former employee working in India for a branch of a former subsidiary of the Company made questionable payments allegedly to further that entity’s business in India, a matter which the Company self-reported to the SECstaff and other relevant governmental authorities. In 2004, the Company voluntarily reported to the SEC staff a matter regardingpayments made and credits given by the Company to Delphi during 2000 and 2001 and certain payments made by Delphi to the Company for services in 2002 and in early 2003. In October 2006, the SEC filed a lawsuit against Delphi, former Delphi personneland other persons not employed by Delphi, including one current and two former employees of the Company, alleging violations of securities laws related to these and other matters. The lawsuit was simultaneously settled by Delphi and certain of the otherpersons charged by the SEC, including the two former employees of the Company. The Company was not charged in this lawsuit.
In February 2007, the Company reached an agreement with the Division of Enforcement of the SEC (the “Division”) as to the terms of a proposed settlement that the Division has agreed to recommend to other SEC staff offices and to the Commissioners ofthe SEC for their approval. The proposed settlement would resolve all matters under investigation by the SEC related to the Company. Such settlement, if approved by the SEC, would not have a material adverse impact upon the Company. However the Division has no authority to bind the Commission to any settlement. The Commissioners of the SEC are not obligated to accept therecommendation of the Division and may approve or disapprove this settlement. Accordingly, the Company is unable to predict the ultimate outcome of the investigation or any action the SEC might ultimately take.
On December 19, 2003, Sky Subscribers Services Limited (“SSSL”) and British Sky Broadcasting Limited (“BSkyB”), a former client of the Company, served a draft pleading seeking redress for the Company’s alleged failure to perform pursuant to a contractbetween the parties. Under applicable legal procedures, the Company responded to the allegations. Despite the response, on August 17, 2004, SSSL and BSkyB issued and served upon the Company a pleading alleging the following damages, each presented as an alternative cause of action: (1) pre-contract deceit in 2000 in the amount of £320 million (approximately $630 million); (2) pre-contract negligent misrepresentation in 2000 in the amount of £127 million (approximately $250 million); (3) deceit inducing the Letter of Agreement in July 2001 in the amount of £261 million (approximately $510 million); (4) negligent misrepresentation inducing the Letter of Agreement in July 2001 in the amount of £116 million (approximately $230 million); and,(5) breach of contract from 2000 through 2002 in the amount of £101 million (approximately $200 million). On November 12, 2004, the Company filed its defense and counterclaim denying the claims and seeking damages in the amount of £4.7 million (approximately $9.2 million). On December 21, 2005, SSSL and BSkyB filed a Re-Amended Particulars of Claim alleging the following damages, still as alternative causes of action: (1) pre-contract deceit in the amount of £480 million (approximately $940 million); (2) pre-contract negligent misrepresentation in the amount of £480 million (approximately $940 million); (3) deceit inducing the Letter of Agreement and negligent misrepresentation inducing the Letter of Agreement of £415 million (approximately $810 million); (4) breach of contract in the amount of £179 million (approximately $350 million). The principal stated reason for the increases in amount of damages is that the claimants have now taken the opportunity to re-assess their alleged lost profits and increased costs to deliver the project in light of the extended timetable they now require. Claimants say they will further re-assess these alleged losses prior to trial. The dispute surrounds a contract the Company entered into with BSkyB in November 2000, which was terminated by the Company in January 2003 for BSkyB’s failure to pay its invoices. The contract had an initial total contract value of approximately £61 million. The Company intends to defend against these allegations vigorously.Discovery is ongoing in this matter and trial is scheduled for October 2007. Although there can be no assurance as to the outcome of this matter, the Company does not believe it will have a material adverse impact on its consolidated results or financial position.
There are other various claims and pending actions against the Company arising in the ordinary course of its business. Certain of these actions seek damages in significant amounts. The amount of the Company’s liability for such claims and pending actions atDecember 31, 2006 was not determinable. However, in the opinion of management, the ultimate liability, if any, resulting from such claims and pending actions will not have a material adverse affect on the Company’s consolidated results of operations or financial position.
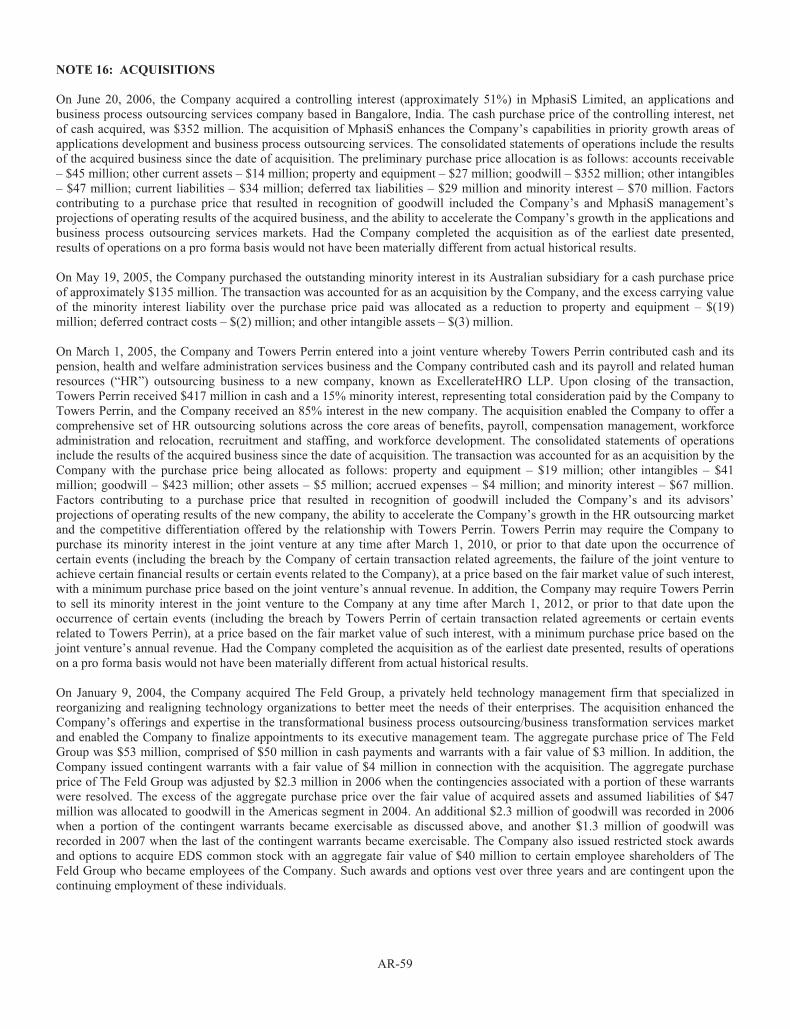
AR-59
NOTE 16: ACQUISITIONS
On June 20, 2006, the Company acquired a controlling interest (approximately 51%) in MphasiS Limited, an applications and business process outsourcing services company based in Bangalore, India. The cash purchase price of the controlling interest, net of cash acquired, was $352 million. The acquisition of MphasiS enhances the Company’s capabilities in priority growth areas of applications development and business process outsourcing services. The consolidated statements of operations include the resultsof the acquired business since the date of acquisition. The preliminary purchase price allocation is as follows: accounts receivable – $45 million; other current assets – $14 million; property and equipment – $27 million; goodwill – $352 million; other intangibles – $47 million; current liabilities – $34 million; deferred tax liabilities – $29 million and minority interest – $70 million. Factorscontributing to a purchase price that resulted in recognition of goodwill included the Company’s and MphasiS management’s projections of operating results of the acquired business, and the ability to accelerate the Company’s growth in the applications and business process outsourcing services markets. Had the Company completed the acquisition as of the earliest date presented, results of operations on a pro forma basis would not have been materially different from actual historical results.
On May 19, 2005, the Company purchased the outstanding minority interest in its Australian subsidiary for a cash purchase priceof approximately $135 million. The transaction was accounted for as an acquisition by the Company, and the excess carrying valueof the minority interest liability over the purchase price paid was allocated as a reduction to property and equipment – $(19) million; deferred contract costs – $(2) million; and other intangible assets – $(3) million.
On March 1, 2005, the Company and Towers Perrin entered into a joint venture whereby Towers Perrin contributed cash and its pension, health and welfare administration services business and the Company contributed cash and its payroll and related humanresources (“HR”) outsourcing business to a new company, known as ExcellerateHRO LLP. Upon closing of the transaction, Towers Perrin received $417 million in cash and a 15% minority interest, representing total consideration paid by the Company toTowers Perrin, and the Company received an 85% interest in the new company. The acquisition enabled the Company to offer a comprehensive set of HR outsourcing solutions across the core areas of benefits, payroll, compensation management, workforce administration and relocation, recruitment and staffing, and workforce development. The consolidated statements of operations include the results of the acquired business since the date of acquisition. The transaction was accounted for as an acquisition by the Company with the purchase price being allocated as follows: property and equipment – $19 million; other intangibles – $41 million; goodwill – $423 million; other assets – $5 million; accrued expenses – $4 million; and minority interest – $67 million.Factors contributing to a purchase price that resulted in recognition of goodwill included the Company’s and its advisors’ projections of operating results of the new company, the ability to accelerate the Company’s growth in the HR outsourcing marketand the competitive differentiation offered by the relationship with Towers Perrin. Towers Perrin may require the Company to purchase its minority interest in the joint venture at any time after March 1, 2010, or prior to that date upon the occurrence of certain events (including the breach by the Company of certain transaction related agreements, the failure of the joint venture to achieve certain financial results or certain events related to the Company), at a price based on the fair market value of such interest, with a minimum purchase price based on the joint venture’s annual revenue. In addition, the Company may require Towers Perrin to sell its minority interest in the joint venture to the Company at any time after March 1, 2012, or prior to that date upon theoccurrence of certain events (including the breach by Towers Perrin of certain transaction related agreements or certain eventsrelated to Towers Perrin), at a price based on the fair market value of such interest, with a minimum purchase price based on the joint venture’s annual revenue. Had the Company completed the acquisition as of the earliest date presented, results of operations on a pro forma basis would not have been materially different from actual historical results.
On January 9, 2004, the Company acquired The Feld Group, a privately held technology management firm that specialized in reorganizing and realigning technology organizations to better meet the needs of their enterprises. The acquisition enhanced theCompany’s offerings and expertise in the transformational business process outsourcing/business transformation services market and enabled the Company to finalize appointments to its executive management team. The aggregate purchase price of The Feld Group was $53 million, comprised of $50 million in cash payments and warrants with a fair value of $3 million. In addition, theCompany issued contingent warrants with a fair value of $4 million in connection with the acquisition. The aggregate purchase price of The Feld Group was adjusted by $2.3 million in 2006 when the contingencies associated with a portion of these warrantswere resolved. The excess of the aggregate purchase price over the fair value of acquired assets and assumed liabilities of $47million was allocated to goodwill in the Americas segment in 2004. An additional $2.3 million of goodwill was recorded in 2006 when a portion of the contingent warrants became exercisable as discussed above, and another $1.3 million of goodwill was recorded in 2007 when the last of the contingent warrants became exercisable. The Company also issued restricted stock awards and options to acquire EDS common stock with an aggregate fair value of $40 million to certain employee shareholders of The Feld Group who became employees of the Company. Such awards and options vest over three years and are contingent upon the continuing employment of these individuals.

AR-60
NOTE 17: DISCONTINUED OPERATIONS
Income (loss) from discontinued operations includes the results of the Company’s A.T. Kearney subsidiary which was sold in 2006, and the Company’s UGS PLM Solutions subsidiary and its Soft Solution business which were sold in 2004. The net assets of A.T. Kearney are classified as “held for sale” at December 31, 2005. A.T. Kearney and UGS PLM Solutions were previously reported as separate segments by the Company. The Soft Solution business was previously included in the Company’s Outsourcing segment. No interest expense has been allocated to discontinued operations for any of the periods presented.
Income (loss) from discontinued operations also includes the net results of the maintenance, repair and operations (MRO) management services business which was transferred by A.T. Kearney to the Company prior to the Company’s divestiture of A.T. Kearney in January 2006. The Company expects to complete the sale of the MRO business in the first quarter of 2007. Under the terms of the proposed sale and related customer contract amendments, the Company will retain accounts receivable and certain other assets of the business but will transfer the tangible assets related to the MRO business to the buyer. The Company will continue to provide the buyer and a major customer with certain services during a transition period which may extend until the end of the 2007 calendar year. Upon completion of this transition period, the Company will have no continuing involvement in operations of the MRO management services business.
Following is a summary of assets and liabilities at December 31, 2006 and 2005 which are reflected in the consolidated balance sheets as “held for sale” (in millions):
2006 2005
Marketable securities ................................................................................................................ $ – $ 23 Accounts receivable, net........................................................................................................... – 217 Prepaids and other .................................................................................................................... – 34 Deferred income taxes .............................................................................................................. – 14 Property and equipment, net ..................................................................................................... – 26 Investments and other assets..................................................................................................... – 3 Goodwill ................................................................................................................................... – – Other intangibles, net................................................................................................................ – 28
Assets held for sale............................................................................................................ $ – $ 345
Accounts payable...................................................................................................................... – 105 Accrued liabilities..................................................................................................................... – 138 Deferred revenue ...................................................................................................................... – – Pension benefit liability ............................................................................................................ – 26 Minority interest and other long-term liabilities ....................................................................... – 6
Liabilities held for sale ...................................................................................................... $ – $ 275
Following is a summary of income (loss) from discontinued operations for the years ended December 31, 2006, 2005 and 2004 (in millions):
2006 2005 2004
Revenues............................................................................................................. $ 69 $ 780 $ 1,171 Costs and expenses ............................................................................................. 123 846 1,144 Operating income (loss)...................................................................................... (54) (66) 27 Other income (expense)...................................................................................... – 2 (8) Gains (losses), net............................................................................................... (1) (110) 739
Income (loss) from discontinued operations before income taxes (55) (174) 758 Income tax benefit (expense).............................................................................. 26 38 (329)
Income (loss) from discontinued operations, net of income taxes............... $ (29) $ (136) $ 429
A.T. Kearney’s results for the year ended December 31, 2005 include a pre-tax impairment charge of $118 million to write-down the carrying value of its long-lived assets, including tradename intangible, to estimated fair value less cost to sell. The impairment charge is partially offset by the recognition of $8 million previously unrecognized tax assets that were expected to be realized as a result of the sale.
Income (loss) from discontinued operations for the years ended December 31, 2006 and 2005 includes after-tax net gains of $8 million and $18 million, respectively, related to the settlement of contingencies associated with sales of certain businesses classified as discontinued operations in prior years.
...............

AR-61
NOTE 18: SUPPLEMENTARY FINANCIAL INFORMATION
Following is supplemental financial information for the years ended December 31, 2006, 2005 and 2004 (in millions):
2006 2005 2004
Property and equipment depreciation (including capital leases)......................... $ 761 $ 831 $ 1,058 Intangible asset and other amortization .............................................................. 401 378 540 Deferred cost amortization and charges.............................................................. 175 175 298 Cash paid for:
Income taxes, net of refunds........................................................................ 442 378 343 Interest ......................................................................................................... 235 232 328
The Company acquired $185 million, $160 million and $112 million of equipment utilizing capital leases in 2006, 2005 and 2004, respectively.
NOTE 19: OTHER OPERATING (INCOME) EXPENSE
Following is a summary of other operating (income) expense for the years ended December 31, 2006, 2005 and 2004 (in millions): 2006 2005 2004
Restructuring costs, net of reversals ................................................................... $ (7) $ 68 $ 226 Early retirement offer ......................................................................................... – – 50 Pre-tax loss (gain) on disposal of businesses:
Global Field Services .................................................................................. 23 – – European wireless clearing.......................................................................... – (93) – U.S. wireless clearing .................................................................................. (1) – (35) Automotive Retail Group ............................................................................ – – (66) Credit Union Industry Group....................................................................... – – (4)
Other ................................................................................................................... – (1) (1) Total ............................................................................................................ $ 15 $ (26) $ 170
The following table summarizes accruals associated with restructuring and other employee reduction programs for the years endedDecember 31, 2006, 2005 and 2004 (in millions):
Employee
Separations
Exit
Costs
Other
Employee
Reductions Total
Balance at December 31, 2003 ................................................ $ 165 $ 9 $ – $ 174 2003 Plan charges............................................................. 146 – – 146 Amounts utilized .............................................................. (240) (2) – (242) Other employee reductions programs............................... – – 80 80
Balance at December 31, 2004 ................................................ 71 7 80 158 Amounts incurred ............................................................. – – 100 100 Amounts utilized .............................................................. (47) (3) (103) (153) Reversal of prior years’ accruals ...................................... (8) (4) (20) (32)
Balance at December 31, 2005 ................................................ 16 – 57 73 Amounts utilized .............................................................. (8) – (53) (61) Reversal of prior years’ accruals ...................................... (6) – (1) (7)
Balance at December 31, 2006 ................................................ $ 2 $ – $ 3 $ 5
Restructuring actions contemplated under prior restructuring plans are essentially complete as of December 31, 2006 with remaining accruals of $2 million comprised primarily of future severance-related payments to terminated employees.
During 2006, the Company sold its Global Field Services (“GFS”) business in Europe which resulted in a pre-tax loss of $23 million. During 2005, the Company sold its European wireless clearing business which resulted in a pre-tax gain of $93 million. In connection with the sale, the Company recognized a $32 million valuation allowance related to deferred tax assets in certain European countries that may no longer be recoverable as a result of the sale. Net assets of the business included goodwill of $45million. During 2004, the Company sold its U.S. wireless clearing business and its Automotive Retail Group (“ARG”) which

AR-62
resulted in pre-tax gains of $101 million. The net results of GFS, the European wireless clearing business, the U.S. wireless clearing business, and ARG are not included in discontinued operations due to the Company’s level of continuing involvement with the businesses.
NOTE 20: QUARTERLY FINANCIAL DATA (UNAUDITED)
(in millions, except per share amounts) Year Ended December 31, 2006
(1)
First
Quarter
Second
Quarter
Third
Quarter
Fourth
Quarter Year
Revenues............................................................. $ 5,078 $ 5,194 $ 5,292 $ 5,704 $ 21,268 Gross profit from operations............................... 527 627 667 868 2,689 Other operating (income) expense...................... (1) (4) (1) 21 15 Income from continuing operations.................... 33 109 130 227 499 Loss from discontinued operations ..................... (9) (5) (5) (10) (29) Net income.......................................................... 24 104 125 217 470
Basic earnings per share of common stock:
Income from continuing operations............. $ 0.06 $ 0.21 $ 0.25 $ 0.44 $ 0.96 Net income .................................................. 0.05 0.20 0.24 0.42 0.91
Diluted earnings per share of common stock: Income from continuing operations............. $ 0.06 $ 0.21 $ 0.25 $ 0.42 $ 0.94 Net income .................................................. 0.05 0.20 0.24 0.40 0.89
Cash dividends per share of common stock........ 0.05 0.05 0.05 0.05 0.20
Year Ended December 31, 2005(2)(3)(4)
First
Quarter
Second
Quarter
Third
Quarter
Fourth
Quarter Year
Revenues............................................................. $ 4,737 $ 5,000 $ 4,874 $ 5,146 $ 19,757 Gross profit from operations............................... 456 550 594 735 2,335 Other operating (income) expense...................... (4) 31 (81) 28 (26) Income from continuing operations.................... 14 32 114 126 286 Loss from discontinued operations ..................... (10) (6) (106) (14) (136) Net income.......................................................... 4 26 8 112 150
Basic earnings per share of common stock:
Income from continuing operations............. $ 0.03 $ 0.06 $ 0.22 $ 0.24 $ 0.55 Net income .................................................. 0.01 0.05 0.02 0.21 0.29
Diluted earnings per share of common stock: Income from continuing operations............. $ 0.03 $ 0.06 $ 0.22 $ 0.24 $ 0.54 Net income .................................................. 0.01 0.05 0.02 0.21 0.28
Cash dividends per share of common stock........ 0.05 0.05 0.05 0.05 0.20
(1) Approximately 20 million shares were added to weighted-average shares outstanding and approximately $5 million of tax-effected interest was added to income from continuing operations and net income in the computation of diluted earnings per share in the third and fourth quarters of 2006 due to the dilutive effect of the Company’s contingently convertible debt during those periods. Such debt was antidilutive in the first and second quarters and for the year ended December 31, 2006, as well as in each quarter and for the year ended December 31, 2005.
(2) Includes a pre-tax charge of $77 million recognized in the second quarter associated with the settlement of pension obligations for employees transitioned to a third party in connection with the termination of the Company’s services contract with U.K. Inland Revenue as of June 2004.
(3) Includes a pre-tax charge of $37 million recognized in the second quarter for the impairment of deferred costs associated with a large IT commercial contract.
(4) Includes a pre-tax charge of $24 million recognized in the third quarter related to reserves established for shareholder litigation.

AR-63
This page intentionally left blank

Board of Directors
Michael H. Jordan EDS Chairman of the Board and Chief Executive Officer
Jeffrey M. Heller EDS Vice Chairman
W. Roy Dunbar President, Global Technology and Operations of MasterCard International
Roger A. Enrico* Chairman of the Board of DreamWorks Animation SKG, Inc.
Martin C. Faga Former President and Chief Executive Officer of The MITRE Corporation
S. Malcolm Gillis Professor of Economics and former President of Rice University
Ray J. Groves Former Chairman and Chief Executive Officer of Ernst & Young LLP
Ellen M. Hancock President and Chief Operating Officer of Jazz Technologies, Inc. and former
Chairman and Chief Executive Officer of Exodus Communications, Inc.
Ray L. Hunt Chairman of the Board, President and Chief Executive Officer of Hunt
Consolidated Inc. and Chief Executive Officer of Hunt Oil Company
Edward A. Kangas Former Chairman and Chief Executive Officer of Deloitte Touche Tohmatsu
James K. Sims Chairman and Chief Executive Officer of GEN3 Partners, Inc.
R. David Yost Chief Executive Officer of AmerisourceBergen Corporation
EDS Executive Leadership
Michael H. Jordan Chairman of the Board and Chief Executive Officer
Jeffrey M. Heller Vice Chairman
Ronald A. Rittenmeyer President and Chief Operating Officer
Charles S. Feld Senior Executive Vice President, Applications Services
Tina M. Sivinski Senior Executive Vice President and Chief Administrative Officer
Paul W. Currie Executive Vice President, Corporate Strategy and Business Development
Storrow M. Gordon Executive Vice President, General Counsel and Secretary
Jeffrey D. Kelly Executive Vice President, North America
William G. Thomas
Ronald P. Vargo Executive Vice President and Chief Financial Officer
* Not standing for re-election at the 2007 Annual Shareholders’ Meeting.
Leadership Information
AR-64
Executive Vice President, Europe, Middle East & Africa

Stock Data
Trading: Electronic Data Systems Corporation is listed
on the New York Stock Exchange and the London Stock
Exchange. NYSE Ticker symbol: EDS
Stock Transfer Agent
The Bank of New York is the transfer agent for EDS. For
inquiries concerning registered shareholder accounts and
stock transfer matters, including dividend checks, change
of address, stock transfers, direct deposits and similar
matters, contact The Bank of New York.
Inside the United States, call:
1 800 250 5016
Outside the United States, call:
1 212 815 3700
Internet address: http://www.stockbny.com
e-mail: [email protected]
Address shareholder inquiries to:
The Bank of New York
Church Street Station
P.O. Box 11258
New York , NY 10286-1258
Answers to many of your shareholder questions and
requests for forms are available by visiting The Bank of
New York’s Web site at www.stockbny.com.
Quarterly Earnings
Listen to our 2007 quarterly earnings release conference
calls via live webcast at eds.com/investor.
EDS 2006 Online Annual Report
An Adobe Acrobat Portable Document Format
(PDF) file of the print version is available at
eds.com/06annual.
Investor Relations
Securities analysts, institutional investors and portfolio
managers should contact:
Dave Kost
Vice President, Investor Relations
Phone: 1 972 605 6660
Fax: 1 972 605 6662
Toll-free: 1 888 610 1122
e-mail: [email protected]
Independent Auditors
KPMG LLP, Dallas, Texas USA
Other Information
EDS has included as Exhibits 31.1 and 31.2 to its Annual
Report on Form 10-K for the year ended December 31,
2006, filed with the Securities and Exchange Commis-
sion (“Form 10-K”) certificates of its Chief Executive
Officer and Chief Financial Officer certifying the qual-
ity of EDS’ public disclosure, and EDS has submitted to
the New York Stock Exchange a certificate of its Chief
Executive Officer certifying that he is not aware of any
violation by EDS of New York Stock Exchange corporate
governance listing standards.
A copy of the Form 10-K can be viewed, without exhibits,
on our Web site at eds.com/investor. Shareholders may
also request a copy of the Form 10-K, without charge, by
contacting:
EDS Investor Relations
5400 Legacy Drive
Mail Stop H1-2D-05
Plano, Texas 75024
1 888 610 1122 or 1 972 605 6661
Shareholder Information
AR-65

This page intentionally left blank
AR-66


Delivering Results NOW
A Message From Michael H. Jordan • 2007 Annual Meeting Notice • Proxy Statement • 2006 Financial Information
eds.com
2006 Annual ReportEDS and the EDS logo are registered trademarks of Electronic Data Systems Corporation. All other brand or product names are
trademarks or registered marks of their respective owners. EDS is an equal opportunity employer and values the diversity of its people.
Copyright © 2007 Electronic Data Systems Corporation. All rights reserved. 03/2007 6GCJH6347
Contact us
Corporate Headquarters
United States
5400 Legacy DrivePlano, Texas 75024
USA
1 800 566 9337
Regional Headquarters
Asia
36F, Shanghai Information Tower211 Century Avenue
Pudong, ShanghaiChina 200120
86 21 2891 2888
Australia & New Zealand
Level 1, The Bond30 Hickson Road
Millers Point Sydney
New South Wales 2000Australia
612 8965 0500
Canada33 Yonge StreetToronto, Ontario
M5E 1G4 Canada
1 416 814 45001 800 814 9038
(in Canada only)
Europe, Middle East & Africa
2nd Floor Lansdowne House
Berkeley SquareLondon W1J 6ER
44 20 7569 5100
Latin America
Avenida Presidente JuscelinoKubitschek, 1830
5th Floor – Tower 404543-900
São PauloBrazil
55 11 3707 4100
About EDS
EDS (NYSE: EDS) is a leading global technology services company delivering business solutions
to its clients. EDS founded the information technology outsourcing industry more than 40 years
ago. Today, EDS delivers a broad portfolio of information technology and business process
outsourcing services to clients in the manufacturing, financial services, healthcare, communica-
tions, energy, transportation, and consumer and retail industries and to governments around
the world. Learn more at eds.com.
Printed entirely on recycled and recyclable paper.