how to save energy through enhanced automation...demin prvprv plant condensate make-up unit 3 unit 4...
TRANSCRIPT

Standards
Certification
Education & Training
Publishing
Conferences & Exhibits
How to Save Energy Through Enhanced Automation
AIChE Spring Meeting 2008Douglas WhiteEmerson Process Management

2©2008 Emerson Process Management
Speaker
Doug White
Principal Consultant and Vice President, APC Services
Advanced Applied Technologies
Process Systems and Solutions
Emerson Process Management
Many years experience designing, justifying, installing and commissioning advanced real time computer applications in the process industries.
3©2008 Emerson Process Management
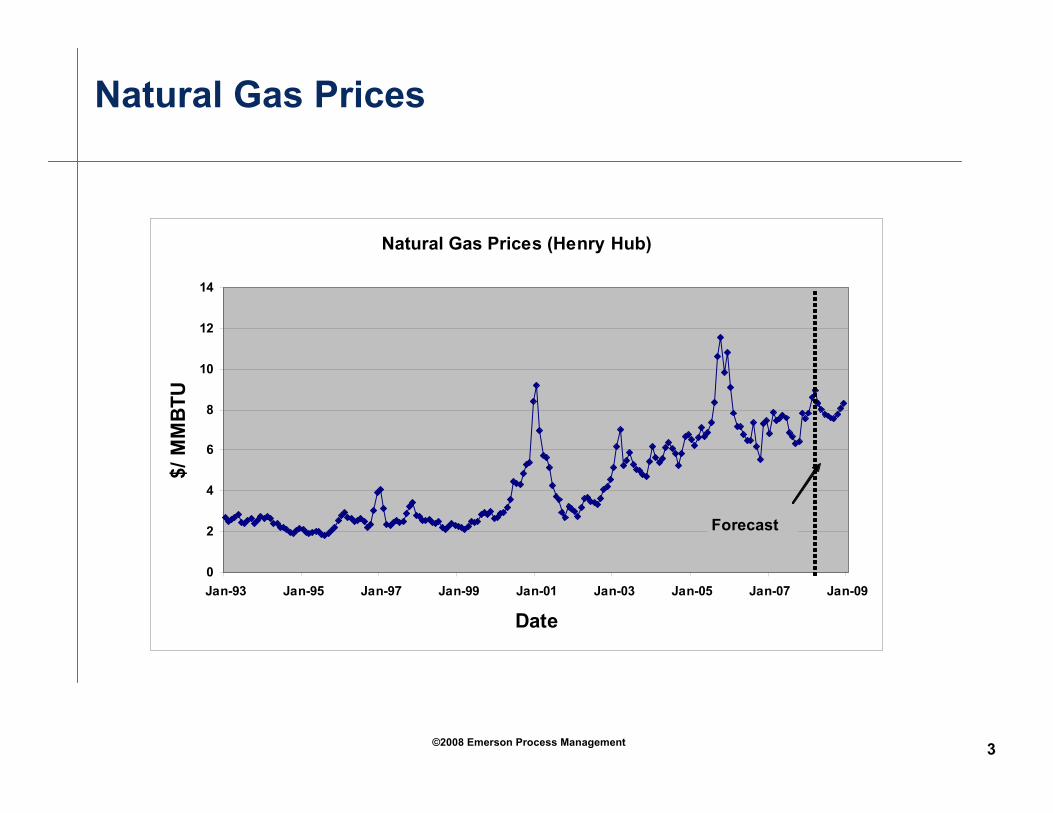
Natural Gas Prices
Natural Gas Prices (Henry Hub)
0
2
4
6
8
10
12
14
Jan-93 Jan-95 Jan-97 Jan-99 Jan-01 Jan-03 Jan-05 Jan-07 Jan-09
Date
$/ M
MB
TU
Forecast

4©2008 Emerson Process Management
Process Energy Usage
27.238.8Styrene2.12.9Ethylbenzene5.07.1EG4.36.2EO2.84.0PVC6.69.4EDC4.76.7Polyethylene5.07.1Ethylene
Chemicals5.57.9Cement Production
20.329.0Integrated Pulp/Paper Mill3.14.4Petroleum Refining
Value; 10% Energy Reduction; $/ Ton
($7/ MMBTU)Process Energy;
MM BTU/ Ton
Largest Contro
llable Cost in Most
Plants!
5©2008 Emerson Process Management
Session Objective
Present some case studies of the many ways that automation, advanced automation and asset management can save energy in process plants
6©2008 Emerson Process Management
Outline
• How is energy used in process plants?
• How can automation help save energy?
• How do we implement an energy reduction program?

7©2008 Emerson Process Management
PurchasedSteam
ProcessHeating/CoolingPurchased
Fuel
PurchasedPower
ProcessSteamDrives
ExportPower
ExportSteam
ExportFuel
ProcessElectricDrives
ProcessFired
Equipment
ProcessSteam
Generated
ProcessDirect Fuel
Usage
CentralPower
Production
CentralSteam
Production
General Process Site Energy Flow
ProcessMisc Electric
Usage
Power PlantProcess andOffsites
Raw MaterialAs Fuel

8©2008 Emerson Process Management
PurchasedSteam
ProcessHeating/CoolingPurchased
Fuel
PurchasedPower
ProcessSteamDrives
ExportPower
ExportSteam
ExportFuel
ProcessElectricDrives
ProcessFired
Equipment
ProcessSteam
Generated
ProcessDirect Fuel
Usage
CentralPower
Production
CentralSteam
Production
“Average” Chemical Site Energy Flow
ProcessMisc Electric
Usage
Power PlantProcess andOffsites
Raw MaterialAs Fuel
63%
37% 4%
32%
22%
1%
18%
27%
%-Equivalent BTU basis (Including losses) on total input

9©2008 Emerson Process Management
PurchasedSteam
ProcessHeating/CoolingPurchased
Fuel
PurchasedPower
ProcessSteamDrives
ExportPower
ExportSteam
ExportFuel
ProcessElectricDrives
ProcessFired
Equipment
ProcessSteam
Generated
ProcessDirect Fuel
Usage
CentralPower
Production
CentralSteam
Production
Integrated Pulping Paper Mill Energy Flow
Process/ FacMisc Electric
Usage
Power PlantProcess andOffsites
Raw MaterialAs Fuel
50%
42%
8%29%
25%
62%
5%
%-Equivalent BTU basis (Including losses) on total input
4%

10©2008 Emerson Process Management
PurchasedSteam
ProcessHeating/CoolingPurchased
Fuel
PurchasedPower
ProcessSteamDrives
ExportPower
ExportSteam
ExportFuel
ProcessElectricDrives
ProcessFired
Equipment
ProcessSteam
Generated
ProcessDirect Fuel
Usage
CentralPower
Production
CentralSteam
Production
Oil Refinery Energy Flow
ProcessMisc Electric
Usage
Power PlantProcess andOffsites
Raw MaterialAs Fuel
64%
25%
10%
1%
15%
5%
34%
44%
%-Equivalent BTU basis (Including losses) on total input
6%

11©2008 Emerson Process Management
Reducing Plant Energy Costs
• Reduce Usage– Individual Equipment
– Improve Efficiencies – Boilers, Heaters, kilns– Maximize Useful Recovery - Preheat– Minimize Losses
– Cooling water– Minimize Motor Losses
– Unit Savings– Optimize Process Unit Operations
– Distillation/ Fractionation– Maximize Waste Heat Recovery– Minimize waste/ off spec
– Site/ Multi – Unit Savings– Minimize Steam Losses and Downgrading– Switch of steam drives for electric or vice versa– Seasonal effects
• Reduce Cost of Production and Purchase– Fuel Substitution– Generation Maximization– Boiler and Turbine Allocation– Electric Purchase Optimization
Automation and Advanced Automation are the keys to effective operation and minimum ongoing energy usage

12©2008 Emerson Process Management
Process Industry Energy Saving Primary Targets
• Fired Heaters
• Distillation/ Fractionation
• Central Power and Steam Production

13©2008 Emerson Process Management
How can Automation Reduce Energy Usage?

14©2008 Emerson Process Management
Variability – Potential Energy Savings Example
Heater Stack O2 Variability
2
3
4
5
6
7
8
9
10
11
12
8:00 9:00 10:00 11:00 12:00 13:00 14:00Time
O2, %
0
100
200
300
400
500
600
700
800
Fuel GasFlow
Target

15©2008 Emerson Process Management
Energy Savings Through Automation –Target Areas
MassCont
DensFF
O2
PITC
FuelGas
PI
FI
DraftControl
FC 3-5
FT 3-5
Bottoms
FC 3-5FC 3-5
FT 3-5
Bottoms
Device,Loop
Equipment
Process Unit
Site- Wide

16©2008 Emerson Process Management
Saving Energy – Automation Examples
Better Control Valve Performance
ImprovedMeasurements
FC 3-5
FT 3-5
FC 3-5FC 3-5
FT 3-5
Improved Loop/ Multi-loop Control Performance

17©2008 Emerson Process Management
Component Heating Values
1184032010Butane
1204024320Propane
1241016820Ethane
132809520Methane
339103020Hydrogen
Heat of Combustionkcal/ kg (gross)
Heat of Combustionkcal/ NM3 (gross)
Component
Fuel Gas ComponentHeating Value
Control Fuel Flows By Mass Instead of Volume

18©2008 Emerson Process Management
Energy Savings From Improved Measurements –Hydrogen Plant
Objective: Control S/C ratio as close to 3.2 as possible but avoid going below
Disturbance: Fuel gas C1 77 – 85%; C2 6.8 – 15; N2, CO also fluctuate
Test: Normal orifice plus GC – max error 0.2; MMI – max error – 0.02
Benefits: Moving 0.2 ratio closer to limit worth 8 BTU/SCF of H2; 80 MMSCFD plant; $7 MM BTU gas –
$1.6 MM per year
Ref: MMI WP_00724Mass Measurement

19©2008 Emerson Process Management
Energy Losses Through Bypassing
14.30.4
6.80.25
3.20.14
Heat LossIncrease -%
F1/(F1+ F2)
TC TC
Reference:Shinskey;
Energy Conservation Through Automation
Fuel
F2
F1
TC

20©2008 Emerson Process Management
MassCont
DensFF
O2
PITC
FuelGas
PI
FI
DraftControl
•Improved Multi-Loop Control – Advanced Control
•Improved Performance Monitoring
•Improved Diagnostics
Energy Savings – Equipment Level

21©2008 Emerson Process Management
Steam System Control Issues
PIC3
PIC4 PIC2
FIC2 FIC1
PIC1
750 psig
50 psig
Condensate
TGA
TGBUsers
Vent
Vent
PRC1
0 4500 9000 13500 18000Sec
745.0748.0751.0754.0757.0
psig
Mean=750.814 3Sig=3.242FRC1
0 4500 9000 13500 18000Sec
300.0305.0310.0315.0320.0
mlb/hr
Mean=212.955 3Sig=6.987
Objective:Maximum
Flow to TGA
Problem:Pressure
Instability in Header
Limited Flow to TGA

22©2008 Emerson Process Management
Steam System Diagnosis – Valves and Tuning
5%
220 sec
PRC 1 OP
4800 5200 5600 6000 6400Sec
52.0054.0056.0058.0060.00
%Out
Mean=56.0123 3Sig=9.381
SecFRC2
4800 5200 5600 6000 6400Sec
209.6213.7217.8221.8225.9
mlb/hr
Mean=114.983 3Sig=19.7
5%
220 sec Flow controller to TGB has 5% deadband;
induces limit cycle in pressure
Correction: Fix TGB turbine
governor/ steam valve
Tune controllers as system – not individually
PRC1
4800 5200 5600 6000 6400Sec
748.3749.5750.6751.8752.9
psig
Mean=650.814 3Sig=3.242
Estimated value of increased flow to TGA - $3000/ day

23©2008 Emerson Process Management
Fired Heater Controls

24©2008 Emerson Process Management
Combustion Control

25©2008 Emerson Process Management
Heater/ Boiler Combustion Control Savings
$/ Yr Savings100 MM BTU/ Hr
$7/ kSCF Gas400 F Stack Gas Rise
$0
$100,000
$200,000
$300,000
$400,000
$500,000
$600,000
2 3 5 7 10
% O2
$/ Yr

26©2008 Emerson Process Management
Typical Heater APC Package
FIC101
H306
FIC102
TI069
TIC361
FIC361
TI071
CO
Combustion Control
HIC353D
PIC359D
TIC362D
AIC354D
AIC356D
O2
FIC103
TI069
(Up to 4)
FIC104
TI070
TI073
TI072
TI043
TI075
TI067
MPC Block
FuelDemand
AirDemand
PIC357D
PassBalance

27©2008 Emerson Process Management
Excuses For Not Improving Heater Controls
• Damper/ Air controls are not reliable – Answer: Add positioners to dampers, with feedback to
control system; Analyze and fix controller problems
• Don’t have online analyzer/ can’t maintain them– Answer: Analyzers are cheaper and more reliable –
particularly mass flow meters. With higher fuel costs, they are well justified.

34©2008 Emerson Process Management
Distillation Controls
35©2008 Emerson Process Management
FCLC
FC
TC
FC
LC
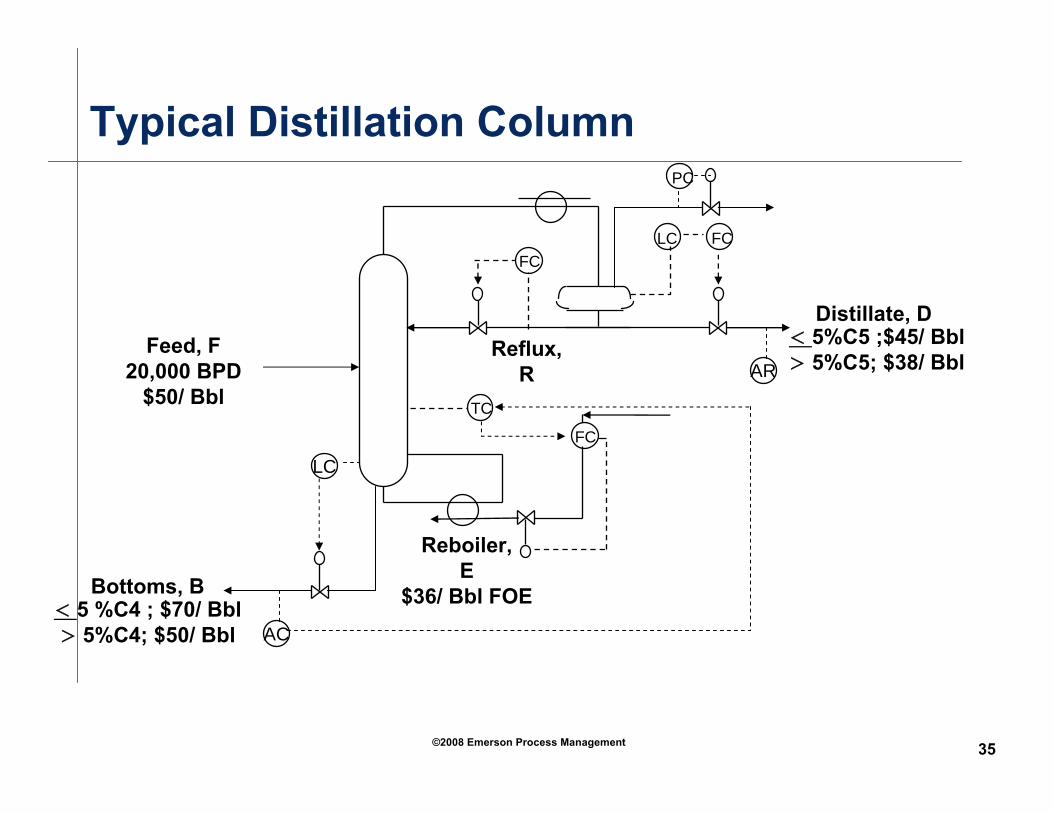
Feed, F20,000 BPD
$50/ Bbl
Bottoms, B< 5 %C4 ; $70/ Bbl> 5%C4; $50/ Bbl
Distillate, D< 5%C5 ;$45/ Bbl> 5%C5; $38/ BblReflux,
R
Reboiler,E
$36/ Bbl FOE
PC
AC
Typical Distillation Column
AR

41©2008 Emerson Process Management
Distillation Column Control Savings
Cost Per YearExcess Reflux
20000 BPD Stabilizer Column$10/ MM BTU Steam
$0$100,000$200,000$300,000$400,000$500,000$600,000$700,000
5 10 25 50
% Excess Reflux
$/ Yr

42©2008 Emerson Process Management
Column Pressure Effect
Relative Reboiler Cost Per YearColumn Pressure Effect
20000 BPD Stabilizer
0%
20%
40%
60%
80%
100%
120%
100 120 140 160 180 200
Pressure, PSIA
Basis: Constant SeparationModeled With ChemSepPeng Robinson Equation of State

43©2008 Emerson Process Management
Energy Savings – Site Wide
•Site Energy/ Utility Management
•Steam System Control
•Fuel System Control

44©2008 Emerson Process Management
Energy Management and OptimizationSystem

45©2008 Emerson Process Management
Plant Utility Systems – Many Opportunities for Savings
MPS
HPS
• Many interacting decision variables
• Large number of constraints
Unit 1 Unit 2
Unit 5
HRSG
DeminPlant
Condensate
LPS
BFW
FG
FB1FB1 FB2FB2 FB3FB3 WHB1WHB1 GT1GT1WHB2WHB2
ST1ST1 ST2ST2
Make-Up
PRVPRV
PRVPRVUnit 4
Vent
Vent
Vent
Unit 3

46©2008 Emerson Process Management
Optimizer Decisions
• Which boiler(s) should I run? What load?• How much electricity should I produce? Buy? Sell?
Is it economic to run the steam turbine?• Which fuel should I buy? How much?• Should I be using more steam drives or more electric
drives?• When will efficiency gain from maintenance balance
the cost of shut down for this equipment? • How does my actual compare with plan corrected to
standard conditions?

47©2008 Emerson Process Management
Unit 2Unit 1
LPS
ST1ST1 ST2ST2PRVPRV
PRVPRVDeminPlant
Condensate
Make-Up
Unit 5Unit 3 Unit 4
HRSG
MPS
GT1GT1FB1FB1
HPS
BFW
FG
FB2FB2 FB3FB3 WHB1WHB1 WHB2WHB2
Full Utility Optimization
• Many interacting decision variables
• Large number of constraints
48©2008 Emerson Process Management
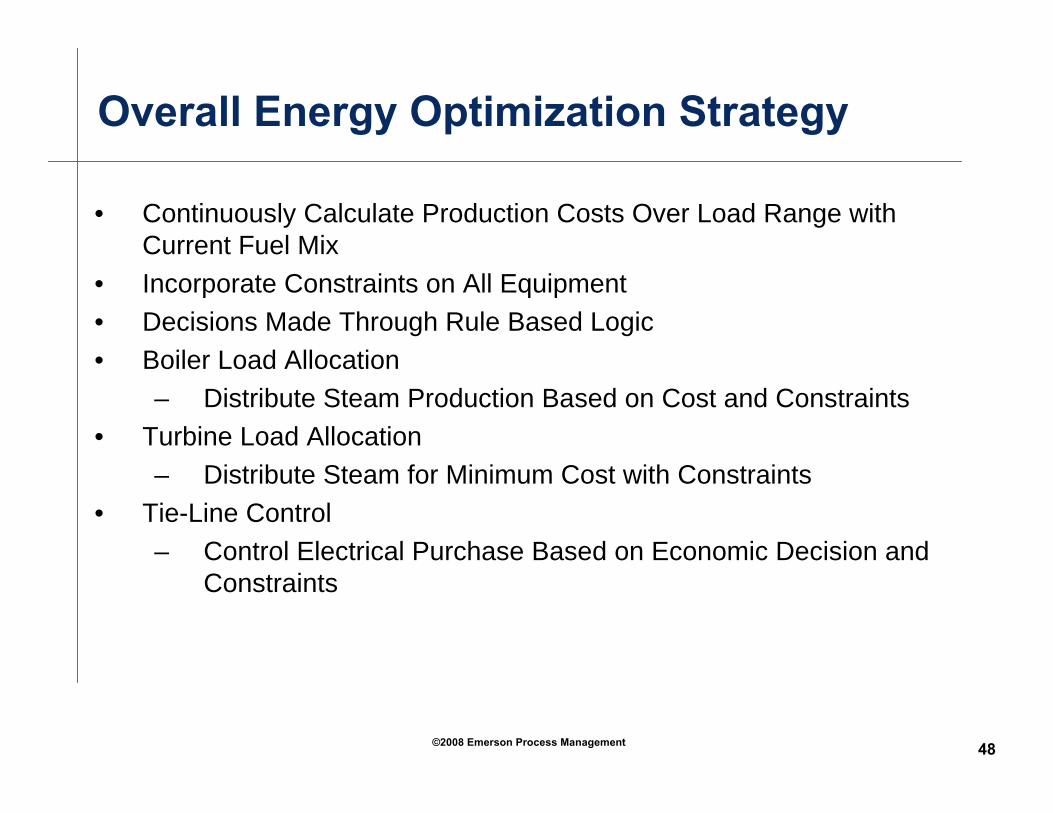
Overall Energy Optimization Strategy
• Continuously Calculate Production Costs Over Load Range with Current Fuel Mix
• Incorporate Constraints on All Equipment• Decisions Made Through Rule Based Logic• Boiler Load Allocation
– Distribute Steam Production Based on Cost and Constraints• Turbine Load Allocation
– Distribute Steam for Minimum Cost with Constraints• Tie-Line Control
– Control Electrical Purchase Based on Economic Decision and Constraints

49©2008 Emerson Process Management
Boiler Load Allocation
50©2008 Emerson Process Management
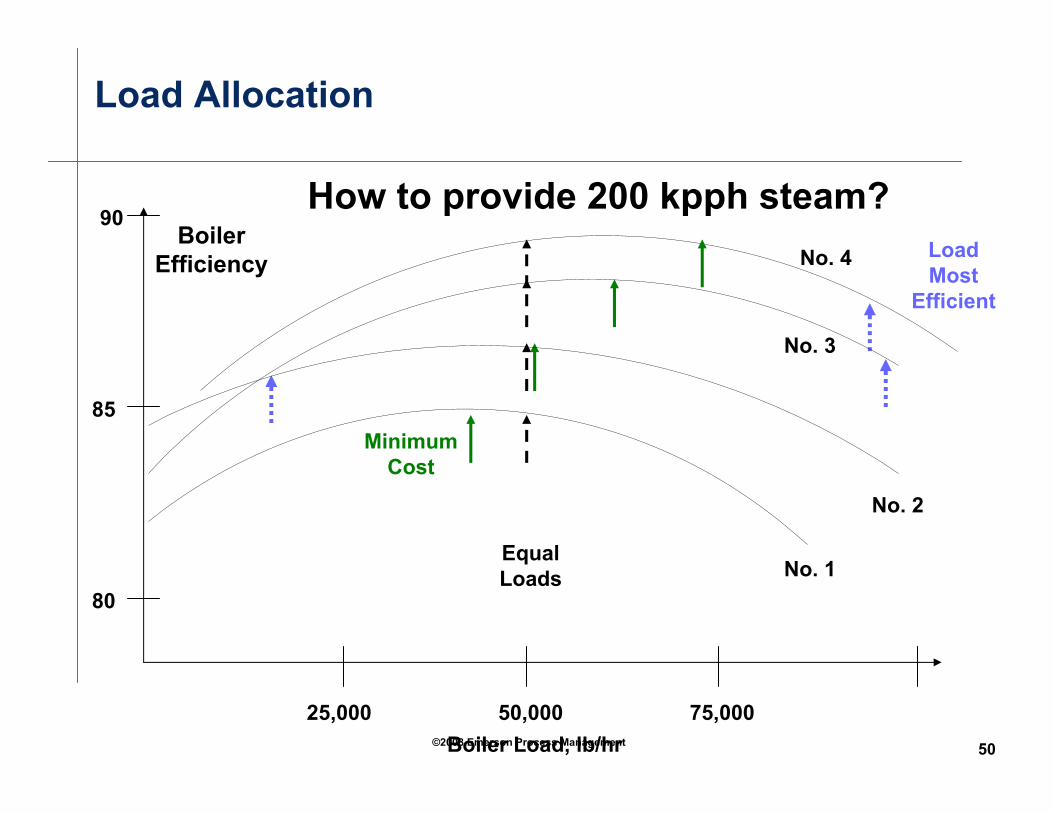
Load Allocation
50,000 75,00025,000Boiler Load, lb/hr
BoilerEfficiency
No. 1
No. 2
No. 3
80
85
90How to provide 200 kpph steam?
LoadMost
Efficient
EqualLoads
Minimum Cost
No. 4

51©2008 Emerson Process Management
Energy Savings via Site Energy Balance
Blow-Down
Make-Up
Power
Fuel
1600 psia; 940 F
Flue Gas;200 F
200 psia
Steam; 125 psia
Condensate
1000 KW384pph
384pph
24,393 kBTU/ hr
19200 pph
20,200pph
0kBTU/hr
Make-Up
Blow-Down Power
Fuel
1600 psia; 940 F
Flue Gas;200 F
200 psia
Steam; 125 psia
Condensate
1000 KW271pph
271pph
18510kBTU/ hr
13550 pph
10,100 pph
3754kBTU/hr9600 pph
Reference: Kinney; Energy Conservation in
Process Industries
Naïve calculation, value 125 psia steam reduction = 1000 x (1031 Btu/ lb (ΔHv) ÷ 0.7(eff))x $7/MMBtu (Fuel) =
$10.31 per klb
Actual site value 125 psia steam reduction = $4.08 per klb

56©2008 Emerson Process Management
Typical Energy Management System Benefits
1 – 3 % Overall site utility cost savings!
57©2008 Emerson Process Management
Example

58©2008 Emerson Process Management
Utilities Example – Biomass Power Boiler
• Paper mill • 160k PPH Fluidized-bed Boiler• Fuels:
– Sludge– Wood waste– Tires– Fuel gas
• Incentives:– Maximize use of cheap fuels (Tires & Wood)– Burn all the sludge to minimize land fill– Maximize steam production
59©2008 Emerson Process Management
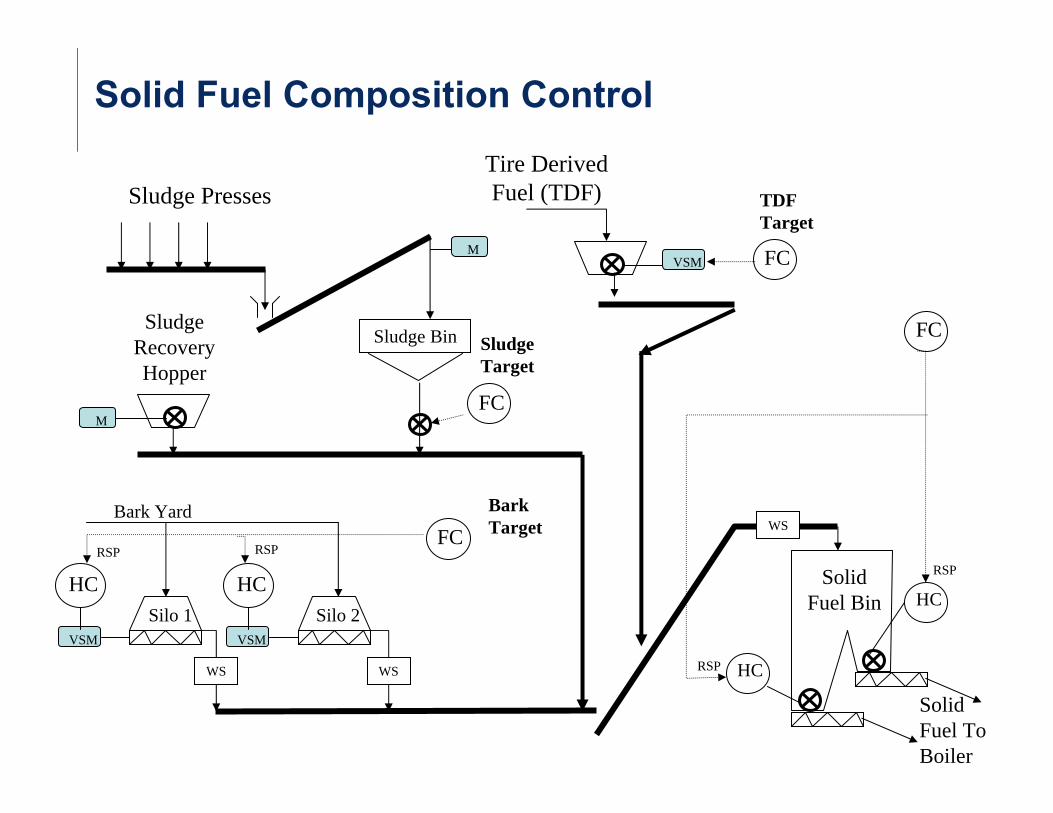
Solid Fuel Composition Control
Sludge Presses
M
Sludge Bin
M
Sludge Recovery Hopper
VSM
HCSilo 1
Bark Yard
VSM
HC
FC
FC
WS WS
RSP RSP
WS
Solid Fuel Bin
FC
HC
RSP
HCRSP
Sludge Target
BarkTarget
Tire Derived Fuel (TDF)
VSM
Solid Fuel To Boiler
TDF Target
Silo 2
FC

60©2008 Emerson Process Management
Boiler Control
Boiler
Lance Burners (16)
FC
Load Burners (4)
FC
TI A-F
TC
HS M HSMAsh Screws (2)
Primary Air Blower
Air Preheater
TI
To ID Fan
PC
RSP
Fuel Gas
Secondary Air Blower
FC
FCOverfire
Air Ports (18)
Combustion Control
To Ash Handing
NCAvg
To ID Fan Speed Control
Solid Fuel
FC
Solid Fuel
FC

61©2008 Emerson Process Management
Boiler Process Control Issues
• Varying water in sludge• Long delay & lag times (20 – 60 minutes) to
change fuel composition• Fuel composition time constants are a
function of fuel bin level• Solid fuel composition in fuel bin is
unknown• Bed temperature constraints (max & min)• Multiple operators controlling same unit• Different operating philosophy used by each
shift

62©2008 Emerson Process Management
Solid Fuel Composition Control
Sludge Presses
M
Sludge Bin
M
Sludge Recovery Hopper
VSM
HCSilo 1
Bark Yard
VSM
HC
FC
FC
WS WS
RSP RSP
WS
Solid Fuel Bin
FC
HC
RSP
HCRSP
Sludge Target
BarkTarget
Tire Derived Fuel (TDF)
VSM
Solid Fuel To Boiler
MPC BlockTDF Target
Silo 2
Predicted BTU
Content

63©2008 Emerson Process Management
Boiler Control
Boiler
Lance Burners (16)
FC
Load Burners (4)
FC
TI A-F
TC
HS M HSMAsh Screws (2)
Primary Air Blower
Air Preheater
TI
To ID Fan
PC
RSP
Fuel Gas
Secondary Air Blower
FC
FCOverfire
Air Ports (18)
Combustion Control
To Ash Handing
NC
MPC Outputs
Avg
To ID Fan Speed Control
Solid Fuel
FC
Solid Fuel
FC

64©2008 Emerson Process Management
Power Boiler Sludge
0102030405060
12/20
/001/9
/011/2
9/01
2/18/0
13/1
0/01
3/30/0
14/1
9/01
TPH
SLDG
Key
Current Average
New Average
Max Sustainable

65©2008 Emerson Process Management
Power Boiler Bark Fuels
05
1015202530354045
12/20
/001/9
/011/2
9/01
2/18/0
13/1
0/01
3/30/0
14/1
9/01
TPH
BARK
Key
Current Average
New Average
Max Sustainable

66©2008 Emerson Process Management
Power Boiler APC Benefits
Difference inHourly Costs
Power Boiler & (Savings)
Natural Gas $2.22
Sludge Disposal ($23.04)
Sludge Ash Disposal $9.18
TDF $0.46
TDF Ash Disposal $0.00
Waste Wood $26.91
W Wood Ash Disposal $0.77
Total $16.50
Package Boilers Displaced Natural Gas ($98.42)
Net Savings, $/Hr ($81.92)
Total Savings
$56k / mo
$672k / yr
Project Justified:• Replacement of required
pneumatic instruments
• DCS Hardware / Software
• APC Tools
• Turnkey Engineering Services

67©2008 Emerson Process Management
Issues in Evaluating Plant Energy Usage
• Unit energy usage depends on production rate
• Unit energy usage variance dependent on production rate
• Need to correct to standard unit conditions

68©2008 Emerson Process Management
Unit Energy Usage
Throughput - % Max Capacity0 10050
Energy UsageBtu
SpecificEnergy UsageBtu /Bbl

69©2008 Emerson Process Management
Energy Usage - Example
0.00
10.00
20.00
30.00
40.00
50.00
60.00
70.00
80.00
0.00 1.00 2.00 3.00 4.00 5.00 6.00 7.00 8.00 9.00 10.00Production
T/Hr
MMBTU/Hr

70©2008 Emerson Process Management
Unit Energy Usage
Throughput - % Max Capacity0 10050
SpecificEnergy UsageBtu /Bbl
xx
x
x
x
x
x
x
x
x
x
x
x
x
x
x
x
x
xx
x
x
x
x
x
xx
x
x
Confidence Limits
VarianceIncreases atLower Rates

72©2008 Emerson Process Management
Unit Energy Usage - Example
0.00
1.00
2.00
3.00
4.00
5.00
6.00
7.00
8.00
9.00
10.00
0.00 1.00 2.00 3.00 4.00 5.00 6.00 7.00 8.00 9.00 10.00
Production
MM
BTU
/Ton

76©2008 Emerson Process Management
Excuses for Doing Nothing
• Not enough manpower - Too busy doing other things
• Our plant is special – analysis based on other sites doesn’t apply
• We run our plant well already, there won’t be any big savings found
• Ostrich - (If we find something obvious, management will ask why we didn’t find it before)

77©2008 Emerson Process Management
Summary
• Energy is the largest controllable cost in process operation – it’s efficient production and use are keys to plant profitability
• Automation and Advanced Automation are keys to effective use and management of energy in the plant
• Implementation of a program to save energy requires a disciplined approach to evaluation and analysis
78©2008 Emerson Process Management
Questions? Comments?
More material on subject: http://www.emersonprocess.com/solutions/services/aat