how to read, analyze, and interpret financial reports chapter thirteen copyright © 2014 by the...
TRANSCRIPT

HOW TO READ, ANALYZE, AND
INTERPRET FINANCIAL REPORTS
Chapter Thirteen
Copyright © 2014 by The McGraw-Hill Companies, Inc. All rights reserved.McGraw-Hill/Irwin

1. Explain the purpose and the key items on the balance sheet.2. Explain and complete vertical and horizontal analysis.
LU13-1: Balance Sheet -- Report as of a Particular Date
LEARNING UNIT OBJECTIVES
LU 13-1: Income Statement -- Report for a Specific Period of Time1. Explain the purpose and the key items on the income
statement.2. Explain and complete vertical and horizontal analysis.
13-2
LU 13-3: Trend and Ratio Analysis1. Explain and complete a trend analysis.2. List, explain, and calculate key financial ratios.
ACCOUNTING EQUATION
Accounting Equation:
Assets = Liabilities + Owner’s Equity
13-3

BALANCE SHEET
Gives a financial picture of what a company is worth as of a particular date.
Assets Liabilities + Owner’s Equity= (How much the company
owns)
(How much the owner is worth)
(How much the company owes)
13-4

BALANCE SHEET
Assets – Liabilities = Owner’s equity (capital)
$10,000 - $2,500 = $7,500
13-5

ELEMENTS OF THE BALANCE SHEET(FIGURE 13.1)
MOOL COMPANYBalance Sheet
December 31, 2014Assets Liabilities
a. Current assets: a. Current liabilities:b. Cash $ 7,000 b. Accounts payable $ 80,000c. Accounts receivable 9,000 c. Salaries payable 12,000d. Merchandise inventory 30,000 d. Total current liabilities $ 92,000e. Prepaid expenses 15,000 e. Long-term liabilities:f. Total current assets $61,000 f. Mortgage note payable 58,000g. Plant and equipment: g. Total liabilities $150,000h. Building (net) $60,000i. Land 84,000 Stockholders’ Equityj. Total plant and equipment 144,000 a. Common stock $ 20,000
b. Retained earnings 35,000
c. Total stockholders’ equity 55,000k. Total assets $205,000 d. Total liab. and stkhlds’ equity $205,000
Assets broken down into current assets and plant and equipment
Liabilities broken down into current and long-term
Total of current assets and plant and equipment.
(Total is double-ruled)
Total of all liabilities and stockholders’ equity. 13-6

VERTICAL ANALYSIS AND THE BALANCE SHEET
Step 2. Divide each liability and stockholders’ equity (the portions) as a percent of total liabilities and stockholders’ equity (the base). Round as indicated.
Step 1. Divide each asset (the portion) as a percent of total assets (the base). Round as indicated.
13-7

COMPARATIVE BALANCE SHEET: VERTICAL ANALYSIS (FIGURE 13.2)
ROGER COMPANYComparative Balance Sheet
December 31, 2013 and 2014 2014 2013
Amount Percent Amount PercentAssets
Current Assets: Cash $22,000 25.88 $18,000 22.22 Accounts Receivable 8,000 9.41 9,000 11.11 Merchandise inventory 9,000 10.59 7,000 8.64 Prepaid rent 4,000 4.71 5,000 6.17
Total current assets $43,000 50.59 $39,000 48.15*
Plant and equipment: Building (net) $18,000 21.18 $18,000 22.22 Land 24,000 28.24 24,000 29.63
Total plant and equipment $42,000 49.41* $42,000 51.85Total assets $85,000 100.00 $81,000 100.00
* Due to rounding
13-8

COMPARATIVE BALANCE SHEET: VERTICAL ANALYSIS (FIGURE 13.2)
ROGER COMPANYComparative Balance Sheet
December 31, 2013 and 2014 2014 2013
Amount Percent Amount PercentLiabilities
Current liabilities: Accounts payable $14,000 16.47 $ 8,000 9.88 Salaries payable 18,000 21.18 17,000 20.99 Total current liabilities $32,000 37.65 $25,000 30.86*Long-term liabilities: Mortgage note payable $12,000 14.12 $20,000
24.69 Total liabilities $44,000 51.76* $45,000 55.56*
Stockholders’ EquityCommon stock $20,000 23.53 $20,000 24.69Retained earnings 21,000 24.71
16,000 19.75 Total stockholders’ equity $41,000 48.24 $36,000 44.44Total liabilities and stockholders’ equity $85,000 100.00 $81,000 100.00
* Due to rounding 13-9

PREPARING A HORIZONTAL ANALYSIS
OF A COMPARATIVE BALANCE SHEET
Step 1. Calculate the increase or decrease (portion) in each item from the base year.
Step 2. Divide the increase or decrease in Step 1 by the old or base year.
Step 3. Round as indicated.
13-10

COMPARATIVE BALANCE SHEET: HORIZONTAL ANALYSIS (FIGURE
13.3)ABBY ELLEN COMPANY
Comparative Balance SheetDecember 31, 2013 and 2014
Increase (decrease) 2014 2013 Amount Percent
AssetsCurrent Assets: Cash $ 6,000 $ 4,000 $ 2,000 50.00* Accounts receivable 5,000 6,000 (1,000) -16.67 Merchandise inventory 9,000 4,000 5,000 125.00 Prepaid rent 5,000 7,000 (2,000) -28.57
Total current assets $25,000 $21,000 $ 4,000 19.05Plant and equipment: Building (net) $12,000 $12,000 0 0 Land 18,000 18,000 0 0
Total plant and equipment $30,000 $30,000 0 0Total assets $55,000 $51,000 $4,000 7.84
13-11

COMPARATIVE BALANCE SHEET: HORIZONTAL ANALYSIS (FIGURE
13.3)ABBY ELLEN COMPANY
Comparative Balance SheetDecember 31, 2013 and 2014
Increase (decrease) 2014 2013 Amount Percent
LiabilitiesCurrent liabilities: Accounts payable $ 3,200$ 1,800 $1,400 77.78 Salaries payable 2,900 3,200 (300) -9.38 Total current liabilities $ 6,100$ 5,000 $1,100 22.00Long-term liabilities: Mortgage note payable 17,000 15,000 2,000 13.33
Total liabilities $ 23,100$20,000 $3,100 15.50Owner’s Equity
Abby Ellen, capital $31,900$31,000 $ 900 2.90 Total liabilities and owner’s equity $55,000 $51,000 $4,000 7.84
13-12

INCOME STATEMENT – REPORT FOR A SPECIFIC PERIOD OF TIME
Income Statement -- A financial report that tells how well a company is performing (its profitability or net profit) during a specific period of time (month, year, etc).
Service Business:
Net income = Revenues -- Operating expenses
Retail Business:
Revenues (sales)
-- Cost of merchandise sold
= Gross profit from sales
-- Operating expenses
= Net income (profit)
Income
Statemen
t$
13-13

INCOME STATEMENT
13-14

MOOL COMPANYIncome Statement
For Month Ended December 31, 2014
Revenuesa. Gross Sales $22,080b. Less: Sales returns and allowances $ 1,082c. Sales discounts 432 1,514d. Net Sales Cost of merchandise (goods) sold: $20,566a. Merchandise Inventory 12/1/2014 $1,248b. Purchases $10,512c. Less: Purchases returns and allowances $336d. Less: Purchase discounts 204 540e. Cost of net purchases 9,972f. Cost of merchandise (goods available for sale) $11,220g. Less: Merchandise inventory 12/31/2014 1,600h. Cost of merchandise (goods sold) 9,620 Gross profit from sales $10,946 Operating expenses: a. Salary $2,200b. Insurance 1,300c. Utilities 400d. Plumbing 120e. Rent 410f. Depreciation 200g. Total operating expenses 4,630 Net income $ 6,316
INCOME STATEMENT(FIGURE 13.4)
13-15

KEY CALCULATIONS ON INCOME STATEMENT
Net sales = Gross sales -- Sales returns allowances -- Sales discounts
Net income = Gross profit -- Operating expenses
Gross profit from sales = Net sales -- Cost of merchandise (goods) sold
Cost of Net purchasesmerchandise = Beginning + (purchase less -- Ending(goods) sold inventory returns & discounts) inventory
13-16
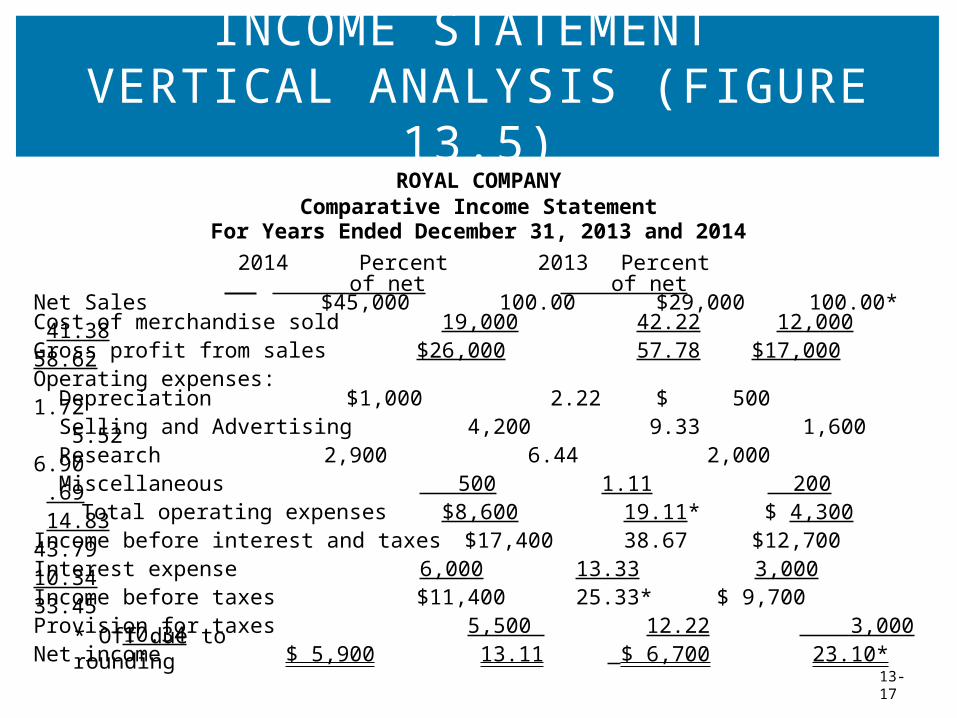
INCOME STATEMENT VERTICAL ANALYSIS (FIGURE 13.5)
ROYAL COMPANYComparative Income Statement
For Years Ended December 31, 2013 and 2014
2014 Percent 2013 Percent
of net of netNet Sales $45,000 100.00$29,000 100.00*Cost of merchandise sold 19,000 42.22 12,000 41.38Gross profit from sales $26,000 57.78 $17,000 58.62Operating expenses: Depreciation $1,000 2.22 $ 500 1.72 Selling and Advertising 4,200 9.33 1,600 5.52 Research 2,900 6.44 2,000 6.90 Miscellaneous 500 1.11 200 .69 Total operating expenses $8,600 19.11* $ 4,300 14.83Income before interest and taxes $17,400 38.67 $12,700 43.79Interest expense 6,000 13.33 3,000 10.34Income before taxes $11,400 25.33* $ 9,700 33.45Provision for taxes 5,500 12.22 3,000 10.34Net income $ 5,900 13.11 $ 6,700 23.10*
* Off due to rounding
13-17

HORIZONTAL ANALYSIS INCOME STATEMENT (FIGURE 13.6)
FLINT COMPANYComparative Income Statement
For Years Ended December 31, 2013 and 2014
2014 2013 Increase (decrease) Amount Percent
Sale $ 90,000 $80,000 $10,000Sales returns and allowances 2,000 2,000 0Net Sales $88,000 $78,000 $10,000 + 12.82Cost of merchandise sold 45,000 40,000 5,000 + 12.50Gross profit from sales $43,000 $38,000 $ 5,000 + 13.16Operating expenses: Depreciation $ 6,000 $ 5,000 $ 1,000 + 20.00 Selling and Administrative 16,000 12,000 4,000 + 33.33 Research 600 1,000 (400) - 40.00 Miscellaneous 1,200 500 700 + 140.00 Total operating expenses $23,800 $18,500 $ 5,300 + 28.65Income before interest and taxes $19,200 $19,500 $ (300) - 1.54Interest expense 4,000 4,000 0 Income before taxes $15,200 $15,500 $ (300) - 1.94Provision for taxes 3,800 4,000 (200) - 5.00Net income $11,400 $11,500 $ (100) - .87
13-18

COMPLETING A TREND ANALYSIS
Trend Analysis –
Analyzes the changes that occur by expressing each number as a percent of the base year.
Step 1. Select the base year (100%).
Step 2. Express each amount as a percent of the base year amount (rounded to the nearest whole percent).
Each ItemBase Amount
13-19

TREND ANALYSIS
Given (base year 2012)2015 2014 2013 2012
Sales $621,000 $460,000 $340,000 $420,000Gross Profit 182,000 141,000 112,000 124,000Net Income 48,000 41,000 22,000 38,000
Trend Analysis2015 2014 2013 2012
Sales* 148% 110% 81% 100%Gross Profit 147 114 90 100Net Income 126 108 58 100
$340,000$420,000D* Round to nearest whole percent
13-20
Sales of 2013 were 81% of the sales of 2012

RATIO ANALYSIS
13-21