chapter thirteen financial statement analysis copyright © 2011 by the mcgraw-hill companies, inc....
TRANSCRIPT

Chapter Thirteen
Financial Statement Analysis
Copyright © 2011 by The McGraw-Hill Companies, Inc. All rights reserved.McGraw-Hill/Irwin

Horizontal Analysis
Horizontal analysis (or trend analysis) refers to studying the behavior of
individual financial statement items over several accounting periods.
Absolute Amounts
Percentage Analysis
13-2

13-3
Vertical Analysis of Income Statement
In income statements, all
items are usually
expressed as a percentage of
sales.
In balance sheets, all items are usually
expressed as a percentage of total assets.

Liquidity Ratios
Liquidity ratios indicate a company’s ability to pay short-
term debts. They focus on current assets and current
liabilities.
1. Working Capital
2. Current Ratio
3. Quick Ratio
4. Accounts Receivable Ratios
5. Inventory Ratios13-4

Current Ratio
The current ratio measures a company’s short-term debt
paying ability.
A declining ratio may be a sign of deteriorating
financial condition, or it might result from eliminating
obsolete inventories.
CurrentRatio
Current Assets Current Liabilities
=
13-5

Quick (Acid-Test) Ratio
Quick Assets Current Liabilities
=Acid-Test
Ratio
Quick assets include Cash,Current Marketable Securities, and
Accounts Receivable. This ratio measures a company’s ability
to meet obligations without having to liquidate inventory.
13-6

Accounts Receivable Turnover
Net Credit Sales Average Accounts Receivable
Accounts ReceivableTurnover
=
This ratio measures how many times a company converts its
receivables into cash each year.
13-7
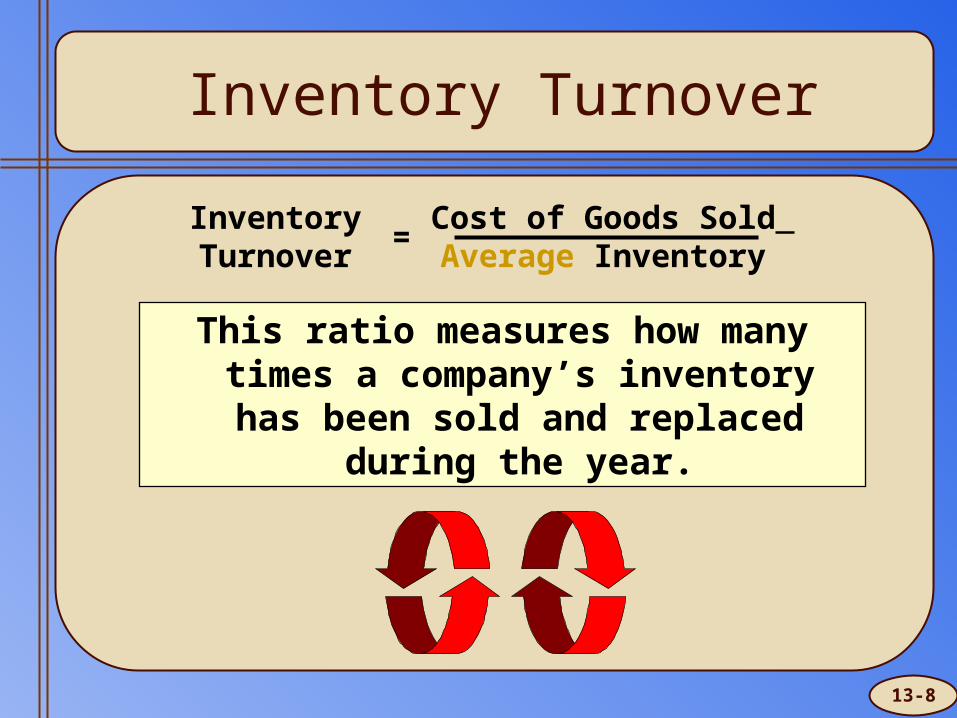
Inventory Turnover
Cost of Goods Sold Average Inventory
InventoryTurnover
=
This ratio measures how many times a company’s inventory has been sold
and replaced during the year.
13-8

Solvency Ratios
Solvency ratios are used to analyze a company’s long-term debt-
paying ability and its financing structure.
1. Debt to Assets Ratio
2. Debt to Equity Ratio
3. Number of Times Interest Earned
4. Plant Assets to Long-Term Liabilities
13-9

Debt to Assets Ratio
This ratio measures the percentage of a company’s assets that are financed by
debt.
Total Liabilities Total Assets
Debt to Assets Ratio
=
13-10

Debt to Equity Ratio
This ratio indicates the relative proportions of debt to equity on a
company’s balance sheet.
Stockholders like a lot of debt if the company can
take advantage of positive financial
leverage.
Total Liabilities Stockholders’ Equity
Debt to Equity Ratio
=
Creditors prefer less debt and more equity
because equity represents a buffer of
protection.
13-11

Profitability Ratios
Profitability ratios measure a company’s ability to generate
earnings.
1. Net Margin (or Return on Sales)
2. Asset Turnover Ratio
3. Return on Investment
4. Return on Equity
13-12

Net Margin
This measure describes the percent remaining of each sales dollar after
subtracting other expenses as well as cost of goods sold.
Net Margin
Net Income Net Sales
=
13-13
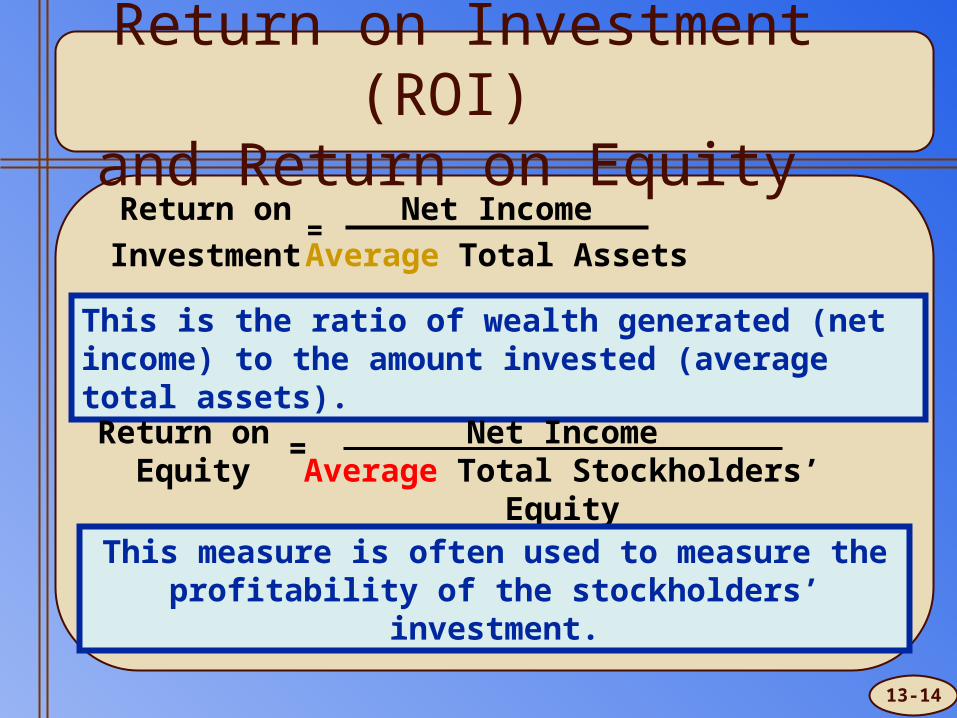
Return on Investment (ROI) and Return on Equity
This is the ratio of wealth generated (net income) to the amount invested (average total assets).
Return on
Investment
Net Income
Average Total Assets=
13-14
Return on Equity
Net IncomeAverage Total Stockholders’
Equity
=
This measure is often used to measure the profitability of the stockholders’ investment.

Stock Market Ratios
Stock market ratios analyze the earnings and dividends of a
company.
1. Earnings Per Share
2. Book Value per Share
3. Price-Earnings (PE) Ratio
4. Dividend Yield
13-15

Earnings Per Share Ratio and Price-Earnings Ratio
Earnings per
Share
Net Earnings Available for Common Stock Average Number of Outstanding Common
Shares
=
This measure indicates how much income was earned for each share of common stock outstanding.
13-16
Price-EarningsRatio
Market Price Per Share Earnings Per Share
=
This ratio compares the earnings of a company to the market price for a share of the company’s stock.