how macroeconomic indicators influence gold price management
TRANSCRIPT

How macroeconomic indicatorsinfluence gold price management
Liya ASchool of Finance, Central University of Finance and Economics, Beijing, China
Qian QinGraduate School of Social Science, Waseda University, Tokyo, Japan
Hafiz Waqas KamranDepartment of Business Administration, Iqra University, Karachi, Pakistan
Anusara SawangchaiBusiness Administration in Entrepreneurship Program,
Faculty of Management Sciences, Phuket Rajabhat University, Phuket, Thailand
Worakamol WisetsriThe Faculty of Business and Industrial Development,
King Mongkut’s University of Technology North Bangkok, Bangkok, Thailand, and
Mohsin RazaSchool of Business Management, Universiti Utara Malaysia, Sintok, Malaysia
Abstract
Purpose – This study purposes to measure the influencing relations between macroeconomic indicators andthe prices of gold. Further studymeasures several factorswith the gold price in the context of the United States.Design/methodology/approach –The secondary data are collected to measure relationship and fluctuationof gold prices the data collected from thewebsite world development indicators (WDI) for the period of 31 years1990–2019. This paper uses different econometric analysis such as analytical unit root test for stationary ofdata, descriptive statistical analysis for description of data, correlation coefficient test for measuring the intercorrelation, and ordinary least square regression analysis for determine the impact of dependent andindependents variables. In this research paper, gross domestic product (GDP), inflation rate (IR),unemployment rate (UR), real interest rate (RIR), gross national product (GNP), standard trade value (STV)are included in macroeconomic indicators and consider as independent. The gold prices are considered asdependent variable.Findings – This study’s overall results show an important and optimistic association between GDP, IR andSTVwith the gold price.Moreover, the RIR shows negative and does not show significant relationwith the goldprices.Originality/value – Since several economic crises were included during the data selection studied in thisresearch paper, data error may be present, resulting in the instability of the overall data. However, the studystill hopes to find the guiding role of thesemacro gold price factors in the price of gold from the limited data set.The basic scope of research is that research is limited in the United States.
Keywords Macroeconomic factors (MF), Gross domestic product (GDP), Real interest rate (RIR),
Standard trade value (STV), Inflation rate (IR), Gold prices (GP)
Paper type Research paper
IntroductionThe research focuses on gold prices andwas carried out using the BrettonWoods framework,a post-war international accord that regulated exchange rateswhile keeping inflation low andmaintaining employment and financial trading. The framework was an economic standardreliant on US dollar (USD) and gold (Kanjilal and Ghish, 2014; Zhu et al., 2017) and wasspecifically created linking the USD and gold prices to the fixed financial standards set by theIMF (Baraviera et al., 2019; Singhal et al., 2019).
Gold pricemanagement
The current issue and full text archive of this journal is available on Emerald Insight at:
https://www.emerald.com/insight/1463-7154.htm
Received 23 December 2020Revised 24 January 2021
1 March 2021Accepted 3 March 2021
Business Process ManagementJournal
© Emerald Publishing Limited1463-7154
DOI 10.1108/BPMJ-12-2020-0579

In 1971, the US left the Bretton Woods monetary system, but the tradition of setting theofficial gold price in the US continued. Since then, the USD price of gold has skyrocketed andeconomists have observed that gold prices are correlatedwith inflation (Huang et al., 2019; Liliand Chengmei, 2013; Bhunia, 2013; Alameer et al., 2019; Bouoiyour et al., 2018; Mohi-U-Dinand Mubasher, 2013).
This research is founded on gold prices and macroeconomic issues, and its basic aim is tomeasure the results of macroeconomic indicators on the value of gold in the US.
Influences affecting the price of goldBelow, a list of the factors is provided which impact the gold price fluctuations. This researchidentifies the number of macro factors that are most closely related to gold prices, such as:
Gross domestic product (GDP)
Unemployment rate (UR)
Real interest rate (RIR)
Standard trade (ST)
Gross national product (GNP)
Inflation rate (IR)
The economic situation of the USThe Dollar Index (USDI) for the gold is the main indicator of the exchange rate of USD on theinternational exchangemarket, which is interlinkedwith the international gold price (Kalsumet al., 2020; Hussin et al., 2013).
A fall in the USDI implies a devaluation of the USD, and the expansion for gold demandwhich encourages financial investors to purchase gold which then decreases the demand forUSD. This leads to increasing interest in gold and the global USD gold price increases andappreciates.
At the same time, the US can rely on the USD-dominated international economic system toobtain an imposing number of seigniorage on global resources and merchandise. The“no-profit” consequence of the USD world currency status is a significant factor in the USeconomy’s continued strength (Beckmann et al., 2019; Liu and Li, 2017).
Limitations and scope of the studyBased on previous research, this study lists the fourmost important aspects of analyzing goldprices and the macroscopic influencing factors. The data are taken from annual real goldprices from 1990 to 2019, seasonally adjusted GDP, RIR, IR and UR.
The data have some limitations and one-sidedness. On one hand, the research compares allthe variables on the same timeline, in this case, annual data from 1990 to 2019, andmakes surethe dataset is broad enough. On the other hand, since several economic crises were includedduring the data selection time period, data errorsmay be present, resulting in the instability ofthe overall data. However, the study still hopes to find the guiding role of the macroeconomicindicators on gold.
Price factors on the cost of gold in the limited dataset. The basic scope of research islimited to the US.
The basic aim of the researchThe basic objective of this research is as follows:
BPMJ
(1) Discuss the macroeconomic indicators that influence the price of gold as evidenced inthe US.
(2) To investigate how gold prices were affected by fluctuations in the macroeconomicindicators.
Literature reviewLong and Hanh (2019) researched the outcome of macroeconomic issues on gold prices byutilizing the dataset of global macroeconomic markers. In this research, data are used infinancial markets, energy crises and gold prices and the results indicate two maincontributions to research. First, all the factors influencing the gold prices have been classifiedand divided into three groups: the gold reserve, price of energy products and the financialmarkets. Results concluded that gold reserves and energy products show positive effects,while the financial market’s impact indicates that macroeconomic indicators have a negativeeffect on gold prices. This research utilized the FAVARmodel to measure all macroeconomicfactors that influence gold prices and trends (Long and Hanh, 2019).
Bhunia and Ganguly (2015) examined the effects of IR, commodity prices and theconversation rate on stock market performance in Malaysia and showed the relationshipamong variables included exchange rates and bonds. The results concluded that the IR andexchange rate indicate positive and significant relationships between them. However, there isno relative importance between the price of gold and oil. In addition, macroeconomic factorsimplementing the relevant policies and results show there has been an adverse impact on theMalaysian Stock Exchange as well as in further research (Bhunia and Ganguly, 2015;Singh, 2014a).
Some studies investigate the research results of macroeconomic factors on gold prices.Data collected over eight years from daily-based prices of variables show that there is amoderate effect between macroeconomic variables and gold prices (Oluyemi and Isaac, 2017;Jain and Biswal, 2016).
Many studies deliberately focus on influential macroeconomic indicators on gold pricesandmeasure the relationship of each variable related to gold prices in the Indian context. Datawere secondary and collected fromdifferent websites. Data gathered from seven years show apositive and important relationship between the USD and gold price. However, the rates ofinflation do not show a substantial relationship with the price of gold (Mukhuti, 2018; Shivaand Sethi, 2015; Beckmann et al., 2019; Bhunia and Mukhuti, 2013; Hassani et al., 2015).
Nurulhuda et al. (2018) and many others have studied the dynamic and relationshipanalysis of all macroeconomic variables affecting gold prices. The essential purpose of thisresearch is to measure the gold price fluctuation as a result of macroeconomic indicators.Different test analysis results concluded that the gold price does not affect the exchange rate,NSE index rates and interest rates, but that the inflation rate independently impacted goldprices (Nurulhuda et al., 2018; Akbar et al., 2019; Beckmann and Czudaj, 2013; Singh, 2014b).
MethodologyOurmodel’s primary purpose is to measure the effects of all macroeconomic indicators on thevalue of gold by creating amodel that estimates eachmacroeconomic factor and consequenceon gold prices in different forms. This research model explains through regression analysis,correlation analysis, an ANOVA and unit test analysis.
Descriptions of dataData were collected from different sources, including web development indicators and worldbanks and observed annual figures from 1990 to 2019. The nature of the data is quantitativeand is based on secondary form. For our purposes, we used different independent variables of
Gold pricemanagement

macroeconomic factors, including IR, GDP and GNP, and measured their impact on goldprices. The gold price is considered reliant on variables, and all themacroeconomic factors areindependent variables. This study is based on a quantitative method.
Sampling techniquesThis study collected information from global development indicators and used probabilitysampling techniques for data analysis. The data are based on secondary sources andcollected from various internal and external sources as shown in Table 1. The secondary datagive the latest information.
Theoretical modelAs shown in Figure 1.
Econometric modelThe determinants of macroeconomic and gold prices are analyses from overall panel data.These panel data frameworks defined with the multiple regression equations such as:
Y ¼ ∝ þ β1xþ ε1 (1)
Regression modelGold prices present as a dependent variable, while the independent variable macroeconomicindicators included GDP, IR, UR, GNP, STV and RIR.
So, regression models have been developed and are as follows:
GP ¼ ∝ þ β1GDPþ β2IRþ β3URþ β4RIRþ β5GNPþ β5STDSþ ε1 (2)
Where:
GP 5 Gold price
GDP 5 Gross domestic product
IR 5 Inflation rate
UR 5 Unemployment rate
RIR 5 Real interest rate
GNP 5 Gross national product
STV 5 Standard trade value
Variables Notation
Independent variableGross domestic product GDPInflation rate IRUnemployment rate URReal interest rate RIRGross national product GNPStandard trade value STV
Dependent variableGold price GP
Table 1.
BPMJ

Hypothesis
H0. There is no relationship between macroeconomic factors and value of gold.
H1. There is a relationship between gross domestic product and value of gold.
H2. There is an associated relationship between inflation rate and value of gold.
H3. There is a relationship between the unemployment rate and the value of gold.
H4. There is a relationship between monetary policy and value of gold.
H5. Gross national product is associated with the gold price.
H6. Standard value of trade shows significantly relationship to the price of gold.
Results and discussionsDescriptive statisticTable 2 explains the descriptive statistical analysis while the research study describesmacroeconomic indicators and gold prices, with the gold price as the dependent variable.Descriptive statistics depict the overall performance of variables. The mean value of the goldprice is 408.30. Its maximum value is 871.96 with a probability value of 0.0002, which shows a100% significant gold price level. The sum of the square deviation value is 430,675.5, and itsoverall observation is 19. The second is GDP as an independent variable; its mean value is15.486, which shows that 15% average value as its standard deviation value is 0.9193represent the 91% deviation from the mean. The skewness value of the GDP is�0.5853, andthe overall probability is 0.5812, which shows a significant 58%.The third indicator is IRwiththe average value of inflation rate being 2.8249, while its highest value is 8.06, and lowestvalue is 1.182. The standard deviation value is 1.924, which shows a 10% deviation from theaverage value. The probability value is 0.0004, which shows a significant 100% level. Thedescriptive statistical analysis describes macroeconomic variables’ overall performancerelating to the gold price fluctuations in the markets. Similarly, the real IR is considered anindependent variable; its mean value is 3.155. The highest value is 6.378, and the lowest valueis �4.11 which shows negatively that the probability value is 0.017.
Gross Domestic
Product (GDP)
Gold Price Inflation Rate (IR)
Standard Trade
value (STV)
Unemployment
Rate (UR)
The Real interest
rate (RIR)
Gross National
Product (GNP)
Figure 1.
Gold pricemanagement

Goldprice
Gross
dom
esticproduct
Inflationrate
Unem
ploymentrate
Gross
nationalproduct
Realinterestrate
Standardtradevalue
Mean
408.30
15.486
2.8249
6.6935
1.78
3.155
57.432
Median
363.38
15.731
2.2190
6.0429
1.68
3.193
48.185
Maxim
um
871.96
17.195
8.0634
10.348
3.16
6.378
146.43
Minim
um
271.04
13.515
1.1829
4.5942
1.184
�4.111
33.716
Std.dev.
154.68
0.9193
1.9241
1.9288
7.64
2.436
28.940
Skew
ness
1.8565
�0.5853
1.8526
0.6168
�0.028
�1.1638
1.7798
Kurtosis
5.7063
2.9888
5.3467
1.9434
3.095
5.1991
5.8117
Jarque-Bera
16.712
1.0850
15.228
2.0887
0.0098
8.117
16.290
Probability
0.0002
0.5812
0.0004
0.3519
0.995
0.017
0.0002
Sum
7757.78
294.250
53.673
127.17
3.38
59.956
1091.2
Sum
sq.dev.
430675.5
15.212
66.645
66.970
1.05
106.86
15075.7
Observations
1919
1919
1919
19
Table 2.
BPMJ

Correlation analysisTable 3 represents the correlation analysis among all indicators and that this test analysisillustrates the relationship among variables, including one that represents the 100%significance level. According to this test, analysis shows that all variables are interlinked. GNPis positively linked with gold prices and shows 0.655 probability, while the STV also shows apositive relationship with gold prices at 0.75711. The IR and gold price show 0.1032, which is10% significant and a positive relationship. However, the IR shows a negative relationshipwith the GDP at �0.3401 and negatively links with the GDP at �0.5263; similarly, the IRshows a negative relationship with STV at �0.2289. The correlation analysis represents theintercorrelations linked between one variable to another variable related to the gold prices.
Regression analysisTable 4 describes the regression analysis. In this study, the gold price is a dependent variable,and the macroeconomic indicators are considered independent variables. The researchincluded the factors of macroeconomic variables, including GDP, GNP, IR, RIR and standardtrade, all as independent variables. This linear regression analysis shows the hypothesisacceptance and the rejection of variables. Research study analysis and its results are foundedon coefficient values, the value of standard error, the value of t-statistic value and probability.The overall performance of research is based on R-squared and its value is 0.8832, whichshows that 88% model is fit for analysis. The adjusted R-square value is 0.82, which showsthat 82% of the adjusted value of R-square; the standard error of regression value is 64.72,and the overall probability value is 0.000, which shows a 100% significant level. The totalnational output independent variable is t-measurement value of 0.1999, and probability valueis 0.8448, which shows a positive but inconsequential relationship between the GDP and goldprices. So, the results reject the null hypothesis and accept H1.
Similarly, the IR considers macroeconomic indicators used in this research as theindependent variable. Its t-statistic value is 3.5708. The probability value is 0.003, showing anoptimistic and significant relationship between IR and gold prices, so linear regressionanalysis accepts H2. The unemployment rate is also included in independent indicators, itst-statistic value is 1.18, and its probability value of 0.09 shows a positive and significantrelationship between the gold price and unemployment rate. Another is the GNP t-statisticvalue is 3.527, and its probability value is 0.0042, which shows a 100% significance level, sothe results accept H4. Similarly, the standard trade value shows positive relationship with3.23, and its probability value is 0.0071 shows 100% significance, and therefore the resultsaccept H5.
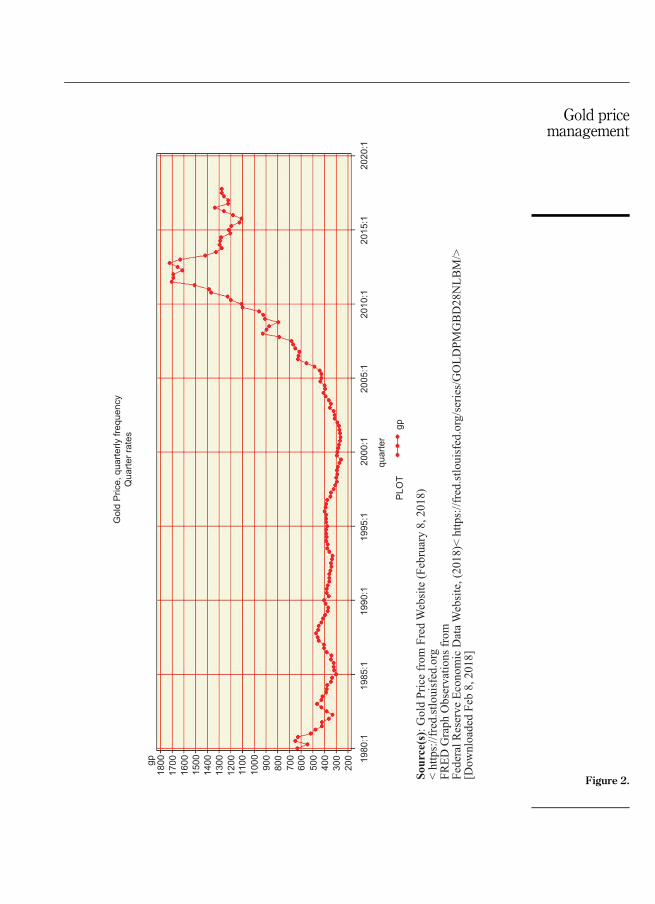
Unit root testTable 5 illustrates the unit root test analysis represented by the augmentedDickey Fuller test,which shows significant levels. There are three critical values, 1%, 5% and 10% that explainthe significance. Another is representing the Dickey Fuller test equations. Results representthe probability value, and this unit test analysis also explains the R-square value. Accordingto this analysis, the R-square value is 0.312 or 31%. So, this model is fit for analysis andaccepted all hypotheses, excluding the null hypothesis. Its adjusted R-square is 0.2569, its SEof regression value is 100.4701 and its probability value is 0.0093, which shows a significant100% level. F-statistics explain the impact of macroeconomic indicators on gold prices in theUK, and a unit root test is run through the e-views software. Its dependent variance value is116.5551, and its mean dependent variance is 36.80321, showing that 30% value depends onmean. The gold price coefficient value is �0.035, and its probability is 0.407; its t-statisticvalue is �0.842 (see Figure 2).
This chart represents the trend cycle of gold prices and shows the macroeconomic effectson gold prices and their fluctuations. The blue line shows that the gold price rates red line
Gold pricemanagement

Goldprice
Gross
dom
estic
product
Inflation
rate
Unem
ployment
rate
Gross
national
product
Realinterest
rate
Standardtrade
value
Goldprice
1.000000
�0.540530
0.103240
�0.202509
0.655546
�0.284429
0.757112
Gross
dom
estic
product
�0.540530
1.000000
�0.340185
�0.450558
�0.103685
0.222264
�0.234663
Inflationrate
0.103240
�0.340185
1.000000
0.413961
�0.526380
0.342030
�0.228966
Unem
ploymentrate
�0.202509
�0.450558
0.413961
1.000000
�0.624888
0.107311
�0.555545
Gross
nationalproduct
0.655546
�0.103685
�0.526380
�0.624888
1.000000
�0.360161
0.722684
Realinterestrate
�0.284429
0.222264
0.342030
0.107311
�0.360161
1.000000
�0.166968
Standardtradevalue
0.757112
�0.234663
�0.228966
�0.555545
0.722684
�0.166968
1.000000
Table 3.
BPMJ

shows the trend cycle. The Hodrick-Prescott filter test demonstrates that the gold pricesfluctuate daily.
ConclusionDifferent tests included regressions analysis conducted for this research paper, both based onthe first difference. The research was concerned with five variables for our final gold model.These factors represent the real gross global product (GGP), the real RIR and the actual USDIand every variable was converted to first order.
The research financial model was estimated using the ordinary least squares (OLS)approach. The model demonstrates a statistically reinforced linkage between the real price ofgold and the macro factors. The theory proposes a further tie among the actual price of goldand real GGP, RIR and real USDI. As expected, if we do not consider the statistic significant,the research found a positive relationship in the first difference of real GGP per quarter, andthe primary difference of actual gold price was statistically significant. The research found anegative association in a RIR, and the first difference in the gold price was not statisticallysignificant. The research study found an undesirable association in the primary difference ofRIR, and the primary difference of actual gold price was statistically significant. Therefore,research can reject the null hypothesis in this case.
If a researcher wants to run a macro model that includes GGP, owing to gold prices beingso volatile over the year, we were more willing to pick up the relationship. They do not movein the long term, and gold prices move randomly over a short period, so they are not followingthis long-term GGP trend, which was the same finding as in other studies (Zhao et al., 2015;Patel, 2013; Mombeini and Yazdani-Chamzini, 2015).
This research model focuses on real data, and researchers chose the first difference withour gold model. First, all the signs agreed with the alternative hypothesis. Second, all the
Dependent variable: Price of ovldMethod: Ordinary least squares (OLD)
Included observations: 19 after adjustments
Name of variable Value of coefficient
The value of Std. error
t-statistic value Probability value
C −385.0975 623.0066 −0.618127 0.5480
GDP 6.079450 30.39983 0.199983 0.8448
IR 41.50912 11.62456 3.570813 0.0038
UR 28.93440 15.96346 1.812540 0.0950
GNP 1.41E-10 4.011 3.527800 0.0042
RIR −10.41359 7.416657 −1.404081 0.1856
STDS 2.950805 0.911901 3.235883 0.0071
R-squared 0.883255 Mean dependent variance 408.3042
Adjusted R-squared 0.824883 SD dependent variance 154.6817
SE of regression 64.72959 Akaike info criterion value 11.45562
Sum squared resid 50279.03 Schwarz criterion 11.80357
Log-likelihood −101.8284 Hannan-Quinn criteria 11.51451
F-statistic 15.13142 Durbin-Watson stat 1.714900
Probability (F-statistic) 0.000057Table 4.
Gold pricemanagement

variables were motionless on the first alteration form. Third, the model says the only thingsthat they were related to each year were the real USD and real price of gold. And researchfocusing on the annual model. Lastly, this research has quantified one implication of how thereal macroeconomic factors affect the real price of gold. The researcher thinks that regressionequations can help in evaluating the macro-influence factors of gold prices.
The research model provides a quantified linkage between the real gold price and real-world GDP, RIR and real USDI. Nevertheless, it is interesting to note that the result of thepredicted rate of interest has the contrasting sign compared to the RIR in 2018. There is aphenomenon that showswhen the rate of interest rises and the actual price of goldwill not fallindefinitely. However, when the rate of interest falls, it is more likely to lead to a rebound inreal gold prices.
The researcher believes those investors who hold long positions in commodities now haveexpectations for inflation and economic improvement. They think that, as the economyimproves, the use of the metal industry will increase. For long positions in commodities, thestrong USD trend will lead to a drop in commodity prices.
It is the continuous changes in market sentiment that have an impact on the trend of goldprices, which has caused some commodity markets to fall in the current volatile areas.Investors are looking for signs of economic recovery, but at the same time, they are alsoinfluenced by other factors that can make them hesitant.
This research study was successful in testing a specification of this model, but furtherresearchmight enhance themodel because the gold price is highly volatile. In the next section,there are suggested research paths that might be taken that could improve the model.
Null hypothesis: GP has a unit rootExogenous: Constant
Lag length: 1 (Automatic – based on SIC, max lag = 7)
t-statistic Probability*
Augmented Dickey-Fuller test statistic −0.842575 0.7911
Test critical values: 1% level −3.689194
5% level −2.971853
10% level −2.625121
*MacKinnon (1996) one-sided p-values
Augmented Dickey-Fuller test equation
Dependent variable: D (GP)
Method: Least squares
Variable Coefficient Std. error t-statistic Probability
GP (−1) −0.035369 0.041977 −0.842575 0.4075
D (GP(−1)) 0.571918 0.170168 3.360902 0.0025
C 44.52811 35.55532 1.252361 0.2220
R-squared 0.312002 Mean dependent variance 36.80321
Adjusted R-squared 0.256962 SD dependent variance 116.5551
SE of regression 100.4701 Akaike info criterion 12.15855
Sum squared resid 252356.0 Schwarz criterion 12.30129
Log-likelihood −167.2198 Hannan-Quinn criteria 12.20219
F-statistic 5.668646 Durbin-Watson stat 1.673642
Prob (F-statistic) 0.009329Table 5.
BPMJ
Gol
d Pr
ice,
qua
rterly
freq
uenc
yQ
uarte
r rat
es
1980
:119
85:1
1990
:119
95:1
2000
:120
05:1
2010
:120
15:1
2020
:1
quar
ter
PLO
Tgp
gp18
0017
0016
0015
0014
0013
0012
0011
0010
00 900
800
700
600
500
400
300
200
Sour
ce(s
): G
old
Pri
ce f
rom
Fre
d W
ebsi
te (
Feb
ruar
y 8
, 2018)
< h
ttps:
//fr
ed.s
tlouis
fed.o
rgF
RE
D G
raph O
bse
rvat
ions
from
Fed
eral
Res
erve
Eco
nom
ic D
ata
Web
site
, (2
018)<
htt
ps:
//fr
ed.s
tlouis
fed.o
rg/s
erie
s/G
OL
DP
MG
BD
28N
LB
M/>
[D
ow
nlo
aded
Feb
8, 2018]
Figure 2.
Gold pricemanagement
RecommendationsEven though this research used multiple methods to analyze the relationship between realgold prices, real GGP, real IR and STV, the model may still have some small problems.
In estimating my model of gold with different approaches to real data, the research foundthat several econometric problems need to be addressed in future studies. Some of theseproblems were corrected.
However, future research should conduct the error correction model (ECM) for omittedvariables. The GGP should be substituted by the top gold producing countries’ total GDP.The other option is that it might be useful to use a dynamic specification with the lagstructure. Furthermore, a future study might select another dataset or a more significantdataset to avoid outliers.
Research needs to endure to study this subject in this zone. Gold prices are an exciting andcomplex subject, and there are many different study methods suitable to conduct furtherresearch and analysis in this area.
References
Akbar, M., Iqbal, F. and Noor, F. (2019), “Bayesian analysis of dynamic linkages among gold price,stock prices, exchange rate and interest rate in Pakistan”, Resources Policy, Vol. 62,pp. 154-164.
Alameer, Z., Abd Elaziz, M., Ewees, A.A., Ye, H. and Jianhua, Z. (2019), “Forecasting gold pricefluctuations using improved multilayer perceptron neural network and whale optimizationalgorithm”, Resources Policy, Vol. 61, pp. 250-260.
Baraviera, A.F., Font-Ferrer, A., Sorrosal-Forradellas, M.T. and Rosso, O.A. (2019), “An informationtheory perspective on the informational efficiency of gold price”, The North American Journalof Economics and Finance, Vol. 50, 101018.
Beckmann, J. and Czudaj, R. (2013), “Oil and gold price dynamics in a multivariate cointegrationframework”, International Economics and Economic Policy, Vol. 10, pp. 453-468.
Beckmann, J., Berger, T. and Czudaj, R. (2019), “Gold price dynamics and the role of uncertainty”,Quantitative Finance, Vol. 19, pp. 663-681.
Bhunia, A. and Ganguly, S. (2015), “Cointegration influence of macroeconomic indicators on stockmarket index in India”, American Journal of Theoretical and Applied Business, Vol. 1, pp. 1-5.
Bhunia, A. and Mukhuti, S. (2013), “The impact of domestic gold price on stock price indices- anempirical study of Indian stock exchanges”, Universal Journal of Marketing and BusinessResearch, Vol. 2, pp. 35-43.
Bhunia, A. (2013), “Cointegration and causal relationship among crude price, domestic gold price andfinancial variables: an evidence of BSE and NSE”, Journal of Contemporary Issues in BusinessResearch, Vol. 2, pp. 1-10.
Bouoiyour, J., Selmi, R. and Wohar, M.E. (2018), “Measuring the response of gold prices to uncertainty:an analysis beyond the mean”, Economic Modelling, Vol. 75, pp. 105-116.
Hassani, H., Silva, E.S., Gupta, R. and Segnon, M.K. (2015), “Forecasting the price of gold”, AppliedEconomics, Vol. 47 No. 4, pp. 4141-4152.
Huang, X., Jia, F. and Xu, X. (2019), “The threshold effect of market sentiment and inflationexpectations on gold price”, Resources Policy, Vol. 62, pp. 77-83.
Hussin, M.Y.M., Muhammad, F., Razak, A.A., Tha, G.P. and Marwan, N. (2013), “The link betweengold price, oil price and Islamic stock market: experience from Malaysia”, Journal of Studies inSocial Sciences, Vol. 4.
Jain, A. and Biswal, P.C. (2016), “Dynamic linkages among oil price, gold price, exchange rate, andstock market in India”, Resources Policy, Vol. 49, pp. 179-185.
BPMJ

Kalsum, U., Hidayat, R. and Oktaviani, S. (2020), “The effect of inflation, US dollar exchange rates,interest rates, and world oil prices on gold price fluctuations in Indonesia 2014–2019”, Journalof Business Management Review, Vol. 1, pp. 155-171.
Kanjilal, K. and Ghish, S. (2014), “Income and price elasticity of gold import demand in India: empiricalevidence from threshold and ARDL bounds test cointegration”, Resources Policy, Vol. 41,pp. 135-142.
Lili, L. and Chengmei, D. (2013), “Research of the influence of macro-economic factors on the price ofgold”, Procedia Computer Science, Vol. 17, pp. 737-743.
Liu, D. and Li, Z. (2017), “Gold price forecasting and related influence factors analysis based onrandom forest”, Proceedings of the Tenth International Conference on Management Science andEngineering Management, 2017, Springer, pp. 711-723.
Long, P.D. and Hanh, N.T.T. (2019), “Macroeconomic indicators and stock market prices: evidencefrom Vietnam”, Journal of Applied Economic Sciences, Vol. 4, pp. 84-91.
Mohi-U-Din, S. and Mubasher, H.M. (2013), “Macroeconomic variables on stock market interactions:the Indian experience”, Advances In Management, Vol. 6, p. 39.
Mombeini, H. and Yazdani-Chamzini, A. (2015), “Modeling gold price via artificial neural network”,Journal of Economics, Business and Management, Vol. 3, pp. 699-703.
Mukhuti, S. (2018), “Impact of gold price on stock market return– an econometric analysis of BSE andNSE”, International Journal of Management Studies, Vol. 5, pp. 1-16.
Nurulhuda, S., Hasan, R. and Mohd, A. (2018), “Does gold price lead or lags Islamic stock market andstrategy commodity price? A study from Malaysia”, International Journal of Business, Vol. 5,pp. 146-163.
Oluyemi, O. and Isaac, E.D. (2017), “The effect of exchange rate on imports and exports in Nigeriafrom January 1996 to June 2015”, IIARD International Journal of Economics and BusinessManagement, Vol. 3, pp. 66-77.
Patel, S.A. (2013), “Causal relationship between stock market indices and gold price: evidence fromIndia”, IUP Journal of Applied Finance, Vol. 19.
Shiva, A. and Sethi, M. (2015), “Understanding dynamic relationship among gold price, exchange rateand stock markets: evidence in Indian context”, Global Business Review, Vol. 16, pp. 93S-111S.
Singh, P. (2014a), “An empirical relationship between selected Indian stock market indices andmacroeconomic indicators”, International Journal of Research in Business Management, Vol. 2,pp. 81-92.
Singh, P. (2014b), “Indian stock market and macroeconomic factors in current scenario”, InternationalJournal of Research in Business Management, Vol. 2, pp. 43-54.
Singhal, S., Choudary, S. and Biswal, P.C. (2019), “Return and volatility linkages among internationalcrude oil price, gold price, exchange rate and stock markets: evidence from Mexico”, ResourcesPolicy, Vol. 60, pp. 255-261.
Zhao, X., Zeng, Y. and Zhao, D. (2015), “Distributed solar photovoltaics in China: policies andeconomic performance”, Energy, Vol. 88, pp. 572-583.
Zhu, Y., Dickinson, D. and Li, J. (2017), “Analysis on the influence factors of Bitcoin’s price based onVEC model”, Financial Innovation, Vol. 3, pp. 1-13.
Corresponding authorHafiz Waqas Kamran can be contacted at: [email protected]
For instructions on how to order reprints of this article, please visit our website:www.emeraldgrouppublishing.com/licensing/reprints.htmOr contact us for further details: [email protected]
Gold pricemanagement