how does trade affect regional disparities?
TRANSCRIPT

World Development Vol. 34, No. 7, pp. 1201–1222, 2006� 2006 Elsevier Ltd. All rights reserved
0305-750X/$ - see front matter
doi:10.1016/j.worlddev.2005.12.003www.elsevier.com/locate/worlddev
How Does Trade Affect Regional Disparities?
ANDRES RODRIGUEZ-POSELondon School of Economics, UK
and
NICHOLAS GILL *
University of Bristol, UK
Summary. — Although the relationships between rising trade, economic growth, and internationaldisparities have been well studied, those between trade and intranational disparities remain under-explored. In this paper, we present a theoretical formulation and empirical evaluation based oneight major world economies, finding that the link between trade and regional disparities is evi-denced most strongly when sectoral shifts in trade composition are considered. As primary sectorgoods trade loses importance in the composition of total trade, regional disparities are likely to in-crease. This effect may have a greater negative impact on developing countries because the initialmagnitude of intranational disparities tends to be greater in the developing world and its shareof agricultural trade has historically been higher.
� 2006 Elsevier Ltd. All rights reserved.Key words — trade, regional disparities, agriculture, manufacturing, world
* We would like to thank the editor of World Develop-
ment, three anonymous referees, and participants at
conferences and seminars in Brasilia, London, Porto,
and Madrid, for their insightful comments to earlier
versions of the paper. Andres Rodrıguez-Pose gratefully
acknowledges the financial support of the Royal Society-
Wolfson Research Merit Award during this research.
The usual disclaimer applies. Final revision accepted:December 8, 2005.
1. INTRODUCTION
The relationship between trade and economicgrowth has spawned a large theoretical andempirical body of literature. Free trade is gen-erally acknowledged to increase economic per-formance and national welfare in all but ahandful of cases (Fischer, 2003; Pugel & Lind-ert, 2000; Sachs & Warner, 1995). Nevertheless,despite the existence of a relatively broad con-sensus among economists (see, however, Ro-drik, 2003), there exist wide areas of debateabout the general implications of trade. Per-haps one of the most obvious examples is therelation between trade and regional disparities.While both topics have received ample treat-ment in recent years, and while mainstreamtrade theory holds basic and fundamentalimplications for income inequalities per se, therelation between trade and spatial income dis-parities within trading countries has remainedunder-explored.
What is more, those few scholars who haveaddressed the issue in one way or another havetended to disagree. Within the new economic
120
geography school, discussion over how fallingtransport costs affect the wealth of differentregions is central to the entire approach (seeKrugman, 1991). Nevertheless, the differencesin outcomes precipitated by relatively minoradjustments about the role of trade are consid-erable (contrast Krugman & Livas Elizondo,1996 with Paluzie, 2001). And outside new eco-nomic geography, the traditional Heckscher–Ohlin (H–O) based models of trade might welllead, on the one hand, to declining disparitiesas trade evolves, if capital and investment lookfor the areas with the lowest cost base and if la-bor migrates to higher salary zones. Another
1
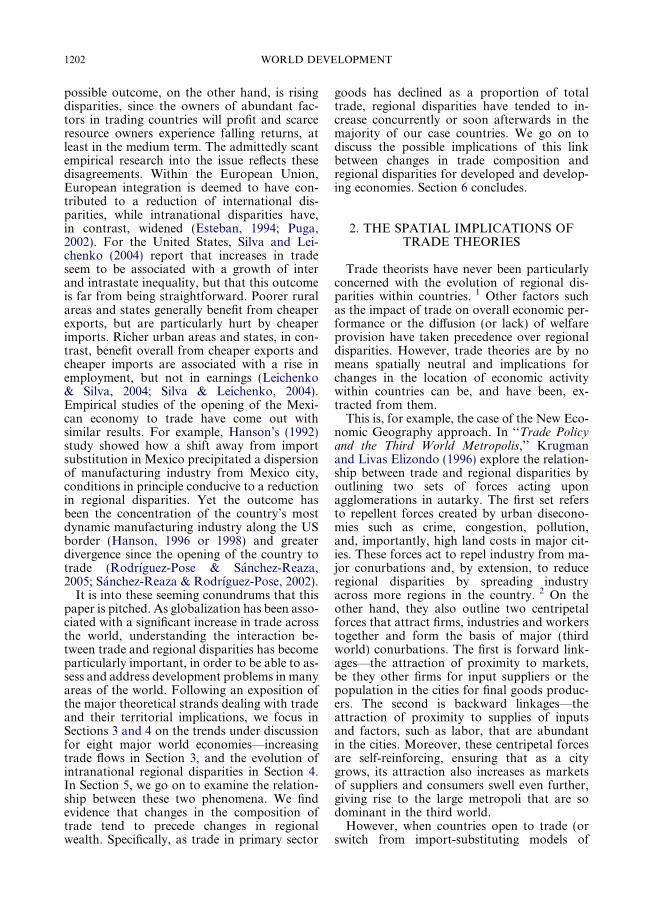
1202 WORLD DEVELOPMENT
possible outcome, on the other hand, is risingdisparities, since the owners of abundant fac-tors in trading countries will profit and scarceresource owners experience falling returns, atleast in the medium term. The admittedly scantempirical research into the issue reflects thesedisagreements. Within the European Union,European integration is deemed to have con-tributed to a reduction of international dis-parities, while intranational disparities have,in contrast, widened (Esteban, 1994; Puga,2002). For the United States, Silva and Lei-chenko (2004) report that increases in tradeseem to be associated with a growth of interand intrastate inequality, but that this outcomeis far from being straightforward. Poorer ruralareas and states generally benefit from cheaperexports, but are particularly hurt by cheaperimports. Richer urban areas and states, in con-trast, benefit overall from cheaper exports andcheaper imports are associated with a rise inemployment, but not in earnings (Leichenko& Silva, 2004; Silva & Leichenko, 2004).Empirical studies of the opening of the Mexi-can economy to trade have come out withsimilar results. For example, Hanson’s (1992)study showed how a shift away from importsubstitution in Mexico precipitated a dispersionof manufacturing industry from Mexico city,conditions in principle conducive to a reductionin regional disparities. Yet the outcome hasbeen the concentration of the country’s mostdynamic manufacturing industry along the USborder (Hanson, 1996 or 1998) and greaterdivergence since the opening of the country totrade (Rodrıguez-Pose & Sanchez-Reaza,2005; Sanchez-Reaza & Rodrıguez-Pose, 2002).
It is into these seeming conundrums that thispaper is pitched. As globalization has been asso-ciated with a significant increase in trade acrossthe world, understanding the interaction be-tween trade and regional disparities has becomeparticularly important, in order to be able to as-sess and address development problems in manyareas of the world. Following an exposition ofthe major theoretical strands dealing with tradeand their territorial implications, we focus inSections 3 and 4 on the trends under discussionfor eight major world economies—increasingtrade flows in Section 3, and the evolution ofintranational regional disparities in Section 4.In Section 5, we go on to examine the relation-ship between these two phenomena. We findevidence that changes in the composition oftrade tend to precede changes in regionalwealth. Specifically, as trade in primary sector
goods has declined as a proportion of totaltrade, regional disparities have tended to in-crease concurrently or soon afterwards in themajority of our case countries. We go on todiscuss the possible implications of this linkbetween changes in trade composition andregional disparities for developed and develop-ing economies. Section 6 concludes.
2. THE SPATIAL IMPLICATIONS OFTRADE THEORIES
Trade theorists have never been particularlyconcerned with the evolution of regional dis-parities within countries. 1 Other factors suchas the impact of trade on overall economic per-formance or the diffusion (or lack) of welfareprovision have taken precedence over regionaldisparities. However, trade theories are by nomeans spatially neutral and implications forchanges in the location of economic activitywithin countries can be, and have been, ex-tracted from them.
This is, for example, the case of the New Eco-nomic Geography approach. In ‘‘Trade Policyand the Third World Metropolis,’’ Krugmanand Livas Elizondo (1996) explore the relation-ship between trade and regional disparities byoutlining two sets of forces acting uponagglomerations in autarky. The first set refersto repellent forces created by urban disecono-mies such as crime, congestion, pollution,and, importantly, high land costs in major cit-ies. These forces act to repel industry from ma-jor conurbations and, by extension, to reduceregional disparities by spreading industryacross more regions in the country. 2 On theother hand, they also outline two centripetalforces that attract firms, industries and workerstogether and form the basis of major (thirdworld) conurbations. The first is forward link-ages—the attraction of proximity to markets,be they other firms for input suppliers or thepopulation in the cities for final goods produc-ers. The second is backward linkages—theattraction of proximity to supplies of inputsand factors, such as labor, that are abundantin the cities. Moreover, these centripetal forcesare self-reinforcing, ensuring that as a citygrows, its attraction also increases as marketsof suppliers and consumers swell even further,giving rise to the large metropoli that are sodominant in the third world.
However, when countries open to trade (orswitch from import-substituting models of

HOW DOES TRADE AFFECT REGIONAL DISPARITIES? 1203
development toward more export orientatedapproaches, as was the case of Mexico andother Latin American economies from the1980s onward), the situation changes. As pro-gressively more supplies are sourced fromabroad, and more output is sold abroad, theattraction of forward and backward linkagesis gradually diluted. Since it is costly to locatein urban areas due to continuing urban diseco-nomies of scale, the opening of trade thereforemay result in a dispersal of manufacturingindustry across the country, and, by extension,a reduction in regional disparities. From a dif-ferent perspective, Storper, Chen, and de Paolis(2002) reach similar results. When analyzingthe impact of growing trade in the EuropeanUnion, they find that locational concentrationappears not to have increased, with a rise inoutput in locationally spread sectors and a de-cline in concentrated industries (2002, p. 93). 3
Similarly, dispersion is higher where there arefewer external benefits to agglomeration, suchas information. Hence, under a new economicgeography framework, increases in manufac-turing trade could well be associated with a de-cline in regional disparities.
Starting from a similar new economic geo-graphy approach, however, Paluzie (2001)reaches different conclusions about the implica-tions of trade for regional disparities. While herassumptions are very similar to those of Krug-man and Livas (two regions, two sectors, andan emphasis on the impact of trade policieson manufacturing location), Paluzie predictsthat as trade in manufacturing increases, regio-nal disparities will also generally rise. The maindifference between Paluzie’s conclusions withrespect to those of Krugman and Livas lies inPaluzie’s development of the agricultural sectorand rural markets. She assumes that agricultureitself is tied to the land, by recognizing theimmobility of agricultural inputs in comparisonto those of manufacturing. And secondly, shesubstitutes the centrifugal force of high landcosts and rents for the pull of the market poten-tial of the dispersed agricultural population. Inaddition, in the short run, labor is relativelyimmobile. The result is that when the countryopens to trade, imports and exports to andfrom the major cities expand the hinterland ofthese conurbations. No longer are firms andindustries subject to the maximum size con-straint imposed by the limited demand ofdomestic rural markets—they can sustaingrowth, and agglomeration, by servicing for-eign demand, and making use of cheaper for-
eign inputs. The incentive to agglomeratetherefore increases alongside the increased mar-ket potential that cities have access to throughthe opening of export and import markets(Bliss, 1988; Edwards, 1993; Feder, 1983; Pack,1988; Zhang & Zhang, 2003). Similarly, risesin specialization across regions (Combes &Lafourcade, 2002), and the presence of hetero-geneous households and imperfect labor mobil-ity (Konya, 2001) are likely to foster regionalinequality. As a result, opening to manufactur-ing trade tends to increase the incentives forfirms, and workers, to concentrate in largecities, thereby increasing regional disparities. 4
The different territorial implications of neweconomic geography school approaches aretherefore sourced from differences in theassumptions surrounding the agricultural sec-tor. Paluzie finds that an increase in manu-facturing trade would exacerbate regionaldisparities in a world where agriculture andagricultural workers were relatively immobilein relation to manufacturing. Although H–Oapproaches make no particular predictionabout the evolution of regional disparities,some territorial implications can be extractedif we borrow some of Paluzie’s assumptions.If agriculture is again tied to the land, whilemanufacturing is more mobile and subject toagglomerative forces, and assuming that thelabor force is immobile and the cost of land re-mains stable, the distribution of these sectors islikely to be very uneven across a country fromthe outset. Moreover, trade in manufacturingin the H–O model benefits manufacturingworkers, at least in the medium term, becausetheir labor becomes relatively scarce and there-fore more expensive. Since manufacturingworkers are more concentrated than agricul-tural workers under our assumptions, this leadsto an increase in regional disparities. It is theunequally distributed manufacturing sectorthat benefits, while the regional disparity-reducing effect of a geographically dispersedagricultural sector is progressively undermined,which may lead to rising regional income differ-entials. Conversely, if agricultural trade devel-ops at the expense of manufacturing trade,then it is the agricultural workers who benefit,while manufacturing workers become relativelypoorer. As trade favors agricultural workersand the owners of land, and they are moreequally geographically distributed than manu-facturing workers, the increase in income theyenjoy acts to reduce regional income dispari-ties. Concurrently, the contraction of the

1204 WORLD DEVELOPMENT
manufacturing sector, which is concentrated inricher regions, brings these more prosperous re-gions closer to the regional income average—again reducing regional disparities. With theaugmentation of some simple assumptions sur-rounding the agricultural sector, therefore, theH–O model predicts a rise in regional incomedis- parities as the ratio of manufacturing toagricultural trade rises, in line with Paluzie’sassumptions (albeit through very different linesof reasoning).
Nevertheless, these arguments can be cri-tiqued by noting that those agricultural suppli-ers that participate in international trade mayvery well not transmit the gains from trade toagricultural workers. Similarly, urban manufac-turing firms may absorb the gains from tradeand not raise wages as trade increases. Thiswould sever the link between trade liberaliza-tion and wages, instead of establishing a linkbetween trade and profits. In monopsonistic la-bor markets, which characterize export sectorsin the third world in particular, this critique isespecially pertinent. For example, in the con-text of Vietnam, Litchfield, MuCulloch, andWinters (2003) find that for the country as awhole a one standard deviation increase in riceoutput increases the chance of individuals inthe output-increasing region escaping povertyby 75%, but in the Mekong Delta, where largeexport orientated firms dominate the industrialcomposition, the same increase in output in-creases the chance of escaping poverty by only5%.
Against this, however, four counter-claimscan be levied. First, if it is the case that suppli-ers begin to enjoy higher profits, this may be ex-pected to attract other profit-seeking firms,which may set in motion a degree of labor com-petition that can inflate wages. Admittedly,local firms may find barriers to entry toorestrictive, but MNCs are less likely to have dif-ficulty in overcoming investment barriers toprofitable markets, rendering them potentiallymore mobile and therefore more potent cata-lysts for labor competition (see Gorg & Strobl,2003; Lane, 1998). What is more, while MNCsmay be quick to enter a profitable market, thereis less evidence to suggest that they are quickto abandon markets that have slowed orstagnated, contrary to popular belief (Barry &Bradley, 1997; Gorg & Strobl, 2003; Mudambi,1998). This suggests that MNCs may not onlybe more capable competitors than local firms,but also more durable conduits of labor compe-tition.
Second, even if local markets are character-ized by a single large firm and a number ofmuch smaller, perhaps individual, agriculturalsuppliers, if export prices rise and the large firmconsequently directs more output abroad, rela-tive local scarcity may result as a secondary ef-fect. This cross-price substitution effect mayleave a greater proportion of the local marketavailable to local producers, allowing them toincrease their own revenues by filling the gapthat increasing MNC exports leaves behind,and re-establishing the link between interna-tional trade and local wages. Third, Litchfieldet al. (2003) themselves point out the equiva-lence between, on the one hand, wages andearnings in a situation of multiple single suppli-ers, and, on the other, hours worked in a situa-tion of a large dominant supplier. What theindustrial configuration precludes on the onehand by stunting wage growth, it may makeup on the other by increasing the hours avail-able to work. Fourth, again in the context ofVietnam, Hertel, Ivanic, Preckel, Cranfield,and Martin (2003) emphasize the fact that,while large firms may absorb the gains fromtrade in an expanding sector, they can also berelatively less mobile than individual workersin a contracting sector. This is especially thecase of landowners whose land capital isdifficult to be sold. The relative immobility oflandowners in Vietnam has meant that asmanufacturing has expanded, it is this groupthat has been left to absorb the majority oflosses in the agricultural sector, contributingto a decline in income inequalities.
We proceed, then, with the assumption thatan increase in exports in a particular sectorcan contribute to an increase in the regionalwealth associated with this sector. If agricul-tural labor is tied to the land, then these gainsmay benefit manufacturing workers at their ex-pense, while, in contrast, if the assumption ofthe lack of mobility of labor is relaxed, the out-come could be significantly different. A rise inmanufacturing trade would indeed, in the firstinstance, benefit manufacturing workers, butwould at the same time entice agriculturalworkers to move to manufacturing areas andbecome employed in manufacturing. Given rel-atively low barriers to entry, this would in themedium term generate a relative drop in manu-facturing wages. At the same time, congestionin urban manufacturing areas, and lower landand labor costs in rural areas, is likely to luremanufacturing firms into more distant loca-tions, contributing to a factor–price equaliza-

HOW DOES TRADE AFFECT REGIONAL DISPARITIES? 1205
tion process, whose ultimate outcome is likelyto be a reduction in regional disparities.
Admittedly, the theoretical literature ontrade offers only patchy and inconsistent in-ferences about the impact of trade on regionaldisparities. There are some common denomina-tors, however. Most importantly, both the neweconomic geography school and our extendedH–O model emphasize the effect of trade com-position on regional disparities, rather thantrade per se. 5 From this point onward, it seemsto be the assumptions that surround the rela-tionship between trade in agriculture and tradein manufacturing that may hold a greater swayover the evolution of regional disparities. Ifagricultural production and workers are as-sumed to be less mobile than those of manufac-turing, then Paluzie (2001) and the H–O modelwe have discussed first might predict rising dis-parities as manufacturing trade increases. Onthe other hand, if the lack of mobility assump-tions in the primary sector are relaxed, new eco-nomic geography models a la Krugman andLivas Elizondo (1996) and some H–O analysescould result in falling disparities as manufactur-ing trade develops.
Of course, there are some important caveatsto all of these arguments. We are focusing ononly a relatively narrow range of economicmechanisms that operate in a complex realworld environment. Hence, both the new eco-nomic geography school and the H–O modeltend to abstract from important factors suchas the availability of information, includinginformation about prices, which has its ownparticular geography and may well be coun-try-specific. The relative size of the agriculturaland manufacturing sectors is also likely to beimportant. Hertel et al. (2003) compare thepoverty-reducing potential of trade liberaliza-tion between Chile, a developing country witha relatively small agricultural sector, andMalawi, whose agricultural sector is muchmore important. They find that the poverty-reducing effects of agricultural liberalizationare out-weighed by labor in-movement to theagricultural sector in Chile, while in Malawi,the gains are substantial enough to survive thediluting effect of sectoral labor migration. Thearguments also implicitly operate within atwo-country analytical framework, which doesnot take account of the strategic aspects oftrade that result from three-or-more-countryinteraction. Finally, the importance of domestictransport costs should not be underestimated.As Krugman (1991) has argued, the level of
transport costs mediates the influence ofagglomerative pressures in complex, non-linearways. If transport costs are very low, then it isunreasonable to expect significant urban con-centration in spite of increasing manufacturingtrade, for example.
Nevertheless, the salience of the issue of fac-tor mobility is confirmed by long-standingdebates within development economics. Mostprominently, the Lewis model (Lewis, 1954)posits that high economic growth trajectoriesdepend upon relatively free movements of laboracross sectors, so that in-coming labor from the‘‘subsistence’’ sector can respond to high wagesin the ‘‘capitalist’’ sector, thus supportingdomestic saving and growth. We can infer,then, that the Lewis model suggests that if tradeis stimulated, the potential gains this may intro-duce depend upon intersectoral labor transfer.This discussion has also highlighted the central-ity of factor mobility to the likely impact oftrade liberalization. While Lewis himself wentfurther, however, and was happy to assumesuch mobility, our research in the following sec-tions questions this assumption.
The following two sections of this paper setout the trends under discussion—increasingtrade flows (and their composition) in Section3 and rising regional disparities in Section 4.Section 5 then examines how these trends inter-act, and the implications for developed anddeveloping countries.
3. INCREASING TRADE FLOWS
By any number of measures, the increase intrade flows over the last three decades has beendramatic and pervasive. Trade in manufactur-ing, in services, both exports and imports andmerchandise trade, as well as foreign directinvestment, have all shown remarkable acceler-ation since at least the start of the 1980s.Importantly, trade has not only increased, butalso begun to account for an increasing propor-tion of production. Increasing trade has led to adilution of the traditional three-centered pat-tern of international trade, drawing increas-ingly far-flung countries into the mainstreamtrading community. This can be seen especiallyclearly in the case of the emerging East AsianEconomies in the mid to late 1990s. But asimilar reorientation to the world economyhas occurred across Latin America as import-substituting models of development wereabandoned in favor of more export-orientated

1206 WORLD DEVELOPMENT
ones over the period. Hence, Argentina, Brazil,Chile, Mexico, and Peru have all entered intofar closer trading relationships than before the1980s, when import substitution prevailed.Moreover, both China and India have explicitlyattempted to open their economies since 1978and 1991, respectively—with all the implica-tions that the opening of such huge countriesentails. Alongside this, the transition of EasternEurope and the demise of the former USSRhave also contributed to rising trade flows.And, within Europe, on-going economic andsocial integration has propelled trade both be-tween the European partners and outside theEuropean region.
Taken together it is no surprise that thesedevelopments have caused trade to rise dramat-ically in recent years. Figure 1 shows the rise inglobal trade as a percentage of world GDP.From 1970 to 2001, the percentage of worldoutput that was traded between countries rosefrom 27% to just under 60%, with the biggestincrease taking place during the 1990s.
Figure 2 shows the proportion of outputtraded by the eight countries that form thebasis of this paper. These countries accountedcollectively for 36% of world exports and 41%of world imports of merchandise in 2004, ren-dering them reasonably representative of globalexperiences (World Trade Organization data,2005). Their joint average level of trade as apercentage of GDP in 2000 was very close tothe world average (World Development Indica-tors, 2000). Nevertheless, the selection is alsointended to capture a degree of diversity, span-ning democratic and non-democratic, rich andpoor, North and South countries. From Figure2, we can discern a consistent increase in output
0
10
20
30
40
50
60
70
1970
1973
1976
1979
1982
19Y
Perc
ent
Figure 1. Global trade as a percentage of world output.
Development Ind
traded across the period. The average propor-tion of output traded in our sample rose from23.5% in 1975 to 47% in 2000—once again adoubling over the period. Some of our chosencountries might be expected to show smallertrade shares than the world in general, simplybecause they are relatively large economies withlarge internal markets. In the case of the UnitedStates, for example, only one quarter of its out-put is traded externally because so many of itsneeds are met within its national boundaries.In any case, our sample of countries mirrorsthe world trend toward increasing trade flows.In the cases of China, Mexico, and Spain, thegrowth of trade as a percentage of nationalGDP well exceeds the world average. In othercases, such as Brazil, India, Italy, Germany,or the United States, the expansion of trade ismore moderate, although key political deci-sions such as the single European Market con-tributed to boost trade in the 1990s in the casesof Germany and Italy, while economic reformin 1991 had a similar effect for India.
Not only has the volume of trade increased,but its composition has also shifted—a featurethat takes on considerable significance in thelight of the theoretical discussion in Section 2.Figure 3 shows the growth in agricultural andmanufacturing trade in the world economysince 1970. Although both sectors started fromdifferent positions, agricultural trade expandedalongside manufacturing trade for most of theperiod. This despite the on-going trade liberal-ization of manufactures while agriculturalproducts remained largely protected. By themid-1990s, however, agricultural trade couldnot keep pace with manufacturing, partiallyas a result of the sectorally biased nature of
8519
8819
9119
9419
9720
00
ear
Source: Own development, using World Bank, World
icators data.

0
10
20
30
40
50
60
70
80
1975
1977
1979
1981
1983
1985
1987
1989
1991
1993
1995
1997
1999
Perc
enta
ge tr
ade
in G
DP
Brazil
China
Germany
India
Italy
Mexico
Spain
United States
Figure 2. Trade as a percentage of GDP in the sample countries. Source: Own development, using World Bank, World
Development Indicators data.
0
50
100
150
200
250
1970
19
74
1978
19
82
1986
19
90
1994
19
98
Year
Inde
x 19
90 =
100
Agriculture
Manufacturing
Figure 3. Evolution of world trade in agricultural and
manufacturing products. Source: Own development, using
World Trade Organization (2001) data.
HOW DOES TRADE AFFECT REGIONAL DISPARITIES? 1207
trade liberalization initiatives. According toJank, Fuchsloch, and Kutas (2003), in the caseof tariffs that are weighted by trade volumes,
when both Brazil and the US export their agri-cultural products they are likely to face doublethe level of protectionism on average than whenattempting to export their industrial goods (seealso Gibson, Wainio, Whitley, & Bohman,2001). In the developed world, this protection-ism is the result of peculiarly well-organizedagricultural interest groups, alongside the per-ceived strategic importance of food sources.In the developing world, the fact that manyagricultural exporters actually only export anarrow range of products means that thedomestic agricultural sector is no more capableof meeting domestic demand than in the devel-oped world. Concerns over food security arecoupled with a degree of aversion to fooddependence on countries with food surpluses,especially if these surpluses belong to devel-oped countries with over-production policies,which already hold the upper hand in tradenegotiations. Hence, ‘‘[D]espite the achieve-ments of [recent liberalization initiatives], agri-culture continues to be the most protectedsector in the world economy’’ (Jank et al.,2003, p. 11).
The relative weight of agricultural trade hastherefore been progressively undermined bythe rising importance of trade in manufactur-ing, and later, in services. Figure 4 shows theevolution of the ratio of agricultural to manu-facturing exports for each of our eight chosen

0
0.2
0.4
0.6
0.8
1
1.2
1.4
1.6
1.8
2
1980
1982
1984
1986
1988
1990
1992
1994
1996
1998
2000
Year
Rat
io
Brazil
China
Germany
India
Italy
Mexico
Spain
USA
Figure 4. Agricultural to manufacturing export ratios for our eight case countries. Source: Own development, using
Comtrade, United Nations Statistics Division data.
1208 WORLD DEVELOPMENT
countries. 6 As is readily apparent, the propor-tion of agriculture to manufacturing has fallensteadily since 1980 on average. For example,Brazil’s ratio fell from 1.6 in 1980 to below par-ity in 1985 and stood at just over 0.7 in 2001(Figure 4). This means that for every unit ofmanufactures exported from Brazil, under halfthe value of agricultural products were ex-ported in 2001 as in 1980. China experienceda similar decline, from 0.75 in 1980 to over0.4 in 1987 to just 0.08 in 2001. The most spec-tacular change, however, has taken place inMexico, where the agricultural to manufactur-ing trade ratio fell from 1.49 in 1980 to 0.07in 2001. On a less pronounced scale, the devel-oped countries in the sample underwent similarchanges, although for them, the ratio of agri-cultural to manufacturing exports was alreadyso small as to make further reductions lesslikely. Hence, during 1980–2001, Italy saw itsratio of agricultural to manufacturing exportsfall from 0.11 to 0.085, and Spain also experi-enced a steady decline, from 0.28 to 0.23. In-deed, in every case, our chosen countriesexhibited some reduction of the ratio of theiragricultural to manufacturing export values asmanufacturing trade experienced liberalization,while agricultural products remained highlyprotected (see Pugel & Lindert, 2000).
To summarize the above discussion, two ma-jor points of interest can be drawn out that willbe useful for our analysis in Section 5. The firstis that trade in general increased dramaticallysince 1980, and that this increase was sourcedfrom a variety of areas of the world, with fewexceptions. Relative to production, trade dou-bled since 1970 and, without considering pro-duction, the absolute value of trade increased14-fold since 1950. The second notable featureof the trends outlined is that agricultural tradedid not increase to the extent that manufactur-ing trade did. This may largely be a result of thebiased trade liberalization initiatives that theWTO (formerly GATT) has implemented overthe period. Again, this is a pervasive trend onthe evidence of our case countries, and hasled to a lessening of the relative importance ofagricultural exports.
4. THE INCREASE IN REGIONALDISPARITIES
While the trend toward increasing trade flowsis well known, the trend toward increasing re-gional disparities is less well documented, andyet almost equally as pervasive. Regional dis-parities in most countries are either stable or
HOW DOES TRADE AFFECT REGIONAL DISPARITIES? 1209
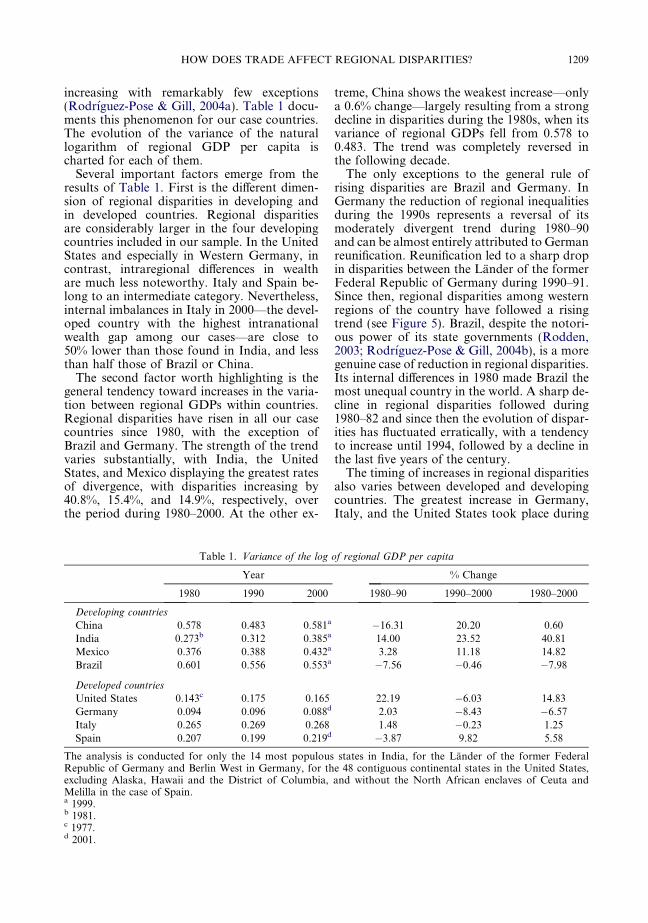
increasing with remarkably few exceptions(Rodrıguez-Pose & Gill, 2004a). Table 1 docu-ments this phenomenon for our case countries.The evolution of the variance of the naturallogarithm of regional GDP per capita ischarted for each of them.
Several important factors emerge from theresults of Table 1. First is the different dimen-sion of regional disparities in developing andin developed countries. Regional disparitiesare considerably larger in the four developingcountries included in our sample. In the UnitedStates and especially in Western Germany, incontrast, intraregional differences in wealthare much less noteworthy. Italy and Spain be-long to an intermediate category. Nevertheless,internal imbalances in Italy in 2000—the devel-oped country with the highest intranationalwealth gap among our cases—are close to50% lower than those found in India, and lessthan half those of Brazil or China.
The second factor worth highlighting is thegeneral tendency toward increases in the varia-tion between regional GDPs within countries.Regional disparities have risen in all our casecountries since 1980, with the exception ofBrazil and Germany. The strength of the trendvaries substantially, with India, the UnitedStates, and Mexico displaying the greatest ratesof divergence, with disparities increasing by40.8%, 15.4%, and 14.9%, respectively, overthe period during 1980–2000. At the other ex-
Table 1. Variance of the log
Year
1980 1990 2000
Developing countries
China 0.578 0.483 0.581a
India 0.273b 0.312 0.385a
Mexico 0.376 0.388 0.432a
Brazil 0.601 0.556 0.553a
Developed countries
United States 0.143c 0.175 0.165Germany 0.094 0.096 0.088d
Italy 0.265 0.269 0.268Spain 0.207 0.199 0.219d
The analysis is conducted for only the 14 most populousRepublic of Germany and Berlin West in Germany, for thexcluding Alaska, Hawaii and the District of Columbia,Melilla in the case of Spain.a 1999.b 1981.c 1977.d 2001.
treme, China shows the weakest increase—onlya 0.6% change—largely resulting from a strongdecline in disparities during the 1980s, when itsvariance of regional GDPs fell from 0.578 to0.483. The trend was completely reversed inthe following decade.
The only exceptions to the general rule ofrising disparities are Brazil and Germany. InGermany the reduction of regional inequalitiesduring the 1990s represents a reversal of itsmoderately divergent trend during 1980–90and can be almost entirely attributed to Germanreunification. Reunification led to a sharp dropin disparities between the Lander of the formerFederal Republic of Germany during 1990–91.Since then, regional disparities among westernregions of the country have followed a risingtrend (see Figure 5). Brazil, despite the notori-ous power of its state governments (Rodden,2003; Rodrıguez-Pose & Gill, 2004b), is a moregenuine case of reduction in regional disparities.Its internal differences in 1980 made Brazil themost unequal country in the world. A sharp de-cline in regional disparities followed during1980–82 and since then the evolution of dispar-ities has fluctuated erratically, with a tendencyto increase until 1994, followed by a decline inthe last five years of the century.
The timing of increases in regional disparitiesalso varies between developed and developingcountries. The greatest increase in Germany,Italy, and the United States took place during
of regional GDP per capita
% Change
1980–90 1990–2000 1980–2000
�16.31 20.20 0.6014.00 23.52 40.813.28 11.18 14.82�7.56 �0.46 �7.98
22.19 �6.03 14.832.03 �8.43 �6.571.48 �0.23 1.25�3.87 9.82 5.58
states in India, for the Lander of the former Federale 48 contiguous continental states in the United States,and without the North African enclaves of Ceuta and

Brazil - trade and inequalities
80
90
100
110
120
130
140
1980 1982 1984 1986 1988 1990 1992 1994 1996 19980.5
0.52
0.54
0.56
0.58
0.6
0.62
Regional D
isparities
China - trade and inequalities
02040
6080
100120
140160180
1980 1982 1984 1986 1988 1990 1992 1994 1996 1998
Inde
x of
trad
e 19
90 =
100
0
0.1
0.2
0.3
0.4
0.5
0.6
Regional D
isparities
India - trade and inequalities
75
85
95
105
115
125
135
145
155
165
1980-811983-841986-871989-901992-931995-961998-99
Inde
x of
trad
e 19
90 =
100
0.15
0.2
0.25
0.3
0.35
0.4
0.45
0.5
Regional D
isparities
Italy - trade and inequalities
80
90
100
110
120
130
140
150
198019821984198619881990199219941996199820000.240.2450.250.2550.260.2650.270.2750.280.2850.29
Regional D
isparities
Mexico - trade and inequalities
20
40
60
80
100
120
140
160
180
1970 1973 1976 1979 1982 1985 1988 1991 1994 1997
Inde
x of
trad
e 19
90 =
100
0.3
0.32
0.34
0.36
0.38
0.4
0.42
0.44
Regional D
isparities
America- trade and inequalities
60708090
100110120130140150
1977
1979
1981
1983
1985
1987
1989
1991
1993
1995
1997
1999
Inde
x of
trad
e 19
90 =
100
00.020.040.060.080.10.120.140.160.180.2
Regional D
isparities
Spain - trade and inequalities
70
90
110
130
150
170
190
1980 1982 1984 1986 1988 1990 1992 1994 1996 1998 20000.16
0.17
0.18
0.19
0.2
0.21
0.22
0.23
Regional D
isparities
Germany - trade and inequalities
60
70
80
90
100
110
120
130
1975 1978 1981 1984 1987 1990 1993 1996 1999
Inde
x of
trad
e 19
90 =
100
Inde
x of
trad
e 19
90 =
100
Inde
x of
trad
e 19
90 =
100
0.160.170.180.190.20.210.220.230.240.250.26
Regional D
isparities
Inde
x of
trad
e 19
90 =
100
Figure 5. Changes in trade as a percentage of GDP and in regional disparities.
1210 WORLD DEVELOPMENT
the 1980s, with the 1990s displaying moderatedeclines in all three countries. Spain is the onlyexception among the developed countries in thesample, as regional disparities increased consid-erably in the 1990s. Among the four developing
countries included in our sample, however, thetrend has been toward an acceleration of thegrowth of regional disparities in the 1990s withrespect to the 1980s, coinciding also with agreater openness of these countries to trade.

HOW DOES TRADE AFFECT REGIONAL DISPARITIES? 1211
In Brazil the trend has been toward a decelera-tion of the regional convergence process.
One further observation relating to Table 1 isworth noting. While trade as a percentage ofGDP increased for all our eight case countrieswithout showing a marked pattern betweendeveloped and developing countries (see Figure2), it is the sectoral trade ratio charted in Figure4 that seems to exhibit some temporal coinci-dence with rising regional disparities. Specifi-cally, all four developing countries in Figure4, as well as the United States, experiencedsharp declines in their agricultural to manufac-turing export ratios, in part because their agri-cultural exports were more significant initially.It is our intention in this paper to explore thelink between changes in agriculture to manu-facturing export ratios and the evolution of re-gional disparities more closely.
In short, this section has established a com-mon and general trend toward divergence, orat least a discontinuity of convergence, acrossour case countries. Numerous factors mayaffect the evolution of regional disparities,including the global trend toward devolution(Rodrıguez-Pose & Gill, 2003), factor tradingand nationally based policies. It is our aim inthe next section to establish whether tradeand trade composition also play some part indetermining spatial disparities.
5. A RELATIONSHIP BETWEEN TRADEAND REGIONAL DISPARITIES?
(a) Trade and regional disparities
In this section, we examine to what extentthere is a link between trade and regional dis-parities and attempt to establish the directionof that relationship. Firstly, we analyze therelationship between the volume of trade acountry conducts and its level of spatial dispar-ities. Following this, we examine the relation-ship between the composition of trade andregional disparities, run some basic tests con-cerning the robustness of our findings, andfinally discuss these results at the end of the sec-tion. Figure 5 documents the correlationbetween the evolution of the coefficient of var-iation of the natural logarithm of regional GDPper capita and that of the percentage of outputtraded for our eight case countries. The dashedline represents the evolution of regional dispar-ities, whose scale is depicted on the right-y-axis.The continuous line represents a trade index
where 1990 trade levels are set to 100. The scaleis represented on the left-y-axis.
While, at first sight, there seems to be someevidence of a relationship between trade and re-gional disparities in a few of the cases—such asin Italy, India, and perhaps Brazil—the major-ity of countries display no such correlation. Inthe United States, disparities vary only slightly,while trade increases throughout the period,and in China disparities fall and then increaseas trade increases. Mexico and Spain follow asimilar pattern to China, with falling and thenrising disparities as trade increases. And in Ger-many, there is little sign of any association be-tween the increase in trade from 1975 to 1989and the evolution of regional disparities,although after the exogenous shocks resultingfrom reunification during the late 1980s andearly 1990s some positive correlation betweenthe two variables is evident. In general, then,there seems to be no consistent evidence of arelationship between trade and regional dispar-ities, and no agreement, where a relationship issuggested, over its direction. This lack of over-all relationship was confirmed by preliminarymultivariate analyses that showed no relation-ship between both indicators in any of the eightsample countries.
In terms of the theoretical discussion of Sec-tion 2, the lack of a consistent relationship be-tween regional disparities and trade shouldcome as no surprise. All the theories and ideasthat were discussed had the common feature ofemphasizing the sectoral composition of tradeas a determinant of regional disparities. Mosttheories that link trade and territorial inequal-ity assume two sectors and make predictions,either implicitly or explicitly, based on relativetrade shares between manufacturing and agri-cultural imports and exports. As seen in Section3, even as recently as 2001, agriculture playedan important part in the export mixes of ourcase countries. The ratio of agricultural to man-ufacturing exports stood, on average, at over0.2. Clearly, the importance of recognizing thedifferences between these two sectors has notdiminished. It is vital, therefore, to test not onlythe evolution of trade flows, but also the evolu-tion of the composition of trade. Only whenthese two factors are taken together is the the-ory given a fair chance.
(b) Trade composition and regional disparities
The question we now address is whetheror not trade composition has any effect on

1212 WORLD DEVELOPMENT
regional disparities and here we turn to devel-oping a simple model that seeks to examinethe relationship between trade and disparities.The first point to note is that trade compositioncannot have an effect on regional disparities ifthere is no trade. Hence, in order to answerour question, we have to take into accountthe degree to which a country is involved intrade: the influence of trade composition is con-tingent upon the importance of trade itself. Ifthere is little involvement, then trade composi-tion cannot be expected to be important todomestic economics, and therefore have aninfluence on determining regional disparities.In order to assess the impact of trade composi-tion on regional disparities, an index of tradecomposition, weighted by the degree to whicha country trades, is proposed.
For our measure of trade composition, we fo-cus on the ratio of primary to secondary sectorexports. Exports are more useful than importsfor our purposes, since all the theories and ideasdiscussed in Section 2 are essentially supply-sidearguments and it is exports that are sourcedfrom domestic industry. We define primary (oragricultural) and secondary (or manufacturing)traded commodities using the criteria set up inendnote 6. By dividing the change in the shareof primary exports by the change in the shareof secondary exports and weighting the resultby the percentage of GDP traded by each ofour case countries during the period taken intoconsideration, a simple index of the agriculturalto manufacturing export ratio is obtained. Thistrade composition index captures the basic as-pects of the models and ideas discussed inSection 2, and by plotting the change in the in-dex against regional disparities we obtain somenotion of how relevant—and in what ways—theevolution of the size and the composition oftrade is for determining regional disparities.
The index is constructed in the followingway 7:
TCIt�0¼ 1� AEt=MEt
AE0=ME0
� �
� ½ðT 0=GDP 0Þ �100�þ ½ðT t=GDP tÞ �100�2
� �;
where TCI is the trade composition index, AEdenotes agricultural exports, ME denotes man-ufacturing exports, T represents total trade,GDP the total GDP of a country, and 0 and trepresent the beginning and the end of the per-iod of analysis, respectively.
The index utilizes export data, rather thanimports, because export industries are the onesthat will largely determine domestic employ-ment and wage patterns, which in turn con-tribute to determine the degree of regionaldisparities that we are seeking to predict. Thefirst half of the index captures the changing ex-port composition in each of the eight countriesincluded in the analysis. If the agricultural tomanufacturing export ratio increases, the indexfalls, since this term will be negative. If, on theother hand, there is a decline in the ratio ofagricultural exports to manufacturing exports,then the index rises. The second half of the in-dex represents the average proportion of GDPtraded during the period of analysis. The higherthe level of trade, the greater the dimension ofthe index in absolute numbers.
Taking three fictitious examples, imagine firstthat country A conducts equal amounts oftrade in manufacturing and agriculture so thatduring 1995–2000, this ratio remains the same.Imagine further that country A experiences alarge increase in the amount of trade conductedover the period. The fact that the ratio betweenmanufacturing and agricultural trade has re-mained constant renders the first term in our in-dex equal to zero. Given this, no amount ofchange in the degree of trade undertaken bycountry A during 1995–2000 will impact uponthe index: the trade undertaken is balanced be-tween sectors, and therefore the index predictsthat there will be no regional disparity effects,as per our theoretical discussion. Now considercountry B, which increases its manufacturingshare in trade during 1995–2000 significantly,from equality with agriculture in 1995 to com-plete dominance in 2000. The first term in theindex will now be equal to 1. Assume further,however, that the actual amount of trade thatcountry B conducts during 1995–2000 is verysmall in both years. This means that the secondterm in the index will be close to zero, so thatthe index will again yield a low result. Thismeans that our predictor of the inequality-increasing effect of a rise in the importance ofmanufacturing over agricultural trade will below, not because manufacturing trade is not ex-pected to lead to higher disparities, but becausevery little trade per se is undertaken, despite thepreponderance of manufacturing. Finally,country C experiences a similar increase in theimportance of manufacturing trade relative toagricultural trade across the period, but coun-try C is consistently involved in a large amountof trade. In this case, both the first and second
HOW DOES TRADE AFFECT REGIONAL DISPARITIES? 1213
terms of the index will be high, and the indexwill therefore yield a result close to one, indicat-ing that because trade is important and becausemanufacturing has come to dominate, the indexpredicts an increase in regional disparities.Charting the accuracy with which the indexpredicts actual regional disparities will subse-quently concern us, and if we do discover thatthere is some correlation, this might supportour hypothesis that trade composition, contin-gent upon the importance of trade, affects re-gional inequalities.
An immediate critique of the index, however,is the embodied assumption that trade per sedoes not determine disparities. The index onlyallows trade to have an effect if the ratio be-tween agricultural and manufacturing tradealters, as country A’s case illustrates. In theirstudy of China, Zhang and Zhang (2003) foundthat after domestic capital, trade was the singlemost important determinant of regional dispar-ities during 1986–98 out of various factorsincluding foreign capital inflows, education,and geographic location. Two points shouldbe noted in response to this, however. Firstly,Zhang and Zhang (2003) did not consider thecomposition of trade in reaching this conclu-sion, and it may be the case that trade compo-sition actually underpins some of the effectsthey have attributed to trade itself. Secondly,though, it is certainly not our intention to ex-plain the entire variation of regional incomeswith our simple composition index. It may cer-tainly be the case that trade per se also hasa determining aspect—all we are hoping tofind is a correlation between our index andregional disparities, not an exhaustive causalrelation.
Related to this, we certainly do not wish todeny the salience of other potentially importantdeterminants of regional disparities. Hendersonand Wang (2005) underline the importance ofcity formation trajectories, savings rates, therelative size of rural and urban sectors, humancapital, migration costs, and wealth and abilitydistributions in their discussion of urbaniza-tion, and there can be little doubt over theircollective importance to regional disparities.Similarly, Arbache, Dickerson, and Green(2003) emphasize education and technologicalchange, and Rodrıguez-Pose and Gill (2003,2004a) have examined the importance of gov-ernmental structures and devolution. Whilethese are important factors affecting the evolu-tion of disparities, we would emphasize that re-gional economic disparities remain relatively
poorly understood, and that the investigationand establishment of the range of factors thatdetermine their magnitude remains cruciallyimportant.
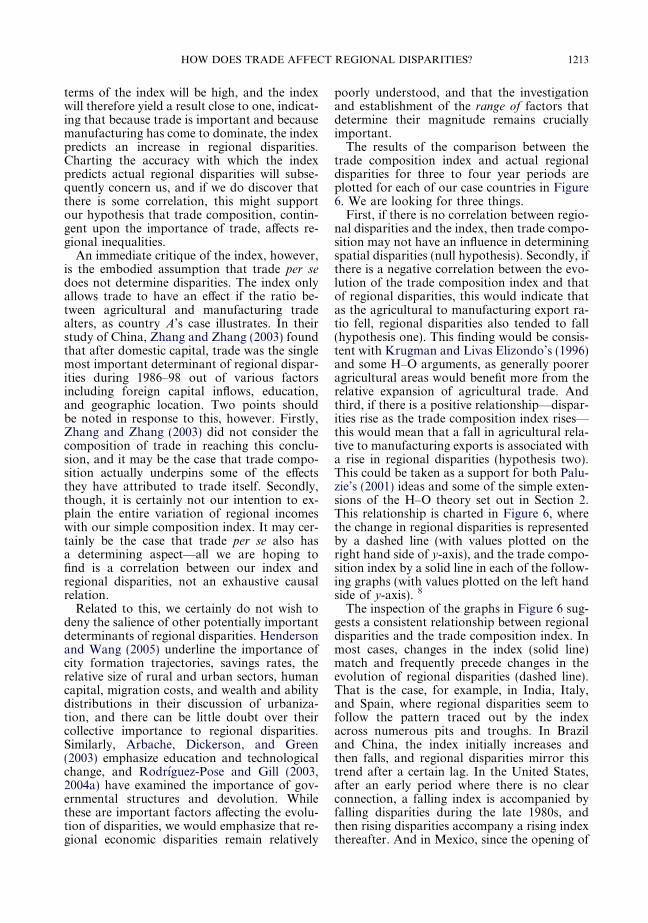
The results of the comparison between thetrade composition index and actual regionaldisparities for three to four year periods areplotted for each of our case countries in Figure6. We are looking for three things.
First, if there is no correlation between regio-nal disparities and the index, then trade compo-sition may not have an influence in determiningspatial disparities (null hypothesis). Secondly, ifthere is a negative correlation between the evo-lution of the trade composition index and thatof regional disparities, this would indicate thatas the agricultural to manufacturing export ra-tio fell, regional disparities also tended to fall(hypothesis one). This finding would be consis-tent with Krugman and Livas Elizondo’s (1996)and some H–O arguments, as generally pooreragricultural areas would benefit more from therelative expansion of agricultural trade. Andthird, if there is a positive relationship—dispar-ities rise as the trade composition index rises—this would mean that a fall in agricultural rela-tive to manufacturing exports is associated witha rise in regional disparities (hypothesis two).This could be taken as a support for both Palu-zie’s (2001) ideas and some of the simple exten-sions of the H–O theory set out in Section 2.This relationship is charted in Figure 6, wherethe change in regional disparities is representedby a dashed line (with values plotted on theright hand side of y-axis), and the trade compo-sition index by a solid line in each of the follow-ing graphs (with values plotted on the left handside of y-axis). 8
The inspection of the graphs in Figure 6 sug-gests a consistent relationship between regionaldisparities and the trade composition index. Inmost cases, changes in the index (solid line)match and frequently precede changes in theevolution of regional disparities (dashed line).That is the case, for example, in India, Italy,and Spain, where regional disparities seem tofollow the pattern traced out by the indexacross numerous pits and troughs. In Braziland China, the index initially increases andthen falls, and regional disparities mirror thistrend after a certain lag. In the United States,after an early period where there is no clearconnection, a falling index is accompanied byfalling disparities during the late 1980s, andthen rising disparities accompany a rising indexthereafter. And in Mexico, since the opening of

Brazil - trade composition and inequalities
-1
0
1
2
3
4
5
6
7
8
1980-84 1984-88 1988-92 1992-96 1996-98
Com
posi
tion
Inde
x
-0.08
-0.06
-0.04
-0.02
0
0.02
0.04
0.06 Change in R
egional Disparities
China - trade composition and inequalities
00.5
11.5
22.5
33.5
44.5
5
1987-89 1989-91 1991-93 1993-95 1995-97 1997-98
Com
posi
tion
Inde
x
-0.03
-0.02
-0.01
0
0.01
0.02
0.03
0.04
0.05
Change in R
egional Disparities
Change in R
egional Disparities
India - trade composition and inequalities
02468
1012141618
1980-84 1984-88 1988-91 1991-95 1995-99
Com
posi
tion
Inde
x
0
0.01
0.02
0.03
0.04
0.05
0.06
0.07
Change in R
egional D
isparities
Italy - trade composition and inequalities
-1
0
1
2
3
4
5
1980-84 1984-88 1988-92 1992-96 1996-00
Com
posi
tion
Inde
x
-0.025
-0.015
-0.005
0.005
0.015
0.025
0.035
0.045 Change in R
egional Disparities
Change in R
egional Disparities
Mexico - trade composition and inequalities
-20-15
-10-5
05
1015
2025
30
1980-84 1984-88 1988-92 1992-96 1996-99
Com
posi
tion
Inde
x
-0.045
-0.025
-0.005
0.015
0.035
0.055
0.075
0.095
Spain- trade composition and inequalities
-8
-6
-4
-2
0
2
4
6
8
1981-85 1985-89 1989-93 1993-95 1995-97
Com
posi
tion
Inde
x
-0.04
-0.03
-0.02
-0.01
0
0.01
0.02
0.03
America - trade composition and inequalities
0
1
2
3
4
5
6
1985-88 1988-91 1991-94 1994-97 1997-00
Com
posi
tion
Inde
x
-0.025
-0.02
-0.015
-0.01
-0.005
0
0.005
0.01
Change in R
egional Disparities
Germany- trade composition and regional inequalities
1
1.5
2
2.5
3
3.5
4
4.5
5
1993-95 1995-97 1997-99 1999-01
Com
posi
tion
Inde
x
-0.002
-0.001
0
0.001
0.002
0.003
0.004
0.005 Change in R
egional Disparities
Figure 6. The link between changes in the trade composition index and the evolution of regional disparities.
1214 WORLD DEVELOPMENT
the country to trade in the mid-1980s, the evo-lution of regional disparities follows a similarpattern to that of the index. Germany displays
the weakest association between changes in thetrade composition index and the evolution of re-gional disparities, with the index seemingly fol-

HOW DOES TRADE AFFECT REGIONAL DISPARITIES? 1215
lowing trends in disparities, which runs counterto the causality that seems to emerge from othercountries. Overall, it could be said that thegraphs in Figure 6 are highly suggestive of oursecond hypothesis. Increases in trade, combinedwith a progressive shift from trade in agricul-ture, fisheries, and raw materials to trade inmanufacturing seem to precede a rise in regionaldisparities. Preliminary statistical analysesusing ARIMA time series analyses seem to con-firm this evidence for our case studies, withchanges in the trade index having an impacton the evolution of regional disparities in Italyafter one year, in India after two, in Spain afterone year, but only after 1985, in Brazil during1985–98, in Mexico from 1985, and in the Uni-ted States from 1990 onward after one year.Germany is, once again, the only exception, asno statistical association is evidenced.
A reasonable objection to this sort of analy-sis is that of omitted variable bias, that is,both changes in the composition of tradeand regional disparities may be driven byother factors, such as changes in GDP, espe-cially given the seemingly cyclical nature ofsome of the fluctuations. However, havingrun comparisons of both the trade composi-tion index to GDP (see Appendix 1) and re-gional disparities to GDP (Appendix 2) foreach country, such relation seems much lessevident than that between changes in the com-position of trade and regional disparities.Only in the Mexican case was there a possibil-ity that changes in GDP were driving bothchanges in the sectoral composition of tradeand the evolution of regional disparities. Inthe cases of Brazil, Germany, India, Italy,Spain, and the United States, there was noconsistent relationship between GDP andeither of the variables, and in China, thechanges in the index and regional disparitiesappeared correlated but changes in the indexcame before the GDP changes.
Another potential critique is that not onlychanges in the composition of trade may havean influence on regional disparities, but alsothat the evolution of regional disparities mayhave an impact on changes in trade composi-tion. This refers to the lagging of the two vari-able series in Figure 6. In some countries, suchas Italy and Mexico, there appears to be a closeassociation without a significant lag, while inother countries, such as Spain and India, thereis a clear delay in the reaction of inequalities totrade composition. Aside from the case of Ger-many, which does not support our hypothesis
that inequalities follow trade composition(and also is charted over the shortest timeperiod), these two situations represent twoseparate relations between the two variablescharted. How can we account for this?
A simple answer would concern the groupingof the various years in the analysis. For the pur-poses of consistency, we have tried to use a uni-form system of averaging across years, as thedata allowed. So, for example, Brazil, Italy,Mexico, and India all begin in 1980 and usefour year increments. But there is nothing tosuggest that the temporal relation betweeninequality and trade composition is synchro-nous across these countries; so in some in-stances we may have separated the action andreaction of the two variables, while in othercases we may have united the two trends. Hav-ing tried various ways of grouping the databetween years, it is clear that some degree ofaveraging is necessary in order to smooth thetrends in both variables and abstract fromshort-run fluctuations. It is unfortunate, how-ever, that in order to do so, some of the lags be-tween trade composition and inequalities mayhave been obscured.
Nevertheless, at a theoretical level, the ques-tion of which factors determine the length ofthe lag between trade composition and inequal-ity is an important one. The degree to which theexport sector is connected to the wider econ-omy by ties such as investment sensitivity,inflationary pressure, government actions andreactions, and information transmission mayhold some clues. Similarly, the structural char-acteristics of economies experiencing changes inexport composition, such as the ease of hiringand firing, the strength of trade union move-ments, and the ease of finding new employmentmay also play a role. Moreover, a further deter-minant may be to do with the ease of interna-tional labor movement between countries.Although our analysis has treated countries inisolation (which is intended to reflect the factthat labor is by far the least mobile factor ofproduction), Jank et al. (2003) cite the fact thatfarmers are becoming increasingly sensitive tointernational differences in wages both in thedeveloped and the developing words, andmigrating in response. If this is the case, thennot only can we expect to see a shorter lag be-tween exogenous changes and inequality, butalso the magnitude of changes in inequalitymay themselves be curtailed in the long runas workers escape the worst of their conse-quences.

1216 WORLD DEVELOPMENT
As a result of this analysis, from Figure 6 arelationship between trade composition and re-gional disparities can be inferred. In six out ofeight of our case countries, there appeared tobe a positive relationship. In Mexico, the sev-enth, there was not only an evidence of correla-tion but also of the fact that the evolution oftrade and regional disparities may also be asso-ciated to changes in GDP. The only countrythat yielded no support for our second hypo-thesis was Germany. It can therefore beconcluded that the ratio of agricultural to man-ufacturing exports is to some extent negativelyrelated to regional disparities. The remainderof this section goes on to discuss what theimplications of these results may be for devel-oped and developing countries.
(c) Implications of the results
What are the implications of the finding thatthe general rise in trade, coupled with a fall inthe proportion of agricultural goods in thecomposition of that trade, is connected to a risein regional disparities in developing and devel-oped countries? Our findings suggest that therecent expansion of manufacturing trade, inmany cases at the expense of trade in agricul-ture and other primary sector goods, is likelyto benefit manufacturing workers and areasand that these benefits may not find their wayto the more dispersed agricultural populations.In terms of the Lewis model, therefore, whiledevelopment of the capitalist core may benefiturban areas hosting manufacturing industry,economic growth might well leave behind alarge proportion of the population located insubsistence sectors. As manufacturing areasfrequently coincide with large urban concentra-tions and with relatively well-off territories, theincrease in manufacturing trade relative to agri-cultural trade seems likely to benefit rich re-gions at the expense of less prosperous ones,thus increasing regional disparities (Leichenko& Silva, 2004). While this does not seem to bea surprising result, it does highlight the factthat the consistency with which mobilityassumptions are used should be called intoquestion: the temporal coincidence of the evo-lution of regional disparities and manufactur-ing trade that we have highlighted does littleto support a model that posits intersectorallabor mobility as an assumption.
Of course, as stated, other factors, such as theexistence of nodal infrastructure systems, mayhave contributed to the rise of disparities as
trade increases. Transport costs can be ex-pected to increase outwards from transporthubs, reflecting the declining density and effi-ciency of transport networks in more remotelocations (see Button, 1993; Overman & Win-ters, 2005), and whether the goods transportedare final or intermediate (Alonso-Villar, 2005).Redding and Venables (2000) find that morethan 70% of the variation in cross-countryper capita income depends on factors such asdistance to hubs, accessibility to ports, andopenness. Hence, with the opening to trade,core areas with better transport infrastructureendowments are likely to remain the easiestand cheapest locations from which to servicenational and international markets, as well asthe cheapest destinations for imported inputsfrom trading countries. Similarly, high commu-nication costs may also exacerbate the isolationof the benefits from increased manufacturingtrade in manufacturing areas. From the per-spective of policy implications, then, our find-ings highlight the importance of technologicaldevelopment alongside trade liberalization, iftrade benefits are not to contribute to the riseof disparities. If labor mobility is restricted be-tween sectors, as our findings imply, and therise of regional disparities is regarded as a prob-lem, then strategies that ‘‘level the playingfield’’ between rural and urban locations mustbe encouraged, including re-skilling and re-edu-cating rural populations to allow them to com-pete with manufacturing areas. We echo hereArbache et al.’s (2003) concern to improvetechnology in developing countries, and to raisethe educational level of dispersed communities,if trade liberalization is to have poverty-amelio-rating effects.
These recommendations take on more impor-tance when we note that the evidence of risingintranational disparities associated with growthin manufacturing trade is likely to have graverconsequences for developing than for devel-oped countries. This is not to say that thegrowth of disparities depends upon its level,but simply that at higher levels of inequality,the negative impact of a similar increase in dis-parities, in terms of worsening livelihoods, islikely to be greater. This is most easily concep-tualized in terms of poverty, defined by theWorld Bank as the inability to purchase a bas-ket of goods with more than 2,100 calories andsome basic non-food expenditures (Litchfieldet al., 2003). For a country with a high numberof people already very close to the poverty lineand large rural populations, an increase in re-

HOW DOES TRADE AFFECT REGIONAL DISPARITIES? 1217
gional disparities is likely to raise the number ofthose in poverty by far more than in a countrywhere fewer people are already close to thissituation. The developed countries included inour sample are characterized by very low (theUnited States and the western Lander of Ger-many) or moderate (Italy and Spain) territorialdisparities. Most of their international trade isalso in manufacturing goods, with a minimalvolume of trade in primary products and goodsin relative terms. Hence, any increase in trade isunlikely to accompany reductions in their mea-ger agricultural to manufacturing trade ratios,and therefore any resulting increases in regionaldisparities are expected to be small. In devel-oped countries, industry—as a consequence ofits greater maturity—is also less concentratedin and around primal cities and core areasand more evenly spread across the country thanin the developing world. 9 This is the case be-cause infrastructure development has been bol-stered by sustained industrial activity and theattendant savings, capital, and investment thatthis facilitates. With infrastructure develop-ment, the cost of locating outside major citiesfalls, while the costs of agglomeration continueto encourage the dispersal of economic activity.The range of areas that may benefit from anexpansion of trade in manufacturing goods isthus larger than in most developing countries.Finally, given the relatively small dimensionof regional disparities in developed countries,a moderate increase of territorial disparities asa result of increases in trade is unlikely to causeeconomic and/or social unrest and to jeopar-dize the existing political systems.
The stakes for most developing countries aremuch higher. First, regional disparities withinthese countries are far greater, and are alreadyat the root of political (as in the case of theZapatista movement in Mexico) and social (asin the case of the North East of Brazil) discon-tent. The margin for an increase in intrana-tional disparities is therefore much tighter.Second, the relative volume of agriculturaland other primary sector trade in countriessuch as Brazil or India is still significant, andthe margin for a decline in this sort of trade isstill important. Finally, there is a greater con-centration of manufacturing activity in andaround primal cities in most developing thanin developed countries. Given the dimensionof trade-distorting farm support measures, tar-iffs on farm goods and agricultural-export tar-iffs and the lack of agreement in WTO roundsover reform on agricultural subsidies, the scope
for worldwide growth in agricultural trade islimited. This means that at least in the short-term countries such as Brazil or India, with agreater reliance on trade in agricultural or min-eral goods, have a greater potential to see regio-nal disparities grow, with grave economic,social, and political consequences.
6. CONCLUSION
This paper set out to explore the link betweentrade and regional disparities. On the empiricalside, there is some evidence of a relationshipbetween the two when trade composition is ac-counted for. Hence, in six, and possibly seven,of the eight case countries that formed the sub-ject of our investigations, there was evidence thatchanges in trade composition preceded changesin regional disparities, given that trade itselfwas significant. Specifically, as agricultural ex-ports became less important than manufacturingexports, regional disparities seemed to increase,whereas when agricultural exports became moreimportant, disparities tended to decline.
This evidence fits into the global picture oftrade, trade composition, and regional dispari-ties well. The volume of trade as a proportionof production has increased dramatically sincethe 1970s, implying that trade compositionhas been taking on more significance in thedetermination of regional disparities. Concur-rently, trade composition itself has evolved,seeing agricultural exports fall in importancerelative to manufacturing exports. These trendshave contributed to a rise of regional disparitieswithin countries—a fact that is congruent withthe findings of this paper. It is our contentionthat, while numerous factors determine boththe degree to which countries trade and thelevel of spatial income disparities within them,the changes in trade volume and compositionwitnessed over the past 30 years have contrib-uted in some part to the rise in regional dispar-ities witnessed over the same period.
Developing countries face greater challengesas a result of this link between changes in thecomposition of trade and the rise of regionaldisparities. Because of the greater dimensionof their regional disparities, their larger relianceon primary sector trade, and the protection ofagricultural markets across the world, any in-crease in manufacturing trade will ultimatelyexacerbate the problem of internal disparitiesand put economic, social and political systemsunder further strain.

1218 WORLD DEVELOPMENT
NOTES
1. Here and throughout the paper, ‘‘regional dispari-ties’’ refers to the difference between average regionalGDP per capita within a country, measured by theevolution of the standard deviation of regional GDP percapita within a given country.
2. The assumption that manufacturing industry payshigher wages than agricultural industry is necessary here,an assertion that is clearly substantiated in developingcountry contexts where the wage differential engendershuge migration flows to urban areas, where mostindustry is located. Unskilled fulltime nominal urbanwages are about 41% higher than farm wages in theThird World, although this ratio is reduced when thecost of living is accounted for (Hatton & Williamson,1991; Squire, 1981). Moreover, evidence from the UnitedStates also confirms the assumption. In 2000 in Wash-ington State, average agricultural earnings stood at$20,229 while earnings for all private sector employeeswere $37,070—over 80% higher (Wallace, 2002). Sea-sonal variability in working hours was cited as the majorcause of this discrepancy.
3. Although they also acknowledge that ‘‘if agglomer-ation is principally relevant at the regional or metropol-itan scale, then it could well be possible that nationscould retain roughly similar shares of world trade in agiven industry, while simultaneously experiencing sig-nificant locational concentration within the nationalterritory’’ (Storper et al., 2002, p. 74).
4. Assuming again that manufacturing yields higherreturns to factor owners than agriculture does.
5. To what extent the two are separable is a mootpoint. If it is the case that countries with high resourceendowments engage in both more trade and moreagricultural trade relative to manufacturing trade, forexample, then the arguments here and the ones thatfollow are complicated. However, anecdotal evidence
suggests otherwise. For example, although Singaporeand Japan trade extensively in manufacturing andtertiary services, so too do Canada and Australia,countries with far higher resource endowments.
6. We use throughout the paper the United Nations’Standard Industrial Trade Classifications (SITCs),which work on a similar, numeric-nested, principle tostandard industrial classifications, in order to defineagricultural and manufacturing exports. Primary sector(or agricultural) exports are defined as the sum of SITCs1—food and live animals; 2—beverages and tobacco;and 3—mineral fuels, lubricants and related materials.Secondary sector (or manufacturing) exports are madeup of SITCs 6—manufactured goods classified chiefly bymaterial; 7—machinery and transport equipment; and8—miscellaneous manufactured articles. The missingSITCs that do not enter into the calculations coverproducts that are difficult to fit into the conceptualmodel of primary and secondary industries, as well asthose that could only be classed under tertiary orquaternary activities. See http://unstats.un.org/unsd/comtrade.
7. The index does not account for trade in services.
8. Data from the early 1980s for China were unavail-able, and in the German case, the period after reunifi-cation and its immediate aftermath forms the subject ofanalysis.
9. Traditional manufacturing industries in developedcountries are, in many cases, more evenly spread than indeveloping countries. Among the reasons that wouldexplain this phenomenon, we find the better overallendowment of infrastructure and of human resources inthe developed world, as well as the greater amount oftime they have had to flee the negative externalitiesassociated with primal cities, such as congestion or highland costs.
REFERENCES
Alonso-Villar, O. (2005). The effects of transport costsrevisited. Journal of Economic Geography, 5(5),589–604.
Arbache, J. S., Dickerson, A., & Green, F. (2003). Tradeliberalisation and wages in developing countries.Economic Journal, 114, F73–F96.
Barry, F., & Bradley, J. (1997). FDI and trade: The Irishhost-country experience. Economic Journal, 107(445),1798–1811.
Bliss, C. (1988). Trade and development. In H. Chenery,& T. Srinivasan (Eds.), Handbook of developmenteconomics, II. Amsterdam: North-Holland.
Button, K. J. (1993). Transport economics (2nd ed.).Aldershot: Edward Elgar.
Combes, P. P., & Lafourcade, M. (2002). Transportcosts, geography, and regional inequalities. IEDDiscussion Paper 122.
HOW DOES TRADE AFFECT REGIONAL DISPARITIES? 1219
Edwards, W. (1993). Openness, trade liberalization, andgrowth in developing countries. Journal of EconomicLiterature, 31(3), 1358–1393.
Esteban, J. M. (1994). La desigualdad interregional enEuropa y en Espana: descripcion y analisis. In J. M.Esteban, & X. Vives (Eds.), Crecimiento y conver-gencia regional en Espana y Europa. Barcelona:Instituto de Analisis Economico.
Feder, G. (1983). On exports and economic growth.Journal of Development Economics, 12(1–2), 59–73.
Fischer, M. J. (2003). The relative importance of incomeand race in determining residential outcomes in U.S.urban areas, 1970–2000. Urban Affairs Review, 38(5),669–696.
Gibson, P., Wainio, D., Whitley, D., & Bohman, M.(2001). Profiles of tariffs in global agriculturalmarkets. Economic Research Service, AgriculturalEconomic Report, No. 796.
Gorg, H., & Strobl, E. (2003). Footloose multinationals?The University of Nottingham Research PaperSeries: Globalisation and Labour Markets Pro-gramme. Research Paper No. 2001/07, LeverhulmeCentre.
Hanson, G. (1992). Industry agglomeration and trade inMexico. MIT Ph.D. thesis.
Hanson, G. (1996). Economic integration, intraindustrytrade and frontier regions. European EconomicReview, 40, 941–950.
Hanson, G. (1998). North American economic integra-tion and industry location. NBER Working PaperSeries No. 6587.
Hatton, D. J., & Williamson, J. G. (1991). Integratedand segmented labor markets: Thinking in twosectors. Journal of Economic History, 51, 413–425.
Henderson, J., & Wang, H. (2005). Aspects of the rural–urban transformation of countries. Journal of Eco-nomic Geography, 5(1), 23–42.
Hertel, T., Ivanic, M., Preckel, P., Cranfield, J., &Martin, W. (2003). Short- versus long-run implica-tions of trade liberalization for poverty in threedeveloping countries. American Journal of Agricul-tural Economics, 5, 1299–1306.
Jank, M., Fuchsloch, I., & Kutas, G. (2003). Agricul-tural liberalisation in multilateral and regional tradenegotiations. Inter American Development Bank,Special Initiative of Trade and integration, WorkingPaper SITI 03.
Konya, I. (2001). Endogenous mobility, human capitaland trade. Boston College Department of Econom-ics, Boston College Working Papers in Economics,no. 528.
Krugman, P. (1991). Increasing returns and economicgeography. Journal of Political Economy, 99(3),483–499.
Krugman, P., & Livas Elizondo, R. (1996). Trade policyand the third world metropolis. Journal of Develop-ment Economics, 49, 137–150.
Lane, C. (1998). European companies between global-ization and localization: A comparison of interna-tionalization strategies of British and GermanMNCs. Economy and Society, 27(4), 462–505.
Leichenko, R., & Silva, J. (2004). International trade,employment, and earnings: Evidence from ruralcounties. Regional Studies, 38(4), 353–372.
Lewis, W. (1954). Economic development with unlimitedsupplies of labour. The Manchester School, 57(3),196–210.
Litchfield, J., MuCulloch, N., & Winters, A. (2003).Agricultural trade liberalization and poverty dynam-ics in three developing countries. American Journal ofAgricultural Economics, 5, 1285–1291.
Mudambi, R. (1998). The role of duration in multi-national investment strategies. Journal of Interna-tional Business Studies, 29(2), 239–261.
Overman, H., & Winters, A. (2005). Trade shocks andindustrial location: The impact of EEC accessionon the UK. Environment and Planning A, 37(10),1751–1768.
Pack, H. (1988). Industrialization and trade. In H.Chenery, & T. Srinivasan (Eds.), Handbook of devel-opment economics, II. Amsterdam: North-Holland.
Paluzie, E. (2001). Trade policy and regional inequali-ties. Papers in Regional Science, 80(1), 67–86.
Puga, D. (2002). European regional policy in light ofrecent location theories. Journal of Economic Geo-graphy, 2, 373–406.
Pugel, T. A., & Lindert, P. H. (2000). Internationaleconomics (11th ed.). Boston: McGraw-Hill.
Redding, S., & Venables, A. (2000). Economic geogra-phy and international inequality. CEPR DiscussionPaper No. 2568.
Rodden, J. (2003). Federalism and bailout in Brazil. InJ. Rodden, G. S. Eskeland, & J. I. Litvack (Eds.),Fiscal decentralization and the challenge of hardbudget constraints. Cambridge, MA: MIT Press.
Rodrıguez-Pose, A., & Gill, N. (2003). The global trendtowards devolution and its implications. Environmentand Planning C: Government and Policy, 21(3),333–351.
Rodrıguez-Pose, A., & Gill, N. (2004a). Is there a globallink between regional disparities and devolution?Environment and Planning A, 36(12), 2097–2117.
Rodrıguez-Pose, A., & Gill, N. (2004b). Reassessingrelations between the centre and the states: Thechallenge for the Brazilian administration. RegionalStudies, 38(7), 833–844.
Rodrıguez-Pose, A., & Sanchez-Reaza, J. (2005). Eco-nomic polarization through trade: Trade liberaliza-tion and regional growth in Mexico. In R. Kanbur, &A. J. Venables (Eds.), Spatial inequality and develop-ment (pp. 237–259). Oxford: Oxford University Press.
Rodrik, D. (2003). Free trade optimism. Foreign Affairs,82(3), 135–140.
Sachs, J. D., & Warner, A. (1995). Economic reform andthe process of global integration. Brookings Paperson Economic Activity, 1, 1–118.
Sanchez-Reaza, J., & Rodrıguez-Pose, A. (2002). Theimpact of trade liberalization on regional disparitiesin Mexico. Growth and Change, 33(1), 72–90.
Silva, J., & Leichenko, R. (2004). Regional incomeinequality and international trade. Economic Geog-raphy, 80, 261–286.
Squire, L. (1981). Employment policy in developingcountries. Oxford: Oxford University Press.

1220 WORLD DEVELOPMENT
Storper, M., Chen, Y. C., & de Paolis, F. (2002). Tradeand the location of industries in the OECD and theEuropean Union. Journal of Economic Geography, 2,73–107.
Wallace, D. (2002). Agricultural workforce in Washing-ton State 2001. Economic and Policy Analysis Unit,
Washington State Employment Security Depart-ment.
Zhang, X., & Zhang, K. (2003). How does globalisationaffect regional inequality within a developing coun-try? Evidence from China. Journal of DevelopmentStudies, 39, 47–67.

APPENDIX 1
The relationship between changes in trade composition (solid) andchanges in GDP (dashed).
America - GDP and Composition Index
0200400600800
10001200
1985
-88
1988
-91
1991
-94
1994
-97
1997
-00
Cha
nge
in G
DP
0123456 C
omposition Index
Brazil - GDP and Composition Index
-50
0
50
100
150
1980
-84
1984
-88
1988
-92
1992
-96
1996
-98
Cha
nge
in G
DP
-202468 C
omposition Index
China - GDP and Composition Index
0
50
100
150
1987
-89
1989
-91
1991
-93
1993
-95
1995
-97
1997
-98
Cha
nge
in G
DP
012345
Com
position IndexGermany - GDP and Composition
Index
0
50
100
15019
93-
95
1995
-97
1997
-99
1999
-01
Cha
nge
in G
DP
0
2
4
6
Com
position Index
India - GDP and Composition Index
020406080
100
1980
-84
1984
-88
1988
-91
1991
-95
1995
-99
Cha
nge
in G
DP
05101520
Com
position Index
Italy - GDP and Composition Index
0
50
100
150
1980
-84
1984
-88
1988
-92
1992
-96
1996
-00
Cha
nge
in G
DP
012345
Com
position Index
Mexico - GDP and Composition Index
0
20
40
60
1980
-84
1984
-88
1988
-92
1992
-96
1996
-99
Cha
nge
in G
DP
0
10
20
30
Com
position Index
Spain - GDP and Composition Index
020406080
100
1981
-85
1985
-89
1989
-93
1993
-95
1995
-97
Cha
nge
in G
DP
-10-50510
Com
position Index
GDP figures all in million 1995 US $ (constant). Source: Own elaboration with World Bank GDPand Trade Composition Index (various sources, see text) data.
HOW DOES TRADE AFFECT REGIONAL DISPARITIES? 1221

APPENDIX 2
The relationship between the evolution of regional disparities (solid) and changes in GDP (dashed).
America - disparities and GDP
-0.025-0.02
-0.015-0.01
-0.0050
0.0050.01
1985
-88
1988
-91
1991
-94
1994
-97
1997
-00C
hang
e in
dis
parit
ies
020040060080010001200 C
hange In GD
P
Brazil - disparities and GDP
-0.08-0.06-0.04-0.02
00.020.040.06
1980
-84
1984
-88
1988
-92
1992
-96
1996
-98
Cha
nge
in d
ispa
ritie
s
-50
0
50
100
150
Change in G
DP
China - disparities and GDP
-0.03-0.02-0.01
00.010.020.030.040.05
1987
-89
1989
-91
1991
-93
1993
-95
1995
-97
1997
-98C
hang
e in
dis
parit
ies
0
50
100
150 Change in G
DP
Germany - disparities and GDP
-0.005
0
0.005
0.01
0.015
1993
-95
1995
-97
1997
-99
1999
-01
Cha
nge
in d
ispa
ritie
s
020406080100120
Change in G
DP
India - disparities and GDP
00.010.020.030.040.050.060.07
1980
-84
1984
-88
1988
-91
1991
-95
1995
-99
Cha
nge
in d
ispa
ritie
s
020406080100
Change in G
DP
Italy - disparities and GDP
-0.02-0.01
00.010.020.03
1980
-84
1984
-88
1988
-92
1992
-96
1996
-00
Cha
nge
in d
ispa
ritie
s
020406080100120
Change in G
DP
Mexico - disparities and GDP
-0.06-0.04-0.02
00.020.040.060.08
0.1
1980
-84
1984
-88
1988
-92
1992
-96
1996
-99
Cha
nge
in d
ispa
ritie
s
0102030405060
Change in G
DP
Spain - disparities and GDP
-0.02-0.01
00.010.020.03
1981
-85
1985
-89
1989
-93
1993
-95
1995
-97
Cha
nge
in d
ispa
ritie
s
020406080100
Change in G
DP
GDP figures all in million 1995 US $ (constant). Source: Own elaboration with World Bank GDPand Trade Composition Index (various sources, see text) data.
1222 WORLD DEVELOPMENT