how does economic freedom affect international trade...
TRANSCRIPT

1
How Does Economic Freedom Affect International Trade in Services?*
by Fukunari Kimura
Keio University, Japan
Hyun-Hoon Lee** Kangwon National University, Korea
April 2008
Abstract
Using the Economic Freedom of the World (EFW) Index compiled by the Fraser Institute and, for robustness check, the Heritage Foundation Economic Freedom Index, this paper investigates the impact of economic freedom on bilateral services trade at the sectoral level. To accomplish this purpose, using the standard gravity model, the paper estimates the determinants of bilateral services trade for nine different sub-sectors between the United States and 28 different trading partners for the period 1992-2003. Japan’s services trade is also considered as a robustness check. The result shows that both the United States and Japan trade more of most business-related services with countries that enjoy freeer economic activities. The result is robust with respect to many different specifications of the gravity model. JEL Classification Numbers: F10, F20, L51, F80 Keywords: trade in services, gravity model, economic freedom
* We thank participants at the International Economics Forum of the Bank of Korea and Asia-Pacific Economic Association Annual Conference, and Daniel Mirza, SaangJoon Baak and Donghun Kim for their helpful comments. We also thank Euijung Park and Kazunobu Hayakawa for their very able research assistance. This work was supported by the Korea Research Foundation Grant funded by the Korean Government (MOEHRD, Basic Research Promotion Fund) (KRF-2006-B00347). ** Correspondence: Hyun-Hoon Lee, Division of Economics and International Trade, Kangwon National University, Chuncheon 200-701, Korea. Email: [email protected]
2
1. Introduction Economic freedom means the degree to which a market economy is in place and thus closely relates to government regulations in the whole economy. Economic freedom for a number of countries has been quantified independently by two different organizations – Economic Freedom of the World Index by the Fraser Institute, and Index of Economic Freedom by the Heritage Foundation in cooperation with the Wall Street Journal. There has been a considerable amount of research using these data to investigate the link between economic freedom and economic growth. For example, a positive relationship between economic freedom and economic growth was found by de Vanssay and Spindler (1994), Easton and Walker (1997), Dawson (1998, 2003), de Haan and Sierman (1998), Ayal and Karras (1998), Nelson and Singh (1998), Wu and Davis (1999), Carlsson and Lundstrom (2002), and Cole (2003). On the other hand, Berggren (1999) investigates the relationship between economic freedom and income distribution.1 Scholarly research linking economic freedom and international trade is very rare. Exceptionally, Rose (2000), in investigating the effects of exchange-rate volatility and currency unions on international trade, finds a statistically significant relationship between trade among nations and economic freedom. Craig and Sonora (2005) also find that the economic freedom of a country has a positive effect on the exports from the U.S. to that country. Anderson and Marcouiller (2002) use a different set of data compiled by the World Economic Forum and find that trade expands dramatically when it is supported by strong institutions – specifically, by a legal system capable of enforcing commercial contracts and by transparent and impartial formulation and implementation of government economic policy. While these studies consider only goods trade, Kimura and Lee (2006) find that both goods trade and services trade are positively affected by economic freedom, but the effects are much stronger for services trade between 10 OECD member countries and other OECD and non-OECD member countries. The result suggests that services trade,
1 See Berggren, N. (2003) for a review on researches related with economic freedom.

3
in comparison with goods trade, might be hampered more severely by government regulations.
Kimura and Lee (2006), however, cover only aggregate services trade, whereas the idiosyncratic nature of each traded service should have different policy implications. This paper attempts to fill this gap by assessing the effects of economic freedom on bilateral services trade at the sectoral level. To accomplish this purpose, using the standard gravity model, we estimate the determinants of bilateral services trade (exports and imports) for nine different sub-sectors, between the United States and 28 different trading partners for the period 1992-2003. The above mentioned two indices of economic freedom are utilized as an explanatory variable in the regression.
The results show that the U.S. trades more of most business-related services with countries that enjoy a greater degree of economic freedom. The result is robust to both exports and imports, subject to many different specifications of the gravity model. For the purpose of comparison, we also run regressions on bilateral services trade between Japan and 24 trading partners for the period 1996-2003 and find similar results. This paper also finds that among different components of economic freedom index, Size of government: expenditures, taxes and enterprises and Regulation of credit, labor, and business have the most significant association with services trade. Section 2 presents an empirical model of a standard gravity type equation and discusses the key variables. Empirical results are presented in Section 3, and the results for the robustness checks are in Section 4. Section 5 looks at the effects of different components of economic freedom on services trade. Finally, Section 6 summarizes the main results and discusses their implications. 2. Empirical Methodology Estimating Equation To examine the effects of economic freedom on services trade, one needs a model to take account of other trade determinants. We use a version of the standard gravity model of bilateral trade. Since Tinbergen (1962) and Pöyhönen (1963) it has been well known that the simple gravity equation, in which the volume of trade between two

4
countries is proportional to the product of their masses (GDPs) and inversely related to the distance between them, is empirically highly successful. Recently, it has again become widely used in the literature, as many authors have shown that the gravity equation can be derived from different models, including Ricardian, Hecksher-Ohlin, and the monopolistic competition models (See Helpman and Krugman, 1985; Deardorff, 1998; Eaton and Kortum, 2002; and Anderson and van Wincoop, 2003).
The gravity model has been extensively used to examine the effects of policies (tariffs and non-tariffs), various institutions (regional trade blocks, currency unions, and the WTO) and other possible variables (such as language, immigration, etc) on international trade flows between countries, but most empirical research using the gravity model has focused mostly on goods trade. However, the gravity model can be applicable to bilateral services trade as well. Larger countries are expected to engage in more trade not only in goods trade but also in services trade. Distance should also matter for services trade because the provision of services that require a physical presence or are easier to manage at closer proximity would be disadvantaged by greater distance. Greater distance may also serve to increase the information costs involving services trade. Services trade that is contingent on goods trade is also expected to depend inversely on distance.2 Recently, using the recent OECD service trade data, Grünfeld and Moxnes (2003), Mirza and Nicoletti (2004), Ceglowski (2006) and Kimura and Lee (2006) have estimated the determinants of bilateral services trade in the gravity framework. In particular, Kimura and Lee (2006) show that services trade is better predicted by gravity equations than goods trade. It is noted, however, that due to the limitation of the OECD dataset, which covers only aggregate values of bilateral trade in services, the studies quoted above do not look into services trade at the sectoral level. Exceptionally, Lejour and Verheijden (2004) examine bilateral services trade at the sectoral level between the provinces of Canada and between the member states of the European Union.
As noted in Introduction, Kimura and Lee (2006) find that both goods trade and
2 But it should be stressed that some services like communication are expected to involve lower transport costs, and that the value of transportation services may rise with distance. Thus, the present research at sectoral level is required to examine the idiosyncratic nature of each traded service.

5
services trade are positively affected by economic freedom, but the effects are much stronger for services trades. We take the specification of Kimura and Lee (2006) as a benchmark equation, even though the service sectors are quite different from each other. That is, we use a specification of the gravity equation that is commonly applied to different types of services trade so as to examine how the impact of economic freedom on trade differs among different service sectors.
Specifically, we estimate the following version of the standard gravity equation: TRADEjt = β1GDPjt + β2PCGDPjt + β3DISTANCEj + β4ADJACENCYj +β5AREAj
+ β6FTAj + β7ENGLISHj + β8EFIjt + α + δt + εjt where j denotes trading partner of the U.S., t denotes a year, and the variables are defined as: • TRADEjt is log of bilateral trade flows (exports or imports) of services between the U.S. and country j in time t, • GDPjt is log of GDP of country j in time t, • PCGDPjt is log of PCGDP of country j in time t,3 •DISTANCEj is log of weighted distance between the principal cities in the U.S. and those in country j,4 • ADJACENCYj is a binary dummy that is one if country j shares a land border with the U.S., and zero otherwise,5 • AREAj is log of the land area of country j (in square kilometers), • FTAj is a binary dummy that is one if country j belongs to a common regional trade arrangement with the U.S., and zero otherwise,6 • ENGLISHj is a binary dummy that is one if country j uses English as its official language, and zero otherwise, • EFIjt is the rating of economic freedom for country j in time t (We will discuss more 3 Data on GDPs and PCGDPs are drawn from the World Bank’s World Bank Development Indicators (WDI) database (http://www.worldbank.org/data). TRADE (service exports and service imports), GDP and PGCDP are deflated by US GDP deflator (year 2000=100) taken from the same World Bank’s database. 4 DISTANCE is drawn from CEPII website (http://www.cepii.fr/anglaisgraph/bdd/distances.htm). 5 Therefore, this variable takes the value of one for Canada and Mexico. 6 This variable takes the value of one for Israel (from 1992), Canada (from 1992), and Mexico (from
1994).

6
on this variable in the following section.), • α is a constant, • δt is a time dummy, • εjt represents a random disturbance term. This is a standard gravity equation commonly used for goods trade. We adopt the same analytical gravity framework for the individual services trade so as to reveal whether the gravity model is equally applicable to different service sectors. As a benchmark case, we include time dummies on the pooled data set to take account of factors such as business cycles, exchange rates, and so forth. We do not include country dummies in the benchmark case because many of our explanatory variables are time-invariant. But, as a sensitivity check, we will also take account of fixed country-specific effects. This kind of approach has been taken by other researches such as Rose (2004; 2005a; 2005b). More on the Dependent Variable As noted above, we use, as the dependent variable, the bilateral cross-border service exports and imports of the U.S., drawn from <Bureau of Economic Analysis (BEA), US Department of Commerce, “US International Services: Cross-Border Trade 1986 – 2004”>.7 “Cross-border trade” covers transactions between companies and individuals resident in the US and those resident abroad, which is largely consistent with the balance-of-payments statistics based on the residency concept. In the correspondence with the concept of four modes of services transactions used in the General Agreement on Trade in Services (GATS), “cross-border trade” in the BEA data roughly corresponds to mode 1 (cross-border), mode 2 (consumption abroad), a small part of mode 3 (commercial presence), and part of mode 4 (movement of natural persons). In the BEA cross-border services trade data, the private service exports and imports in different sectors are broken down for 33 countries since 1992. The most recent data are for 2003 at the time of writing. Among the 33 countries, Belgium-Luxembourg, Argentina, Bermuda, Saudi Arabia, and Taiwan are dropped because their data for some explanatory variables are not available. Therefore, trade partners of the U.S. included in the study are the following 28 countries:
7 Available online at http://www.bea.gov/bea/di/1001serv/intlserv.htm. As for conceptual setting and measurement issues for services trade statistics in the US, see Whichard and Borga (2002), Nephew, Koncz, Borga, and Mann (2005), and other articles and documents in http://www.bea.gov.

7
Australia, Brazil, Canada, Chile, China, France, Germany, Hong Kong, India,
Indonesia, Israel, Italy, Japan, Korea, Malaysia, Mexico, Netherlands, New Zealand, Norway, Philippines, Singapore, South Africa, Spain, Sweden, Switzerland, Thailand, United Kingdom, Venezuela.
In 2003, the U.S. exported US$ 291.5 billion of total private services to the world market, while it imported US$ 224.6 billion from the world market. The 28 countries took 74.5% (US$ 217.2 billion) of total private service exports of the U.S and 71.0% (US$ 159.4 billion) of total private service imports. Therefore, our sample covers a substantial portion of U.S. private services trade.8 We consider the following nine services sub-sectors: (1) Travel, (2) Freight, (3) Port services, (4) Financial services, (5) Insurance, (6) Business, professional and technical services, (7) Royalties and license fees, (8) Education, (9) Telecommunications.
It is noted that “Financial Services”, 9 “Insurance”, 10 “Business, professional, and technical services”,11 “Education”, and “Telecommunications” are unaffiliated services under “Other Private Services”. Affiliated services under Other Private Services are not disaggregated. On the other hand, “Royalties and license fees” include transactions between both affiliated and unaffiliated ones.12
8 One may be concerned about a possible data selection bias arising from the observations that are excluded in this study. Their data are not reported in the data source mentioned above since their values are less than US$500,000. We believe that excluding those observations is in a sense preferable because small-valued observations are subject to more sampling errors, as few (if not a single) transactions may dominate the variations in a given country. 9 “Financial services” are sub-categorized into (i) securities transactions services including brokerage, underwriting, and private placement services, (ii) management and advisory services including financial management, financial advisory, and custody services, (iii) credit card and other credit-related services, and (iv) other services. 10 “Insurance” services include premium, imputed premium, and auxiliary services in primary insurance and reinsurance. 11 “Business, professional, and technical services” include Advertising, Computer and data processing services, Database and other information services, Research, development and testing services, Management, consulting and public relations services, Legal services, Construction, engineering, architectural, and mining services, Industrial engineering, Installation, maintenance, and repair of equipment, and Other business, professional and technical services. 12 Among the total receipts (US$48.2 billion) of Royalties and licenses fees in 2003, 74.5% (US$ 35.9 billion) was taken by affiliated firms; among the total payments (US$20.5 billion) of Royalties and licensees fees, 80.0% (US$16.4 billion) was taken by affiliated firms.
8
These nine services sub-sectors add up to 89% and 90% of total private service exports and imports, respectively, of the U.S. in 2003. Among the nine sub-sectors, “Business, professional and technical services” took the largest share in exports (US$ 66.6 billion), while “Travel” took the largest share in imports (US$ 57.4 billion). See Figure 1. More on Economic Freedom Index Since 1996, the Fraser Institute of Canada has published an Economic Freedom of the World (EFW) Index, which measures the consistency of a nation's policies and institutions with economic freedom.13 This is a composite index which measures the degree of economic freedom present in five major areas: (1) Size of Government: Expenditures, Taxes and Enterprises; (2) Legal Structure and Security of Property Rights; (3) Access to Sound Money; (4) Freedom to Trade Internationally; and (5) Regulation of Credit, Labor, and Business.14 Within the five major categories, 21 components are incorporated into the index and many of those components are made up of several sub-components. Each component and sub-component is placed on a scale from 0 to 10 that reflects the distribution of the underlying data. The component ratings within each area are averaged to derive ratings for each of the five areas. In turn, the summary rating is the simple average of the five area ratings. See Economic Freedom of the World: 2005 Report, Chapter 1. See also Appendix Table 1 in this paper.
Among the 28 countries included in this study, the country with the highest ratings in 2003 is Hong Kong with 8.69, followed by Singapore and New Zealand with 8.48 and 8.23, respectively. On the other hand, Venezuela, Brazil, and China retain the lowest ratings, with 4.33, 5.93, and 5.97, respectively.15 The U.S. has the rating of 8.19. See 13 The EFW index is available online at http://www.freetheworld.com/release.html. 14 Thus the EFW index measures the overall degree of friendliness for doing business. For example, a 1996 World Bank survey of 3685 firms in 69 countries (Brunetti, Kisunko and Weder, 1997) shows the ranking in order of importance of the “obstacles for doing business” as follows: (1) tax regulations or high taxes (2) corruption (3) financing (4) inadequate infra structure (5) crime and theft (6) inflation (7) uncertainty of cost of regulations (8) policy instability (9) labor regulations (10) regulations on foreign trade (11) safety or environmental regulations (12) start-up regulations (13) foreign currency regulations (14) price controls and (15) terrorism. Among the 15 obstacles, not related with the EFW index are the only three obstacles such as (5) crime and theft (11) safety or environmental regulations and (15) terrorism. 15 The simple average of the ratings for 28 countries in 2003 is 7.1 while that for the entire 127 countries is 6.4. Hence, the countries in our sample are those that enjoy greater economic freedom on average than other countries.

9
Appendix Table 2.
We use the chain-linked summary rating of the EFW index reported in Economic Freedom of the World: 2005 Annual Report.16 It should be noted that our study covers the period 1992-2003, but the EFW index has been updated yearly since 2000 and is available only for every five years before 2000. Therefore, we use the simple change rate for each country between 1990 and 1995, and 1995 and 2000, to estimate the ratings of each country for the missing years. The linear interpolation may pose a problem because most of the variation in the EFW indicator would be at constant rates by construction and thus the co-variation with services trade would become smaller. On the other hand, however, this is not an issue when running a time fixed-effects regression, because the variation that is captured by the coefficient should be cross-sectional. This is another reason why we are using the time fixed-effects specification as a benchmark case, and are concerned more with cross-country variation in the effect of economic freedom on services trade.17 3. Estimation Results Table 1 shows the results for exports and imports of total services. The first column shows our benchmark results which are estimated by using ordinary least squares, with year-specific fixed effects over the full sample.18 The estimates for total service exports of the U.S. show that the traditional gravity model works very well for services trade. The model explains a high proportion (86.9%) of the data variation. Specifically, greater economic mass (GDP) increases services trade, while geographical distance reduces it. The results are highly significant statistically. The estimates also show that the dummies for common land border and language have positive and significant
16 One may argue that we may also need to use some kind of index that directly measures “tariff equivalent” protection in each service sector. As a matter of fact, the Australian Productivity Commission, in collaboration with the Australian National University, produced the Trade Restrictiveness Index (TRI) which measures restrictions on trade in six different service industries for 34 different countries. A problem is that it was produced only once and hence does not yield information on changes in restrictions over time. Another problem is that the classification for the TRI is not quite comparable with our services trade data at the sectoral level. 17 As an alternative specification, we also estimated the panel only with the years for which they actually have data and found that they are not significantly different. The results are not reported here for brevity, but available from the authors upon request. 18 Descriptive statistics and simple correlations among explanatory variables are also reported in Appendix Table 4 and Table 5, respectively.

10
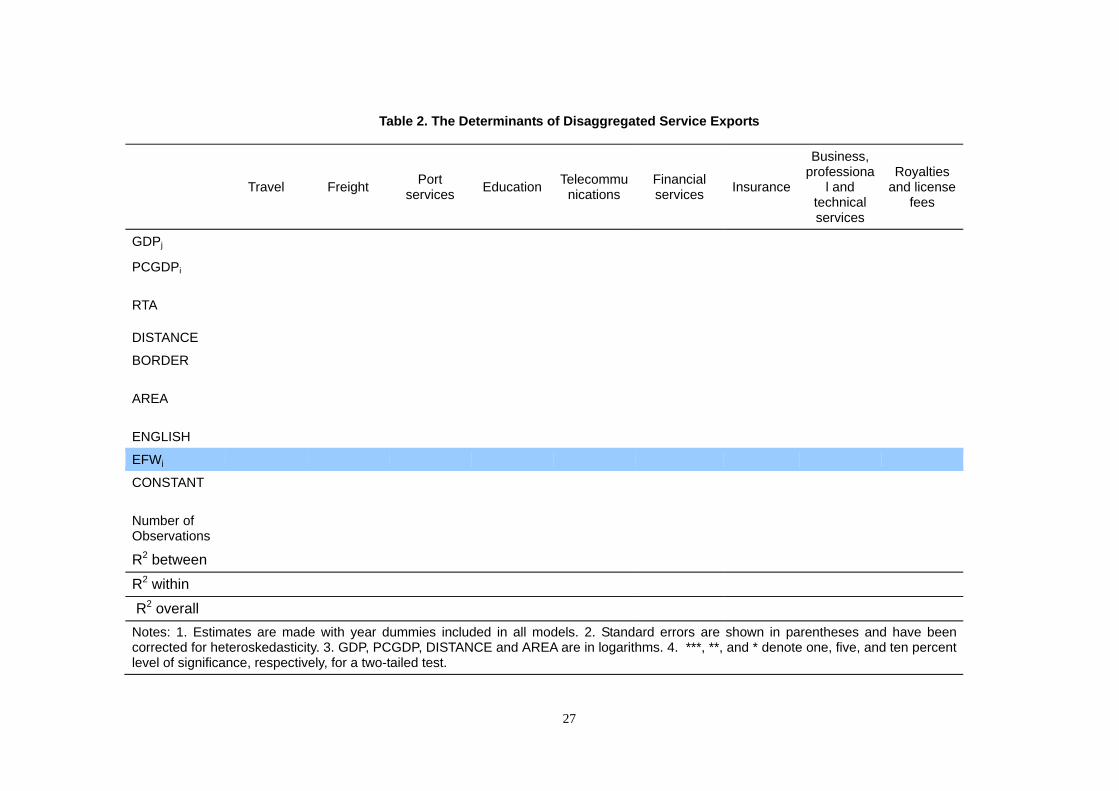
coefficients, while the land area has a negative and significant coefficient. It is noted, however, that per capita GDP and the FTA dummy do not reveal any statistically meaningful estimated coefficients.19 < Insert Tables 1 – 3.> The coefficient of interest concerns the effects of economic freedom on services trade. That is, beyond these gravity effects, does economic freedom have any substantial effect on services trade? Our benchmark results show that economic freedom does not have a positive (statistically significant) relation with total private service exports. When country-specific fixed effects are added, as the results are shown in column 2, we find that an increase in economic freedom of a country increases total private service exports of the U.S., holding other things constant. The third and fourth columns show the corresponding results for total service imports to the U.S. In the case of service imports, economic freedom has positive and significant estimated coefficients in both models. It is also noted that our Chi2 test results show that the size of estimated coefficient for economic freedom in import equation (column 4) is greater than that in export equation (column 2). This implies that when economic freedom is enhanced in a country, it has a greater positive impact on the service imports from that country to the U.S than on the service exports to the country from the U.S. It is also noted that it not only seems that the initial level of economic freedom is positively related with the level of services trade, but also that an increase in the level of economic freedom is positively related with an increase in the level of services trade. The results for different types of service exports from the U.S are shown in Table 2. It is somewhat surprising that our simple gravity equation explains a very high proportion of the variation in the dependent variable, regardless of the type of service exports. The highest R2 is 0.899 in the equation for Port services while the lowest R2 is 0.531 in the equation for Business, professional and technical services. Market size (as indicated by GDP) of destination countries has a positive relation with every type of service exports of the U.S. Geographical distance between the U.S. and destination
19 As ADJACENCY and FTA dummies are highly correlated (see Appendix Table 5), we also ran regressions including these dummies alternatively and found that the significance of these variables increased.
11
countries has a negative relation with most service exports of the U.S., but, for services such as Travel, Royalties and license fees, Education, and Telecommunications, distance seems less relevant for trade. The result for Travel and Telecommunications seems plausible, as the price of such services rises with distance and this effect may work against the negative impact of distance on the volume of trade in such services. The results also show that the adjacency variable, i.e., the Canada-Mexico dummy, has positive coefficients for six services, and that the countries with larger land size tend to import a lower value of services, regardless of type except for Insurance, from the U.S., other things being constant. Per capita income level also has significant coefficients in all equations, but the signs are not always positive. For example, the results show that poor countries tend to buy more of Freight service, and Business, professional and technical services from the U.S., and send more of their children to the U.S. for education. It is worth noting that when economic freedom variable is excluded from the regression, coefficients for per capita income are positive in most equations. This is due to the positive correlation of per capita income and economic freedom (See Appendix Table 6.). Thus, when economic freedom variable is dropped from the regression, as in most of the existing gravity literature, part of the positive effects of greater economic liberty on trade is misread as a positive effect of higher income per capita on trade. The common language has a positive impact on exports of Travel services, Freight, Financial services, and Telecommunications. Economic freedom, the variable of our greatest interest, has a positive relation with exports of most business-related services such as Financial services, Insurance, Business, professional and technical services, and Royalties and license fees. Economic freedom, holding other things constant, seems to reduce the cost for foreign residents to get access to these business-related services provided by U.S. residents. As noted earlier, Royalties and license fees include transactions between both affiliated and unaffiliated ones. In fact, more than two-thirds (e.g., 74.5% in 2003) of the U.S. receipts of Royalties and license fees are from foreign affiliates of U.S. firms. Thus, we have evidence to claim that economic freedom is associated with outward foreign direct investment and accompanied technology transactions. On the other hand, economic freedom has negative coefficients for Travel and

12
Telecommunications. A negative coefficient for Travel implies that residents of countries with a lower level of economic freedom visit the U.S. more often than others, holding other things constant. Telecommunications service partly depends on bilateral fees negotiated by telecommunications carriers. Lack of economic freedom may increase the relative usage of traditional telecommunications instead of other communication channels, such as internet, and may leave call connection fees high, both of which would push up the U.S. telecommunications services receipts. But this explains only part of the reason. Table 3 reports the estimated results for disaggregated service imports. The results are roughly similar to the ones for service exports. One noticeable difference is that the estimated coefficient for per capita GDP in the import equation for Travel is negative while it was positive in the export equation. This implies that U.S. residents tend to travel more to low-income countries, while people from high-income countries tend to travel more to the U.S., other things being constant. It is also interesting to note that the estimated coefficients for English dummy are positive and significant for Travel, Financial services, and Telecommunications in both export and import equations. The estimated coefficients for economic freedom index in the equations for business-related services are again positive and statistically significant. The U.S. payments in Financial services and Insurance include purchases from foreign financial/insurance companies by unaffiliated U.S. residents. Higher economic freedom in partner countries seems to allow Americans to purchase more finance and insurance services from foreign companies. On the other hand, U.S. payments for Royalties and license fees largely consist of purchases from foreign firms by the U.S. affiliates of foreign firms, a point noted above. Countries with higher economic freedom seem to invest more in the U.S., and hence larger U.S. payments are to be recorded. It is also worth noting that for business-related services, the size of the coefficients for economic freedom in import equations (Table 3) is always greater than that for export equations (Table 2), and our Chi2 test results support this observation. Thus, considering the results found in Table 1 together, we have evidence that a country with greater economic freedom tends to export services, particularly business-related services, to the U.S. at a degree greater than it imports such services from the U.S. One may expect that an increase in economic freedom of a country implies a greater

13
degree of access to that market and hence the balance of payments in the services sector will become worse. This is one of the major reasons why many countries do not want to enhance their economic freedom related with the service sector. But, our results show that enhancing economic freedom of a country would be beneficial for the country because it will lead to a great deal of trade in business-related services which in turn has a positive effect on the functioning of the economy as a whole, and will improve the balance of payments of the country. 4. Sensitivity Analysis Considering Country Effects and Different Economic Freedom Indices We now check extensively the sensitivity of our key result that higher economic freedom is associated with larger trade in services. Without a structural model for each type of services trade, one may question the relevance of using the standard gravity equation for services trade. In particular, as Deardorff (1998), Anderson and van Wincoop (2003) and Subramanian and Wei (2003) point out, the standard gravity model might be misspecified if a “multilateral resistance” or “remoteness” term is ignored. Anderson and van Wincoop (2003) suggest that the inclusion of country fixed effects captures “multilateral resistance” reasonably well. Therefore, as we did for the aggregate services trade in Table 1, we first take account of country-specific effects by adding country-specific fixed effects to the benchmark equation so that any country specific variables omitted in our gravity equation can be taken care of. This is also useful because it provides a time series estimate of the effect of economic freedom. Second, we use another index which also measures the degree of economic freedom in different countries. Heritage Foundation, in cooperation with the Wall Street Journal, has published their version of Economic Freedom Index every year since 1995. Heritage Foundation’s Index of Economic Freedom has ten major categories: (1) Trade Policy; (2) Fiscal Burden of Government; (3) Government Intervention in the Economy; (4) Monetary Policy; (5) Capital Flows and Foreign Investment; (6) Banking and Finance; (7) Wages and Prices; (8) Property Rights; (9) Regulation; and (10) Informal Market Activity. The scales run from 1 to 5. A score of 1 signifies an economic environment or set of policies that are most conducive to economic freedom, while a score of 5 signifies a set of policies that are least conducive to economic freedom. The summary rating is the simple average of the 10 categories. See 2006 Index of Economic Freedom, Chapter

14
5.20 See also Appendix Table 1 in this paper, for comparison with Fraser Institute’s Economic Freedom of the World Index. Appendix Table 3 tabulates the ratings of the countries by the Heritage Foundation’s index. It should be noted that, to make the ratings of Heritage Foundation’s index comparable to the ones of Fraser Institute’s index, we take the inverse values of the original ratings of Heritage Foundation’s index and multiply them by 10. We use these converted ratings of Economic Freedom Index for the period 1995-2003. <Insert Table 4.> In sum, four alternative estimates are made for each type of service exports. Table 4 summarizes the signs (and their significance) of the estimated coefficient for economic freedom index for different types of service exports from the U.S. Even after country-specific fixed effects are controlled, the effects of economic freedom tend to remain positive and statistically significant for most service exports. One exception is that the estimates in the equations for Travel and Telecommunications, whose sign was negative in the year fixed-effects model, become positive and significant (Travel) or become insignificant (Telecommunications) in the year and country-fixed effects model. When the Index of Economic Freedom of Heritage Foundation is used, the results seem similar. Table 4 also tabulates the signs of coefficient estimates for service imports to the U.S. in various models. Again, our benchmark results remain robust to including country effects and to using the Index of Heritage Foundation in place of the Index of Fraser Institute. To summarize, the key result - that economic freedom is associated with a statistically significant increase in services trade - seems robust. In particular, the effect of economic freedom on business-related services trade (both exports and imports) such as “Financial services,” “Insurance,” “Business, professional and technical services,” and “Royalties and license fees” is very strong. Considering a Different Country - Japan Our key result could be suspected as a peculiar case of only one country – the U.S.
20 Available online at http://www.heritage.org/research/features/index/.

15
Accordingly, as another way to check the robustness of our results, we also look at a different country – Japan. We choose Japan because it is rather characterized as a more regulated economy than most other developed countries,21 its service industries have relatively weak international competitiveness, and its bilateral services trade data on the balance-of-payments basis are also available for disaggregated categories. The data are drawn from <Regional Balance of Payments, Bank of Japan>. 22 The service exports and imports in different sectors are broken down for 33 countries since 1996. Among the 33 countries, 9 countries (Belgium, Cayman Islands, Iran, Luxembourg, Norway, Russia, Saudi Arabia, Taiwan, and UAE) are dropped based on the consistency of the services trade data and availability of explanatory variables, and we use the data for the following 24 countries: Australia, Brazil, Canada, China, France, Germany, Hong Kong, India, Indonesia, Italy, Korea, Malaysia, Mexico, Netherlands, New Zealand, Philippines, Singapore, South
Africa, Spain, Sweden, Switzerland, Thailand, United Kingdom, United States
This is a set of countries similar to the one for the analysis of the U.S. The only difference is that Chile, Israel, Norway and Venezuela are dropped and the U.S. is added in place of Japan. In 2003, the 24 countries took 89.5% (US$ 69.4 billion) of total service exports (US$ 77.6 billion) of Japan and 81.2% (US$ 90.3 billion) of total service imports (US$ 111.2 billion). Therefore, our sample covers a substantial portion of Japanese services trade. Among the service sectors included in the Bank of Japan report, the “Government services” sector is dropped because we consider only private services, and we consider the following nine services sectors: (1) Travel, (2) Transportation, (3) Communication, (4) Construction, (5) Insurance, (6) Financial services, (7) Computer and information services, (8) Royalties and license fees, (9) Personal, cultural, and recreational services.
21 For instance, the rating of the Fraser Institute’s economic freedom index is 7.25 for 2003, while it was 8.19 for the U.S. (See Appendix Table 2). A similar rating is also shown by the Heritage Foundation’s index (See Appendix Table 3).

16
We estimate the following standard gravity equation: TRADEjt = β1GDPjt + β2PCGDPjt + β3DISTANCEj + β4AREAj + β5EFWjt + α + δt
+ εjt,
where j denotes trading partner of Japan, and t denotes a year. Note that the dummies for the land border sharing, common membership of regional trade arrangement, and common language are not included.23 <Insert Table 5.> Table 5 reports the signs of the estimated coefficients for economic freedom index in the four different specifications for each type of service exports from Japan and imports to Japan. Again, our benchmark model, which is the OLS estimator with year fixed effects, reveals that the effects of economic freedom are positive on both exports and imports of various types of services in the case of Japan. One thing to note is that, unlike the case of the U.S., the specifications that include the country effects deliver rather weak association between economic freedom and services trade of Japan.24 Nonetheless, our benchmark result remains broadly unchanged, regardless of the type of economic freedom index. 5. Effects of Disaggregated Economic Freedom Index on Services Trade As there are sub-categories of economic freedom index, this section looks at the effects of different components of economic freedom on services trade.25 We estimate all of the above mentioned models, replacing the aggregate economic freedom index of the Fraser Institute with its five components – (1) Size of government: expenditures, taxes and
22 Available online at the Bank of Japan website (http://www.boj.or.jp/en/stat/dlong_f.htm). 23 Japan signed a FTA agreement with Singapore on January 2002 and it became effective as of November 2002. Therefore, we also included a dummy which takes one only for the year of 2003 in observation of trade with Singapore, but the results didn’t change considerably. 24 We initially thought that this might be due to a possible loss of efficiency as the Japanese sample covers only 9 years (1996-2003) for 24 countries, whereas the U.S. sample covers 12 years (1992-2003) for 28 countries. So we ran a regression on exactly the same pane of countries and years for both data (24 countries and 1996-2003) but found that the results continue to be weaker for the Japanese sample. 25 Ayal and Karras (1998) and Carlsson and Lundstrom (2002) decompose the economic freedom index of Fraser Institute and examine how the components of the index differ in their relation with economic growth.

17
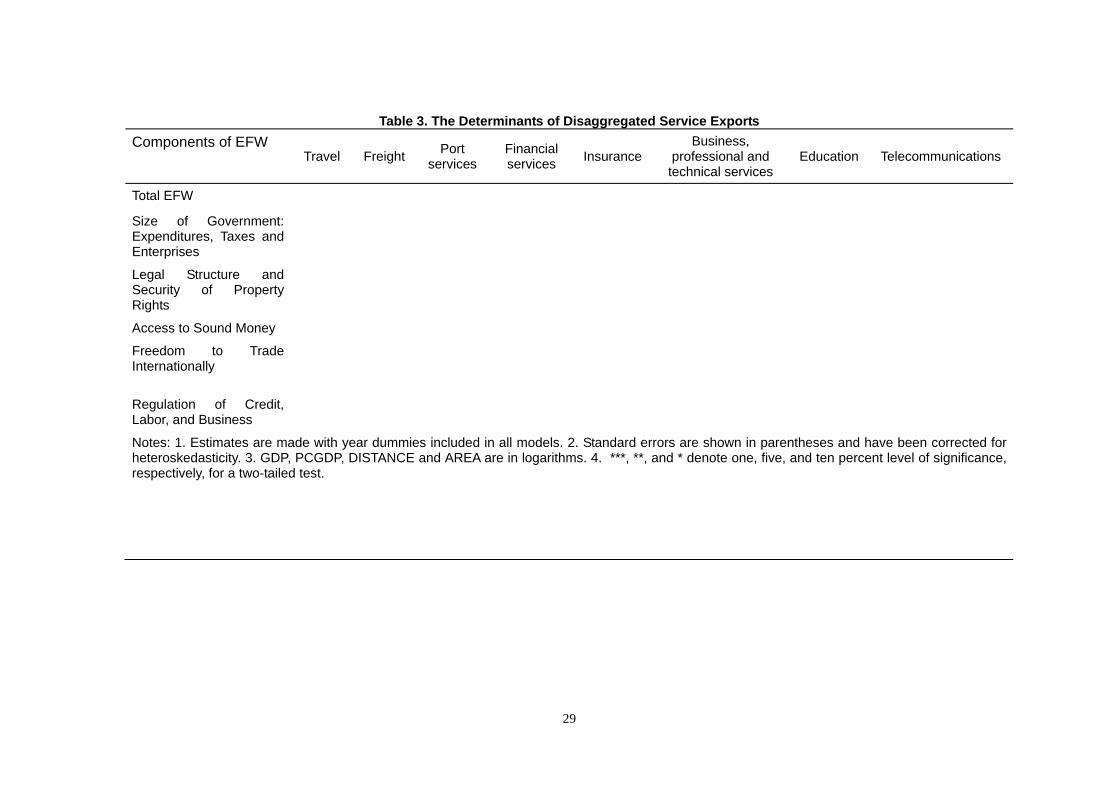
enterprises; (2) Legal structure and security of property rights; (3) Access to sound money; (4) Freedom to trade internationally; and (5) Regulation of credit, labor, and business. To save space, we present only the results obtained from our benchmark model estimated by the OLS with time fixed effects.26 Table 6 reports the summary of estimated effects of different components of economic freedom on U.S. service exports and imports. Table 7 also reports a corresponding summary on Japanese service exports and imports. Some interesting findings are as follows: <Insert Tables 6-7.> First, among the five components of economic freedom disaggregated by the Fraser Institute, Size of government: expenditures, taxes and enterprises and Regulation of credit, labor and business are the two components that are positively and statistically significantly related to most types of service exports and imports. One exception is detected for Telecommunications in U.S. export and import equations, where the estimated coefficient for Regulation has a negative and statistically significant sign. Size of government indicate the extent to which countries rely on individual choice and markets, rather than the political process, to allocate resources and goods and services. Regulation of credit, labor and business indicates the extent to which the banking industry is dominated by private firms and whether foreign banks are permitted to compete in the market and whether controls on interest rates interfere with the market in credit. This component also indicates the extent to which many types of labor-market regulations and credit-market regulations infringe upon the economic freedom. Thus, these two components could be interpreted as indicators of competitive macroeconomic conditions and microeconomic regulatory environment of each economy. Second, among the five components, Access to sound money of partner countries has often negative and significant relations with many types of service exports from the U.S. or no statistically meaningful relations with service exports from Japan. This component measures the consistency of monetary policy with long-term price stability and the ease with which other currencies can be used via domestic and foreign bank accounts. 26 The results obtained from other models are generally consistent with our benchmark results. They are available upon request.

18
Third, the results for Legal structure and security of property rights and Freedom to trade internationally are somewhat mixed in the case of the U.S. exports, while being largely positively associated with U.S. imports. Similar results are obtained in the case of Japan. Legal structure and security of property rights measures the degree of rule of law, security of property rights, an independent judiciary, and an impartial court system. Freedom to trade internationally measures a wide variety of restraints that affect international exchange: tariffs, quotas, hidden administrative restraints, and controls on the exchange rate and capital, and thus measures the degree of restrictions on goods trade. Thus, services trade does not seem to have direct association with restrictions on goods trade. 6. Summary and Concluding Remarks This paper uses the U.S. data (and the Japanese data for the purpose of robustness check) to examine the effect of economic freedom on trade in different types of services. To accomplish the purpose, this study utilizes the augmented standard gravity equation. The results show that the gravity equation fits services trade fairly well, but unevenly among different types of service exports and imports. We found that, in general, services trade depends positively on market size (as indicated by GDP) of both origin and destination countries and negatively on distance between them. We also found that the land size of both origin and destination countries has a negative relation with the size of services trade. We also found that economic freedom as judged either by the Fraser Institute’s Economic Freedom of the World Index or by the Heritage Foundation’s Economic Freedom Index has a consistently significant positive relation with most types of service exports as well as service imports. The effect of economic freedom on trade in services remains large and significant throughout in most sub-sectors of services, particularly in business-related services, regardless of estimation techniques, type of economic freedom, or country of study. To summarize, the paper finds robust evidence that countries with a high level of economic freedom trade more of services than countries with a low level of economic freedom, holding constant all other observed and unobserved effects. It is striking that

19
this is true not only for exports but also for imports. Why then does economic freedom have a positive impact on trade in services, particularly in business-related services? The answer to this question for service imports is rather straightforward. As greater economic freedom implies a greater degree of access to foreign markets and capital, more freedom allows firms, governments, and consumers to purchase more imported services. Why then do service exports also increase when economic freedom increases? The major reason seems to be that greater economic freedom is associated with stronger international competitiveness of firms. This paper also finds that among different components of economic freedom index, Size of government: expenditures, taxes and enterprises and Regulation of credit, labor, and business have the most significantly positive relation with services trade. These two elements of the economic freedom index represent competitive macroeconomic conditions and microeconomic regulatory environment of partner countries and seem to explain the most important policy environment for business-related services. To conclude, we have robust evidence that liberalization of an economy promotes not only service imports to the economy but also service exports from the economy. This is good news for policy makers who are currently at the WTO negotiation tables for the liberalization of services trade. Final note: we have assumed that the specifications are the same so as to examine how the impact on trade for some of the variables differs among different service sectors. As the present paper has revealed how economic freedom and other key variables of interest are associated unevenly with services trade, investigating the impact of economic freedom in a different specification for each type of services trade is a potential subject for future work.

20
References Anderson, J. E. and E. van Wincoop (2003), “Gravity with Gravitas: A Solution to the Border Puzzle,” American Economic Review, 93(1), pp.170-192. Anderson, J. E. and D. Marcouiller (2004), “Insecurity and the Patterns of Trade: An Empirical Investigation,” Review of Economics and Statistics, 84, pp.342-352. Ayal, E. B. and G. Karras (1998), “Components of Economic Freedom and Growth: An Empirical Study,” Journal of Developing Areas, 32(3), pp.327-338. Berggren, N. (1999), “Economic Freedom and Equality: Friends or Foes?” Public Choice, 100(3/4), pp. 203-23. Berggren, N. (2003), “The Benefits of Economic Freedom: A Survey,” The Independent Review, 8(2), pp.193-211. Brunetti, A., G. Kisunko and B. Weder (1997), “Institutional Obstacles to Doing Business: Region-by-Region Results from a Worldwide Survey of the Private Sector, World Bank Policy Research Working Paper 1759. Carlsson, F. and S. Lundstrom (2002), “Economic Freedom and Growth: Decomposing the Effects,” Public Choice, 112(3/4), pp. 335-344. Ceglowski, J. (2006), “Does Gravity Matter in a Service Economy?” Review of World Economics, 142(2), pp.307-329.
Cole, H. Julio (2003), “The Contribution of Economic Freedom to World Economic Growth: 1980-99,” The Cato Journal. Volume 23(2), pp. 189-199.
Craig, D. A. II and R. J. Sonora (2005), “The Asymmetric Effects of Economic Freedom on International Trade Flows,” International Journal of Business and Economics, 4(2), pp.141-155. Dawson, J. W. (1998), “Institutions, Investment, and Growth: New Cross-Country and

21
Panel Data Evidence,” Economic Inquiry, 36, pp. 603-619. Dawson, J. W. (2003), “Causality in the Freedom-Growth Relationship,” European Journal of Political Economy, 19(3), pp. 479-495. de Haan, J. and C. L. J. Sierman (1998), “Further Evidence on the Relationship between Economic Freedom and Economic Growth,” Public Choice, 95, pp. 363-380. de Vanssay, X. and Z. A. Spindler (1994), “Freedom and Growth: Do Constitutions Matter,” Public Choice, 78(3-4), pp. 359-372. Deardorff, V. A. (1998). “Determinants of Bilateral Trade: Does Gravity Work in a Neoclassical World?” in Jeffrey A. Frankel ed., The Regionalization of Economy, Chicago: University of Chicago Press, pp.7-22. Depken, C. A. II. and R. J. Sonora (2005), “The Asymmetric Effect of Economic Freedom on International Flows,” International Journal of Business and Economics, 4(2), pp.141-155. Easton, S. T. and M. A. Walker (1997), “Income, Growth, and Economic Freedom,” American Economic Review, 87(2), pp.328-332. Eaton, J., and S. Kortum (2002). “Technology, Geography, and Trade,” Econometrica, 70(5), pp.1741-1779. Grünfeld, L. A. and A. Moxnes (2003). “The Intangible Globalization: Explaining the Patterns of International Trade in Services,” Discussion Paper No.657, Norwegian Institute of International Affairs. Helpman, E. and P. Krugman (1985). Market Structure and Foreign Trade: Increasing Returns, Imperfect Competition and the International Economy, Cambridge, MA: MIT Press. Kimura F. and H.-H. Lee (2006). “The Gravity Equation in Services Trade,” Review of World Economics, 142(1), pp.92-121.

22
Lejour A. and J. de P. Verheijden (2004), “Services Trade with Canada and the European Union,” CPB Discussion Paper No.42. CPB Netherlands Bureau for Economic Policy Analysis. Mirza, D. and G. Nicoletti (2004). “What is So Special about Trade in Services?” Research Paper 2004/02, Leverhulme Centre for Research on Globalisation and Economic Policy. Nelson, M. A. and R. D. Singh (1998), “Democracy, Economic Freedom, Fiscal Policy and Growth in LDCs: A Fresh Look,” Economic Development and Cultural Change, 46(4), pp., pp. 677-696. Nephew, E., J. Koncz, M. Borga, and M. Mann (2005) “U.S. International Services: Cross-border Trade in 2004 and Sales through Affiliates in 2003”, Survey of Current Business, October, pp. 25-77. Pöyhönen, P. (1963). “A Tentative Model for the Volume of Trade Between Countries, Weltwirtschaftliches Archiv, Vol 90, pp.93-100. Rose, A. K. (2000), “One Money, One Market: Estimating the Effect of Common Currencies on Trade,” Economic Policy, 15. Rose, A. K. (2004). “Do We Really Know that the WTO Increases Trade?”, American Economic Review, 94(1), pp. 98-114. Rose, A. K. (2005a). “Does the WTO Make Trade More Stable?”, Open Economies Review, 16(1), pp.7-22. Rose, A. K. (2005b), “Which Institutions Promote International Trade?” Review of International Economics, 13(4), 682-709. Subramanian, A. and S. J. Wei (2003), “The WTO Promotes Trade, Strongly but Unevenly,” NBER Working Paper, 10024. Tinbergen, J. (1962). Shaping the World Economy – Suggestions for an International Economic Policy, The Twentieth Century Fund.
23
Whichard, O. G. and M. Borga (2002) “Selected Issues in the Measurement of U.S. International Services”, Survey of Current Business, June, pp. 36-56. Wu, W. and O. A. Davis (1999), “The Two Freedoms, Economic Growth and Development: An Empirical Study,” Public Choice, 100, pp. 39-64.

24
Figure 1. U.S. Exports and Imports of Different Services, 2003
0.010.020.030.040.050.060.070.0
Tra
vel
Fre
igh
t
Po
rt s
erv
ice
s
Fin
an
cia
ls
erv
ice
s
Ins
ura
nc
e
Bu
sin
es
s,
pro
fes
sio
na
l,a
nd
te
ch
nic
al
se
rvic
es
Ro
yalt
ies
an
dli
ce
ns
e f
ee
s
Ed
uc
ati
on
Te
lec
om
mu
nic
ati
on
s
US
$ b
illi
on
Exports
Imports

25
Table 1. The Determinants of Total Service Exports and Imports
Total service imports Total service exports
Fixed effects Fixed effects
Random effects XTFEVD Fixed
effects Random effects XTFEVD
GDPj -0.433 (0.658)
0.741*** (0.079) 0.353
(0.431 0.679*** (0.074)
PCGDPi
1.508** (0.707)
0.223*** (0.080) 0.702
(0.463) 0.227*** (0.072)
RTA -0.001
(0.133) 0.008
(0.097) -0.163*(0.087)
-0.155*
(0.083)
DISTANCE -0.011 (0.302) -0.127
(0.285)
BORDER 1.248** (0.569) 0.982*
(0.538)
AREA -0.000
(0.000) -0.000 (0.000)
ENGLISH 0.160 (1.888)
EFWj 0.107**
(0.053) 0.124***
(0.027) 0.842**(0.035)
0.082***
(0.033)
CONSTANT
18.449
(11.56) -3.677(4.471) 5.713
(7.571) 2.489
(3.526)
Number of Observations 112 112 112 112
R2 within 0.792 0.229 0.792 0.789
R2 between 0.525 0.525 0.886
R2 overall 0.537 0.537 0.879 Notes: 1. Standard errors are shown in parentheses and have been corrected for heteroskedasticity. 2. GDP, PCGDP, DISTANCE and AREA are in logarithms. 3. ***, **, and * denote one, five, and ten percent level of significance, respectively, for a two-tailed test.

26
Table 2. The Determinants of Disaggregated Service Imports
Travel Freight Port services Education Telecommu
nications Financial services Insurance
Business, professiona
l and technical services
Royalties and license
fees
GDPj
PCGDPi
RTA
DISTANCE
BORDER
AREA
ENGLISH
EFWj
CONSTANT
Number of Observations
R2 between
R2 within
R2 overall
Notes: 1. Estimates are made with year dummies included in all models. 2. Standard errors are shown in parentheses and have been corrected for heteroskedasticity. 3. GDP, PCGDP, DISTANCE and AREA are in logarithms. 4. ***, **, and * denote one, five, and ten percent level of significance, respectively, for a two-tailed test.
27
Table 2. The Determinants of Disaggregated Service Exports
Travel Freight Port services Education Telecommu
nications Financial services Insurance
Business, professiona
l and technical services
Royalties and license
fees
GDPj
PCGDPi
RTA
DISTANCE
BORDER
AREA
ENGLISH
EFWj
CONSTANT
Number of Observations
R2 between
R2 within
R2 overall
Notes: 1. Estimates are made with year dummies included in all models. 2. Standard errors are shown in parentheses and have been corrected for heteroskedasticity. 3. GDP, PCGDP, DISTANCE and AREA are in logarithms. 4. ***, **, and * denote one, five, and ten percent level of significance, respectively, for a two-tailed test.

28
Table 3. The Determinants of Disaggregated Service Imports
Components of EFW Travel Freight Port
services Financial services Insurance
Business, professional and technical services
Education Telecommunications
Total EFW
Size of Government: Expenditures, Taxes and Enterprises
Legal Structure and Security of Property Rights
Access to Sound Money
Freedom to Trade Internationally
Regulation of Credit, Labor, and Business
Notes: 1. Estimates are made with year dummies included in all models. 2. Standard errors are shown in parentheses and have been corrected for heteroskedasticity. 3. GDP, PCGDP, DISTANCE and AREA are in logarithms. 4. ***, **, and * denote one, five, and ten percent level of significance, respectively, for a two-tailed test.
29
Table 3. The Determinants of Disaggregated Service Exports Components of EFW
Travel Freight Port services
Financial services Insurance
Business, professional and technical services
Education Telecommunications
Total EFW
Size of Government: Expenditures, Taxes and Enterprises
Legal Structure and Security of Property Rights
Access to Sound Money
Freedom to Trade Internationally
Regulation of Credit, Labor, and Business
Notes: 1. Estimates are made with year dummies included in all models. 2. Standard errors are shown in parentheses and have been corrected for heteroskedasticity. 3. GDP, PCGDP, DISTANCE and AREA are in logarithms. 4. ***, **, and * denote one, five, and ten percent level of significance, respectively, for a two-tailed test.

30
Appendix Table 1. Components of Freedom of the World Index
Fraser Freedom of the World Index 1. Size of Government: Expenditures, Taxes and Enterprises A. General government consumption spending as a percentage of total consumption B. Transfers and subsidies as a percentage of GDP C. Government enterprises and investment as a percentage of total investment D. Top marginal tax rate (and income threshold at which it applies) 2. Legal Structure and Security of Property Rights A. Judicial independence B. Impartial courts – a trusted legal framework exists for private businesses to challenge the legality of government actions or regulation C. Protection of intellectual property D. Military interference in rule of law and the political process E. Integrity of the legal system 3. Access to Sound Money A. Average annual growth of the money supply in the last five years minus average annual growth of real GDP in the last ten years B. Standard inflation variability in the last five years C. Recent inflation rate D. Freedom to own foreign currency bank accounts domestically and abroad 4. Freedom to Trade Internationally A. Taxes on international trade B. Regulatory trade barriers C. Actual size of trade sector compared to expected size D. Difference between official exchange rate and black-market rate E. International capital market controls 5. Regulation of Credit, Labor, and Business A. Credit market regulations B. Labor market regulations C. Business regulations
Source: Fraser Institute, Economic Freedom of the World: 2005 Report, Chapter 1 (http://www.freetheworld.com/release.html);

31
Appendix Table 2. Fraser Institute’s Economic Freedom of the World Index, 1992-2003
1992 1995 2000 2005
Hong Kong 8.56 9.08 8.73 8.69 Singapore 8.38 8.78 8.51 8.48 New Zealand 7.74 8.65 8.36 8.23 Switzerland 7.90 8.02 8.40 8.17 United Kingdom 7.61 8.07 8.23 8.15 Canada 7.60 7.77 8.12 8.03 Australia 7.47 7.78 8.03 7.85 Netherlands 7.50 7.82 8.05 7.74 Germany 7.31 7.48 7.61 7.46 Chile 6.94 7.47 7.49 7.43 Sweden 6.77 7.19 7.41 7.33 Norway 6.99 7.45 7.16 7.30 Japan 7.24 7.03 7.33 7.25 Spain 6.50 6.98 7.36 7.16 Korea 6.23 6.33 6.63 6.96 South Africa 5.71 6.30 6.79 6.92 France 6.76 6.78 7.00 6.91 Israel 4.88 5.71 6.52 6.75 Philippines 6.12 7.11 7.12 6.65 Thailand 6.89 7.10 6.66 6.60 Italy 6.50 6.46 7.08 6.57 Malaysia 7.30 7.36 6.85 6.52 Mexico 6.15 6.38 6.28 6.45 India 5.19 5.61 6.23 6.41 Indonesia 6.43 6.42 5.90 6.07 China 4.97 5.20 5.82 5.97 Brazil 4.32 4.42 5.88 5.93 Venezuela 4.99 4.22 5.66 4.33 United States 8.03 8.31 8.57 8.19
Note: The table is sorted by the rank in 2003 of the countries, except for the United States.

32
Appendix Table 4. Descriptive Statistics Variable Obs Mean Standard
DeviationMin Max
Exports Total 336 17.4 1.0 15.5 19.7 Travel 336 16.1 1.1 13.8 18.7 Freight 336 14.2 1.2 11.6 16.8 Port 336 14.5 1.3 9.2 16.9 Financial 336 14.0 1.2 11.2 17.2 Insurance 336 12.0 1.6 8.0 16.3 Business, etc 336 15.1 0.9 13.0 17.5 Royalties, etc 334 15.1 1.5 10.0 18.0 Education 336 13.9 1.1 9.4 16.4 Telecommunications 336 13.4 0.9 11.3 16.2 Imports Total 336 16.9 1.1 14.7 19.5 Travel 336 15.8 1.1 13.7 18.1 Freight 336 14.3 1.6 9.2 17.2 Port 332 13.8 1.7 9.3 17.1 Financial 336 12.5 1.6 7.1 16.6 Insurance 292 11.8 2.6 6.9 17.6 Business, etc 336 13.6 1.3 10.4 17.2 Royalties, etc 292 12.8 2.4 9.2 17.8 Education 336 11.3 2.1 5.7 15.3 Telecommunications 336 13.6 1.1 11.1 16.3 GDPj 336 21.8 1.2 20.0 24.8 PCGDPj 336 4.5 1.3 1.2 6.2 DISTANCE 336 9,0 0.6 6.6 9.7 ADJACENCY 336 0.08 0.26 0 1 AREA 336 12.8 2.3 6.5 16.0 FTA 336 0.1 0.3 0 1 ENGLISH 336 0.3 0.5 0 1 EFI (Fraser) 336 7.0 1.0 4.2 9.1 EFI (Heritage) 248 2.1 0.5 1.3 3.9 Note: All variables are in logarithms, except dummy variables (ADJANCY, FTA and ENGLISH) and economic freedom indices.

33
Appendix Table 5. Simple Correlations among Explanatory Variables GDPj PCGDPj DISTANCE ADJACENCY AREA FTA ENGLISH EFI
(Fraser)EFI (Heritage)
GDPj
1.00
PCGDPj
0.28 1.00
DISTANCE
-0.26 -0.27 1.00
ADJANCEY
0.11 0.01 -0.75 1.00
AREA
0.29 -0.43 -0.30 0.32 1.00
FTA
-0.01 0.04 -0.63 0.85 0.17 1.00
ENGLISH
-0.15 -0.17 0.03 0.13 0.15 0.06 1.00
EFI (Fraser)
-0.01 0.64 0.01 0.01 -0.51 -0.08 0.32 1.00
EFI (Heritage)
-0.04 0.72 0.03 -0.07 -0.64 -0.11 0.19 090 1.00
Note: All variables are in logarithms, except dummy variables (ADJANCY, FTA and ENGLISH) and economic freedom indices.