how can indonesia achieve its climate … layout...arief wijaya, hanny chrysolite, mengpin ge,...
TRANSCRIPT

WORKING PAPER | September 2017 | 1
EXECUTIVE SUMMARYHighlights�� Indonesia must prioritize implementation of climate
change abatement actions if it is to meet the targets for greenhouse gas (GHG) reductions set out in the country’s first nationally determined contribution (NDC).
�� This working paper analyzes carbon dioxide emissions from the land-use and energy sectors and compares emission levels expected under a baseline projection through 2030 with emissions that might result from existing and strengthened mitigation measures in the two sectors.
�� If Indonesia implements existing policy measures, its 2030 carbon dioxide emissions from the land-use and energy sectors will overshoot the target associated with the country’s unconditional commitment to a 29 percent reduction.
�� If Indonesia implements strengthened measures, its 2030 carbon dioxide emissions from the land-use and energy sectors will be below that target level, which would allow for a small increase in emissions of other GHGs or from other sectors, while still meeting the unconditional target.
�� Reducing emissions to meet Indonesia’s conditional target of a 41 percent reduction below business-as-usual levels would require even stronger efforts, including extending the country’s forest moratorium, restoring degraded peatland, implementing energy conservation programs, and pursuing mitigation measures for other sectors and gases.
CONTENTS Executive Summary � � � � � � � � � � � � � � � � � � � � � � � � � � � � � � � � � � � � � � � � � � � � � � � � � � � � � � � � 1
1� Introduction � � � � � � � � � � � � � � � � � � � � � � � � � � � � � � � � � � � � � � � � � � � � � � � � � � � � � � � � � � � � � � � 5
2� GHG Profile and Trends in Indonesia � � � � � � � � � � � � � � � � � � � � � � � � � � � � � � � � � � 6
3� Mitigation Policies and Actions in Indonesia � � � � � � � � � � � � � � � � � � � � � � � � 8
4� Quantifying Key Mitigation Options � � � � � � � � � � � � � � � � � � � � � � � � � � � � � � � � � � � 11
5� Policy Options to Achieve Indonesia’s NDC Targets � � � � � � � � � � � � � � 28
6� Conclusions and Recommendations � � � � � � � � � � � � � � � � � � � � � � � � � � � � � � � 32
Endnotes � � � � � � � � � � � � � � � � � � � � � � � � � � � � � � � � � � � � � � � � � � � � � � � � � � � � � � � � � � � � � � � � � � � 33
References � � � � � � � � � � � � � � � � � � � � � � � � � � � � � � � � � � � � � � � � � � � � � � � � � � � � � � � � � � � � � � � � � 34
WORKING PAPER
HOW CAN INDONESIA ACHIEVE ITS CLIMATE CHANGE MITIGATION GOAL? AN ANALYSIS OF POTENTIAL EMISSIONS REDUCTIONS FROM ENERGY AND LAND-USE POLICIESARIEF WIJAYA, HANNY CHRYSOLITE, MENGPIN GE, CLORINDA KURNIA WIBOWO, ALMO PRADANA, ANDHYTA FIRSELLY UTAMI, AND KEMEN AUSTIN
Suggested Citation: Wijaya, A., H. Chrysolite, M. Ge, C. Wibowo, A. Pradana, A. Utami, and K. Austin. 2017. “How Can Indonesia Achieve its Climate Change Mitigation Goal? An Analysis of Potential Emissions Reductions from Energy and Land-Use Policies.” Working Paper. Jakarta, Indonesia: World Resources Institute. Available online at www.wri.org/publication/how-can-indonesia-achieve-its-climate-goal.
Working Papers contain preliminary research, analysis,
findings, and recommendations. They are circulated to
stimulate timely discussion and critical feedback and
to influence ongoing debate on emerging issues. Most
working papers are eventually published in another form
and their content may be revised.

2 |
Indonesia’s Commitment to Climate ActionIndonesia is one of the world’s largest emitters of greenhouse gases (GHG). For the past two decades, GHG emissions have increased from almost all sectors, such as land-use (defined as land use, land-use change, and forestry, including peat fires), energy, agriculture, industry, and waste. Currently, the land-use sector dominates GHG emissions in Indonesia, but our analysis shows the energy sector’s share is projected to increase to over 50 percent of total emissions by 2026–2027.
The national government of Indonesia has committed to addressing climate change. In 2015, Indonesia joined a global wave of countries that submitted their post-2020 climate pledges to the United Nations Framework Convention on Climate Change (UNFCCC), known as intended nationally determined contributions (INDCs). Since then, it has signed and ratified the Paris Agreement, and later formally submitted its first nationally determined contribution (NDC) in 2016, reiterating its commitment to a low-carbon, climate-resilient future. The achievement of Indonesia’s mitigation targets—along with those of over 190 other countries—will determine whether the increase in global average temperature will be held below 2° Celsius, and limited even further to 1.5° Celsius above preindustrial levels, as proposed in the Paris Agreement.
In its NDC, Indonesia committed to
�� Reducing unconditionally GHG emissions by 29 percent against a 2030 business-as-usual (BAU) scenario and
�� Reducing GHG emissions by up to 41 percent below the 2030 BAU level, subject to international assistance for finance, technology transfer, and capacity building.
Indonesia’s NDC projects its 2030 BAU emissions to be approximately 2,869 MtCO2e.1, It targets 2030 emissions of 2,037 MtCO2e under the unconditional target and emissions as low as 1,693 MtCO2e under the conditional target. To achieve these goals, the government must identify and implement priority climate change abatement actions.
Box ES 1 | Modeling Climate Change Mitigation Scenarios
This working paper identifies and quantifies key national mitigation policies to allow Indonesia to select a strategy to deliver on its climate commitment. It provides practical information for policy-makers, business leaders, and civil-society organizations to understand mitigation options, assess opportunities, prioritize actions, and develop strategies for delivering Indonesia’s climate targets�
It is the first publicly available research to quantify the emissions abatement potential of different sectoral mitigation policies in Indonesia and relate them to Indonesia’s mitigation goals�
It analyses the potential emissions reduction contributions of policies that enforce existing measures and the additional mitigation potential if strengthened policies and actions are put in place� The analysis focuses on the carbon dioxide (CO2) emissions from the land-use and energy sectors, which account for over 80 percent of Indonesia’s greenhouse gas emissions�
Assessing the feasibility of implementing these policies, while important, is outside the scope of this analysis� Moreover, while the quantitative analysis described here provides an important benchmark against which to assess Indonesia’s efforts, it is important to note the inherent uncertainties involved in projecting future emissions� (Greenhouse Gas Protocol 2014) The Reference scenario and associated abatement potential analyzed in this paper represent plausible descriptions of future emissions given the set of assumptions and methodological choices outlined herein� They should not be read as predictions�
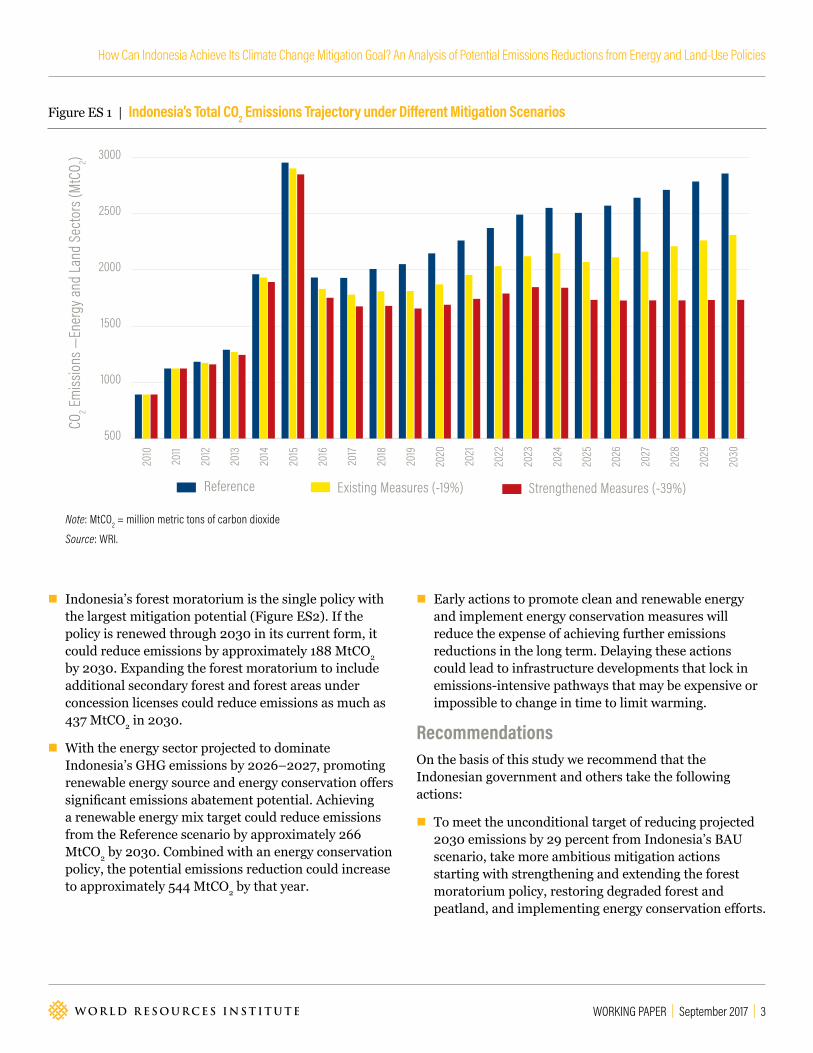
Key FindingsThe projected emissions from the land-use and energy sectors under three scenarios—Reference (baseline), Existing Measures, and Strengthened Measures—are shown in Figure ES1 and described below.
�� Existing policies in the land-use and energy sectors, even if fully implemented, will cut emissions by an estimated 547 MtCO2 against our Reference scenario, resulting in an emissions level of approximately 2,311 MtCO2 for the land-use and energy sectors alone, which is too high to meet the unconditional target of 2,037 MtCO2e (a 29 percent reduction over business as usual) set in Indonesia’s NDC.
�� Implementation of strengthened policies would reduce total emissions to approximately 1,733 MtCO2, thus surpassing the unconditional target of 29 percent. This highlights the importance of strengthening government efforts for achieving its climate action targets.
WORKING PAPER | September 2017 | 3
How Can Indonesia Achieve Its Climate Change Mitigation Goal? An Analysis of Potential Emissions Reductions from Energy and Land-Use Policies
Figure ES 1 | Indonesia’s Total CO2 Emissions Trajectory under Different Mitigation Scenarios
�� Indonesia’s forest moratorium is the single policy with the largest mitigation potential (Figure ES2). If the policy is renewed through 2030 in its current form, it could reduce emissions by approximately 188 MtCO2 by 2030. Expanding the forest moratorium to include additional secondary forest and forest areas under concession licenses could reduce emissions as much as 437 MtCO2 in 2030.
�� With the energy sector projected to dominate Indonesia’s GHG emissions by 2026–2027, promoting renewable energy source and energy conservation offers significant emissions abatement potential. Achieving a renewable energy mix target could reduce emissions from the Reference scenario by approximately 266 MtCO2 by 2030. Combined with an energy conservation policy, the potential emissions reduction could increase to approximately 544 MtCO2 by that year.
�� Early actions to promote clean and renewable energy and implement energy conservation measures will reduce the expense of achieving further emissions reductions in the long term. Delaying these actions could lead to infrastructure developments that lock in emissions-intensive pathways that may be expensive or impossible to change in time to limit warming.
RecommendationsOn the basis of this study we recommend that the Indonesian government and others take the following actions:
�� To meet the unconditional target of reducing projected 2030 emissions by 29 percent from Indonesia’s BAU scenario, take more ambitious mitigation actions starting with strengthening and extending the forest moratorium policy, restoring degraded forest and peatland, and implementing energy conservation efforts.
500
1000
1500
2000
2500
3000
Strengthened Measures (-39%)Existing Measures (-19%)Reference
2030
2029
2028
2027
2026
2025
2024
2023
2022
2021
2020
2019
2018
2017
2016
2015
2014
2013
2012
2011
2010
Note: MtCO2 = million metric tons of carbon dioxide
Source: WRI.
CO2 Em
ission
s —En
ergy
and
Land
Sec
tors
(MtC
O 2)

4 |
�� Give priority to full implementation of the key existing land-use and energy policies identified in this report. Current land-use policies include a forest moratorium, peatland restoration, land and forest restoration, and social forestry. Current energy policies include achieving renewable energy targets.
�� Extend the forest moratorium—the single policy with the largest mitigation potential. Renew the policy through 2030 in its current form, or expand it to include secondary forest and forest areas under concession licenses to reduce emissions even further.
�� Focus on renewable energy development as soon as possible to achieve the lowest cost path to emissions reductions and avoid locking in expensive fossil fuel power generation equipment. Promoting a renewable energy mix target will require multiple policy directions, including, for example, a carbon tax on fossil-fuel power
plants, replacing new development of coal power plants with clean and renewable energy sources (wind or solar), and providing subsidies and better feed-in tariffs for promoting renewable energy sources.
�� Implement a program of energy conservation to further reduce emissions from the use of energy.
�� Provide clarification on how international support could be provided to facilitate measures to reach the conditional target of 41 percent emissions reduction.
�� Conduct further research to assess the emissions savings of other land-use and energy policies (such as forest fires mitigation, sustainable peatland management, carbon tax), as well as policies in other sectors (e.g., agriculture, industrial processes, waste), which were not included in this study.
Figure ES 2 | Comparison of Projected CO2 Reductions from Different Policies in Land-Use and Energy Sectors under Existing and Strengthened Measures Scenarios, 2030
0 100 200 300 400 500 600
Energy
Land
Land
Energy
Stre
ngth
ened
Mea
sure
s Ex
istin
g Me
asur
es
Emissions Reductions (MtCO2)
Forest MoratoriumDegraded Forestland RehabilitationEnergy Conservation and Renewable EnergyPeat RestorationSocial Forestry Benefits on Degraded ForestlandRenewable Energy
Note: MtCO2 = million metric tons of carbon dioxide
Source: WRI.
WORKING PAPER | September 2017 | 5
How Can Indonesia Achieve Its Climate Change Mitigation Goal? An Analysis of Potential Emissions Reductions from Energy and Land-Use Policies
1. IntroductionIndonesia is the world’s fourth most populous country after China, India, and the United States. While Indonesia’s economy has grown steadily over the past 10 years at 5–6 percent annually (World Bank 2016), about 11 percent of its population still lives below the poverty line (Republic of Indonesia 2016). With its population projected to exceed 300 million by 2030, Indonesia’s government has committed to economic growth of at least 5 percent per year and reduction of the poverty rate to below 4 percent by 2025. The country is challenged to meet the increasing demand for energy, food security, and basic livelihoods, and at the same time achieve long-term, low-carbon energy development and climate change resilience (Republic of Indonesia 2015a).
The Government of Indonesia has committed to addressing the impact of climate change by setting emissions reduc-tion targets and implementing adaptation measures toward a low-carbon and climate resilient future. In 2010, it volun-tarily pledged to unconditionally reduce its greenhouse gas (GHG) emissions by 26 percent below a business-as-usual (BAU) scenario by 2020. In its nationally determined con-tribution (NDC) submitted to the United Nations Frame-work Convention on Climate Change (UNFCCC), Indonesia committed to reduce its GHG emissions by 29 percent below its BAU scenario by 2030 (10 years later) uncondi-tionally, and up to 41 percent conditionally; that is, subject to the availability of international support for finance, tech-nology transfer, and capacity building.
Indonesia now needs to devise a clear roadmap of mitigation activities with implementation schedules to ensure emissions reductions can meet the target dates. However, it is not clear whether the cumulative targets of Indonesia and other countries are sufficient to achieve the global climate target of stopping the planet from warming an additional 2° Celsius above preindustrial levels. And beyond these targets, the country may need to immediately and systematically explore abatement opportunities to lay the groundwork for more ambitious climate actions beyond 2030 aiming for 1.5° Celsius benchmark where possible.
Because Indonesia is a fast-growing developing country, some domestic and international stakeholders question whether it can accomplish its post-2020 climate target. For example, the government’s plan to double oil palm production by 2020 could compromise national climate action targets because most of the current 14 million hectares of oil palm plantations in Indonesia required
natural forest clearing, which increases carbon dioxide (CO2) emissions. This expansion plan also conflicts with the current moratorium on issuing new licenses to oil palm and mining concessions. In addition, the government plans to increase electricity supply to 35,000 megawatts (MW) by 2019 mostly from coal-fired power plants (BAPPENAS 2015a), which could conflict with its NDC commitment to reduce GHG emissions by 29 percent from BAU projections by 2030. Planning within the national policy framework needs to be harmonized and synergized for a mitigation plan to effectively achieve its abatement potential.
Opportunities to achieve both development and climate objectives should be explored in the next phase of development planning. For instance, instead of opening new land for agriculture, Indonesia could intensify productivity of its established agricultural land.
This paper provides information for policymakers, business leaders, and civil society organizations to understand mitigation options, assess opportunities, prioritize actions, and develop strategies for meeting Indonesia’s climate targets. This is the first publicly available study that quantifies the emissions abatement potential of different mitigation policies in Indonesia. It aims to support Indonesia’s evaluation of potential solutions to achieve its mitigation targets from the land-use and energy sectors by answering the following key questions:
�� To what extent would existing mitigation policies and targets in Indonesia’s land-use (defined as land use, land-use change, and forestry, including peat fires) and energy sectors contribute to the mitigation goals set in its NDC?
�� To what extent would strengthened policies and targets in the land-use and energy sectors contribute to the mitigation goals set in its NDC?
To answer these questions, the study quantified the mitigation potential of a set of existing policies plus a set of additional policies, and presents three emissions pathways through 2030: Reference scenario, Existing Measures scenario, and Strengthened Measures scenario.
Our analysis focuses on CO2 emissions from land-use and energy sectors, which contributed more than 80 percent of Indonesia’s national GHG emissions profile in 2012 (Republic of Indonesia 2015b). By 2030, nearly 90 percent of Indonesia’s GHG emissions are projected to come from the land-use (37 percent) and energy (50 percent) sectors (BAPPENAS 2015b). Their current contributions are shown in Figure 1.
6 |
The next chapter provides background on Indonesia’s GHG emissions profile and trends. Chapter 3 introduces mitigation policies and actions. Chapter 4 presents the modeling results and methodology used to quantify the selected mitigation policies in the land-use and energy sectors. Chapter 5 discusses the results and limitations of this analysis, and Chapter 6 provides conclusions and recommendations.
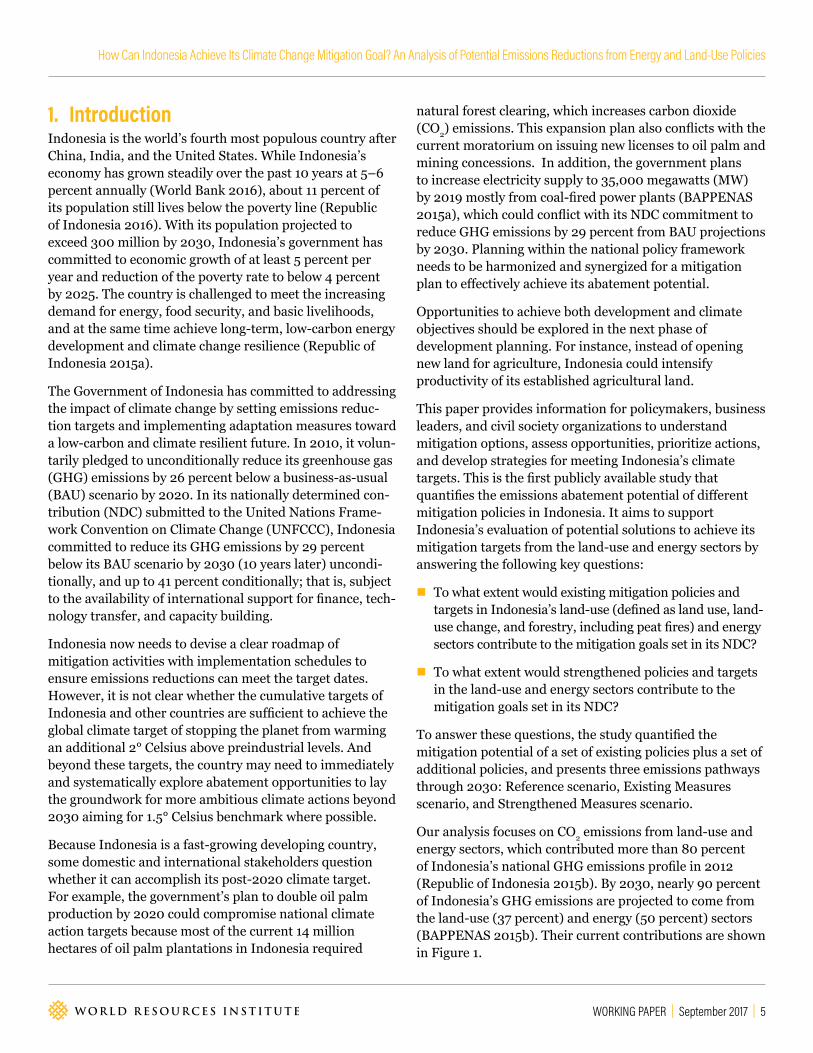
2. GHG Profile and Trends in IndonesiaIndonesia is the world’s sixth largest emitter of greenhouse gases and the largest contributor of forest-based emissions (World Resources Institute 2015). According to Indonesia’s First Biennial Update Report submitted to the UNFCCC in 2016 (Table 1), its total GHG emissions in 2012 were estimated at 1,454 million metric tons of carbon dioxide equivalent (MtCO2e) for the three main greenhouse gases: carbon dioxide (CO2), methane (CH4), and nitrogen dioxide (N2O). The main contributors are land-use change and peat fires, representing about 48 percent of the total GHG emissions, followed by the energy sector at about 35 percent.
Figure 1 | Percentages of Total GHG Emissions from CO2 Emitted by Land-Use and Energy Sectors in Indonesia, 2012
48% LULUCF (incl. peat fires)
33% Energy (CO2)
2% Energy (non-CO2)3% IPPU
8% Agriculture
6% Waste
Notes: LULUCF =Land use, land-use change, and forestry; IPPU=industrial processes and product use. Solid colors show sectors and gases covered in the analysis. Patterned colors show sectors and gases not covered in the analysis.
Source: Republic of Indonesia 2015b.

WORKING PAPER | September 2017 | 7
How Can Indonesia Achieve Its Climate Change Mitigation Goal? An Analysis of Potential Emissions Reductions from Energy and Land-Use Policies
Table 1 | Indonesian Emissions by Sector and Greenhouse Gas, 2012
Notes: MtCO2e = million metric tons of carbon dioxide equivalent; n/a = not applicable�Source: Republic of Indonesia 2015b�
Figure 2 | Indonesia’s Greenhouse Gas Emissions by Sector, 2000–2012
From 2000 to 2012, GHG emissions increased from almost all sectors (Figure 2). Emissions from energy increased by 70 percent, waste by 60 percent, and agriculture by 17 percent. Note that the high fluctuation in land-use sector emissions, especially those associated with peat fires, caused total GHG emissions to vary significantly from
year to year. The energy sector’s emissions increased at an average annual rate of 4.5 percent, faster than land-based emissions, which increased at 2.7 percent. On average, the land-use sector contributed 50 percent and the energy sector contributed 32 percent of Indonesia’s average emissions during 2000–2012.
0
200
400
600
800
1000
1200
1400
1600
1800Peat fires
LULUCF
Waste
Agriculture
IPPU
Energy
2012201120102009200820072006200520042003200220012000
Emiss
ions (
MtCO
2e)
Notes: LULUCF = Land use, land-use change, and forestry; IPPU = industrial processes and product use; MtCO2e = million metric tons of carbon dioxide equivalent.Source: Republic of Indonesia 2015b.
SECTOR
GREENHOUSE GAS
EMISSIONS (MtCO2e) PERCENT OF TOTAL EMISSIONS
CO2 CH4 N2O TOTAL CO2 CH4 N2O TOTAL
Energy 477�8 25�2 5�1 508�1 32�9 1�7 0�4 34�9
Industrial processes and product use 40�5 0�1 0�4 41�0 2�8 0�0 0�0 2�8
Agriculture 6�6 55�6 50�5 112�7 0�5 3�8 3�5 7�8
Land use, land-use change, and forestry (including peat fires) 695�0 n/a n/a 695�0 47�8 - - 47�8
Waste 2�2 91�9 3�0 97�1 0�2 6�3 0�2 6�7
Total 1,222�2 172�8 59�0 1,454�0 84�1 11�9 4�1 100�0

8 |
3. Mitigation Policies and Actions in Indonesia
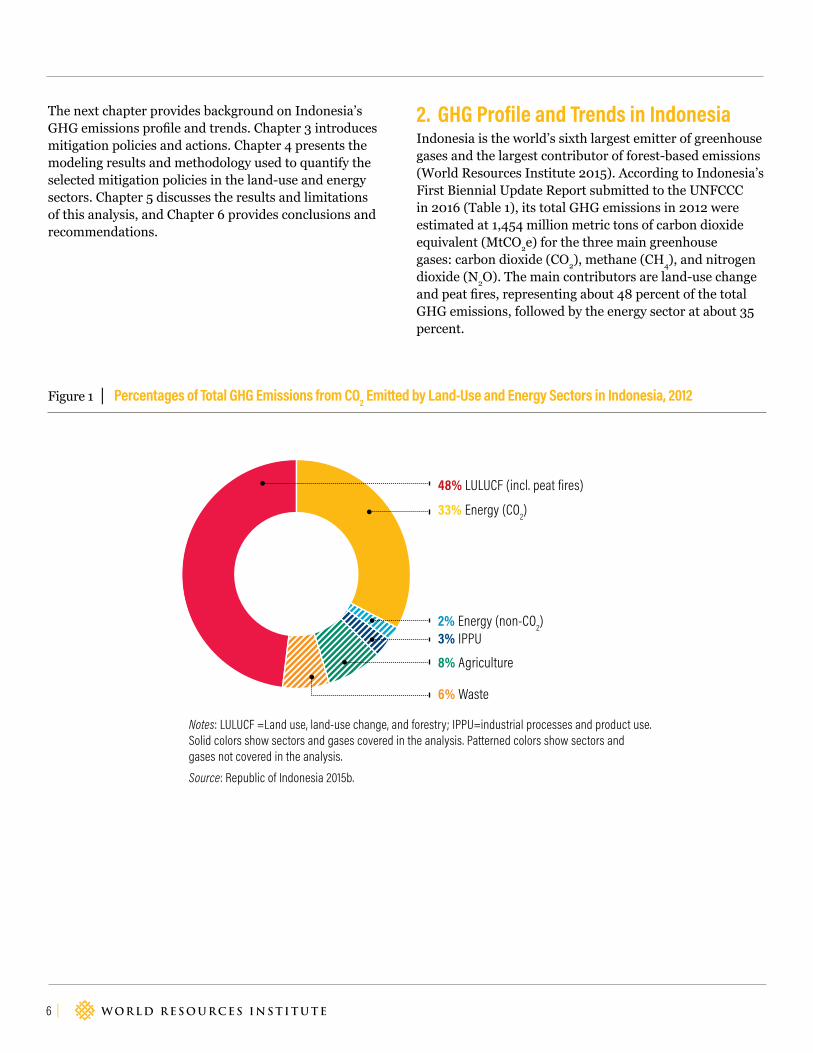
Indonesia has enacted policies and programs to combat climate change by committing to reduction goals, setting domestic sectoral targets, and passing legislation and regulations. This chapter presents an overview of climate and energy policies in Indonesia, including the key authorities and major policy developments (Figure 3).
3.1. National Emissions Reduction GoalAt the 2009 Group of 20 (G20) Summit, President Susilo Bambang Yudhoyono announced Indonesia’s voluntary goal of reducing its GHG emissions from between 26 percent and 41 percent (with international support) by 2020 compared to a business-as-usual (BAU) scenario. In 2011, that target was submitted as the Government of Indonesia’s nationally appropriate mitigation action (NAMA) to the UNFCCC. Indonesia later adopted Presidential Regulation (PERPRES) No.61/2011 on its National Action Plan to Reduce Greenhouse Gas Emissions (Rencana Aksi Nasional Penurunan Gas Rumah Kaca; RAN-GRK) fully committing it to achieve its mitigation goals (President of the Republic of Indonesia 2011).
In 2015, Indonesia submitted its intended nationally determined contribution (INDC) to the UNFCCC (Republic of Indonesia 2015a), in which it outlined a plan to unconditionally reduce 29 percent of its GHG emissions by 2030 relative to the 2030 BAU projection of 2.88 gigatons of carbon dioxide equivalent (GtCO2e; 1 gigaton [Gt] = 1,000 million metric tons [MtCO2e])2, or up to 41 percent if international support for finance, technology transfer and development and capacity building was made available. The INDC submission was prepared by the Ministry of National Development Planning (BAPPENAS). Subsequently, the Government of Indonesia signed and ratified the 2015 Paris Agreement in November 2016, and restated the target in its nationally determined contribution (NDC) submission. The NDC submission also updated the BAU scenario3 to 2.87 GtCO2e in 2030. This study uses the updated BAU scenario from the NDC submission when referring to the official Indonesian scenarios and targets. A new administration shifted its UNFCCC national focal point to the Ministry of Environment and Forestry (MoEF), which now coordinates preparation and submission of NDCs and related national reports.
3.2. National Policies and Sectoral TargetsRecent legislation, decrees, and government regulations relevant to achieving climate commitment and sectoral targets are listed and explained in this section.
�� Presidential Regulation of the Republic of Indonesia No. 61 Year 2011 on The National Action Plan for Greenhouse Gas Emissions Reductions (Rencana Aksi Nasional Penurunan Emisi Gas Rumah Kaca; RAN-GRK)
The National Action Plan for Reducing Greenhouse Gas Emissions established the national emissions reduction target of 26 percent below BAU by 2020, with a further reduction of up to 41 percent below BAU with adequate international support (President of the Republic of Indonesia 2011). The RAN-GRK provides the basis for the implementation of various mitigation actions in the forestry, agriculture, energy, transport, industry, and waste sectors. It reshapes Indonesia’s commitments in its INDC and NDC submissions.
�� National Medium-Term Development Plan (Rencana Pembangunan Jangka Menengah Nasional; RPJMN)
The National Medium-Term Development Plan for 2015–2019 (RPJMN 2015-2019) established GHG emissions reduction for five priority sectors (forestry and peat lands, agriculture, energy and transportation, industry, and waste) to achieve the 2020 target in line with the National Action Plan for Greenhouse Gas Emissions Reduction (RAN-GRK) (BAPPENAS 2014).
RPJMN sets two targets for the forestry sector: land and forest restoration targets and social forestry targets. Areas of degraded land are designated as forest management areas (kesatuan pengelolaan hutan; KPH) or watershed areas (daerah aliran sungai; DAS) with yearly restoration expected to reach 5.5 million hectares by 2019. Additional targets will be implemented through the private sector using ecosystem restoration permits.
Indonesia’s Social Forestry Program, part of the five-year development plan (2015–2019), targets allocating 12.7 million hectares of legal forest estates (government-regulated forest areas) to be managed by local communities as community forests (hutan kemasyarakatan), village forests (hutan desa), community plantations (hutan tanaman rakyat), or customary and partnership forests (hutan adat).
WORKING PAPER | September 2017 | 9
How Can Indonesia Achieve Its Climate Change Mitigation Goal? An Analysis of Potential Emissions Reductions from Energy and Land-Use Policies
While social forestry was mainly designed to provide local communities with access to natural resources and enable people-centered development to support sustainable forest management, it has untapped potential for restoration opportunities because it can produce a significant forest carbon stock to act as a carbon sink.
�� Presidential Decree No. 16 Year 2015 on Ministry of Environment and Forestry
In 2008, under Presidential Decree 46/2000, Indonesia established the National Council on Climate Change (Dewan Nasional Perubahan Iklim; DNPI) to oversee climate mitigation and adaptation policies. In 2010, a task force was formed to coordinate activities on Reducing Emissions from Deforestation and Forest Degradation
(REDD+). In 2013, Presidential Regulation No. 23/20134
established the REDD+ Agency (BP REDD+), which is responsible for reduction of greenhouse gas emissions from deforestation and forest and peatland degradation.
In late 2014, MoEF was established, merging the former Ministry of Environment and Ministry of Forestry, into a single authority. Previously, the Ministry of Environment was responsible for environmental policy, establishing standards, and supervising subnational authorities in policy implementation, while the Ministry of Forestry dealt with forest management issues and led the initial REDD+ processes with support from the REDD+ Agency.
Under Presidential Decree No.16/2015 on MoEF, the National Council of Climate Change (Dewan Nasional
Inter
natio
nal p
ledge
sDo
mes
tic ta
rgets
Natio
nal p
olicie
s and
plan
s
Unconditional 29% emissions reduction from BAUConditional 41% emissions reduction from BAU
Land and Forest Restoration Target: Restore 5.5 Mha of degraded land by 2019
Peat Restoration Target : Restore 2 Mha of peatlands in priority provincesSocial Forestry Target: Government -regulated forests area of about 12.7 Mha to be managed by local communities
Renewable Energy Target: 23% share of Renewable energy within national energy mix Energy Conservation Target: National target of energy intensity 1% decrease per year until 2025, and 21% energy conserved by 2030 from 7% in 2015
Presidential Regulation No. 1 Year 2016 on Peat Restoration Agency
Presidential Instruction No. 6 Year 2017 on the Extension of Forest Moratorium Policy
The Electricity Supply Business Plan (RUPTL )
Government Regulation No. 79 Year 2014 on National Energy Policy
Medium Term National Development Plan (RPJMN)
Presidential Regulation of the Republic of Indonesia No. 61 Year 2011 on The National Action Plan for Greenhouse Gas Emissions Reductions ( RAN -GRK )
Unconditional 26% emissions reduction from BAUConditional 41% emissions reduction from BAU
2009 2010 2011 2012 2013 2014 2015 2016 2017 2018 2019 2020 2025 2030 2050
By 2020 [2009-2020]
By 2030 [2015-2030]
By 2019 [2015-2019]
By 2020 [2016-2020]
By 2025 [2015-2025]
2009 2010 2011 2012 2013 2014 2015 2016 2017 2018 2019 2020 2025 2030 2050
Figure 3 | Indonesia’s Climate Change Mitigation Framework: International Pledges, Domestic Targets, and National Policies
Source: WRI�

10 |
Perubahan Iklim; DNPI) and the National REDD+ Agency were incorporated under the Directorate General of Climate Change within the MoEF (President of the Republic of Indonesia 2015a).
�� Presidential Instruction No. 6 Year 2017 on Forest Moratorium
Indonesia’s 2011 national forest moratorium is a regulation that prohibits clearing primary forests and peatlands inside forest estates and in other land-use areas. The legal basis of the current forest moratorium policy is Presidential Instruction No. 6 Year 2017 (a continuation of Presidential Instructions No. 10 Year 2011, No. 6 Year 2013, and No. 8 Year 2015) (President of the Republic of Indonesia 2015b), that extends the moratorium until 2019 (President of the Republic of Indonesia 2017). It was followed by the Government Regulation No. 57/2016 in December 2016 regarding peatlands ecosystem management, which halts the issuance of new licenses on peatlands permanently. However, the regulation does not cover intact primary forests.
If implemented effectively, the forest moratorium policy could protect an area almost twice the size of Japan. It has the potential to significantly reduce deforestation in Indonesia, which totaled over 6 million hectares from 2000 to 2012. Indonesia also lost 0.84 million hectares of forest cover in 2012 alone, higher than Brazil’s reported forest loss of 0.46 million hectares that year (Margono et al. 2014). However, several areas are exempted from the forest moratorium policy, including existing concessions with permits from MoEF.
�� Presidential Regulation No. 1 Year 2016 on Peat Restoration Agency
The Peat Restoration Agency (Badan Restorasi Gambut; BRG) is tasked with restoring 2.1 million hectares of peatlands by 2020 in seven priority provinces (Riau, Jambi, South Sumatra [Sumsel], West Kalimantan [Kalbar], Central Kalimantan [Kalteng], South Kalimantan [Kalsel], and Papua), out of the total 12.9 million hectares of peatlands mapped by the agency (President of the Republic of Indonesia 2016). The BRG estimated that more than 6.7 million hectares of peatlands are degraded
GHG
Emiss
ions (
MtCO
2e)
0
500
1000
1500
2000
2500
3000
3500
20352030202520202015201020052000
Historical Emissions
Business as Usual
Emission with Unconditional Reduction (-29%)Emission with Unconditional Reduction (-41%)
Notes: Business-as-usual (BAU) projection from Indonesia’s First Nationally Determined Contribution submitted to the UNFCCC in 2016; Emissions with Unconditional Target and Emissions with Conditional Target are author calculations based on the 29% and 41% reductions from the BAU scenario in 2030. MtCO2e = million metric tons of carbon dioxide equivalent.
Sources: BAPPENAS 2015b; Republic of Indonesia 2016; WRI.
Figure 4 | Indonesia’s 2030 GHG Mitigation Targets
WORKING PAPER | September 2017 | 11
How Can Indonesia Achieve Its Climate Change Mitigation Goal? An Analysis of Potential Emissions Reductions from Energy and Land-Use Policies
and have the potential to be restored, whereas 6.2 million hectares of intact peatlands must be protected and conserved. The BRG’s priority is to restore peatlands burned in 2015, the high-carbon-stock peat dome areas, and peatlands with canals (President of the Republic of Indonesia 2016). In 2016–2017, the agency aims to restore up to 0,64 million hectares of peatland across the priority provinces (Figure 5).
Government Regulation No.79 Year 2014 on National Energy Policy
The National Energy Policy (President of the Republic of Indonesia 2014) provides the guidance for the development and transformation of Indonesia’s energy sector to meet the increasing demand from economic and population growth. The policy features:
� Promoting development of renewable energy, with a target of producing at least 23 percent of its energy mix from renewable energy by 2025 and at least 31 percent in 2050.
� Increasing energy security by moving away from oil, by targeting less than 25 percent oil in its energy mix, targeting the use of coal to 30 percent and natural gas to 22 percent in the energy mix by 2025. By 2050, the policy calls for a minimum of 20 percent crude oil, 25 percent coal, and 24 percent natural gas in the total energy mix.
�� The Electricity Supply Business Plan (Rencana Usaha Penyediaan Tenaga Listrik; RUPTL) from PT PLN (Persero)
PT PLN (Persero), a major electricity provider in Indonesia, is obliged to develop its business plan with reference to Indonesia’s National Energy Policy. The Electricity Supply Business Plan by Indonesia’s State Electricity Corporation 2016–2025 or RUPTL 2016–2025 (PT PLN 2015), targets adding 80.5 GW, to the country’s grid by 2025. Coal power plants will dominate with the addition of 34 GW composing 42 percent of the total additional capacity. Natural gas—coal hybrid power plants will add 13 GW, or 16 percent, while renewable-based power plants are expected to contribute 26 percent. RUPTL is a derivative plan to the National Energy Policy and National General Energy Plan in which renewable-based power plants are expected to contribute 23 percent of the power in 2025.
4. Quantifying Key Mitigation OptionsThe mitigation potentials of a selected package of climate change mitigation policies are assessed in this chapter (Table 2). These policies are current laws, presidential instructions, or government regulations. The analysis is limited to policies that are or could be implemented nationwide, and are designed to mitigate GHG emissions. Based on the list of policies described in section 3.2 as well as data availability, we selected for in-depth analysis four policies in the land-use sector and two policies in the energy sector. The mitigation potential of the selected policies was evaluated under two scenarios:
�� Existing Measures: policies that are currently being implemented through government or ministerial regulations; and
�� Strengthened Measures:measures that extend (in time or scope), revise, or enhance existing policies.
We estimated the emissions reductions under each scenario based on mitigation potentials in published studies then compared these estimated reductions against a Reference scenario. This chapter presents the assumptions and methodologies for constructing the Reference scenario for the Land-Use and Energy sectors and calculating the mitigation potential of the Existing Measures and Strengthened Measures scenarios. Results are discussed in Chapter 5.
In assessing the mitigation impact from the selected policies, we assumed that all policies are fully implemented during the time frame examined. The feasibility assessment and valuation of challenges of policy implementation, while important, are outside the scope of this analysis.
We included only the policy options identified by the government and did not put forward a full menu of other policy options for land use and energy or use policies from such as waste and agriculture, which will be a focus of future work.
A prior set of baseline and mitigation scenarios was developed by the Government of Indonesia to support its NDC estimate of business as usual emissions and target conditional and unconditional emissions reductions. These estimates are described in Box 1, but were not fully used in this study.

12 |
Peatland mapping
1Post-2015 peat fires
2Peat dome with canal
3Peat dome without canal
4Peatland with canal
The targeted peatland is divided into 4 classifications and spreadacross 3 islands and 7 provinces
0
500,000
1,000,000
1,500,000
2,000,000
2,500,000
3,000,000
Riau Jambi Sumsel Kalbar Kalsel Kalteng Papua
Hect
ares
Riau
Jambi
SouthSumatera
WestKalimantan
CentralKalimantan South
Kalimantan
Papua
Existing condition :Degraded peatland, potential for restoration: 6,757,997 haIntact peatland, potential for protection: 6,174,492 ha
Restoration Restoration priority for 7 provinces by 2020: 2,103,327 haDegraded peat area potentially for intervention by other institutions outside of BRG : 4,654,670 ha
Source: Peat Restoration Agency of Indonesia
Total: ~12.9 Mha
Figure 5 | Peatland Restoration Plan

WORKING PAPER | September 2017 | 13
How Can Indonesia Achieve Its Climate Change Mitigation Goal? An Analysis of Potential Emissions Reductions from Energy and Land-Use Policies
Table 2 | Assumptions for Land–Use and Energy Sector Policy Options under Two Scenariosa
POLICY OPTIONSCENARIO
EXISTING MEASURES STRENGTHENED MEASURES
Land-Use
Forest moratoriumNo clearing and conversion of primary forest and peatlands
Potential carbon removal is 188 MtCO2e/year
Forest moratorium is extended to include secondary forest, and revokes existing licenses on oil palm, timber plantations, and mining concessions
Potential carbon removal is 437 MtCO2e/year
Peatland restoration 2�1 million ha restored by 2020b
Potential carbon removal is 11 tCO2e/ha/yearAdditional 4�6 million ha restored by 2030b
Potential carbon removal is 11 tCO2e/ha/year
Land and forest restoration targets
5�5 million ha restored by 2019 (2015–2019)
Potential carbon removal is 2�5 tCO2e/ha/year
5�5 million ha restored by 2019 (2015–2019)
Potential carbon removal is 2�5 tCO2e/ha/year
Social forestry target2�2 million hac restored by 2030 (2016–2030)
Potential carbon removal is 2�5 tCO2e/ha/year
2�2 million hac restored by 2030 (2016–2030)
Potential carbon removal is 2�5 tCO2e/ha/year
Energy
Renewable energy target
Follow the energy mix target in National Energy Plan with 23% share of renewable energy in energy mix by 2025 and follow the linear trajectory during 2025–30 for reaching 31% in 2050
Follow the energy mix target in National Energy Plan with 23% share of renewable energy in energy mix by 2025 and follow the linear trajectory during 2025–2030 for reaching 31% in 2050
Energy conservation n/a
50�9 million metric tons of oil equivalent energy savings potential in 2025, and follow the linear trajectory during 2025–2030 with 395�6 million metric tons of oil equivalent energy savings potential in 2050
Notes: a� The Reference scenario assumes the absence of any of the mitigation options mentioned here�b� Based on data from the Peat Restoration Agency 2016�c� Based on GIS analysis�MtCO2e/year = million metric tons of carbon dioxide per year; ha = hectare; tCO2e/ha/year = metric tons of carbon dioxide per hectare per year� n/a = not applicableSource: WRI�

14 |
Box 1 | Government of Indonesia’s Business-as-Usual (BAU) and Mitigation Scenarios
Indonesia’s emissions reduction targets of 29 percent (unconditional) and up to 41 percent (conditional) are measured against its baseline, BAU scenario through the year 2030� BAU is defined as the emissions scenario with no consideration of mitigation policies in Indonesia’s nationally determined contribution (NDC) submission� It would result in emissions of 2�87 GtCO2e in the year 2030, based on a recent assessment by the Ministry of Environment and Forestry (MoEF)� Indonesia’s NDC also proposed two mitigation scenarios: the Counter Measure 1 Scenario (CM1), and the Counter Measure 2 Scenario (CM2), or conditional scenario� The CM1 scenario will reduce emissions by 29 percent from the BAU scenario in 2030, while the CM2 scenario will reduce emissions by 38 percent, short of the 41 percent conditional target (Table B1)�
Table B1. | Projected Business-as-Usual and Mitigation Scenarios in Indonesia’s NDC
SECTOR GHG EMISSIONS LEVEL 2010A
GHG EMISSIONS LEVEL 2030 GHG EMISSIONS REDUCTION
MtCO2e MtCO2e PERCENT OF TOTAL BAU
MtCO2e BAU CM1 CM2 CM1 CM2 CM1 CM2Energya 453�2 1,669 1,355 1,271 314 398 11 14Waste 88 296 285 270 11 26 0�38 1IPPU 36 69�6 66�85 66�35 2�75 3�25 0�10 0�11Agriculture 110�5 119�66 110�39 115�86 9 4 0�32 0�13Forestryb 647 714 217 64 497 650 17�20 23TOTAL 1,334 2,869 2,034 1,787 834 1,081 29 38
Notes: BAU = business as usual scenario; CM1 = Counter Measure 1 (unconditional mitigation scenario); CM2 = Counter Measure 2 (conditional mitigation scenario); IPPU = industrial processes and product use; MtCO2e = million metric tons of carbon dioxide equivalent�a� Including fugitive emissions� b� Including peat fires�Source: Republic of Indonesia 2016�
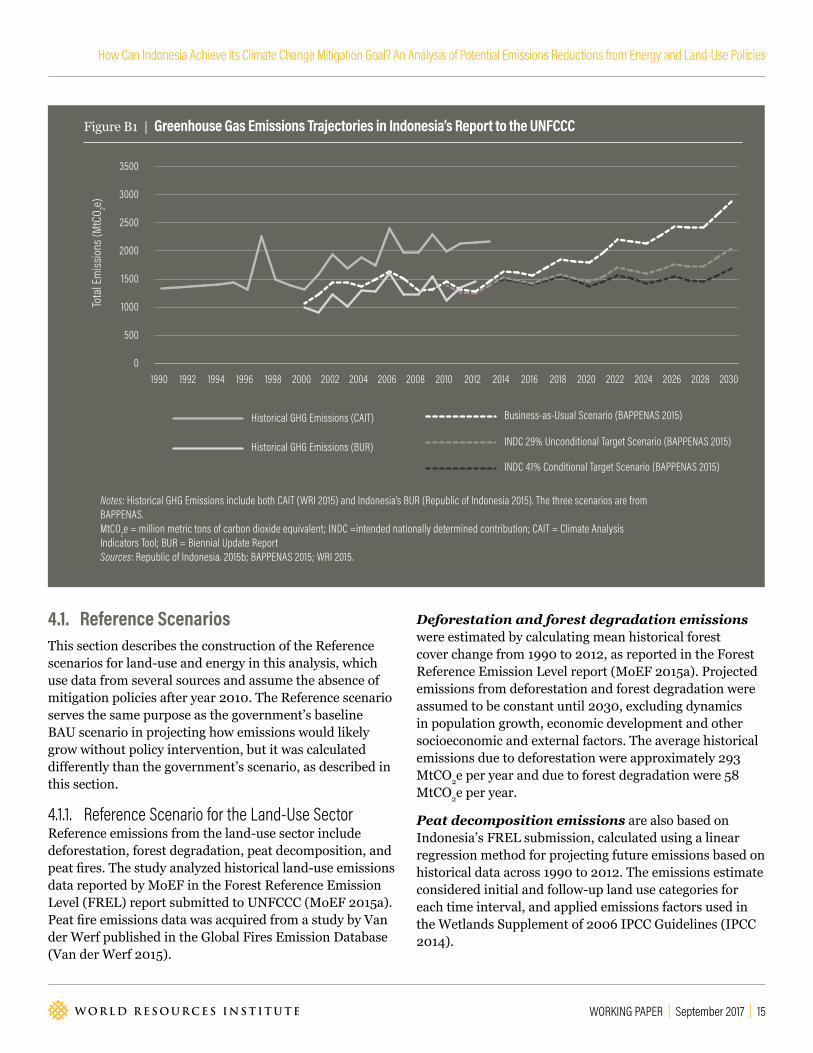
These scenarios are based on a collection of emissions reduction targets across sectors that were calculated independently by each responsible line ministry (Figure B1; BAPPENAS 2015b)� They show the results of existing policies, both for climate change mitigation and for other purposes, and the targets are assessed independently for each development sector (forestry, agriculture, energy and transportation, industry, and waste)� The NDC document includes some mitigation activities in each sector but does not clearly explain how each sector’s target was calculated or how much emission is reduced from each activity� For example, it is unclear how emissions projections from the forestry sector accounted for forest and peat fires emissions, or whether seasonal extreme events, such as El Niño, are included in the equation�
Due to the lack of clarity regarding the methodology used to calculate the NDC numbers mentioned above, the government’s BAU was not used in our study� Instead, we offer an alternative, independent analysis with specific focus on evaluating Indonesia’s land and energy mitigation policies identified in Chapter 3� In this paper, we use “business-as-usual” or “BAU” when referring to the official baseline and“Reference scenario” when referring to the baseline constructed independently in this paper to differentiate the two baseline scenarios� The word “baseline” refers to a baseline in general or one other than these two emissions baseline scenarios�
WORKING PAPER | September 2017 | 15
How Can Indonesia Achieve Its Climate Change Mitigation Goal? An Analysis of Potential Emissions Reductions from Energy and Land-Use Policies
Figure B1 | Greenhouse Gas Emissions Trajectories in Indonesia’s Report to the UNFCCC
4.1. Reference ScenariosThis section describes the construction of the Reference scenarios for land-use and energy in this analysis, which use data from several sources and assume the absence of mitigation policies after year 2010. The Reference scenario serves the same purpose as the government’s baseline BAU scenario in projecting how emissions would likely grow without policy intervention, but it was calculated differently than the government’s scenario, as described in this section.
4�1�1� Reference Scenario for the Land-Use SectorReference emissions from the land-use sector include deforestation, forest degradation, peat decomposition, and peat fires. The study analyzed historical land-use emissions data reported by MoEF in the Forest Reference Emission Level (FREL) report submitted to UNFCCC (MoEF 2015a). Peat fire emissions data was acquired from a study by Van der Werf published in the Global Fires Emission Database (Van der Werf 2015).
Deforestation and forest degradation emissions were estimated by calculating mean historical forest cover change from 1990 to 2012, as reported in the Forest Reference Emission Level report (MoEF 2015a). Projected emissions from deforestation and forest degradation were assumed to be constant until 2030, excluding dynamics in population growth, economic development and other socioeconomic and external factors. The average historical emissions due to deforestation were approximately 293 MtCO2e per year and due to forest degradation were 58 MtCO2e per year.
Peat decomposition emissions are also based on Indonesia’s FREL submission, calculated using a linear regression method for projecting future emissions based on historical data across 1990 to 2012. The emissions estimate considered initial and follow-up land use categories for each time interval, and applied emissions factors used in the Wetlands Supplement of 2006 IPCC Guidelines (IPCC 2014).
0
500
1000
1500
2000
2500
3000
3500
INDC 41% Conditional Target Scenario (BAPPENAS 2015)
INDC 29% Unconditional Target Scenario (BAPPENAS 2015)
Business-as-Usual Scenario (BAPPENAS 2015)
Historical GHG Emissions (BUR)
Historical GHG Emissions (CAIT)
203020282026202420222020201820162014201220102008200620042002200019981996199419921990
Tota
l Em
issio
ns (M
tCO 2e)
Notes: Historical GHG Emissions include both CAIT (WRI 2015) and Indonesia’s BUR (Republic of Indonesia 2015). The three scenarios are from BAPPENAS. MtCO2e = million metric tons of carbon dioxide equivalent; INDC =intended nationally determined contribution; CAIT = Climate Analysis Indicators Tool; BUR = Biennial Update ReportSources: Republic of Indonesia. 2015b; BAPPENAS 2015; WRI 2015.

16 |
Figure 6 | Projected Land-Use Sector CO2 Emissions for the Reference Scenario 2016-2030.
Figure 7 | Projected Energy Sector CO2 Emissions for the Reference Scenario, 2016-2030
0
5000
1000
1500
2000
2500Peat Fires
Peat Decomposition
Forest Degradation
Deforestation
203020292028202720262025202420232022202120202019201820172016201520142013201220112010
Land
Sec
tor B
aseli
ne Em
ission
s (Mt
CO2)
Notes: MtCO2 = million metric tons of carbon dioxide
Source: WRI.
0
300
600
900
1200
1500
Power Plant
Others
Commercial
Industry
Transportation
Household
203020292028202720262025202420232022202120202019201820172016201520142013201220112010
Baseline used inthis analysis
Ener
gy Se
ctor B
aseli
ne Em
ission
s (Mt
CO2)
Notes: MtCO2 = million metric tons of carbon dioxide
Sources: Ministry of Energy and Mineral Resources 2016; WRI.
WORKING PAPER | September 2017 | 17
How Can Indonesia Achieve Its Climate Change Mitigation Goal? An Analysis of Potential Emissions Reductions from Energy and Land-Use Policies
Peat fires emissions used the data from Van der Werf (2015), which measured fluxes from satellite data and validated by in-situ measurements during 1997 to 2015. For projections, a nine-year moving average was used to smooth out uncertainties involved with forest fires.
The estimated Reference scenario emissions for the land-use sector in this analysis is 1,342 MtCO2e in 2030—much higher than Indonesia’s NDC projection (see Box 1), which is 714 MtCO2e because the NDC BAU scenario considers emissions from unplanned and planned deforestation, and peat fires prior to the 2015 El Niño drought season. In contrast, this study includes forest degradation, peat decomposition, and peat fires (including 2015 extreme fires event), all significant contributors of emissions that were left out of the NDC calculation. Different estimates for peat fires are available across Indonesia, and we used a conservative estimate from Van der Werf’s study (2015)to limit the large difference between the baselines of this analysis and of the NDC analysis. This projection is shown in Figure 6.
4�1�2� Reference Scenario for the Energy SectorThis study adopted the baseline for the energy sector provided by Ministry of Energy and Mineral Resources (ESDM) for 2012–2025. For simplicity and consistency with the mitigation scenario building in the following sections, a linear regression to the ESDM data was performed, and the trend was extended between 2010 and 2030. The projected emissions under our baseline (Reference scenario) are 1,516 MtCO2by 2030 (Figure 7). The NDC baseline (BAU scenario) for the energy sector is approximately 10 percent higher, at 1,669 MtCO2e in 2030. Inclusion of CH4 and N2O in the NDC number may account for some of the difference.
4.2. Land-Use Sector PoliciesIndonesia has the world’s third largest tropical forest after the Amazon and Congo Basin rain forests, and has one of the world’s highest rates of deforestation and forest degradation. Land-use activities are the primary drivers of greenhouse gas emissions in Indonesia in recent decades, making up at least 62 percent of total emissions (Republic of Indonesia 2016).
Land-use sector policies included in the two mitigation scenarios are the forest moratorium policy, the peat restoration, land and forests restoration, and social forestry targets. How these policies are applied to the Existing and Strengthened Measures Scenarios is described below.
4�2�1� Forest MoratoriumMoEF updates an “indicative moratorium map” every six months. In December 2015, the 9th version of the map (MoEF 2015b) showed 65.1 million hectares of protected primary forest and peatland, compared with the approximately 128.4 million hectares of total forestland in 2013 (MoEF 2015c). See Figure 8 for types of land use inside and outside the protected area.
EXISTING MEASURES SCENARIO
The Existing Measures Scenario assumes continued implementation of the forest moratorium policy in its current form through 2030 with no additional issuance of concession licenses on primary forest and peatlands. Previous research (Busch et al. 2015) estimated that the moratorium would have reduced emissions by up to 545 MtCO2e over the decade if it had been in place from 2000 to 2010. The Busch et al. analysis was based on an assessment of the incremental increase in permitted area each year, and the cumulative reduction in the amount of deforestation and GHG emissions due to the policy. We extended their estimate to cover the period of the actual moratorium, which began in 2012, and estimated its impacts through 2030. We estimated that the current moratorium could reduce emissions by up to 188 MtCO2e each year by 2030 (Figure 9).
STRENGTHENED MEASURES SCENARIO
The current moratorium’s effectiveness in reducing emissions is limited because it does not cover secondary forests or ongoing deforestation within existing permits for forest conversion. Secondary forests cover an additional 33.1 million hectares (Figure 8) and hold carbon stocks equivalent to 30 GtCO2e (Austin, Stolle, and Sheppard 2012). The Strengthened Measures Scenario assumes extension of the moratorium to include additional secondary forests and removes exemptions for existing licenses beginning in 2016. Based on Busch et al., the moratorium policy would have reduced emissions by up to 1,268 MtCO2e over the decade, if it had been in place from 2000 to 2010 (Busch, et al. 2015). Based on these results, we estimated that strengthening the moratorium could reduce emissions by up to 437 MtCO2e per year by 2030 (Figure 9).

18 |
Figure 8 | Types and Amounts of Forest Area Inside and Outside Indonesia’s Moratorium
Figure 9 | Projected Annual Emissions Reductions under Current and Extended Forest Moratorium Policies, 2010–2030
4�2�2� Peatland Restoration TargetIndonesia possesses the world’s largest area of tropical peatlands, covering 14.6 million hectares (MoEF 2015b). These peatlands are under serious threat because they are being converted to oil palm concessions, pulp and paper plantations, and other commercial uses (Wijaya et al. 2015). When peatlands are drained to be converted, the peat decomposes and releases carbon dioxide into the atmosphere. Additionally, drained and dried out peat
is prone to fires, which are more likely in the dry season and result in even more carbon dioxide emissions. One study estimated that peat fires accounted for 23 percent of Indonesia’s total emissions in 2010 (BAPPENAS 2015c). In 2015, an official report stated that a huge forest fire emitted 0.8–1.1 GtCO2e (MoEF 2015d), or two times Indonesia’s entire energy-based emissions in 2010. In this light, efforts to prevent forest and peat fires through restoration and sustainable peat management are key mitigation actions for Indonesia.
0
20
40
60
80
100
120
Outside MoratoriumInside Moratorium
Note: Mha = million hectaresSource: Austin, Stolle, and Sheppard 2012.
Area
(Mha
)
33.115.6
Other
Peatlands
Secondary Forest
Primary Forest
0
50
100
150
200
250
300
350
400
450
20302029202820272026202520242023202220212020201920182017201620152014201320122011Carb
on D
ioxid
e Em
ission
s Red
uctio
ns (M
tCO 2)
Note: MtCO2 = million metric tons of carbon dioxide Source: WRI.
Additional Reductions from Extended MoratoriumCurrent moratorium

WORKING PAPER | September 2017 | 19
How Can Indonesia Achieve Its Climate Change Mitigation Goal? An Analysis of Potential Emissions Reductions from Energy and Land-Use Policies
The Peat Restoration Agency is tasked with restoring 2.1 million hectares of peatlands by 2020 in seven priority provinces (Riau, Jambi, South Sumatra, West Kalimantan, Central Kalimantan, South Kalimantan, and Papua). The agency plans to achieve this goal according to the following timeline: 30 percent by 2016, 20 percent by 2017, 20 percent by 2018, 20 percent by 2019, and 10 percent by 2020.
EXISTING MEASURES SCENARIO
The Existing Measures scenario assumes the full implementation of presidential decree to achieve the 2.1 million hectares of peatland restored by 2020. Conversion of one hectare of drained peat organic soil to oil palm plantation releases 11 tCO2e annually (IPCC 2014). We used this emissions factor because, in most cases, peat is converted to oil palm plantations in Indonesia. We then assumed that peat rewetting and restoration could reverse these emissions, and therefore remove 11 tCO2e annually. Based on these assumptions, we estimated that this will achieve reduction of 22 MtCO2e per year by 2030.
STRENGTHENED MEASURES SCENARIO
The Peat Restoration Agency estimates that the total area of degraded peatland in the seven priority provinces is 6.7 million hectares. The Strengthened Measures scenario includes further restoration of the remaining 4.6 million hectares during 2020–2030 (Figure 10). We estimated that complete restoration of all 6.7 million hectares would achieve reductions of up to 73 MtCO2e per year by 2030.
4�2�3� Land and Forest Restoration TargetThe Land and Forest Rehabilitation plan and the Social Forestry Program aim to restore 7.7 million hectares of critical lands and degraded forests.5 Restoration efforts have been widely recognized as an important means not only in climate change mitigation but also for adaptation and biodiversity, as stated in current “Medium-Term National Development Plan 2015–2019” (BAPPENAS 2014). Forests and landscape restoration has the potential to increase forest carbon stock and biodiversity, support local livelihood, and mitigate natural disasters like floods and landslides.
Degraded land in Indonesia is defined as land that no longer has proper water-regulating functions or other ecosystem functions, and is usually unproductive. The Forest Management Unit intends to rehabilitate 5.5 million hectares of degraded land by 2019. We assume this area
will remain as forest and thus serve as a carbon sink through 2020–2030. Bonner et al. (2030) report that for each hectare of forest land restored, approximately 9 tCO2e per hectare per year (tCO2e/ha/year) will be removed from the atmosphere. Restoring 5.5 million hectares of degraded land to forest could thus sequester up to 51 MtCO2e per year by 2030.
4�2�4� Social Forestry TargetThe “forest estate” is land managed by MoEF on the based of the Forestry Law (Government of Indonesia 2015). The Social Forestry Program is intended to support local livelihoods and facilitate sustainable use of forest resources by handing over jurisdiction for forest management to communities or villages. The categories under the social forestry scheme include village forest (hutan desa), community forest (hutan kemasyarakatan), community production forest (hutan tanaman rakyat), partnership forest (hutan kemitraan), and customary forest (hutan adat). Under the framework of community and village forests, local people may propose to locally manage eligible areas inside protected forests (hutan lindung) or production forests (hutan produksi).
While the social forestry scheme was designed to facilitate community access to natural resources and enable people-centered development, it has the potential to promote forest restoration. For years, unsustainable forest management practices and the conversion of forestland for commercial uses have decreased forest cover in Indonesia. Through the social forestry scheme, communities have the responsibility to manage their forests and the potential to better maintain forest cover since their economy relies on forest conservation (ANTARA News 2015). This could result in the effective co-creation of a forest carbon sink together with locally productive forests.
MoEF published a map of Indicative Social Forestry Areas in 2015, identifying 12.7 million hectares of the forest estate that will be part of the Social Forestry Program by 2020 (MoEF 2015e). We overlaid this map with land cover data from the Geospatial Information Agency (2014) to estimate the amount of degraded land with the potential to be restored. Of the designated 12.7 million hectares on the Social Forestry map, we found 2.2 million hectares of degraded lands that could potentially be restored. This restoration is assumed to start in 2016 and be completed by 2030.6

20 |
Figure 10 | Projected Areas of Peatland Restored and Emissions Avoided under Existing and Strengthened Measures, 2016–2030
Figure 11 | Projected Area of Forest Land Restored and Emissions Avoided, 2016–2030
0
1
2
3
4
5
6
7 Strengthened Measures (2020 - 2030)
Existing Measures (2016 - 2020)
2030202920282027202620252024202320222021202020192018201720160
10
20
30
40
50
60
70
80
Area
Res
tore
d (M
ha)
Emiss
ions A
void
ed (M
tCO 2)
Notes: Mha = million hectares; MtCO2 = million metric tons of carbon dioxideSource: WRI.
0
1
2
3
4
5
6
7
8Social Forestry Target
Forest Restoration
203020292028202720262025202420232022202120202019201820172016
0
10
20
30
40
50
60
70
Area
Res
tore
d (M
ha)
Emiss
ions A
void
ed (M
tCO 2)
Notes: Mha = million hectares; MtCO2 = million metric tons of carbon dioxideSource: WRI.
WORKING PAPER | September 2017 | 21
How Can Indonesia Achieve Its Climate Change Mitigation Goal? An Analysis of Potential Emissions Reductions from Energy and Land-Use Policies
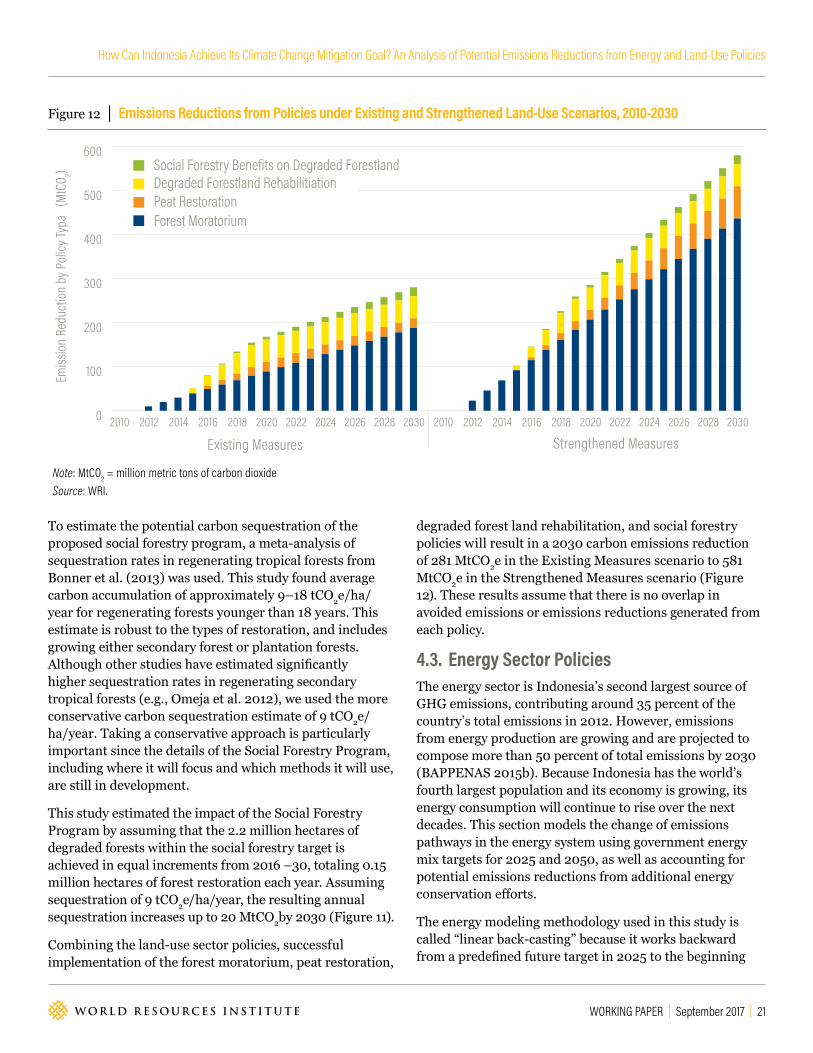
Figure 12 | Emissions Reductions from Policies under Existing and Strengthened Land-Use Scenarios, 2010-2030
To estimate the potential carbon sequestration of the proposed social forestry program, a meta-analysis of sequestration rates in regenerating tropical forests from Bonner et al. (2013) was used. This study found average carbon accumulation of approximately 9–18 tCO2e/ha/year for regenerating forests younger than 18 years. This estimate is robust to the types of restoration, and includes growing either secondary forest or plantation forests. Although other studies have estimated significantly higher sequestration rates in regenerating secondary tropical forests (e.g., Omeja et al. 2012), we used the more conservative carbon sequestration estimate of 9 tCO2e/ha/year. Taking a conservative approach is particularly important since the details of the Social Forestry Program, including where it will focus and which methods it will use, are still in development.
This study estimated the impact of the Social Forestry Program by assuming that the 2.2 million hectares of degraded forests within the social forestry target is achieved in equal increments from 2016 –30, totaling 0.15 million hectares of forest restoration each year. Assuming sequestration of 9 tCO2e/ha/year, the resulting annual sequestration increases up to 20 MtCO2by 2030 (Figure 11).
Combining the land-use sector policies, successful implementation of the forest moratorium, peat restoration,
degraded forest land rehabilitation, and social forestry policies will result in a 2030 carbon emissions reduction of 281 MtCO2e in the Existing Measures scenario to 581 MtCO2e in the Strengthened Measures scenario (Figure 12). These results assume that there is no overlap in avoided emissions or emissions reductions generated from each policy.
4.3. Energy Sector PoliciesThe energy sector is Indonesia’s second largest source of GHG emissions, contributing around 35 percent of the country’s total emissions in 2012. However, emissions from energy production are growing and are projected to compose more than 50 percent of total emissions by 2030 (BAPPENAS 2015b). Because Indonesia has the world’s fourth largest population and its economy is growing, its energy consumption will continue to rise over the next decades. This section models the change of emissions pathways in the energy system using government energy mix targets for 2025 and 2050, as well as accounting for potential emissions reductions from additional energy conservation efforts.
The energy modeling methodology used in this study is called “linear back-casting” because it works backward from a predefined future target in 2025 to the beginning
0
100
200
300
400
500
600Social Forestry Benefits on Degraded ForestlandDegraded Forestland Rehabilitiation Peat RestorationForest Moratorium
2030202820262024202220202018201620142012201020302028202620242022202020182016201420122010
Existing Measures Strengthened Measures
Emiss
ion R
educ
tion
by P
olicy
Typa
(Mt
CO2)
Note: MtCO2 = million metric tons of carbon dioxideSource: WRI.
22 |
of the modeling period in 2015. It allows us to simulate the change in annual emissions from a set of scenarios based on key energy targets and to study the impact of key policy measures to change emissions pathways. Using the linear back-casting process, we envision Indonesia having accomplished a desirable emissions future, in which the principles for success have been met, and then assess the policies that must be accomplished to move toward that point. This approach is different from forecasting, which projects into the future today’s trends through various interdependent parameters to simulate what are today considered realistic solutions. However, this assumption makes the study less vulnerable to unforeseen change due to its indeterminacy of the future.
4�3�1� Renewable Energy TargetIn the Reference scenario, Indonesia’s energy consumption is predicted to almost triple by 2030 because of its growing population (BPPT 2015). Reducing fossil fuel consumption and moving toward new and renewable energies are important to avoid becoming locked in to a high-carbon future. Poor choices on infrastructure development, such as building new fossil-fuel power plants can lock societies into emission-intensive pathways that may be impossible or very expensive to change in time to limit warming.
In 2015, the renewable energy share, excluding biomass, in Indonesia’s national energy mix was only 4.38 percent (Ministry of Energy and Mineral Resources 2016). As stated in its National Energy Policy, Indonesia aims to achieve a 23 percent share of renewable energy in the national energy mix by 2025, and 31 percent by 2050 (Government of Indonesia 2014a).
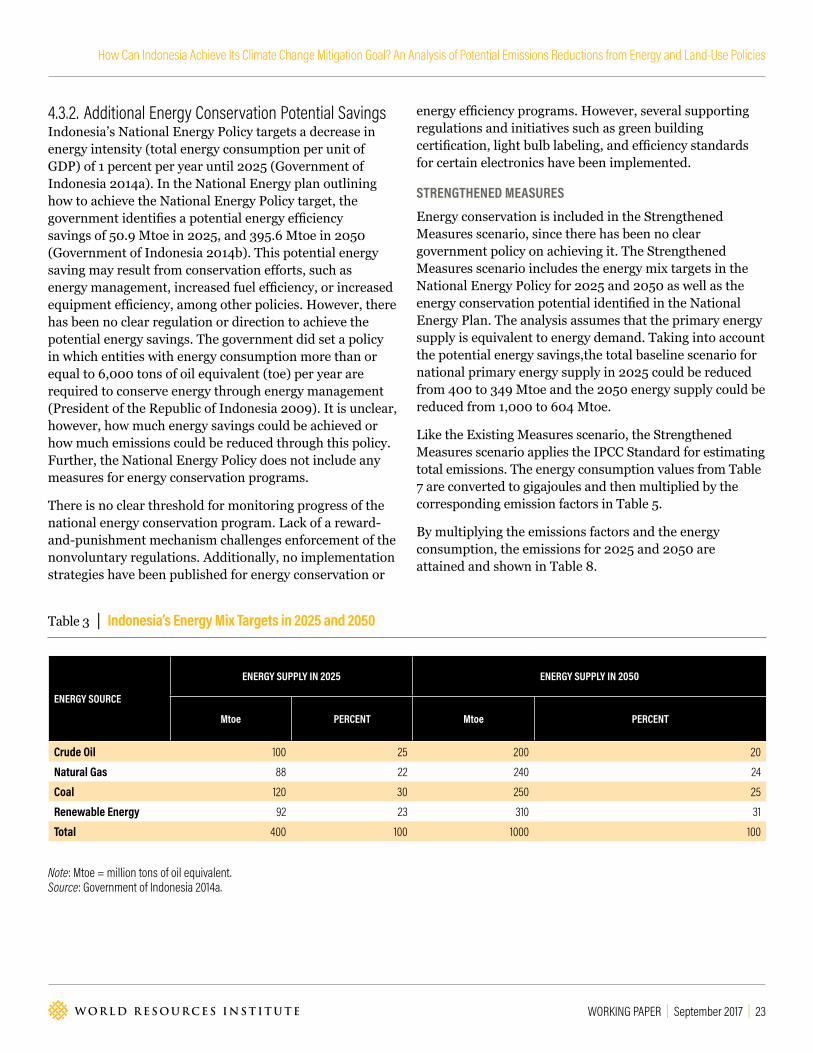
The strategy to achieve this target is elaborated in the National Energy General Plan, which is to be followed by provincial energy general plans (Government of Indonesia 2014b). The national plan sets out targets to transform Indonesia’s energy sector by 2025 and 2050 as follows:
�� Achieve a primary energy supply of 400 metric tons of oil equivalent in 2025, and of 1,000 metric tons of oil equivalent in 2050.
�� Achieve an optimal mix of primary energy so that:
�� Renewable source energy will provide at least 23 percent of total energy in 2025 and at least 31 percent in 2050, given that the economic demand is fulfilled;
�� Crude oil will provide less than 25 percent of total energy in 2025 and less than 20 percent by 2050;
�� Coal will provide at least 30 percent in 2025, and at least 25 percent by 2050;
�� Natural gas will provide at least 22 percent in 2025,and at least 24 percent in 2050.
EXISTING MEASURES SCENARIO
The Existing Measures scenario follows the National Energy Policy target in Government Regulation No. 79 Year 2014, which is achieving the renewable energy mix target of 23 percent by 2025 and 31 percent by 2050. This includes renewable energy that is generated for electricity and for fuel (nonelectricity uses).
The total energy supply is assumed to be equal to the total energy consumption (Table 4). These consumption values in million tons of oil equivalent (Mtoe) are then converted to gigajoules to get the equivalent value of energy consumed, using the conversion factor (IEA 2017):
1 Mtoe = 41,870,000 gigajoules = 4.19 × 10⁷ gigajoules
To get the emissions produced from the energy use, the IPCC Standard for calculating emissions was applied (Ministry of Energy and Mineral Resources 2013).
Emissions = Energy Consumption × Emissions Factor
The emissions factors used in this analysis follow the emissions factors published by the Ministry of Energy and Mineral Resources in the Assessment of Greenhouse Gas Emissions Inventory in 2013 (Table 5). The emissions factors are assumed to be the average values of emitted carbon dioxide (in metric tons of CO2) per gigajoule of energy used when the primary energy sources are transformed into fuel use. It is assumed that the emissions factor for renewable energy is zero.
By multiplying the emissions factors and the energy consumption, total emissions from the energy sector with the renewable energy mix targets for 2025 and 2050 are obtained and are shown in Table 6.
Under the Existing Measures scenario, the full implementation of government’s energy mix target could produce total emissions of approximately 1,009 MtCO2 in 2025, and of 2,218 MtCO2 in 2050.
WORKING PAPER | September 2017 | 23
How Can Indonesia Achieve Its Climate Change Mitigation Goal? An Analysis of Potential Emissions Reductions from Energy and Land-Use Policies
4�3�2� Additional Energy Conservation Potential SavingsIndonesia’s National Energy Policy targets a decrease in energy intensity (total energy consumption per unit of GDP) of 1 percent per year until 2025 (Government of Indonesia 2014a). In the National Energy plan outlining how to achieve the National Energy Policy target, the government identifies a potential energy efficiency savings of 50.9 Mtoe in 2025, and 395.6 Mtoe in 2050 (Government of Indonesia 2014b). This potential energy saving may result from conservation efforts, such as energy management, increased fuel efficiency, or increased equipment efficiency, among other policies. However, there has been no clear regulation or direction to achieve the potential energy savings. The government did set a policy in which entities with energy consumption more than or equal to 6,000 tons of oil equivalent (toe) per year are required to conserve energy through energy management (President of the Republic of Indonesia 2009). It is unclear, however, how much energy savings could be achieved or how much emissions could be reduced through this policy. Further, the National Energy Policy does not include any measures for energy conservation programs.
There is no clear threshold for monitoring progress of the national energy conservation program. Lack of a reward-and-punishment mechanism challenges enforcement of the nonvoluntary regulations. Additionally, no implementation strategies have been published for energy conservation or
energy efficiency programs. However, several supporting regulations and initiatives such as green building certification, light bulb labeling, and efficiency standards for certain electronics have been implemented.
STRENGTHENED MEASURES
Energy conservation is included in the Strengthened Measures scenario, since there has been no clear government policy on achieving it. The Strengthened Measures scenario includes the energy mix targets in the National Energy Policy for 2025 and 2050 as well as the energy conservation potential identified in the National Energy Plan. The analysis assumes that the primary energy supply is equivalent to energy demand. Taking into account the potential energy savings,the total baseline scenario for national primary energy supply in 2025 could be reduced from 400 to 349 Mtoe and the 2050 energy supply could be reduced from 1,000 to 604 Mtoe.
Like the Existing Measures scenario, the Strengthened Measures scenario applies the IPCC Standard for estimating total emissions. The energy consumption values from Table 7 are converted to gigajoules and then multiplied by the corresponding emission factors in Table 5.
By multiplying the emissions factors and the energy consumption, the emissions for 2025 and 2050 are attained and shown in Table 8.
Table 3 | Indonesia’s Energy Mix Targets in 2025 and 2050
Note: Mtoe = million tons of oil equivalent�Source: Government of Indonesia 2014a�
ENERGY SOURCE
ENERGY SUPPLY IN 2025 ENERGY SUPPLY IN 2050
Mtoe PERCENT Mtoe PERCENT
Crude Oil 100 25 200 20
Natural Gas 88 22 240 24
Coal 120 30 250 25
Renewable Energy 92 23 310 31
Total 400 100 1000 100
24 |
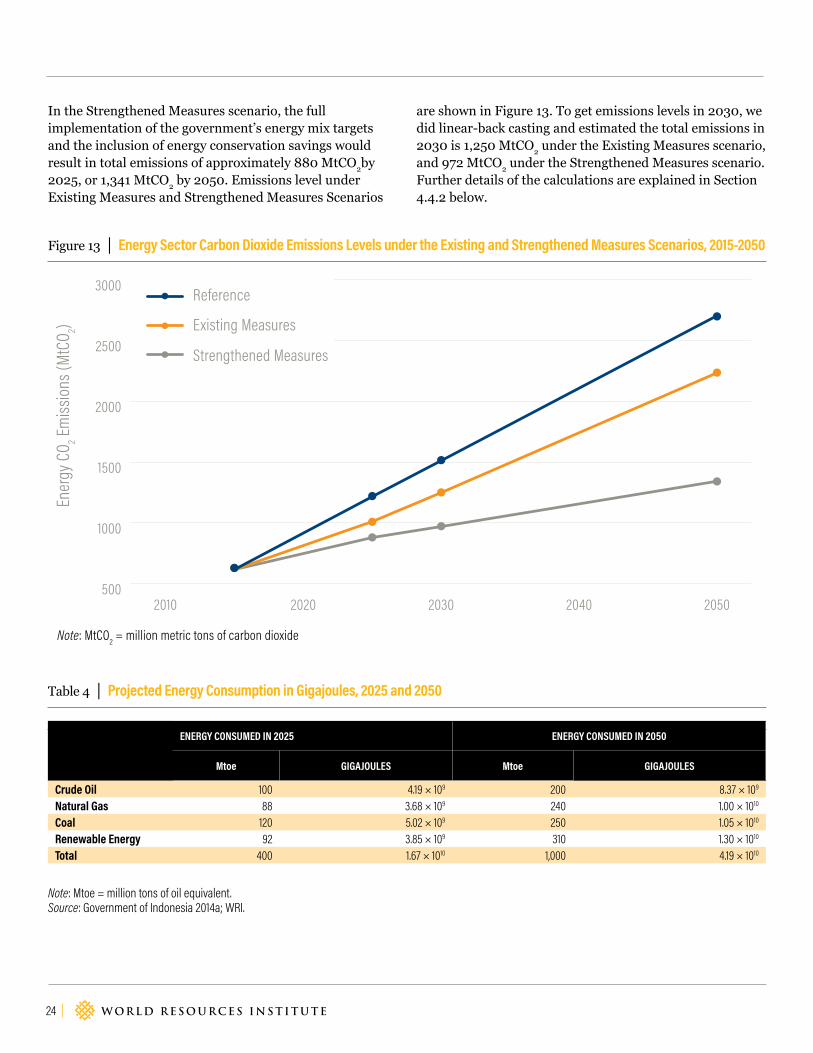
In the Strengthened Measures scenario, the full implementation of the government’s energy mix targets and the inclusion of energy conservation savings would result in total emissions of approximately 880 MtCO2by 2025, or 1,341 MtCO2 by 2050. Emissions level under Existing Measures and Strengthened Measures Scenarios
are shown in Figure 13. To get emissions levels in 2030, we did linear-back casting and estimated the total emissions in 2030 is 1,250 MtCO2 under the Existing Measures scenario, and 972 MtCO2 under the Strengthened Measures scenario. Further details of the calculations are explained in Section 4.4.2 below.
Figure 13 | Energy Sector Carbon Dioxide Emissions Levels under the Existing and Strengthened Measures Scenarios, 2015-2050
Table 4 | Projected Energy Consumption in Gigajoules, 2025 and 2050
Note: Mtoe = million tons of oil equivalent�Source: Government of Indonesia 2014a; WRI�
500
1000
1500
2000
2500
3000
Strengthened Measures
Existing Measures
Reference
20502040203020202010
Ener
gy C
O 2 Emiss
ions (
MtCO
2)
Note: MtCO2 = million metric tons of carbon dioxide
Source: WRI.
ENERGY CONSUMED IN 2025 ENERGY CONSUMED IN 2050
Mtoe GIGAJOULES Mtoe GIGAJOULES
Crude Oil 100 4�19 × 109 200 8�37 × 109
Natural Gas 88 3�68 × 109 240 1�00 × 1010
Coal 120 5�02 × 109 250 1�05 × 1010
Renewable Energy 92 3�85 × 109 310 1�30 × 1010
Total 400 1�67 × 1010 1,000 4�19 × 1010

WORKING PAPER | September 2017 | 25
How Can Indonesia Achieve Its Climate Change Mitigation Goal? An Analysis of Potential Emissions Reductions from Energy and Land-Use Policies
Table 5 | Emissions Factors for Fuel in Indonesia
FUEL TYPE AVERAGE EMISSIONS FACTORS (METRIC TONS OF CO2/GIGAJOULE)
Crude Oil (ADO, Avgas, Avtur, Fuel Transport, Fuel Oil, IDO, Kerosene) 0�0726
Natural Gas (Gas, LNG) 0�0602
Coal 0�0961
Notes: ADO=Automotive Diesel Oil; Avgas=Aviation Gasoline; Avtur=Aviation Turbine Fuel; IDO=Industrial Diesel Oil; LNG=Liquefied Natural Gas�Source: Ministry of Energy and Mineral Resources 2013�
By multiplying the emissions factors and the energy consumption, total emissions from the energy sector with the renewable energy mix targets for 2025 and 2050 are obtained and are shown in Table 6.
4.4. Modeling Results4�4�1� Land-Use SectorBased on our analysis, Reference scenario emissions in the land-use sector reach approximately 1,342 MtCO2 by 2030). The Existing Measures are estimated to reduce land-based emissions by 281 MtCO2below Reference scenario to 1,061 MtCO2 with forest moratorium and peat-land restoration targets achieved. While the Strengthened Measures are estimated to reduce emissions by 581 MtCO2 below Reference scenario, to 761 MtCO2 with an extended forest moratorium, and further peat restoration (Figure 14).
4�4�2� Energy SectorUnder the Reference Scenario, Indonesia’s energy sector is estimated to emit 1,516 MtCO2 in 2030. Implementation of the Existing Measures scenario will reduce total energy emissions to 1,009 MtCO2 in 2025 and 2,218 MtCO2 in 2050 (Figure 15). Three points were plotted: (1) the year modeling started, which is the Reference emissions in 2015; (2) the emissions levels under the Existing Measures scenario in 2025; and (3) the emissions levels under the Existing Measures scenario in 2050. For 2015–2025, a line was drawn to connect the first point to second point, and for 2025–2050, another line was drawn from the second point to the third point. The reduction per year is attained by subtracting the emissions level plotted in the graph for the indicated year with the Reference scenario emissions for that year. Under the Existing Measures scenario in which Indonesia achieves its renewable energy targets in 2025 and 2050, Indonesia would reduce emissions
by 265.5 MtCO2 or 17 percent below the 2030 energy Reference scenario.
In the Strengthened Measures scenario, emissions from the energy sector are estimated to reach 880 MtCO2 in 2025, and 1,341 by 2050. Similar to the existing energy mitigation estimate, the linear back-casting approach was applied extending the future emissions level from 2025 and 2050 back to 2015. Annual emissions reductions were obtained by subtracting the emissions plotted in the graph for the indicated year with the Reference scenario emissions for that year. The Strengthened Measures scenario, in which continued efforts promoting renewable energy and implementing energy conservation measures extend beyond 2025, is estimated to reduce energy sector emissions by 544 MtCO2 from the Reference scenario, to 972 MtCO2 of total energy sector CO2 emissions by 2030 (Figure 15).
4.5. Limitations and Scope of the AnalysisThis paper quantifies emissions as well as reduction potentials for land-use and energy sectors using a rather simplistic, linear approach either by extending the current trend of emissions assuming no additional actions are taken for reducing greenhouse gas emissions in the projected time period (for land-use sector), or by linearly extrapolating existing government reported baselines (for the energy sector).
When estimating mitigation potentials, all targets are assumed to be fully achieved and policies implemented. Land-use sector emissions are estimated on the basis of linear projections of areas of land protected or restored, and translating the areas into emissions reductions and avoided emissions based on respective carbon contents. Energy sector emissions are calculated by meeting the renewable energy or energy conservation targets by the target year.

26 |
Figure 14 | Land-Use Sector Carbon Dioxide Emissions Reduction Scenarios, 2010–2030
Reference
203020292028202720262025202420232022202120202019201820172016201520142013201220112010
With Existing MeasuresWith Strengthened Measures
Land
Sec
tor C
O 2 Em
ission
(MtC
O 2)
Note: MtCO2 = million metric tons of carbon dioxide
Source: WRI.
Figure 15 | Energy Sector Carbon Dioxide Emissions Reduction Scenarios, 2010-2030
0
200
400
600
800
1000
1200
1400
1600
Strengthened MeasureExisting MeasureReference
203020252015
Ener
gy C
O 2 Emiss
ions (
MtCO
2)
629 629 629
1220
1009880
1516
1250
972
Note: MtCO2 = million metric tons of carbon dioxide
Source: WRI.

WORKING PAPER | September 2017 | 27
How Can Indonesia Achieve Its Climate Change Mitigation Goal? An Analysis of Potential Emissions Reductions from Energy and Land-Use Policies
Table 6 | Energy Sector Emissions with Renewable Energy Mix Targets, 2025 and 2050
Note: MtCO2 = million metric tons of carbon dioxide�Source: WRI�
Table 7 | Energy Mix Targets with Energy Conservation Savings, 2025 and 2050
Note: Mtoe = million tons of oil equivalent�Source: Government of Indonesia 2014a�
Table 8 | Energy Sector Emissions in the Strengthened Measures Scenario, 2025 and 2030
Note: MtCO2 = million metric tons of carbon dioxide�Source: WRI�
The GHG effects of various policies are aggregated directly across sectors. While it is likely there are overlapping or reinforcing interactions between those policies, simple aggregation is used, which assumes no such interactions. This simplified approach is taken because the GHG effects are analyzed from two different sectors—land and energy—and within each sector the policies are obviously not affecting the same sources or sinks. The only exception is the estimated area of land that could be restored (i.e., forest and land rehabilitation, and social forestry policies), where-
by restoration areas might overlap. This could lead to a slight overestimation of the emissions reduction, due to relatively small carbon benefits from regenerating forests.
The other limitation of this study is that the methodology does not produce sensitivity analyses to explain variations in external variables. Instead, the model uses partial and conditional extrapolations, mainly using historical emissions data from the baseline and linearly projecting it to the end of the modeling year. We argue that back-
ENERGY SOURCE TARGET CO2 EMISSIONS IN 2025 (MtCO2)
TARGET CO2 EMISSIONS IN 2050 (MtCO2)
Crude oil 304�04 608�07
Natural gas 221�63 604�44
Coal 482�84 1,005�93
Renewable Energy 0�00 0�00
Total 1,008�51 2,218�43
SOURCE OF ENERGYSAVINGS IN 2025 SAVINGS IN 2050
Mtoe PERCENT Mtoe PERCENT
Crude oil 87�28 25 120�88 20
Natural gas 76�80 22 145�06 24
Coal 104�73 30 151�10 25
Renewable energy 80�29 23 187�36 31
Total 349�10 100 604�40 100
SOURCE OF ENERGY 2025 EMISSIONS (MTCO2) 2050 EMISSIONS (MTCO2)
Crude oil 265�35 367�52
Natural gas 193�42 365�32
Coal 421�40 607�98
Renewable energy 0�00 0�00
Total 880�17 1,340�82

28 |
casting and forecasting approaches are complementary. In case the future emissions reduction targets are unlikely to be reached using a system-dynamic forecasting method, the back-casting approach should be able to generate illustrations of the achievable future through scenarios that fulfill the targets.
The linear model poses a risk of oversimplification of the land-use carbon emissions estimates. However, this study acquired baseline emissions from the Forest Reference Emission Level report prepared by MoEF. This report was accepted by UNFCCC in 2016, and complied with internationally accepted GHG accounting standards in the IPCC Guidelines and thus provides credibility. For the energy sector, the linear back-casting method offers speed and simplicity in understanding changes in annual emissions trajectories resulting from the changes in modeling parameters due to various government energy targets. This makes the model more transparent, easy to understand, and more adjustable to the assumption parameters.
Moreover, while the quantitative analysis described here provides an important benchmark against which to assess Indonesia’s efforts, it is important to note the inherent uncertainties involved in projecting future emissions (Greenhouse Gas Protocol 2014). The Reference scenario and associated abatement potential analyzed in this paper represent plausible descriptions of future emissions given the set of assumptions and methodological choices outlined herein. They should not be read as predictions.
This study focuses only on climate mitigation policies. Indonesia is a nation that is particularly vulnerable to the adverse impacts of climate change, ranging from disappearing small islands and extreme flooding, to failed agricultural production (Netherlands Commission for Environmental Assessment 2016). Comprehensive climate mitigation and adaptation efforts that allow flexibility for continued achievement of development priorities are therefore critical. However, adaptation policies are not expected to significantly reduce carbon emissions, thus the adaptation policies are not considered in this recent study.
Finally, although non-CO2 gases contribute 16 percent of Indonesia’s total GHG emissions, and can represent significant reduction potentials, this study calculates only CO2 emissions and removals from land and energy sectors, which is associated with 81 percent of Indonesia’s total GHG emissions based on its 2012 inventory.
5. Policy Options to Achieve Indonesia’s NDC Targets
While almost half of Indonesia’s current emissions are land-based (MoEF 2015a), emissions from the energy sector have been increasing at a faster rate during the current decade. The pressure for social and economic development in the coming decades will likely drive increased energy consumption and thus increase Indonesia’s energy emissions. In the absence of measures to decarbonize the energy sector, a shift in Indonesia’s emissions profile to energy-intensive activities is likely under a business-as-usual scenario. Comparing the Reference scenario emissions from the land and energy sectors, our analysis suggests that the energy sector will exceed the land sector as the most dominant contributor to national emissions between 2026 and 2027 (Figure 16).
By aggregating emissions reduction potentials from land and energy sectors against the sum of both sector’s Reference scenario emissions, this study estimates that Indonesia could achieve the reductions described below:
�� Existing Measures scenario: Up to 546 MtCO2 fewer emissions below the 2030 Reference scenario. The Existing Measures scenario takes into consideration existing policies for which required government or ministerial regulations have been issued.
�� Strengthened Measures scenario: Up to 1,125 MtCO2 fewer emissions below the 2030 Referencescenario. The Strengthened Measures scenario takes into consideration additional abatement measures in the form of enhancement of peat restoration and forest moratorium policies, as well as additional energy conservation measures.
This study estimates that as much as 2,858 MtCO2will be emitted in 2030 under the Reference scenario, assuming no mitigation policies are implemented. Combining the impacts of existing mitigation policies in the land and energy sectors, this study estimates total emissions in 2030 of 2,312 MtCO2. This study estimates that the successful implementation of strengthened measures from both sectors will result in 2030 emissions of 1,734 MtCO2 (Figure 17).
This emissions estimate, however, is still relatively high compared with the projected 2030 levels from the energy and forestry sectors communicated in Indonesia’s NDC (Table B1). Under the unconditional mitigation scenario

WORKING PAPER | September 2017 | 29
How Can Indonesia Achieve Its Climate Change Mitigation Goal? An Analysis of Potential Emissions Reductions from Energy and Land-Use Policies
(Counter Measure 1), the NDC specifies that emissions levels from the two sectors should be 1,572 MtCO2e by 2030 (Republic of Indonesia 2016) and the conditional mitigation scenario (Counter Measure 2) specifies the level at 1,335 MtCO2e. However, these scenarios were calculated against the NDC’s BAU numbers, which differ from those used in this analysis. It is worth mentioning that the NDC specifies that energy should contribute an 11 percent emissions reduction and forestry a 17.2 percent reduction in the unconditional mitigation scenario. This paper finds that since between 2026 and 2027, the energy sector will dominate the greenhouse gas emissions of the country, the proportion of emissions reductions from the energy and land sectors should then be adjusted and calculated accordingly.
Another important finding from this analysis is that Indonesia’s GHG emissions may not peak in 2030 under the Existing Measures scenario, even if each policy under this scenario fully meets its objectives.
Under the Strengthened Measures scenario, however, national emissions may level off beyond 2030, mainly due to the extended forest moratorium policy that considers secondary forests and forest cover with existing concession licenses, and the implementation of a renewable energy mix and an energy conservation policy that achieves emissions reductions.
Based on the Existing Measures scenario, the implementation of the forest moratorium, peat restoration, and achievement of renewable energy target only has the potential to reduce emissions to approximately 2,311 MtCO2, exceeding the allowable emissions for all sectors and gases required to meet Indonesia’s NDC unconditional target of 29 percent emissions reduction by 2030 (See Figure 18 and Table 9 for more details). This highlights the importance of strengthening government efforts for achieving climate action targets.
Figure 16 | Land-use and Energy Sectors Carbon Dioxide Emissions under the Baseline Scenario
0
500
1000
1500
2000
2500EnergyLand-use
20302028202620242022202020182016201420122010
Refe
renc
e Em
ission
s by S
ecto
r (Mt
CO2)
Note: MtCO2 = million metric tons of carbon dioxideSource: WRI.

30 |
Table 9 | Projected Emissions Reductions for Mitigation Options in Land-Use and Energy Sectors Relative to the Reference Scenario, 2030
Notes:a� All the percentages were calculated on the basis of the projected Reference scenario emissions of 2,858 MtCO2 in 2030� It is important to note that these
percentages are different from the percentage reduction targets in Indonesia’s NDC and should be compared with caution�b� It is not possible to allocate the total amount of reductions between the two measures that could be achieved under the Strengthened Measures scenario MtCO2 = million metric tons of carbon dioxide� n/a = not applicable�Source: WRI�
Figure 17 | Emissions Trajectories under Reference, Existing Measures, and Strengthened Measures Scenarios, 2010–2030
500
1000
1500
2000
2500
3000
Strengthened Measures (-39%)Existing Measures (-19%)Reference
203020292028202720262025202420232022202120202019201820172016201520142013201220112010
CO2 Em
ission
s - En
ergy
and
Land
Sec
tors
(MtC
O 2)
Note: MtCO2 = million metric tons of carbon dioxide
Source: WRI.
EXISTING MEASURES STRENGTHENED MEASURES EXISTING MEASURES STRENGTHENED MEASURES
EMISSIONS REDUCTIONS (MtCO2) PERCENT OF REFERENCE SCENARIOa
Land
Forest moratorium 188 437 6�6 15�3
Peat restoration 22 73 0�8 2�6
Degraded forestland rehabilitation 51 51 1�8 1�8
Social forestry benefits on degraded forestland 20 20 0�7 0�7
Total land-use sector 281 581 9�8 20�3
EnergyRenewable energy 266
544b9�3
19�0Energy conservation n/a n/a
Total energy sector 266 544 9�3 19�0
Total 546 1,125 19�1 39�3
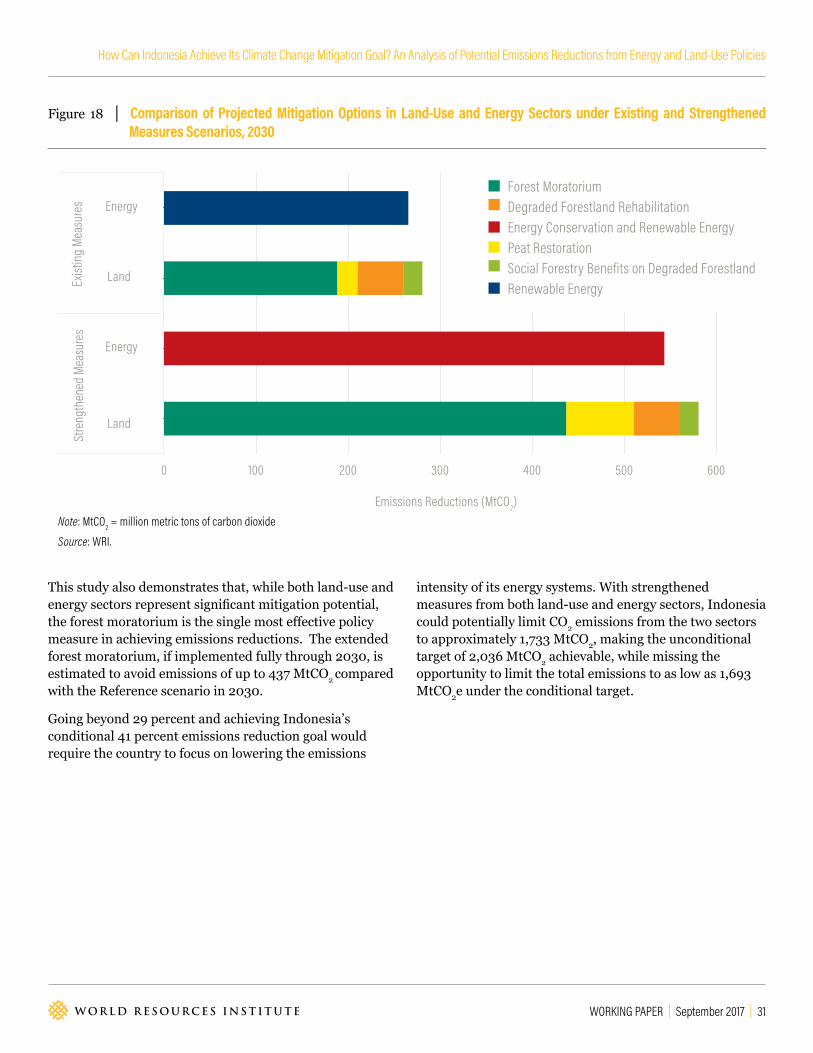
WORKING PAPER | September 2017 | 31
How Can Indonesia Achieve Its Climate Change Mitigation Goal? An Analysis of Potential Emissions Reductions from Energy and Land-Use Policies
Figure 18 | Comparison of Projected Mitigation Options in Land-Use and Energy Sectors under Existing and Strengthened Measures Scenarios, 2030
This study also demonstrates that, while both land-use and energy sectors represent significant mitigation potential, the forest moratorium is the single most effective policy measure in achieving emissions reductions. The extended forest moratorium, if implemented fully through 2030, is estimated to avoid emissions of up to 437 MtCO2 compared with the Reference scenario in 2030.
Going beyond 29 percent and achieving Indonesia’s conditional 41 percent emissions reduction goal would require the country to focus on lowering the emissions
intensity of its energy systems. With strengthened measures from both land-use and energy sectors, Indonesia could potentially limit CO2 emissions from the two sectors to approximately 1,733 MtCO2, making the unconditional target of 2,036 MtCO2 achievable, while missing the opportunity to limit the total emissions to as low as 1,693 MtCO2e under the conditional target.
0 100 200 300 400 500 600
Energy
Land
Land
Energy
Stre
ngth
ened
Mea
sure
s Ex
istin
g Me
asur
es
Emissions Reductions (MtCO2)
Forest MoratoriumDegraded Forestland RehabilitationEnergy Conservation and Renewable EnergyPeat RestorationSocial Forestry Benefits on Degraded ForestlandRenewable Energy
Note: MtCO2 = million metric tons of carbon dioxide
Source: WRI.
32 |
6. Conclusions and RecommendationsThis study analyzed land and energy sector policies packaged in Existing and Strengthened Mitigation Measures scenarios. Land-use sector policies include the forest moratorium, peatland restoration, land and forest rehabilitation, and social forestry programs. Energy sector policies include Indonesia’s renewable energy mix target and energy conservation actions. Employing a simple, but robust linear regression for land-use sector policies and a linear back-casting method for energy policies, we estimated emissions of approximately 2,858 MtCO2 by 2030 under a Reference scenario, 2,312 MtCO2 under an Existing Measures scenario, and 1,734 MtCO2 given successful implementation of a Strengthened Measures scenario.
For Indonesia to achieve both its unconditional and conditional NDC targets, more-ambitious mitigation actions will be necessary. Our analysis suggests that the key areas of increased ambition should be strengthening and extending the forest moratorium policy, restoring degraded forest and peatland, and increasing energy conservation efforts.
On the basis of this study we recommend that the Indonesian Government and others take the following actions:
�� To meet the unconditional target of reducing projected 2030 emissions by 29 percent from Indonesia’s BAU scenario, take more ambitious mitigation actions starting with strengthening and extending the forest moratorium policy, restoring degraded forest and peatland, and implementing energy conservation efforts.
�� Give priority to full implementation of the key existing land-use and energy policies identified in this report. Current land-use policies include a forest moratorium, peatland restoration, land and forest restoration, and social forestry. Current energy policies include achieving renewable energy targets.
�� Extend the forest moratorium—the single policy with the largest mitigation potential. Renew the policy through 2030 in its current form, or expand it to include secondary forest and forest areas under concession licenses to reduce emissions even further.
�� Focus on renewable energy development as soon as possible to achieve the lowest-cost path to emissions reductions and avoid locking in expensive fossil fuel power generation equipment. Promoting a renewable energy mix target will require multiple policy directions, including, for example, a carbon tax on fossil-fuel power plants, replacing new development of coal-burning power plants with clean and renewable energy sources (wind or solar), and providing subsidies and better feed-in tariffs for promoting renewable energy sources. Implement a program of energy conservation to meet the Extended Measures scenario target.
�� Provide clarification on how international support could be provided to facilitate measures to reach the conditional target of 41 percent emissions reduction.
�� Conduct further research to assess the emissions savings of other land-use and energy policies (such as forest fires mitigation, sustainable peatland management, carbon tax), as well as policies for other sectors (e.g., agriculture, industrial processes, waste), which were not included in this study.
Studies have suggested that achieving low-carbon economic development in Indonesia may have important cobenefits. For example, social forestry initiative can provide livelihood to millions of community members living around forests (New Climate Economy 2014). In addition, renewable energy development has the potential to bring thousands of green jobs to the market. By encouraging these cobenefits, Indonesia can be a leader in both sustainability efforts and economic development.
An underlying prerequisite to accomplishing these strategies is transparency and good governance. Acknowledging that climate change is a multidimensional, cross-sectoral issue will undeniably allow better vertical and horizontal collaboration not only among government agencies, but also between them and businesses and civil societies.
WORKING PAPER | September 2017 | 33
How Can Indonesia Achieve Its Climate Change Mitigation Goal? An Analysis of Potential Emissions Reductions from Energy and Land-Use Policies
ENDNOTES1� Indonesia’s NDC submission does not specify whether its
business-as-usual (BAU) scenario is dynamic and subject to change, or static� This paper assumes a static official BAU when comparing our analysis to the NDC targets� If the official BAU level of emissions is updated in the future, that figure could be compared to our calculations in assessing the mitigation options and feasibility of achieving the targets�
2� This paper uses MtCO2e to mean million metric tons of carbon dioxide equivalent� One gigaton equals 1,000 million megatons or 1 billion metric tons�
3� In Indonesia’s NDC submission, the BAU scenario is defined as an “emission scenario when the development path does not consider the mitigation policies�”
4� The Presidential Regulation No� 23/2013 was later revoked by the Presidential Decree No� 16/2015�
5� Because the Land and Forest Rehabilitation Plan and the Social Forestry Program are led by different directorates under the MoEF, it is unclear whether the two targets overlap with each other� In our analysis, no overlap is assumed�
6� Spatial data analysis of the Indicative Social Forestry map and one map land cover data resulted from ArcGIS software� Number is 1,857,475; 2,238,310 ha are located on degraded lands�
34 |
IEA (International Energy Agency)� 2017� “Unit Converter�” http://www�iea�org/statistics/resources/unitconverter/�
IPCC (Intergovernmental Panel on Climate Change)� 2014� 2013 Supplement to the 2006 IPCC Guidelines for National Greenhouse Gas Inventories: Wetlands� Geneva Switzerland: IPCC� http://www�ipcc-nggip�iges�or�jp/public/wetlands/ (accessed August 16, 2016)�
Margono, Belinda Arunarwati, Peter V� Potapov, Svetlana Turubanova, Fred Stolle, and Matthew C� Hansen� 2014� “Primary Forest Cover Loss in Indonesia over 2000–2012�” Nature Climate Change 4 (8): 730–735�
Ministry of Energy and Mineral Resources� 2013� Kajian Inventarisasi Emisi Gas Rumah Kaca. Jakarta: ESDM�
Ministry of Energy and Mineral Resources� 2016� “Handbook of Energy and Economics Statistics of Indonesia�”
MoEF (Ministry of Environment and Forestry)� 2015a� National Forest Reference Emission Level for REDD+, In the Context of Decision 1/CP.16 Paragraph 70 UNFCCC� Jakarta Directorate General of Climate Change� The Ministry of Environment and Forestry� http://redd�unfccc�int/files/national_frel_for_redd__in_indonesia_2015�pdf (accessed August 16, 2016)�
MoEF� 2015b� “Peta Indikatif Penundaan Pemberian Izin Baru Revisi IX�”WEBGIS Kementerian Lingkungan Hidup Dan Kehutanan�” http://webgis�dephut�go�id: 8080/kemenhut/index�php/id/peta/pippib/61-pippib/313-peta-indikatif-penundaan-pemberian-izin-baru-revisi-ix�
MoEF� 2015c� “KawasanHutan Indonesia/Indonesia Forest Area�” http://geoportal�menlhk�go�id/arcgis/rest/services/KLHK�
MoEF� 2015d� “Estimasi Emisi Karbon Kebakaran Hutan Dan Lahan Indonesia�”
MoEF� 2015e� “Akses Kelola Perhutanan Sosial—Kementrian Lingkungan Hidup Dan Kehutanan (KLHK)�” http://pskl�menlhk�go�id/akps/index�php/piaps/peta�
Netherlands Commission for Environmental Assessment� 2016� “Climate Change Profile: Indonesia�” http://api�commissiemer�nl/docs/os/i71/i7196/climate_change_profile_indonesia_2016_reduced_size�pdf�
New Climate Economy� 2014� Better Growth, Better Climate. Washington DC: The New Climate Economy Report, The Global Commission on the Economy and Climate�
Omeja, Patrick A�, Joseph Obua, Aggrey Rwetsiba, and Colin A� Chapman� 2012� “Biomass Accumulation in Tropical Lands with Different Disturbance Histories: Contrast within One Landscape and across Regions�” Forest Ecology and Management 269: 293–300�
Peat Restoration Agency� 2016� “Peta Kesatuan Hidrologis Gambut�” WEBGIS Kementerian Lingkungan Hidup Dan Kehutanan�” http://webgis�dephut�go�id: 8080/kemenhut/index�php/id/peta/peta-cetak/59-peta-cetak/314-peta-kesatuan-hidrologi-gambut�
President of the Republic of Indonesia� 2009� “Government Regulation of the Republic of Indonesia No� 70/2009 on Energy Conservation�” http://faolex�fao�org/docs/pdf/ins97608�pdf�
REFERENCESANTARA News� 2015� “Social Forestry Program Helps Indonesia Reduce Gas Emissions,” December 4� http://www�antaranews�com/en/news/101862/social-forestry-program-helps-indonesia-reduce-gas-emissions�
Austin, Kemen, Fred Stolle, and Stuart Sheppard� 2012� Indonesia’s Moratorium on New Forest Concessions: Key Findings and Next Steps. http://www�wri�org/sites/default/files/indonesia_moratorium_on_new_forest_concessions�pdf�
BAPPENAS (Ministry of National Development Planning)� 2014� “Rencana Pembangunan JangkaMenengah Nasional 2015–2019 (RPJMN 2015–2019)�” http://www�bappenas�go�id/files/7714/1557/5291/RT_RPJMN�PDF�
BAPPENAS� 2015a� “Peraturan Presiden Republik of Indonesia Nomor 2 Tahun 2015 Tentang Rencana Pembangunan Jangka Menengah Nasional 2015–2019�” http://bappeda�kepriprov�go�id/data/RPJMN/BUKU_I_RPJMN_2015-2019�pdf�
BAPPENAS� 2015b� “Dokumen Pendukung Penyusunan INDC�”
BAPPENAS� 2015c� Baseline Development & GHG Emission Abatement Policy Scenario for RAN GRK and INDC Review� Jakarta: BAPPENAS�
Bonner, Mark T� L�, Susanne Schmidt, and Luke P� Shoo� 2013� “A Meta-analytical Global Comparison of Aboveground Biomass Accumulation between Tropical Secondary Forests and Monoculture Plantations�” Forest Ecology and Management 291: 73–86�
BPPT (Badan Pengkajian dan Pengembangan Teknologi)� 2015� “Outlook Energi Indonesia 2015�” Jakarta: Pusat Teknologi Pengembangan Sumber Daya Energi (PTPSE)�”
Busch, Jonah, Kalifi Ferretti-Gallon, Jens Engelmann, Max Wright, Kemen G� Austin, Fred Stolle, Svetlana Turubanova, Peter V� Potapove, Belinda Margonoe, Matthew C� Hansene, and Alessandro Baccini 2015� “Reductions in Emissions from Deforestation from Indonesia’s Moratorium on New Oil Palm, Timber, and Logging Concessions�” Proceedings of the National Academy of Sciences 112 (5): 1328–1333�
Geospatial Information Agency� 2014� Thematic Map of Indonesia� Bakosurtanal official website� http://www�bakosurtanal�go�id/peta-tematik/�
Government of Indonesia� 2014a� “Peraturan Pemerintah Republik Indonesia Nomor 79 Tahun 2014, Tentang Kebijakan Energi Nasional�” http://peraturan�go�id/pp/nomor-79-tahun-2014�html�
Government of Indonesia� 2014b� “Lampiran I Peraturan Presiden Republik Indonesia Tentang Rencana Umum Energi Nasional�”
Government of Indonesia� 2015� “Peraturan Pemerintah Republik Indonesia Nomor 104 Tahun 2015 Tentang Tata Cara Perubahan Peruntukan Dan Fungsi Kawasan Hutan�” http://www�bpn�go�id/Publikasi/Peraturan-Perundangan/Peraturan-Pemerintah/peraturan-pemerintah-republik-indonesia-nomor-104-tahun-2015-61370�
Greenhouse Gas Protocol� 2014� Mitigation Goal Standard: An Accounting and Reporting Standard for National and Subnational Greenhouse Gas Reduction Goals� Washington, DC World Resources Institute�

WORKING PAPER | September 2017 | 35
How Can Indonesia Achieve Its Climate Change Mitigation Goal? An Analysis of Potential Emissions Reductions from Energy and Land-Use Policies
World Bank� 2016� Indonesia Data (Database)� http://data�worldbank�org/country/indonesia�
World Resources Institute� 2015� CAIT Climate Data Explorer (Database)� http://cait�wri�org�
President of the Republic of Indonesia� 2011� “Presidential Regulation of the Republic of Indonesia No� 61 Year 2011 on the National Action Plan for Greenhouse Gas Emission Reduction�” http://ranradgrk�bappenas�go�id/rangrk/images/documents/PERPRES�
President of the Republic of Indonesia� 2014� “Peraturan Pemerintah Republik Indonesia Nomor 79 Tahun 2014 Tentang Kebijakan Energi Nasional�” http://jdih�den�go�id/data/1154/peraturan-pemerintah-nomor-79-tahun-2014�
President of the Republic of Indonesia� 2015a� “Peraturan Presiden Republik Indonesia Nomor 16 Tahun 2015 Tentang Kementerian Lingkungan Hidup Dan Kehutanan�” http://www�redd-monitor�org/wp-content/uploads/2015/01/Perpres-Nomor-16-Tahun-2015�pdf�
President of the Republic of Indonesia� 2015b� “Instruksi Presiden Republik Indonesia Nomor 8 Tahun 2015, Tentang Penundaan Pemberian Izin Baru Dan Penyempurnaan Tata Kelola Hutan Alam Primer Dan Lahan Gambut�” http://www�kemendagri�go�id/media/documents/2015/06/05/i/n/inpres_nomor_8_tahun_2015�pdf�
President of the Republic of Indonesia� 2016� “Peraturan Presiden Republik Indonesia Nomor 1 Tahun 2016, Tentang Badan Restorasi Gambut�” http://www�bpn�go�id/Publikasi/Peraturan-Perundangan/Peraturan-Presiden/peraturan-presiden-republik-indonesia-nomor-1-tahun-2016-61704�
President of the Republic of Indonesia� 2017� “Instruksi Presiden Republik Indonesia Nomor 6 Tahun 2017, Tentang Penundaan Pemberian Izin Barudan Penyempurnaan Tata Kelola Hutan Alam Primer dan Lahan Gambut�” http://sipuu�setkab�go�id/PUUdoc/175285/Inpres%20Nomor%206%20Tahun%202017�pdf�
PT PLN (Persero)� 2015� “Rencana Usaha Penyediaan Tenaga Listrik 2015–2024 (Electricity Supply Business Plan 2015-2024)�” http://www�pln�co�id/wp-content/uploads/2011/03/Buku_3_Executive_Summary_RUPTL_2015_2024E�pdf�
Republic of Indonesia� 2015a� “Intended Nationally Determined Contribution�” http://www4�unfccc�int/submissions/INDC/Published%20Documents/Indonesia/1/INDC_REPUBLIC%20OF%20INDONESIA�pdf�
Republic of Indonesia� 2015b� “Indonesia First Biennial Update Report (BUR) under the United National Framework Convention on Climate Change�” http://unfccc�int/resource/docs/natc/idnbur1�pdf�
Republic of Indonesia� 2016� “First Nationally Determined Contribution�” http://www4�unfccc�int/ndcregistry/PublishedDocuments/Indonesia%20First/First%20NDC%20Indonesia_submitted%20to%20UNFCCC%20Set_November%20%202016�pdf�
Van der Werf Guido� 2015� Global Fire Data� http://www�globalfiredata�org/updates�html#2015_indonesia�
Wijaya, A�, R� Sugardiman, A� Tosiani Budiharto, D� Murdiyarso, and L� V� Verchot� 2015� “Assessment of Large Scale Land Cover Change Classifications and Drivers of Deforestation in Indonesia�” Proceedings of the 36th International Symposium on Remote Sensing of Environment, http://toc.proceedings.com/33024webtoc.pdf..

36 |
ABOUT WRIWorld Resources Institute is a global research organization that turns big ideas into action at the nexus of environment, economic opportunity, and human well-being�
Our Challenge
Natural resources are at the foundation of economic opportunity and human well-being� But today, we are depleting Earth’s resources at rates that are not sustainable, endangering economies and people’s lives� People depend on clean water, fertile land, healthy forests, and a stable climate� Livable cities and clean energy are essential for a sustainable planet� We must address these urgent, global challenges this decade�
Our Vision
We envision an equitable and prosperous planet driven by the wise management of natural resources� We aspire to create a world where the actions of government, business, and communities combine to eliminate poverty and sustain the natural environment for all people�
ABOUT THE OPEN CLIMATE NETWORKThe Open Climate Network (OCN) brings together independent research institutes and stakeholder groups to monitor countries’ progress on climate change� We seek to accelerate the transition to a low-emission, climate-resilient future by providing consistent, credible information that enhances accountability both among and within countries� www�openclimatenetwork�org�
ACKNOWLEDGMENTSThe authors would like to thank the many people whose thoughtful inputs and reviews helped shape this paper: Juan Carlos Altamirano, Taryn Fransen, Leuserina Garniati, Rebecca Gasper, Dr� Medrilzam, Sonny Mumbunan, Jeffrey Rissman, Viviane Romeiro, Tjokorda Nirarta Samadhi, Ranping Song, Fred Stolle, Syamsidar Thamrin, and Fabby Tumiwa�
The authors would particularly like to acknowledge the following colleagues for their valuable administrative, editing, outreach, and design support: Jessica Brand, Josefhine Chitra, Carole Denny, Pauline Dinh, Bill Dugan, Beth Elliot, Carin Hall, Reidinar Juliane, Emily Matthews, Mary Paden, House of Infographics and LSF Editorial�
ABOUT THE AUTHORSArief Wijaya is a Senior Manager with WRI Indonesia’s Forest and Climate Program�
Contact: arief�wijaya@wri�org
Hanny Chrysolite is a Research Assistant with WRI Indonesia’s Forest and Climate Program�
Contact: hanny�chrysolite@wri�org
Mengpin Ge is a Research Analyst with WRI’s Global Climate Program�
Contact: mge@wri�org
Clorinda Kurnia Wibowo is a Research Analyst with WRI Indonesia’s Energy Program�
Contact: cwibowo@wri�org
Almo Pradana is a Manager with WRI Indonesia’s Energy and Climate Program�
Contact: almo�pradana@wri�org
Andhyta Firselly Utami is a former Research Analyst with WRI Indonesia’s Forest and Climate Program and a current Master of Public Policy candidate at the Harvard Kennedy School of Government�
Contact: andhyta_utami@hks18�harvard�edu
Kemen Austin is a PhD researcher at Duke University, and former Research Associate in the WRI Washington, DC office�
Contact: kemen�austin@duke�edu
Copyright 2017 World Resources Institute� This work is licensed under the Creative Commons Attribution 4�0 International License� To view a copy of the license, visit http://creativecommons�org/licenses/by/4�0/
10 G Street, NE | Washington, DC 20002 | www.WRI.org