how can health accounts inform health sector investments? lessons from country applications
TRANSCRIPT
1
Abt Associates Inc.
In collaboration with:
Avenir Health | Broad Branch Associates | Development Alternatives Inc. (DAI) | Johns Hopkins Bloomberg School of Public Health (JHSPH) |
Results for Development Institute (R4D) | RTI International | Training Resources Group, Inc. (TRG)

Experts
2
Heather Cogswell, MPH, MBA
Associate/Economist, Abt Associates Inc.
7+ years of experience in health data collection, analysis, and application
Former: Jhpiego, ADVIZOR Solutions, Bright Hope International
Moderator
Presenters
Tesfaye Dereje, MA
Resource Tracking Lead/Economist, Abt Associates Inc.
15 years of experience in the health sector: health finance and policy
Former: UNICEF/Federal Ministry of Health, Ethiopia
Karishmah Bhuwanee, MSc
Associate/Economist, Abt Associates Inc.
12 years of experience in health financing in international development
Former: ODI/Ministry of Health Burundi, Crown Agents, N M Rothschild
Outline
Overview of Health Accounts
Using Health Accounts to inform Resource Mobilization
Using Health Accounts to inform Pooling
Using Health Accounts to inform Purchasing
4

What are Health Accounts?
HA are based on the System of Health Accounts framework (SHA 2011)
Tool that tracks both the magnitude and flow of resources in the health
sector
Uses a comprehensive approach, looking at TOTAL resource flows to
the sector
public, private, and donor contributions
Uses a standard set of tables to organize flow of
resources in an easy-to-understand manner
Provides room for countries to incorporate their
country-specific categories for looking at the
spending breakdown (sub-classification)
5

Global application of SHA 2011 framework
Countries Conducting HA By Region: 38 African countries; 9 American; 11 Middle Eastern; 10 European; 16 Asian
6
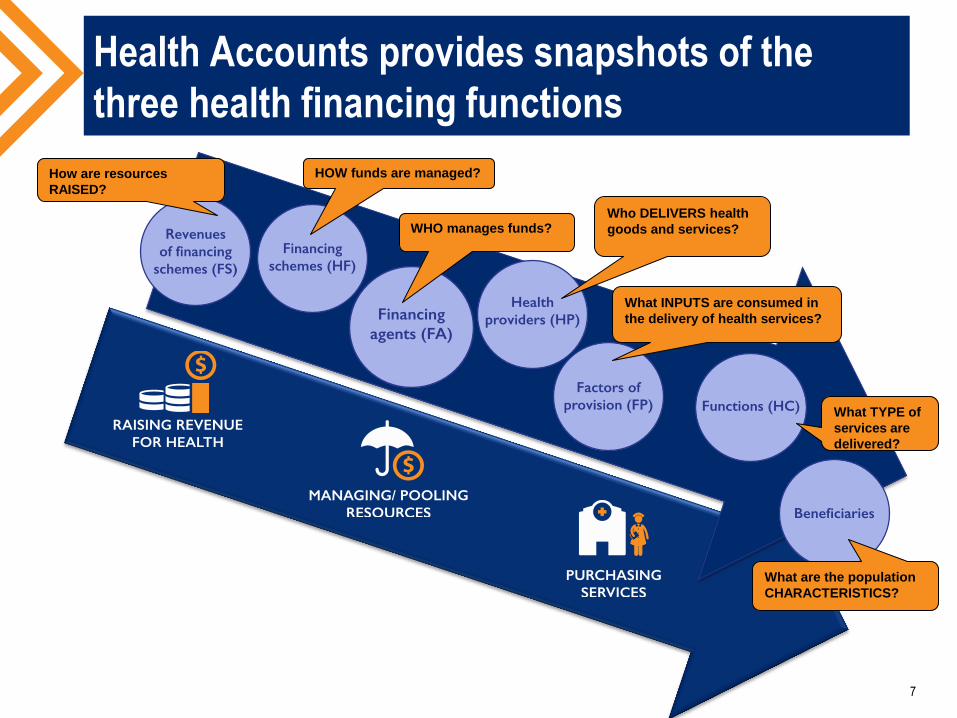
Health Accounts provides snapshots of the
three health financing functions
7
How are resources
RAISED?
HOW funds are managed?
WHO manages funds? Who DELIVERS health
goods and services?
What INPUTS are consumed in
the delivery of health services?
What TYPE of
services are
delivered?
What are the population
CHARACTERISTICS?
HEALTH FINANCING FUNCTION #1:
RESOURCE MOBILIZATION
8

Resource Mobilization: How sustainable is
financing for health?
9
0
10
20
30
40
50
60
70
80
90
100
Sh
are
of
Go
vern
men
t sp
end
ing
ou
t o
f T
HE
Share of Government Spending as % of Total Health Spending
Low income Middle income High income
Source- National Health Accounts reports
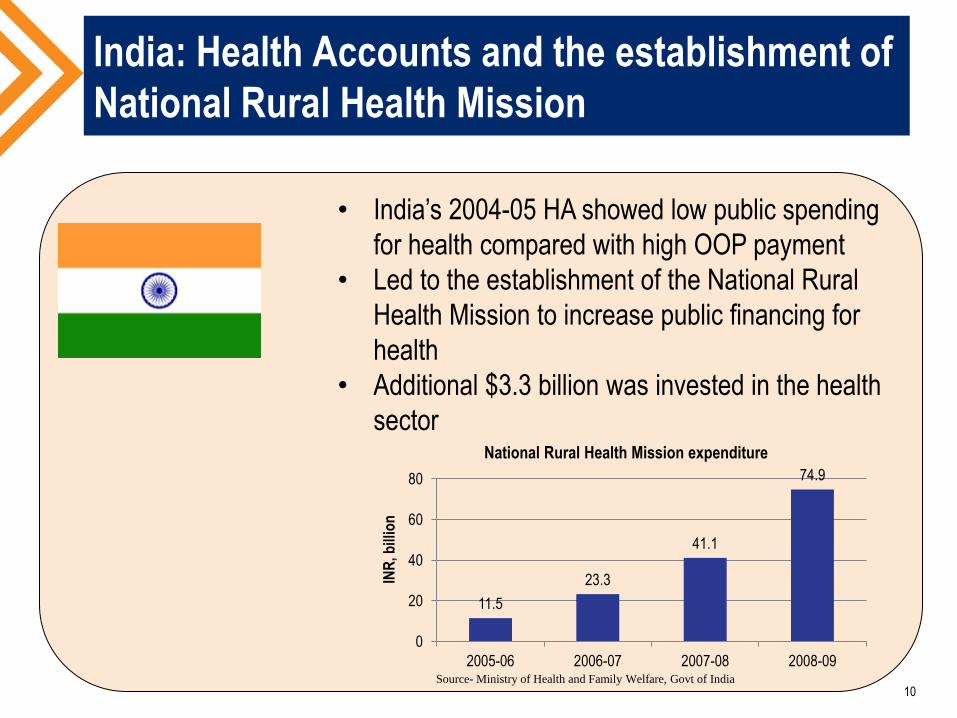
India: Health Accounts and the establishment of
National Rural Health Mission
10
• India’s 2004-05 HA showed low public spending
for health compared with high OOP payment
• Led to the establishment of the National Rural
Health Mission to increase public financing for
health
• Additional $3.3 billion was invested in the health
sector
11.5
23.3
41.1
74.9
0
20
40
60
80
2005-06 2006-07 2007-08 2008-09
INR
, bill
ion
National Rural Health Mission expenditure
Source- Ministry of Health and Family Welfare, Govt of India
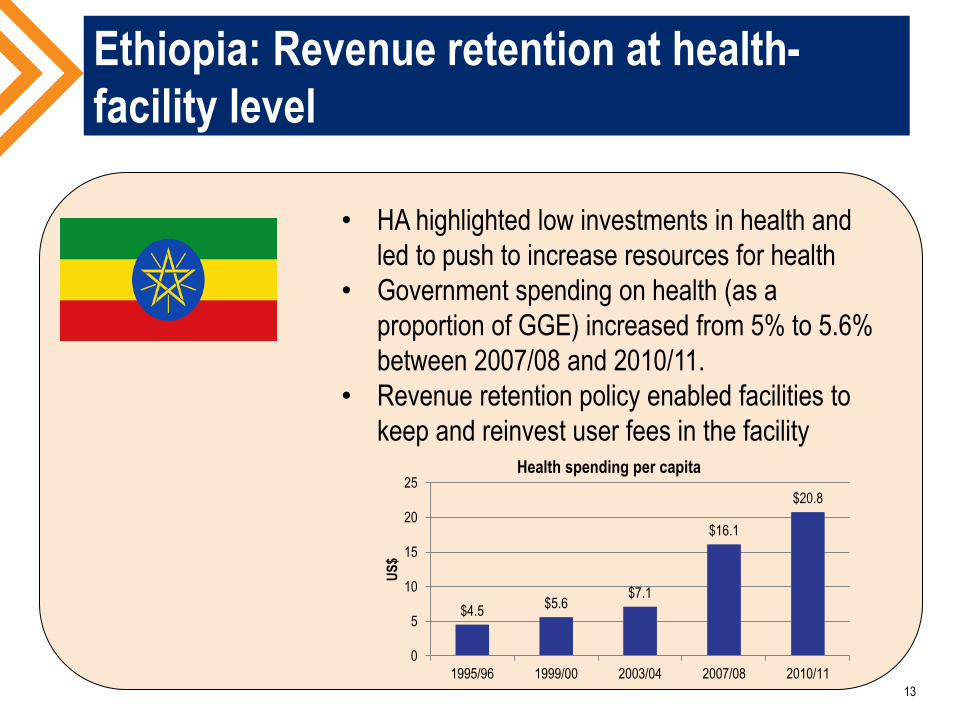
$4.5 $5.6
$7.1
$16.1
$20.8
0
5
10
15
20
25
1995/96 1999/00 2003/04 2007/08 2010/11
US
$
Health spending per capita
• HA highlighted low investments in health and
led to push to increase resources for health
• Government spending on health (as a
proportion of GGE) increased from 5% to 5.6%
between 2007/08 and 2010/11.
• Revenue retention policy enabled facilities to
keep and reinvest user fees in the facility
Ethiopia: Revenue retention at health-
facility level
13

Ethiopia: Revenue retention at health-
facility level
BEFORE AFTER
14
0
100
200
300
400
500
600
700
Per
cap
ita
spen
din
g (
US
D)
Low Income Middle Income High Income
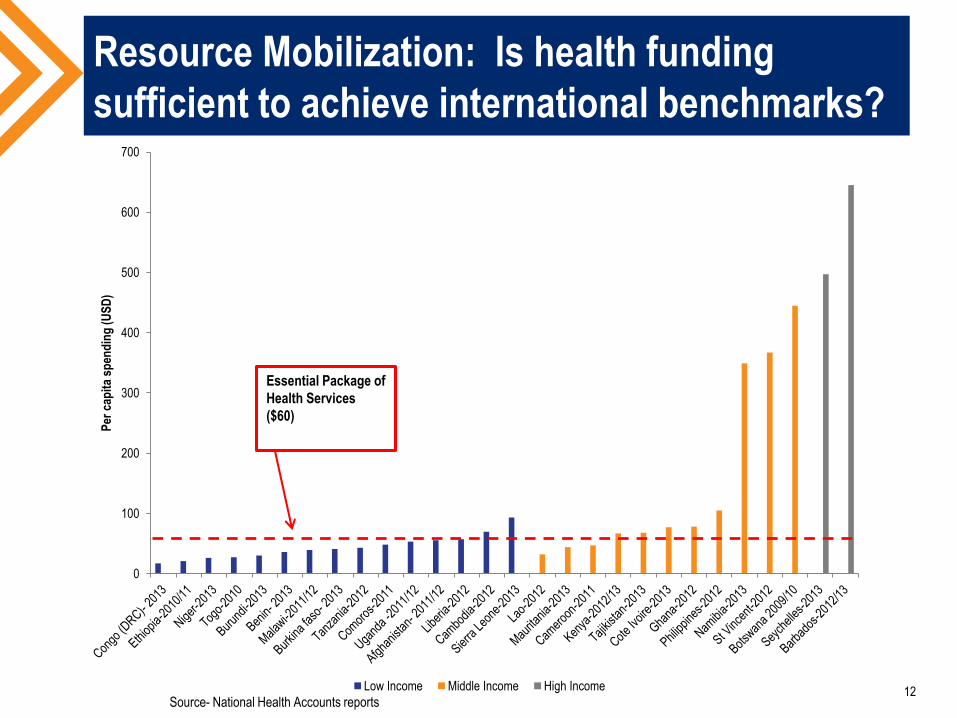
Resource Mobilization: Is health funding
sufficient to achieve international benchmarks?
Essential Package of
Health Services
($60)
12 Source- National Health Accounts reports

HEALTH FINANCING FUNCTION #2:
RISK POOLING
13

What are the opportunities to increase
pooling of health resources?
14
0%
10%
20%
30%
40%
50%
60%
70%
80%
90%
100%
Financing scheme spending by country
OOP Voluntary insurance Government Other
Source- Countries National Health Accounts reports

Are households incurring catastrophic
spending?
0
10
20
30
40
50
60
70
80
Per
cen
tag
e o
f O
OP
sp
end
ing
OOP spending as % of total health spending
Low income Middle income High incomeSource- National Health Accounts reports
15
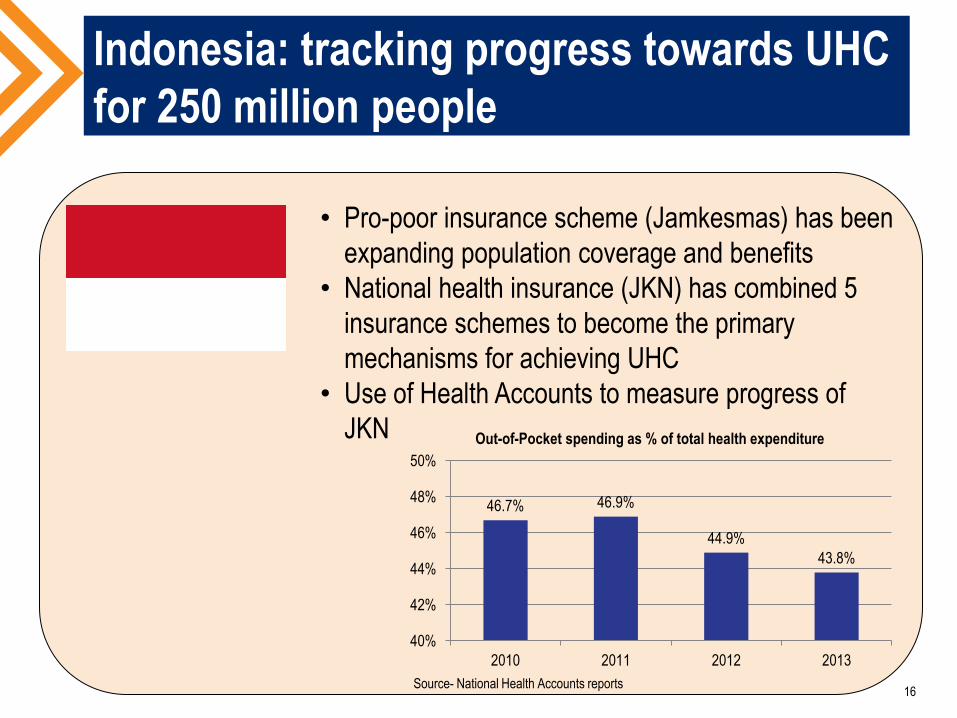
Indonesia: tracking progress towards UHC
for 250 million people
• Pro-poor insurance scheme (Jamkesmas) has been
expanding population coverage and benefits
• National health insurance (JKN) has combined 5
insurance schemes to become the primary
mechanisms for achieving UHC
• Use of Health Accounts to measure progress of
JKN
46.7% 46.9%
44.9%
43.8%
40%
42%
44%
46%
48%
50%
2010 2011 2012 2013
Out-of-Pocket spending as % of total health expenditure
Source- National Health Accounts reports 16
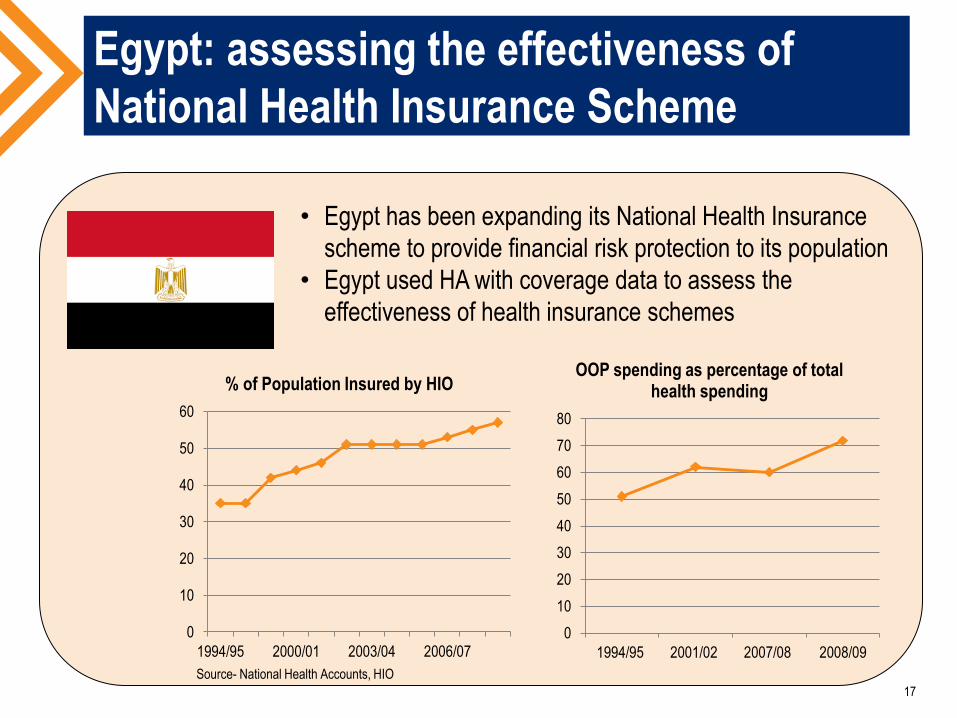
Egypt: assessing the effectiveness of
National Health Insurance Scheme
0
10
20
30
40
50
60
1994/95 2000/01 2003/04 2006/07
% of Population Insured by HIO
0
10
20
30
40
50
60
70
80
1994/95 2001/02 2007/08 2008/09
OOP spending as percentage of total health spending
• Egypt has been expanding its National Health Insurance
scheme to provide financial risk protection to its population
• Egypt used HA with coverage data to assess the
effectiveness of health insurance schemes
17
Source- National Health Accounts, HIO

HEALTH FINANCING FUNCTION #3:
PURCHASING
18
Health Accounts and purchasing function
Does spending respond to the disease burden?
Use of spending, disease burden data, and costing data
Is spending aligned with national priorities?
Are there opportunities to increase the efficiency of
spending on inputs?
Spending data can be compared with output and outcome data to
Identify areas of concern e.g. potential efficiency challenges
Compare spending and health performance with peer countries
19
Namibia: Using HA to reallocate resources
to disease burden
• Reproductive health is stated-priority for Namibia in
order to stop increasing trend of maternal mortality
• 2008/09 Health Accounts: 10% of spending on RH
vs. 29% for HIV/AIDS
• Using Health Accounts for greater advocacy led to
450% increase in spending on RH (2012/13 Health
Accounts)
20
Caribbean: Using Health Accounts to
reallocate resources to national priorities
• Prevention spending = 3% of spending in Barbados
(2012-13 HA) and 4% in Dominica (2011-12 HA)
• NCDs account for approx. 80% of deaths
• Treatment of increasing burden of NCDs is
unsustainable → prevention is crucial
• In 2015, both countries introduced 10% excise tax
for sugary drinks (Barbados, Dominica) and sugary
foods (Dominica)
• Revenues raised will be allocated to health sector,
including health prevention and promotion
21
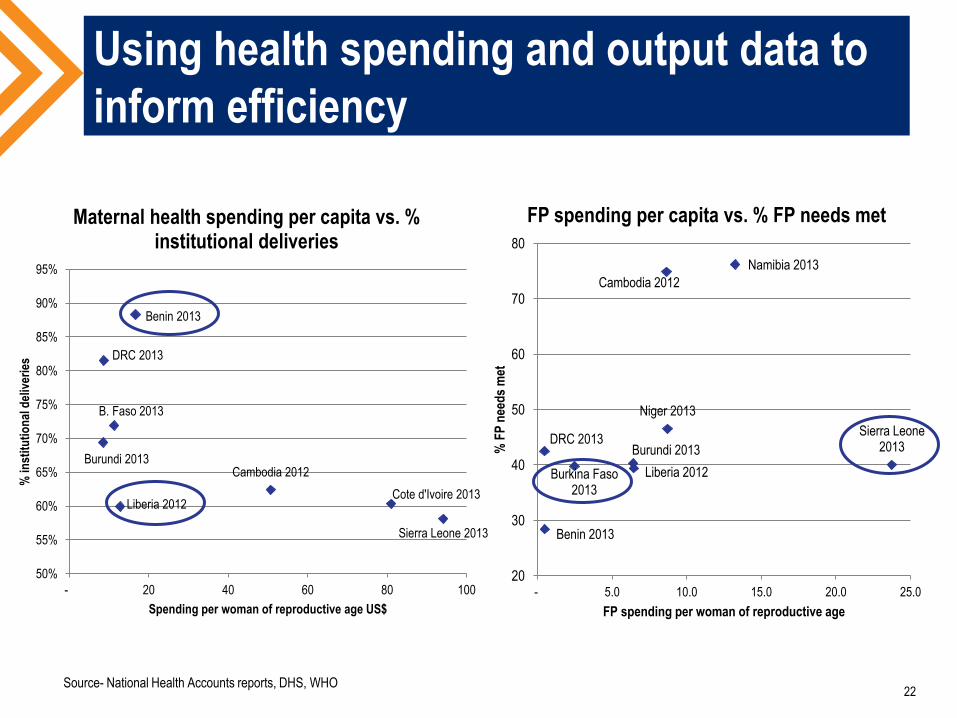
Using health spending and output data to
inform efficiency
Sierra Leone 2013
Cambodia 2012
B. Faso 2013
Burundi 2013
Benin 2013
DRC 2013
Cote d'Ivoire 2013 Liberia 2012
50%
55%
60%
65%
70%
75%
80%
85%
90%
95%
- 20 40 60 80 100
% in
stit
uti
on
al d
eliv
erie
s
Spending per woman of reproductive age US$
Maternal health spending per capita vs. % institutional deliveries
Sierra Leone 2013
Cambodia 2012
Burkina Faso 2013
Namibia 2013
Burundi 2013
Benin 2013
DRC 2013
Niger 2013
Liberia 2012
20
30
40
50
60
70
80
- 5.0 10.0 15.0 20.0 25.0
% F
P n
eed
s m
et
FP spending per woman of reproductive age
FP spending per capita vs. % FP needs met
22 Source- National Health Accounts reports, DHS, WHO

24
Karishmah
Bhuwanee Heather
Cogswell
Tesfaye
Dereje
Q&A

Resources: www.hfgproject.org
Briefs
Follow the Money: Making the Most of Limited Health Resources
Policy Primer: Using Health Accounts to End Preventable Child and Maternal Deaths
Production and Use of Health Accounts in India: What Can We Learn from the Experience so Far?
System of Health Accounts 2011: What is SHA 2011 and How Are SHA 2011 Data Produced and Used?
System of Health Accounts (2011) and Health Satellite Accounts (2005): Comparison of Approaches
Tracking Urban Health Expenditures – Preliminary Results from Secondary Analysis of Bangladesh National Health Account
Understanding Health Accounts: A Primer for Policymakers
Health Accounts Reports
Comptes de la Sante au Burundi: 2012-2013
Dominica 2010-2011 National Health Accounts and HIV Subaccounts
Namibia 2012-13 Health Accounts Report
Saint Kitts and Nevis 2011 National Health Accounts and HIV Subaccounts
Questions? Email us at: [email protected].
25
Thank You!
26
www.hfgproject.org
@HFGProject