national best practices to inform the scope of a health
TRANSCRIPT

National Best Practices to Inform the Scope of a Health Analysis Tool for the San Diego Region
Prepared for: San Diego Association of Governments (SANDAG) County of San Diego, Health and Human Services Agency Prepared by: Human Impact Partners

2
TABLE OF CONTENTS
1. Introduction 5
1.1 Purpose of the Best Practices Report 5
1.2 Brief History of Indicator System Development 6
2. Health Analysis Tool Background 8
2.1 San Diego Association of Governments and Health and Human Services
Agency Partnership 8
2.2 Goals of the Tool 8
2.3 Vision for the Tool 8
3. Best Practices Review Methods 10
4. Best Practices Review Findings 11
4.1 Overview of Indicator Systems 12
4.1.1 Indicator System Goals and Purposes 15
4.1.2 Users and Applications 16
4.2 Processes 19
4.2.1 Indicators 19
4.2.2 Outreach 22
4.2.3 Operations 23
4.3 Benefits/Challenges of Indicator Systems 28
4.3.1 Benefits 28
4.3.2 Challenges 29
5. Health Analysis Tool Scope Approaches 32
5.1 Approach 1: Develop a List of Indicators and Recommendations for a Process
to Apply Them 32
5.1.1 What It Is 32
5.1.2 Relevant Indicator Systems 32
5.1.3 What Would Need to be Done 33
5.1.4 Benefits and Drawbacks 34
5.2 Approach 2: Affiliate with Another Indicator System – Use An Existing Tool 34
5.2.1 What It Is 34
5.2.2 Relevant Indicator Systems 34
5.2.3 What Would Need to be Done 35
5.2.4 Benefits and Drawbacks 36
5.3 Approach 3: Develop A San Diego-Specific Tool Tailored To Meet Regional
Vision And Goals 36
5.3.1 What It Is 36
5.3.2 Relevant Indicator Systems 37
5.3.3 What Would Need to be Done 37
5.3.4 Benefits and Drawbacks 37

3
5.4 Approach 4: Integrate Social Determinants Of Health In The Local Planning Process 38
5.4.1 What It Is 38
5.4.2 Relevant Indicator Systems 39
5.4.3 What Would Need to be Done 39
5.4.4 Benefits and Drawbacks 40
6. Conclusions And Next Steps 44
Appendix A: Indicator System Descriptions 45
Appendix B: Expanded Findings From Project Interviews 53
Appendix C: Interview Instrument 67
List of Figures
Figure 1. Years indicator systems were established 14
Figure 2. Indicator system funding sources 23
List of Tables
Figure 1. Years indicator systems were established 14 Figure 2. Indicator system funding sources 23

4
Primary Authors
Human Impact Partners
Marnie Purciel-Hill
Casey Tsui
Lili Farhang
Acknowledgements
This research was made possible by Healthy Works, a countywide initiative making systems and
environmental changes that promote wellness and address the nationwide obesity epidemic. This
project was made possible by the Centers for Disease Control and Prevention through the County of
San Diego, Health and Human Services Agency. This report was supported by the Cooperative
Agreement Number 1U58DP002496-01 from the Centers for Disease Control and Prevention
through the County of San Diego, Health and Human Services Agency. Its contents are solely the
responsibility of the authors and do not necessarily represent the official views of the Centers for
Disease Control and Prevention.
Human Impact Partners would like to thank the following contributors to this report for sharing
their valuable experience and for taking the time to inform this effort. The insight they provided
enabled this report and will inform the direction of a health analysis tool in the San Diego region.
Boston Metropolitan Area Planning Council
Carson Research Consulting
City of Seattle Department of Planning and Development
Healthy Housing Solutions, Inc.
Metropolitan Philadelphia Indicators Project
Mithun, Inc.
Oregon State University
Portland State University's Institute of Portland Metropolitan Studies
San Francisco Department of Health, Program on Health Equity and Sustainability
American Public Health Association
The Boston Foundation
The California Department of Public Health
The City of Minneapolis, Office of Sustainability
The San Francisco Bay Area Metropolitan Transportation Commission

5
1. Introduction
There is increasing recognition that health should be considered in land use and transportation
decision-making. In response, many state, regional, and local level planning authorities have begun
including public health goals and criteria in policy-making and project planning. The public health
community also has begun to partner with planners to integrate health considerations in the
decision-making process. These efforts aim to better understand the relationships between built,
social, and economic environments and health and to use this information to improve
neighborhood conditions to better support health.
To accomplish these goals, decision-makers need data that is accessible, timely, and relevant. This
need has led to the development of community-level indicator systems and tools to incorporate into
planning processes. Indicator systems are curated collections of research metrics that are grouped
into categorical domains, are selected based on a clearly defined framework of purpose, and which,
as a whole, can be used to inform a variety of decision-making processes.
Recent interest in Health Impact Assessments (HIA) is one example of the use of indicators and a
framework for understanding neighborhood influences on health to inform land use,
transportation, and other planning-related decisions. HIA is a tool that uses a collaborative process
for applying health and health-related data to a specific project, plan, or policy proposal to
understand its effects on health, and to generate a set of recommendations to improve the
proposal. The use of indicator data is a key part of the assessment.
Health indicators also can be incorporated at a variety of points in the planning process, not only in
relation to specific proposals as mentioned above in HIA. For example, analyses using indicators can
be used to target interventions to particular groups of people, to set priorities for transportation
projects, or to inform zoning policies that facilitate the establishment of healthy food or that limit
permitting of new fast food outlets.
Combined with protocols for integrating indicator data in decision-making, such as HIA and other
health analysis tools, indicator systems provide a rigorous, collaborative, framework-based,
organized structure for data that decision-makers can use to better understand the effects of their
work.
1.1 Purpose of the Best Practices Report
This Best Practices Report is part of a larger three-year effort to inform the consideration of health
in the evaluation of plans, projects, and programs for the San Diego Association of Governments
(SANDAG) and the San Diego County Health and Human Services Agency (HHSA). The Best Practices
Report consists of a best practices review, which is the first step in determining a scope for a
San Diego Regional Health Analysis Tool. The concept of a health analysis tool for the San Diego
region originated from the partnership of SANDAG and HHSA as a resource for local agencies, tribal
governments, and community-based organizations. A five-year Community Transformation Grant
from the Centers for Disease Control supports this work. A steering committee, consisting of
members of SANDAG, HHSA, and Human Impact Partners is directing this best practices review and
the development and consideration of approaches for the scope of the health analysis tool.
6
The primary goal of this initial report is to summarize a variety of characteristics related to existing
indicator systems, and to provide approaches and considerations relevant for decisions about future
directions for a San Diego Regional Health Analysis Tool.
1.2 Brief history of indicator system development
In the United States, measuring aspects of the
population dates back to the British colonies in the
early 1600s, when birth and death certificates began
to be kept. The first Federal Census was taken in
1790, and over time has expanded to respond to the
growing need for population and economic statistics
relevant for planning and policy-making.
One early example of the measurement of
community characteristics was the Pittsburgh Survey.
Initiated in 1906 with funding from the Russell Sage
Foundation, it was especially concerned with the
working conditions of the urban poor. The survey
asked a number of questions about the social and
economic status of people from diverse communities,
such as people with families, steel workers, and
women. This effort paved the way for the
consideration of a broader range of social
characteristics as relevant for human wellbeing.
Over time, a greater understanding of the social
determinants of health has motivated planners,
public health practitioners, and communities to work
together to address health by advancing policies that
shape our environments. The development of health
objectives has allowed collaborators to track policy
progress towards health improvements.
One notable early example of a comprehensive
compiled list of health objectives is Healthy People
2000 (HP2000), which was released in September
1990 by the United States Department of Health and
Human Services and was born out of the 1979
Surgeon General’s Report titled, “Healthy People:
The Surgeon General’s Report on Health Promotion
and Disease Prevention.” HP2000 established clear
nationwide objectives that would set the priorities of
the Department for the next ten years. Since then,
the Healthy People working group has evaluated the
nation’s performance and updated these objectives
Definitions
An indicator is a clearly defined measure that
can be used to compare the relative state or
level of something at a specific point or period
of time.
Data, which are facts and statistics collected
together for reference or analysis, are the
values assigned to an indicator.
The framework of an indicator system is the
structured theoretical rationale behind the
indicator system’s creation, its goals, and how it
intends to inform policy and planning decision-
making in order to achieve its goals.
A domain is a grouping of indicators based on
a common relationship or theme, such as
transportation, housing, or education, and is
meant to represent the major areas of research
in the indicator system’s framework.
An indicator system is the total list of indicators
and the domains in which they are grouped,
both of which are created according to a
specifically agreed-upon framework for what
the indicators are meant to assess. This list of
indicators is the minimum element that
establishes an indicator system, and an
indicator system may or may not provide data
that is associated with the indicators.
For context within indicator systems, an index is
a single quantitative summary score that is
assigned to a given geographic area to
represent the overall social, physical, and
economic environment relevant for human
health and wellbeing. An index is created by
evaluating the individual component indicators
and applying statistical weighting methods to
represent the relative importance of each
indicator in the final aggregated score. The
creation of indexes allows the indicator system
to compare and rank the relevant geographic
areas based on this summary score.

7
every ten years. Public health practitioners have used the Healthy People objectives as a basis for
partnerships with planning, policy, and advocacy organizations.
While HP2000 was a successful early example of setting health objectives at the national level, more
recently there has been strong interest from local jurisdictions to develop systems that they can use
to influence community development and policy.
The formation of the National Neighborhood Indicators Partnership (NNIP), established in 1995 as a
collaboration of the Urban Institute and local partners to foster the development and use of
neighborhood-level data for use in community policy and planning processes, has provided a forum
for organizations that are interested in applying this work to their local contexts. Similar to the
NNIP, the Community Indicators Consortium is another national network for those developing
indicator systems at the local level.
8
2. Health Analysis Tool Background
2.1 San Diego Association of Governments and San Diego County Health and Human Services Agency partnership
In March 2010, the San Diego Association of Governments (SANDAG) and the San Diego County
Health and Human Services Agency (HHSA) partnered on projects related to regional planning,
active transportation, and Safe Routes to School to address health risk behaviors that contribute to
chronic disease through policy, systems, and environmental change. These projects, which made up
Phase I of the Healthy Works program at SANDAG, were supported by a $3 million contract with
HHSA that was funded through the Centers for Disease Control’s (CDC) Communities Putting
Prevention to Work program.
In September 2011, HHSA received another CDC grant, the Community Transformation Grant, and
chose to partner with SANDAG again to build on the successes of the Healthy Works Phase I
projects. SANDAG and HHSA initiated the Healthy Works Phase II projects in July 2012. The
San Diego Regional Health Analysis Tool is one project being explored as part of this partnership.
2.2 Goals of the tool
1. Create a tool to assist local and regional agencies and tribal governments to integrate health
considerations into its plans, projects, and programs.
2. Create a tool that is understandable to and usable for community members, academics, and
stakeholders to assess health determinants and outcomes related to planning.
3. Take advantage of work that has already been done in the San Diego region to accomplish
the above objectives, such as the Public Health and Wellness Policy Framework, the Healthy
Communities Atlas, and scenario modeling tools that SANDAG is exploring.
4. Create a tool that is easy to use and can be modified over time.
5. Engage a broad range of stakeholders, including community members and academics, to
develop a framework and set of methodologies to build demand for the creation of a tool
and to ensure its use over time.
2.3 Vision for the tool
The tool will initially be a framework to guide existing conditions analyses related to health and
planning, using a social determinants of health perspective, and will not include data.
Future phases of the tool will identify domains and indicators to include, incorporating a
prioritization of indicators for analysis; provide an empirical justification to support inclusion of the
selected indicators; provide a methodology for obtaining, processing, and analyzing data; identify
agencies/staff responsible for data; and identify data needs and sources of data and appropriate
next steps for a full development of the tool. The tool will also describe how it can be used for
different purposes.
The primary users of the tool will be local and regional planning agencies. Secondary users will
be community organizations, other government agencies, tribal governments, institutions
(e.g., hospitals), and academics.

9
The tool is envisioned to be particularly useful in planning processes (including transportation and
land use planning), as well as project permitting and site-specific development. Applications for
community organizations and other secondary users may be identified through outreach efforts.
The tool will consider and integrate where possible with the following efforts:
The SANDAG Public Health and Wellness Policy Framework and Existing Conditions Report
The SANDAG Healthy Communities Atlas
The United States Department of Housing and Urban Development’s Healthy Communities
Index (The index is part of the Healthy Communities Transformation Initiative)
The SANDAG Regional Comprehensive Plan Biennial Performance Monitoring Report
California Department of Public Health, Healthy Communities Data and Indicators Project
The United States Department of Transportation and the CDC Transportation and Health Tool,
with support from the American Public Health Association
The tool also should aim to integrate with the following scenario modeling tools:
The California Office of Planning and Research’s Urban Footprint
The California Department of Public Health’s Integrated Transport and Health Impact Modeling
Tool
The SANDAG Activity Based Model
The extent to which the Health Assessment Tool integrates with these tools may be defined during
the scoping and outreach process.

10
3. Best Practices Review Methods The list of indicator systems to examine (see Table 1) was developed based on the indicator systems
that the Housing and Urban Development Healthy Communities Transformation Initiative
identified. The indicator systems list was then expanded by referencing a database of indicator
projects available through the Community Indicators Consortium. This database yielded a list of
285 potentially relevant indicator projects. After visiting these projects online, a large portion of
indicator systems were removed, resulting in an intermediate list of 70 projects for which a deeper
evaluation was conducted. From this list, 20 indicator systems were presented to the project
steering committee, which then prioritized 13 indicator systems for further analysis and interview.
The findings of this review were generated by reviewing reports and online materials for each of
the indicator systems. In addition, interview questions were developed with the following thematic
sections: 1) purpose and application of the indicator system; 2) process to develop it; and
3) reflections on the process. See Appendix C for the interview instrument.
Interviews were conducted between August 20, and September 13, 2013. Interviews were primarily
conducted over the phone; one exception was Metropolitan Philadelphia Indicators Project, who
was interviewed over the phone and also submitted written responses to the interview questions.
Because findings represent both sources of information—reviews of available materials and
interview responses—the following report refers to the subjects of the analysis as “indicator
systems,” or “systems,” and “respondents.” In addition, the indicator systems referred to herein are
more than just indicator systems – they also are tools for the analysis of health in the context of
project, plan, program, and policy decision-making. For this reason, both of the terms “indicator
system” and “tool” are used throughout.

11
4. Best Practices Review Findings
Table 1 lists the 13 indicator systems for which more information was gathered and interviews were
conducted. This section describes the findings related to these indicator systems and what each are
meant to accomplish; the processes undertaken to develop and maintain the systems, to market and
promote the use of the systems, and to fund them; and the benefits and challenges faced in the
development of the efforts.
Table 1. Indicator systems prioritized for analysis
Nu
mb
er
Ind
icato
r syst
em
nam
e
Cre
ato
r(s)
Data
on
lin
e
In d
evelo
pm
en
t
Co
uld
aff
ilia
te/
ad
ap
t
Nu
mb
er
of
ind
icato
rs
Co
vera
ge
Sm
all
est
geo
gra
ph
ic s
cale
avail
ab
le*
1 Baltimore DataMind Carson Research
Consulting Y N N
About
100 Metro Census tract
2 Boston Indicators
Projects (2 projects –
city and metro area)
The Boston
Foundation, Boston
Metropolitan Area
Planning Council
(MAPC)
Y N N About
150
City/
Metro Census tract
3 Greater Portland
Pulse (GPP)
Portland State
University Y N N
About
70 Metro Census tract
4 Healthy
Communities Atlas
San Diego
Association of
Governments
(SANDAG),
County of San
Diego Health and
Human Services
Agency
N N NA About
20 Metro
Census block
group
5 Healthy
Communities Data
and Indicators
Project (CDPH HCI)**
California
Department of
Public Health
(CDPH)
Y Y Y 60 State of
California Census tract
6 Housing and Urban
Development
Healthy
Communities Index
(HUD HCI)**
United States
Department of
Housing and Urban
Development
(HUD)
N Y Y About
40 United States TBD
7 Mariposa Healthy
Living Toolkit
Denver Housing
Authority, Mithun,
Inc.
N N Y 27 Neighborhood Neighborhood

12
8 Metropolitan
Philadelphia
Indicators Project
(MetroPhilaMapper)
Metropolitan
Philadelphia
Indicators Project
(MPIP)
Y N N
More
than
300
Metro Census tract
9 Minneapolis
Sustainability
Indicators
City of
Minneapolis, Office
of Sustainability
Y N N 26 Metro City
10 Oregon Rural
Communities
Explorer (Oregon
RCE)
Oregon State
University Y N N
More
than
200
State of
Oregon Census tract
11 Seattle Healthy
Living Assessment
(SHLAT)
City of Seattle
Department of
Planning and
Development
N Y 36 Neighborhood Neighborhood
12 The Sustainable
Communities Index
(SCI)
San Francisco
Department of
Public Health
(SFDPH), Program
on Health Equity
and Sustainability
Y N Y 89 City Census tract
13 Transportation and
Health Tool (THT)**
United States
Department of
Transportation
(DOT)/Center for
Disease Control
(CDC)/American
Public Health
Association (APHA)
N Y Y About
20 Region/State Region
* Not all indicators in the system are available at this scale
** Tools in development that may be adjusted and refined
4.1 Overview of indicator systems
The majority of the indicator systems examined were online systems of indicators with data
available in graph and/or map formats. Examples of these include Baltimore DataMind, Boston
Indicators Projects, GPP, CDPH HCI, MetroPhilaMapper, Minneapolis Sustainability Indicators,
Oregon RCE, and the SCI.
Three “paper” tools were examined. These tools provide data in different ways including paper
format, a description of processes for doing assessments, methods of processing data, and/or
applications for the health analyses. Examples of these included Mariposa Healthy Living Toolkit,
the SANDAG Healthy Communities Atlas, and Seattle’s Healthy Living Assessment. Although data
were not presented in the reports produced by Mithun, Inc., and City of Seattle Department of
Planning and Development, data were collected for individual neighborhoods for specific planning
processes.

13
Three tools that are currently in development and that aim to facilitate the development of, or
access to, indicators and data for a variety of jurisdictions also were examined. These were included
in the analysis because they are potential affiliations that could catalyze efforts to develop a
tool in the San Diego region. Examples of these tools include HUD’s HCI, CDPH’s HCI, and
DOT’s/CDC’s/APHA’s THT.
The majority of the systems that feature online interfaces were built on a pre-existing web
application programming interface, such as PolicyMap (Baltimore DataMind), Bing Maps (Oregon
Rural Communities Index), or others. Of the online indicator systems, seven of them allow users to
download raw data directly from the site.
There was a range in the types of entities that produced these tools, and there were several tools
that included partnerships between different types of organizations or institutions. Table 2 shows
the distribution of types of organizations that have had a primary role in developing the indicator
system.
Table 2. Types of organizations developing indicator systems
Pla
nn
ing
ag
en
cy
Pu
blic
healt
h a
gen
cy
Oth
er
go
vern
men
t
ag
en
cy*
Aca
dem
ic i
nst
itu
tio
n
Pri
vate
org
an
izati
on
/
Fo
un
da
tio
n
Co
mb
ina
tio
n o
f m
ore
tha
n o
ne
typ
e
Baltimore DataMind x
Boston Indicators Projects x x x
GPP x
Healthy Communities Atlas x x x
CDPH HCI x
HUD HCI x
Mariposa Healthy Living Toolkit x x x
MetroPhilaMapper x
Minneapolis Sustainability Indicators x
Oregon RCE x
SHLAT x x x
SCI x
THT x x x x
Number of systems 4 5 5 2 4 5
*Other Public Agency does not include planning or public health
There was a range in the number of years the different indicator systems have been in existence.
Figure 1 displays this information.

14
Figure 1. Years indicator systems were established
“Mature” systems represented those that are maintaining and updating data, outreach, and tool
applications and have been doing so for longer than most of the tools that were examined.
“Developing” tools had their systems and data in place and were conducting data updates, but
were still investing more effort and time in outreach and developing local partnerships. The tools
that were “currently not maintained” may not have plans to update data, but they are still used
and applied locally. “Initial development” tools were those that are in the process of being
developed and have yet to release their first iteration.
The start and end years of the indicator systems are rough estimates. Start dates may vary between
when funding was first secured to when the first iteration of the tool was released. For tools that
THT
HUD HCI
CDPH HCI
Baltimore DataMind
Healthy Communities Atlas
SHLAT
GPP
Mariposa Healthy Living Toolkit
SCI
Oregon RCE
MetroPhilaMapper
Minneapolis Sustainability Indicators
Boston Indicators Projects
1997
1998
1999
2000
2001
2002
2003
2004
2005
2006
2007
2008
2009
2010
2011
2012
2013
Mature Developing Initial Development Currently Not Maintained

15
were not currently maintained, end dates have been estimated because it is not known when
funding was completed.
4.1.1 Indicator system goals and purposes
The research found a range of goals and purposes for the creation of the various indicator systems.
Table 3 displays the self-reported motivations that were described for each indicator system.
There was much overlap in the purpose of various tools. The purposes most frequently cited were
to: track progress on planning goals or strategic planning processes (some specifically called this
performance tracking); translate findings into action to improve health, or inform project, program,
and policy decisions; and evaluate the impacts of plans, projects, policies, and environmental
changes on community health and health determinants. There were several tools that stated their
basic motivation was to make data available in a systematic and evidence-based way. Some also
mentioned the collaborative benefits of their tools.
Table 3. Goals and purposes cited by respondents
Goal or purpose
(sorted by frequency of mention) Systems sited
Number of
systems
Track progress on planning goals or strategic
planning processes.
GPP
Healthy Communities Atlas
Metro Boston DataCommon
MetroPhilaMapper
Minneapolis Sustainability Indicator
SCI
6
Translate findings into action to improve
health. Inform project and policy decisions
(e.g., targeting and prioritizing geographic
areas; and identifying, developing, prioritizing,
and funding strategies for addressing issues).
CDPH HCI
Healthy Communities Atlas
Mariposa Healthy Living Toolkit
SHLAT
SCI
THT
6
Evaluate the impacts of plans, projects, policy,
and environmental changes on community
health.
Boston Indicators Projects
CDPH HCI
GPP
HUD HCI
Mariposa Healthy Living Toolkit
SCI
6

16
Create a consistent, systematic, and/or evidence
based set of indicators that all communities in
one jurisdiction can use, or that different
jurisdictions can use.
CDPH HCI
GPP
HUD HCI
SCI
THT
5
Make data available. Democratize access to
information. Foster public discourse.
Baltimore DataMind
Boston Indicators Project
Oregon RCE
MetroPhilaMapper
4
Strengthen collaborations within or between
sectors.
Boston Indicators Projects
SCI
SHLAT
THT
4
Make comparisons between smaller
communities or whole jurisdictions.
Healthy Communities Atlas
THT
2
Understand how indicators do or don’t reflect
peoples’ lived experience in their communities.
Identify assets in communities that can be
leveraged.
SHLAT 1
Pool resources. GPP 1
4.1.2 Users and applications
Respondents listed a wide range of users for the indicator systems, including planners, public health
departments, other government agencies, academic institutions, and community/advocacy
organizations. Every system was accessed by multiple types of users; the most common types cited
were planning departments, other government agencies or local officials, and community/advocacy
organizations.
Although many respondents cited a focus on community representatives and organizations, this
user group was in several cases considered secondary (with a primary focus on planning and other
government agencies and officials) and also not well understood in terms of how they would or did
apply the tool, and how much they used it.
All respondents felt their indicator systems could be used to simply access data or to create a
baseline conditions analysis. Consequently, these uses spanned almost all of the user categories, so
it was thought that planning, public health and other government agencies, and academic users
and community organizations might use the systems to create a baseline conditions analysis for a
variety of purposes. Overall there was overlap in applications of the tools across the user categories.
Table 4 lists the users and applications that respondents mentioned in reference to the different
indicator systems.

17
Table 4. Types of users and applications of the indicator system projects
Type of
user Applications cited Systems cited
Number
of
systems
Planning
departments
To simply access data
Create a baseline conditions analysis
Identify areas of need and target them
for interventions, including for
programs and services planning
Used as part of (and tailored for) a
specific planning process, including
identifying implementation actions
Track progress on goals/strategic
planning processes
Evaluate the impacts of plans, projects,
policy, and environmental changes
CDPH HCI
GPP
Healthy Communities Atlas
HUD HCI
Mariposa Healthy Living Toolkit
Metro Boston DataCommon
Minneapolis Sustainability
Indicators
Oregon RCE
SHLAT
SCI
10
Public health
departments
To simply access data
Create a baseline conditions analysis
Identify areas of need and target them
for interventions, including for
programs and services planning
Track progress on goals/strategic
planning processes
Evaluate the impacts of plans, projects,
policy, and environmental changes
Healthy Communities Atlas
CDPH HCI
HUD HCI
Mariposa Healthy Living Toolkit
Minneapolis Sustainability
Indicators
SHLAT
SCI
7
Other
government
agencies or
local officials
(not
including
planning and
public
health)
To simply access data
Create a baseline conditions analysis
Identify areas of need and target them
for interventions, including for
programs and services planning
Used as part of (and tailored for) a
specific planning process, including
identifying implementation actions
Track progress on goals/strategic
planning processes
Evaluate the impacts of plans, projects,
policy, and environmental changes
Boston Indicators Project
CDPH HCI
GPP
Healthy Communities Atlas
HUD HCI
Metro Boston DataCommon
Mariposa Healthy Living Toolkit
Minneapolis Sustainability
Indicators
Oregon RCE
SHLAT
SCI
THT
12
Academic
institutions
To simply access data
Create a baseline conditions analysis
GPP
MetroPhilaMapper
2

18
Community
groups,
advocacy
organizations,
and residents
To simply access data
Create a baseline conditions analysis
Used as part of (and tailored for) a
specific planning process, including
identifying implementation actions
Evaluate the impacts of plans, projects,
policy, and environmental changes
Development and assessment of grant
applications
Make the case to decision-makers for
investments or decisions
Boston Indicators Project
GPP
Healthy Communities Atlas
HUD HCI
Mariposa Healthy Living Toolkit
Metro Boston DataCommon
MetroPhilaMapper
Minneapolis Sustainability
Indicators
Oregon RCE
SHLAT
SCI
12
Others
(media,
foundations,
other data
providers)
To simply access data
Development and assessment of grant
applications
Boston Indicators Project
Metro Boston DataCommon
MetroPhilaMapper
Oregon RCE
SCI
5
Specific users were mentioned in each of the categories presented above. For the planning
department users, four respondents specifically mentioned regional planning agencies, three
mentioned city planning agencies, and two mentioned other local planning jurisdictions.
For the public health department users, respondents mentioned city and county health departments
as well as state-level health agencies.
For the other government agencies or local officials (not including planning and public health),
respondents specifically mentioned civic leaders and elected officials, councils of government, city
managers, air district staff, housing departments, Federal Emergency Management Agency
planners, transportation professionals, local and regional transportation authority staff, public
works department staff, parks department representatives, police departments, and the
department of the environment.
For community groups, advocacy organizations, and resident users, respondents mentioned
Safe Routes to School and other bike and pedestrian advocates, Climate Plan, United Way,
community development corporations, children and youth advocates and commissions,
environmental advocates, labor organizations, and community-based organizations in general.
It is worth mentioning that the term “user” had different meanings for different tools. In some
cases it might have referred to people who access the data, while in other cases it was indicative of
a more structured partnership or active role in applying the indicator data to a particular planning
process, which was the case with the Seattle Healthy Living Assessment Tool and the community
organizations that participated in the implementation of the SHLAT.
The HUD HCI representatives mentioned their users were hypothetical at this point and dependent
on how the pilot jurisdiction uses and promotes it. One reported key goal of their pilot is to see
how the tool will be used. The different pilot sites are listed above.
19
Frequency of Application
There were essentially three categories of responses to the question of how frequently the tools are
used. All systems that had data available online were used, and some fairly frequently, but
respondents all spoke to the desire for the tools to be used more often. Tools that had been used in
a specific planning process felt this use was meaningful and worthwhile for participants, and that
these efforts would yield additional usage in some form. Systems that are currently in development
had not been applied, and therefore were not “used.”
In terms of tracking usage, several respondents mentioned using, or planning to use, some form of
online tracking, such as Google Analytics, to monitor usage. One indicator system, as part of their
annual report to their funder, conducted their own survey of users who had some level of
involvement with the tool to assess knowledge and usage of the site. The results indicated a
favorable impression among users, 80 percent had heard of the site and of these 70 percent had
used it.
Respondents reported several different strategies to increase usage including the development of
custom online portals with key partners, forming partnerships around specific indicators, publishing
reports to highlight progress and key indicators, and planning pilot projects to engage users and
refine their tools.
4.2 Processes
4.2.1 Indicators
Indicator selection
There was a range in how extensive the processes were to generate and prioritize lists of indicators.
Several respondents relied on either internal staff or smaller groups of experts (often with review
by an advisory or stakeholder group) to decide what indicators to include and exclude. Examples of
these are: the Baltimore DataMind, Healthy Communities Atlas, MetroPhilaMapper, Oregon RCE,
and SHLAT. The SHLAT is part of a larger specific planning process where the community’s
perspective on the indicators is obtained and incorporated in the process.
The following tools took their process one step further by holding a series of meetings with
advisory members where the members were responsible for a higher level of input and involvement
in the indicator selection process: Boston Indicators Project, Metro Boston DataCommon, GPP, CDPH
HCI, HUD HCI, Mariposa Healthy Living Toolkit, Minneapolis Sustainability Indicators, SCI, and THT.
HUD’s HCI and the Metro Boston DataCommon process seem to be the most extensive of these in
terms of the number of people giving input and the amount of time devoted to the process.
The Mariposa Healthy Living Toolkit process also was different as it relied on an existing tool (the
SCI) and elaborated on this through the stakeholder engagement for an active planning process.
Similarly, CDPH’s HCI process relied on other indicator systems and stakeholder engagement
processes, and these indicators may continue to be refined as they are piloted.

20
A majority of the selection processes involved literature reviews to support decisions about which
indicators to include. In addition, respondents reported that they used a number of criteria to make
decisions to refine indicators. There was significant overlap in the following criteria that were cited
(note, these are not in order of importance):
Data availability at the desired geographic scale and coverage
Research evidence to support the connection between the indicator and population health
outcomes
Data validity and reliability
Data updated and available on an ongoing basis
Public source for data
Policy relevance or actionability, of the indicator
Community relevance
Ability to stratify data by race/ethnicity
Indicator domains
An indicator domain matrix was created (see Table 9 in Appendix A) that presents a higher-level
overview of the types of indicators included in each of the systems that were researched. This is a
more manageable way to understand the types of issues considered by the system, rather than
presenting all of the individual indicators included in a system.
Reference domains were created by matching each system’s major domains with the broad domains
of health, economy/employment, education, housing, transportation, environment, crime/safety,
social cohesion/participation, food/food access, parks/open space, arts and culture, and access to
public resources. These reference domains were created initially by looking at the domains used by
all the systems and trying to create simplified and/or consistent and encompassing categories. The
original domain names were retained in the cells of the table for reference.
Most of the indicator systems had a large majority (having at least 9 of the 12) of the reference
domains included in their systems, but there were some exceptions. For example, the Transportation
and Health Tool was the most limited in terms of domains, as it only had two domains. The
Baltimore DataMind system, in its current state, also was fairly limited with four domains.
Many systems featured domains that included several of the reference domains, such as the CDPH
HCI, which grouped their indicators at a slightly higher level than the other systems. For example,
their indicator of “Meets Basic Needs for All” encapsulates several domains, such as housing,
transportation, and food.
On the other hand, many tools featured several domains that addressed different facets of the
same reference domain, such as the Minneapolis Sustainability Indicators and its coverage of the
environmental domain.

21
Collecting, processing, and updating data for indicators
All respondents said they relied on available data, like the United States Census, and when possible
data from other city agencies. Several systems maintained an on-going regular update cycle (Boston
Indicators Projects, GPP, CDPH HCI, Minneapolis, SCI) while other systems were either updated on a
less frequent or as needed basis (Baltimore DataMind, Healthy Communities Atlas, Mariposa), or
have ceased to be updated (MetroPhilaMapper).
A majority of the respondents mentioned the importance of establishing relationships with others
who either have access to data, or expertise with it. For example, the SHLAT team mentioned the
importance of their relationship with the police precincts as critical for getting crime data.
University partners were also mentioned for their ability to facilitate access to data, technology, and
student assistance. Public health departments were mentioned as helping with obtaining and
processing data.
Very few respondents mentioned primary data collection, but this was not out of the realm of
possibility for some (Boston Indicators Projects, Mariposa, SHLAT). Some mentioned the importance
of documenting processes for the purposes of pilots and future updates (Healthy Communities
Atlas, HUD HCI, Mariposa, MetroPhilaMapper).
Most tools seemed to use relatively simple methods of compiling, storing, and uploading the data.
Several mentioned putting data into spreadsheets and then uploading it to an interface that in
some cases required some technical expertise, which the tools had set up. Two of the indicator
systems used a platform known as Weave, which is a visualization tool developed by the University
of Massachusetts at Lowell. It was reported that this tool required a bit of technological capacity,
and its features may or may not be necessary for all indicator systems. CDPH HCI is hoping to
automate several of the steps of data collection, processing, and mapping through Python scripts.
This will allow future updates of source data to be automatically and more systematically
incorporated into the tool’s online interface.
Most respondents said the updating process took time – ranging from more than a year to only
about a month or so. The amount of time may be related to the number of indicators included in
the system and the level of sophistication of data processing and estimation methods, as CDPH HCI
and the SCI mentioned employing more sophisticated methodologies to combine statistical areas
and weight variables. Minneapolis mentioned that maintenance and updating was part of their
departmental duties and that the updating process did not take a large amount of effort because
of the relationships they had developed with external agencies and partners that frequently share
their data with the Office of Sustainability.
Interface and back-end
With the exception of the Boston Indicators Projects, the tools that have an online presence
reported smaller scale operations in terms of the technical structures and designs associated with
the websites. For example, GPP had a graduate student design some of the interface, the CDPH HCI
is using their technically savvy project lead as the web master, the SCI and Oregon RCE had one
person that designed the structure of the data and the interface in collaboration with others on
staff, and MetroPhilaMapper and Minneapolis Sustainability Indicators also kept their development
in-house.
22
4.2.2 Outreach
There was no standard approach to conducting outreach to raise awareness of and educate users on
how to use the tools. Some offered trainings and created “how-to materials,” while others held
targeted meetings with agencies or information sharing events. Only a couple had an outreach
process that engaged a group of stakeholders over time in its use and sustainability. Greater detail
is provided below.
The Boston Indicators Projects, MetroPhilaMapper, Oregon RCE, and SCI offer trainings on the
tool to help people figure out how to use it and what can be done with it. The Metro Boston
DataCommon and the Oregon RCE put on the trainings frequently (once a month or more),
while the SCI does them about once a year. Training participants, as reported in interviews and
surveys, varied from community representatives, to academics, to agency and legislative staff.
Several respondents also mentioned proactively offering specific meetings to engage
community or government representatives in the tool or specific indicators (Boston Indicators
Projects, GPP, and SCI).
The Boston, GPP, SCI, and SHLAT tool respondents all emphasized the importance of creating
partnerships with other city departments and with community members and organizations for
the success, use, and longevity of the tools. In fact, Boston Indicators Projects reported that
support (including funding) has grown over the years because of changes in policies or
conditions on the ground that the indicators helped track. Boston respondents cited the
connection to a policy or outcomes as critical for the continued support of the tool.
Some said they either published or planned to publish how-to materials (GPP, CDPH HCI), and
others used social media to publish newsletters and information to engage users in the concept
of using data for civic change (Boston Indicators Projects, GPP, Oregon RCE, SCI).
Boston Indicators Projects, GPP, Oregon RCE, SHLAT, and the SCI respondents either hosted or
attended conferences to talk about their work and learn from others about how to improve
their tools.
Both the SHLAT and the Mariposa Healthy Living Toolkit were unique in that their tool is the
outreach process and therefore inherently engages stakeholders in its use and sustainability.
These tools included sections in their reports to explain how to use it.
A number of respondents mentioned that their outreach emphasis is planned to be through
pilot projects (Healthy Communities Atlas, CDPH HCI, HUD HCI), therefore it will be incumbent
on the pilot sites to reach out to constituents as part of their implementation.
The tools with the strongest focus on reaching community members and organizations include
Boston Indicators Projects, Oregon RCE, SCI, and SHLAT.
Several groups did not conduct formal outreach or training (Baltimore DataMind, Minneapolis
Sustainability Indicators).
While these findings did not point to a subset of tools with the most “effective” outreach processes,
generally speaking those who put effort into outreach and who employed a range of tactics saw

23
the greatest benefit from their outreach efforts and have managed to sustain their systems going
forward. This means employing several different strategies to not only have the tool used, but also
to build collaborations with a range of stakeholders. Respondents reported that engagement with
potential users and collaborations with a range of contributors can ensure the value, improvement,
and sustainability of the tool going forward. In addition, the tool most integrated with stakeholder
engagement as part of a planning process—the SHLAT—realizes a tangible outcome from their
outreach every time it is applied; namely, the development of the neighborhood plan. Because the
development of the plan touches multiple agencies, this tool also serves to bring different
disciplines together for the purpose of improving the tool and health.
4.2.3 Operations
Funding/Costs
Indicator systems were funded by a range of sources including federal grants, private foundations,
and existing general funds. Details are shown in Figure 2.
Figure 2. Indicator system funding sources
This information should be considered with the following caveats. It is particularly challenging to
create a cost continuum for all of the tools for several reasons. Tools were in various stages of
development and maintenance (see Figure 1), covered different sized geographic areas (everything

24
from neighborhoods to the entire country), provided data for a range of geographic or statistical
units (from region to Census block group), collected data for varying numbers of indicators (see
Table 1), and employed a range of outreach, education, and collaborative partnerships.
Tools were both publicly and privately funded and some were funded through a combination of
both sources. In reality Communities Putting Prevention to Work (CPPW)-funded projects are a part
of government grants, but they are highlighted here (and in Table 6 below) because of the
importance of this funding source for the development of these tools. Cost estimates were
unavailable for three of the respondents interviewed. On average the tools cost upwards of
$150,000 per year and the range in costs was from about $50,000 to more than $500,000 per year.
The only systems that cost less than $100,000 were two paper tools (SHLAT and the Mariposa
Healthy Living Toolkit), although, as noted in Table 6 below, these costs represent the initial tool
creation stage and may not reflect additional costs to apply the tool to a planning process. As an
outlier, the HUD HCI cost more than $500,000 per year, although this is a high-profile tool, with an
extensive indicator selection process and that has a national geographic scope.
Although interview questions did not address costs for initial implementation and maintenance
separately, because no cost estimates were given for the three longest standing indicator systems
(Boston Indicators Projects, Minneapolis Sustainability Indicators, and the SCI), the numbers in
Figure 1 primarily represent implementation costs. The Oregon RCE is one exception to this, as their
estimate represents costs to update data and to employ extensive outreach to engage and educate
users. This system illustrates the above listed challenge with attempting to create a straightforward
cost continuum for all the tools, as Oregon RCE’s maintenance phase may involve more outreach
than other tools. However, almost all respondents reported that the development phase was more
costly than the maintenance phase. It also should be noted that cost estimates reflect mostly staff
costs and do not include any data acquisition fees.
Staffing
Most of the systems were staffed at least part time by between three and five people. Table 5
provides staffing details for a combination of development and maintenance activities (interview
questions did not address staffing for initial implementation and maintenance separately).
Information in Table 5 may serve as a proxy for costs where estimates were not available, as these
figures were current reports from respondents.

25
Table 5. Indicator system staffing
Number of
full or part
time staff
System names (stage of development) Use/Used
Contractors
Use/Used
Interns or
Grads
Number
of
systems
1-2 people Baltimore DataMind (mostly implementation) Yes 2
CDPH HCI (implementation) Yes
3-5 people GPP (implementation and maintenance/outreach) Yes 9
Healthy Communities Atlas (implementation) Yes
HUD HCI (implementation) Yes
Mariposa Healthy Living Toolkit (implementation) Yes
MetroPhilaMapper (mostly implementation) Yes
Minneapolis Sustainability Indicators
(maintenance/outreach)
Yes
Oregon RCE (implementation and
maintenance/outreach)
Yes
SHLAT (implementation and outreach)
SCI (maintenance/outreach) Yes Yes
More than 5
people
Boston Indicators Projects (maintenance/outreach) Yes 2
THT (implementation) Yes
There were very few tools that employed a full time staff person devoted to the system (only GPP,
MetroPhilaMapper, Oregon RCE – see also Table 6). Most respondents reported that all staff that
worked on the project devoted only a portion of their time to it. In addition, six respondents
mentioned that they involved graduate students or interns in the work, and six mentioned that
they had hired external contractors.
HUD HCI and the THT both considered other collaborators in their response. The HUD project had a
committee of subject matter experts and a national advisory panel, which made the number of
people involved too great to enumerate. The THT project mentioned that in addition to the main
four people, about six to eight others were involved on a more regular basis, though with only a
small portion of their time.
See Table 6 for additional information regarding costs and staffing.
26
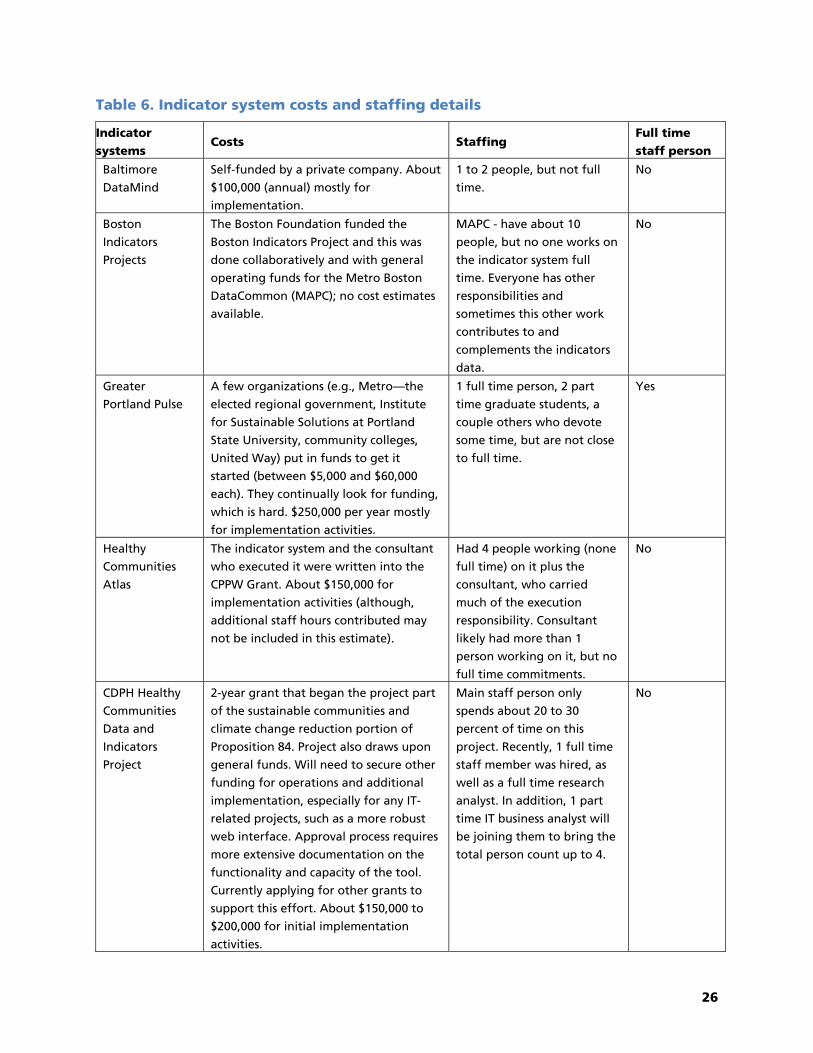
Table 6. Indicator system costs and staffing details
Indicator
systems Costs Staffing
Full time
staff person
Baltimore
DataMind
Self-funded by a private company. About
$100,000 (annual) mostly for
implementation.
1 to 2 people, but not full
time.
No
Boston
Indicators
Projects
The Boston Foundation funded the
Boston Indicators Project and this was
done collaboratively and with general
operating funds for the Metro Boston
DataCommon (MAPC); no cost estimates
available.
MAPC - have about 10
people, but no one works on
the indicator system full
time. Everyone has other
responsibilities and
sometimes this other work
contributes to and
complements the indicators
data.
No
Greater
Portland Pulse
A few organizations (e.g., Metro—the
elected regional government, Institute
for Sustainable Solutions at Portland
State University, community colleges,
United Way) put in funds to get it
started (between $5,000 and $60,000
each). They continually look for funding,
which is hard. $250,000 per year mostly
for implementation activities.
1 full time person, 2 part
time graduate students, a
couple others who devote
some time, but are not close
to full time.
Yes
Healthy
Communities
Atlas
The indicator system and the consultant
who executed it were written into the
CPPW Grant. About $150,000 for
implementation activities (although,
additional staff hours contributed may
not be included in this estimate).
Had 4 people working (none
full time) on it plus the
consultant, who carried
much of the execution
responsibility. Consultant
likely had more than 1
person working on it, but no
full time commitments.
No
CDPH Healthy
Communities
Data and
Indicators
Project
2-year grant that began the project part
of the sustainable communities and
climate change reduction portion of
Proposition 84. Project also draws upon
general funds. Will need to secure other
funding for operations and additional
implementation, especially for any IT-
related projects, such as a more robust
web interface. Approval process requires
more extensive documentation on the
functionality and capacity of the tool.
Currently applying for other grants to
support this effort. About $150,000 to
$200,000 for initial implementation
activities.
Main staff person only
spends about 20 to 30
percent of time on this
project. Recently, 1 full time
staff member was hired, as
well as a full time research
analyst. In addition, 1 part
time IT business analyst will
be joining them to bring the
total person count up to 4.
No

27
Indicator
systems Costs Staffing
Full time
staff person
HUD HCI The HCI is one aspect of HUD’s 3-year
Healthy Communities Transformation
Initiative. Funding of about $500,000 per
year includes indicator selection and
creation of the Index itself; development
of a web-based Assessment Tool; and the
piloting stage.
In addition to a number of
subject matter experts, 2
staff from Healthy Housing
Solutions very involved, and
a team from HUD with 2
main HUD staff.
No
Mariposa
Healthy Living
Toolkit
Funding came from the planning budget
as part of the pre-development costs for
the development. About $50,000 was
allocated for toolkit development
(excluding additional in-kind staff,
partner, and consultant time).
For the first draft in 2009, 2
to 3 people worked on it but
not devoting all of their
time. In the 2012 update,
there was about the same
number of people working
on it.
No
MetroPhila
Mapper
Funded through a 3-year grant from the
William Penn Foundation. About
$125,000 to $200,000 per year mostly for
implementation activities and about
$85,000 for maintenance (excluding in-
kind staff time).
1 project manager devoting
most, if not all, of their time.
2 to 3 grad students. Also
higher level people involved
at some percentage of their
time.
Yes
Minneapolis
Sustainability
Indicators
System funded through the Office of
Sustainability through the City of
Minneapolis general operating budget;
no cost estimate available.
Two staff and 1 intern part
time (total is about ½ to ¾
Full Time Employee (FTE) to
maintain the system).
No
Oregon Rural
Communities
Explorer
Funded continually through the Ford
Family Foundation. At the beginning,
OSU contributed money to the project.
Library contributed funding through
data services units. Project has taken
more of people’s time than expected and
people have given more of their time
than they are being reimbursed for.
About $100,000 per year for
maintenance, including substantial costs
for training and outreach (excludes in-
kind contributions).
1 person full time, plus
through 2 people and some
graduate research assistants
they make less than one full
time equivalent (less than 2
FTE total).
Yes
Seattle Healthy
Living
Assessment Tool
CPPW grant and then transferred
funding to general fund. About $60,000
(total CPPW grant was $108,000 and the
HLAT took about half) for initial
implementation (figure excludes
continued implementation).
Approximately 5 people
work on the tool, though
they don’t devote all of their
time to it.
No
28
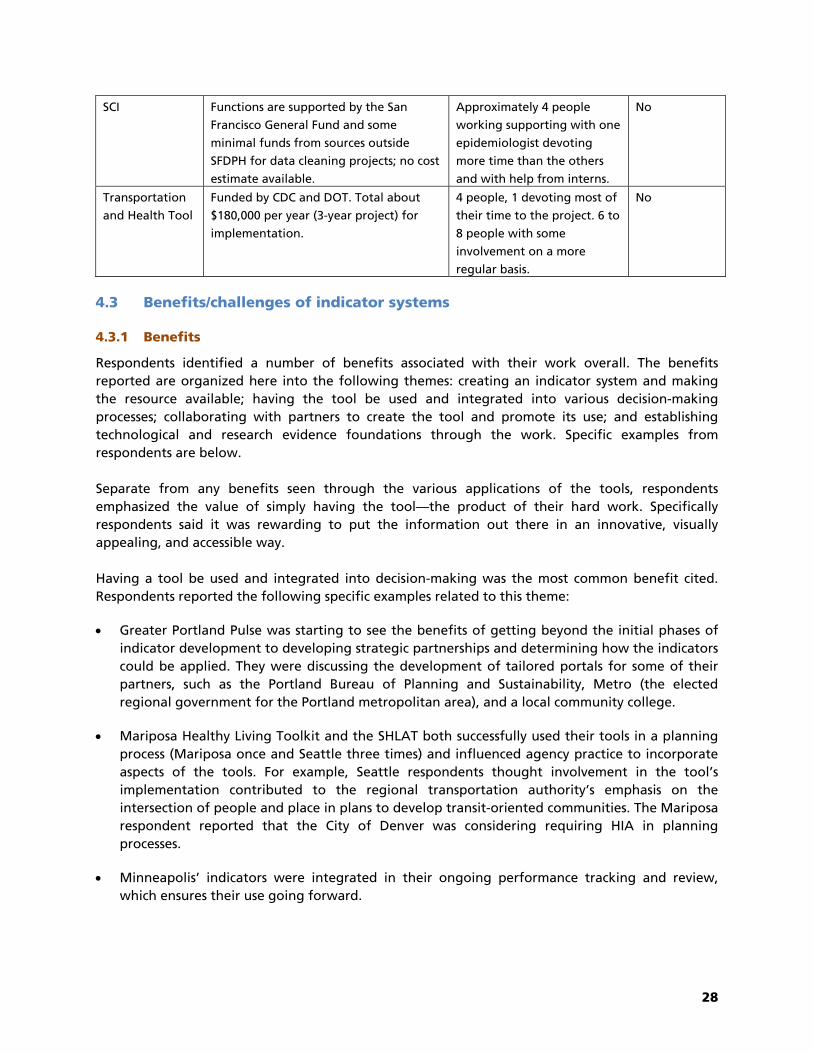
SCI Functions are supported by the San
Francisco General Fund and some
minimal funds from sources outside
SFDPH for data cleaning projects; no cost
estimate available.
Approximately 4 people
working supporting with one
epidemiologist devoting
more time than the others
and with help from interns.
No
Transportation
and Health Tool
Funded by CDC and DOT. Total about
$180,000 per year (3-year project) for
implementation.
4 people, 1 devoting most of
their time to the project. 6 to
8 people with some
involvement on a more
regular basis.
No
4.3 Benefits/challenges of indicator systems
4.3.1 Benefits
Respondents identified a number of benefits associated with their work overall. The benefits
reported are organized here into the following themes: creating an indicator system and making
the resource available; having the tool be used and integrated into various decision-making
processes; collaborating with partners to create the tool and promote its use; and establishing
technological and research evidence foundations through the work. Specific examples from
respondents are below.
Separate from any benefits seen through the various applications of the tools, respondents
emphasized the value of simply having the tool—the product of their hard work. Specifically
respondents said it was rewarding to put the information out there in an innovative, visually
appealing, and accessible way.
Having a tool be used and integrated into decision-making was the most common benefit cited.
Respondents reported the following specific examples related to this theme:
Greater Portland Pulse was starting to see the benefits of getting beyond the initial phases of
indicator development to developing strategic partnerships and determining how the indicators
could be applied. They were discussing the development of tailored portals for some of their
partners, such as the Portland Bureau of Planning and Sustainability, Metro (the elected
regional government for the Portland metropolitan area), and a local community college.
Mariposa Healthy Living Toolkit and the SHLAT both successfully used their tools in a planning
process (Mariposa once and Seattle three times) and influenced agency practice to incorporate
aspects of the tools. For example, Seattle respondents thought involvement in the tool’s
implementation contributed to the regional transportation authority’s emphasis on the
intersection of people and place in plans to develop transit-oriented communities. The Mariposa
respondent reported that the City of Denver was considering requiring HIA in planning
processes.
Minneapolis’ indicators were integrated in their ongoing performance tracking and review,
which ensures their use going forward.

29
Oregon RCE found that using the data really did elevate conversations beyond a simple
understanding of community characteristics to more complex issues related to the relationships
between neighborhood factors and how the information could be used.
SCI had developed strong partnerships between the health department and other city agencies
that use the information to aid in decision-making.
The SHLAT was actually somewhat unique as an example of creating a tool and using it. Their tool
has allowed them to integrate data and indicators into a process in a way that is meaningful to the
community. It is the primary fabric for planners and public health professionals to engage in
neighborhoods to improve health and quality of life. Seattle has three concrete and varied
experiences of implementing the tool and they have plans to do it again. Their pilot report details
the process and outcomes for the Rainier Beach and Broadview - Bitter Lake - Haller Lake
implementations.
The next most commonly cited benefit was collaboration and the variety of reasons it is important
for the development of indicator tools. Collaborations can help to create lasting engagement with a
variety of audiences. By working with stakeholders, collaborations can create demand for the
indicator tool and ensure a vested interest in the project regardless of potential changes in
leadership or funding. Respondents also mentioned that collaboration made the final product
better, reduced redundancy, and pooled resources.
Some examples of the benefits of collaboration were provided by respondents. For instance, the
Minneapolis Sustainability Indicators project valued the engagement and involvement of decision-
makers, as this ensured the future of the system. The SCI has helped institutionalize relationships
with other agencies around certain powerful indicators, such as the pedestrian safety corridor
indicators that are posted in police stations. Further, the SCI felt that as a result of the tool, the
health department was viewed as bringing neutral information about health relationships and data
to decisions being made across the city in a variety of sectors.
A few respondents mentioned the benefit of the work for establishing technological and research
evidence foundations upon which others can build and expand. A few others reported that their
tools benefited from taking the time to do it right, which gave them confidence in the quality of
the work and its utility.
4.3.2 Challenges
Several themes also emerged regarding challenges. The key themes included difficulties related to
data, collaboration, outreach and tool promotion, funding, and technology. Data and collaboration
challenges were mentioned most frequently, followed by outreach and funding issues. Table 7
elaborates on these themes and shows which respondents mentioned the issue.

30
Table 7. Challenges cited by respondents
Challenge (sorted by frequency of mention) Systems cited Number of
systems
Data
Trade-offs between budget and data collection or
sophistication
Trade-off between making data easy to use or
sophisticated
Having a regional focus challenging for data availability
and consistency
Gathering, storing, processing, disseminating data
Connecting environmental measures with health data at
comparable scale
Data unreliable at small geographic scales
Making evidence at a higher geography relevant for very
localized planning and issues
Tracking data over time – who should do it and how
Updating data every year takes time
Paying attention to data quality
Trade-offs between democratizing data access and data
quality/consistency
GPP
Healthy Communities
Atlas
CDPH HCI
HUD HCI
Mariposa Healthy Living
Toolkit
Minneapolis Sustainability
Indicators
Oregon RCE
SHLAT
SCI
9
Collaboration
Connecting with collaborative organizations
Aligning partner goals, perspectives, and schedules to
make everyone happy
Coming to consensus on some decisions
Responding to the needs of different organizations and
being flexible
Deciding what to measure and how to measure it
Baltimore DataMind
Boston Indicators Projects
CDPH HCI
HUD HCI
MetroPhilaMapper
Minneapolis Sustainability
Indicators
SHLAT
THT
8
Outreach
Getting the word out
Getting all user communities engaged
Communicating about health issues and social
determinants of health
Getting people to use the data to make decisions
Baltimore DataMind
Mariposa Healthy Living
Toolkit
SHLAT
Oregon RCE
SHLAT
SCI
6

31
Funding
Sustaining funding
Funder had different priorities (from their own community
focused ones)
Baltimore DataMind
GPP
MetroPhilaMapper
Oregon RCE
4
Regional focus
Grounding regional scale data in local issues
GPP
Mariposa Healthy Living
Toolkit
MetroPhilaMapper
3
Technology
Finding and using the best visualization software
Baltimore DataMind
GPP
2
Ideology of the parent organization
Difficult for organizations to come up with a valid and
sustainable business model
Baltimore DataMind 1

32
5. Health Analysis Tool Scope Approaches
The experiences of other locations show that there are many ways to create a useful tool that could
be applied in the San Diego region and that could align with regional vision and goals. The
following are possible approaches to a health analysis tool that could be considered. These options
and their associated considerations are meant to facilitate discussions among stakeholders and to
aid in the decision-making process.
In summary, the following four approaches are provided for discussion:
Approach 1: Develop a list of indicators and recommendations for a process to apply them
Approach 2: Affiliate with another indicator system – use an Existing Tool
Approach 3: Develop a San Diego-specific tool tailored to meet regional vision and goals
Approach 4: Integrate social determinants of health in the local planning process
Below is a description of each approach, highlighting which indicator systems have used it and an
explanation of what would need to be done to implement it.
5.1 Approach 1: Develop a list of indicators and recommendations for a process to apply them
5.1.1 What it is
This approach involves the creation of a paper or online report that lists domains and indicators,
data preparation and processing methodologies, explanations and evidence to support the
indicators’ connections to health, other resources, and ideas for how the indicators and tool could
be used. This approach would not collect or provide indicator data on a regional scale.
5.1.2 Relevant indicator systems
Of the tools we researched, the Mariposa Healthy Living Toolkit is one example of such a tool that
has some of these components. The Mariposa Toolkit is a report that includes, for each of
six dimensions of a healthy community, objectives and rationale related to health outcomes,
recommended indicators and strategies to use them, and resources for additional information. The
Mariposa Toolkit also includes a template Report Card for tracking indicators, a template Campaign
Checklist to organize action and track progress, and a list of relevant organizations and potential
partners. The domains, indicators, and checklist are modeled after the Sustainable Communities Index
(SCI). They only collected data for one neighborhood in the context of applying the toolkit to a
planning process around a housing development.
Of the tools that were researched, the Mariposa Toolkit is the most explicit example of this
approach because it is a discrete paper report that the San Diego region could reference. However,
there are other tools that could serve as models for the relevant components of this approach
(e.g., indicator domains and indicators, justification for indicators, performance measurement
objectives, ideas for tool applications). Other tools to reference (although these all make data
available online) include: Boston Indicators Projects, Greater Portland Pulse, and the SCI. These have
goals for indicators either stated or implied and the Boston tools and the SCI have been used in

33
many planning processes. Like the Mariposa Toolkit, the SCI also offers ideas for how to incorporate
indicators into a community planning process, such as a healthy development checklist and policy
and design strategies to aid in meeting tool objectives. For these reasons, these tools could prove to
be useful for the development of this approach in the San Diego region. Baltimore DataMind is
another online tool that could serve as a reference, although this tool is not oriented as much
towards planning and policy-making. The Healthy Communities Atlas represents a start for a set of
indicators, but would likely need to be expanded and enhanced to encompass a broader set of
indicator domains and to facilitate its use.
These indicator systems are potential models for the San Diego regional tool, but additional
thought would need to be given to how extensive the tool would be, even if it were paper and not
online.
5.1.3 What would need to be done
If the San Diego Association of Governments (SANDAG)1, stakeholders, and collaborators were to
decide on this approach, decisions would need to be made about: 1) the indicators to include
(e.g., adapt an existing system, or come up with your own); and 2) what other elements of the tool
should be included (e.g., healthy development checklist, or policy and design strategies that could
be used to change indicator conditions). Decisions also would need to be made around how to
recommend the tool be applied to planning decisions and processes. Creating the tool as part of a
pilot process is one approach to defining the steps and unique considerations for local planning
jurisdictions, but this could increase the scope of the project.
Mithun, Inc., a consultant for the Mariposa Healthy Living Toolkit, essentially did just this; they
piloted the tool on the housing redevelopment plan. This was useful for them and may lead to
additional applications, but it should not be assumed that the future application of the tool will
necessarily be simple and/or similar to the first. For example, Seattle indicated that their experience
applying their tool in several different neighborhoods was very different in each example and
yielded distinctive results each time. Thus, it may be challenging to come up with a “foolproof” and
consistent template for a process that local jurisdictions can use without a great deal of experience
applying the tool in San Diego first. Further, conducting a pilot would involve actually collecting
data – albeit for a much smaller area – and using it in collaboration with community stakeholders.
In this case, the roles, responsibilities, and costs of going through this for a pilot in a local
jurisdiction will need to be determined.
Cost estimate range to develop a list of indicators and recommendations for a process to
apply them (no regional scale data collection): $50,000 to $75,000 to develop the list of
indicators. Additional funds would need to be allocated if the tool were piloted in a local
community.
1 In this section SANDAG is identified as the entity responsible for moving the process forward and for ultimately making decisions around the San Diego Regional Health Analysis Tool. Although SANDAG is identified, they will do this in partnership with Health and Human Services Agenecy and collaboratively with the input of a range of local stakeholders.

34
5.1.4 Benefits and drawbacks
The primary benefit of taking this approach is cost. It would be a lower cost approach compared to
the other options. SANDAG would be able to focus on creating a framework and working with
partners to apply the tool rather than on creating and maintaining data.
While not having to collect data is a benefit of this approach, cost is one of the main drawbacks. A
lack of local data makes the tool less useful to local users. The onus is on local partners to invest in
collecting and processing the data. This approach assumes that users will perform data collection
and processing. If SANDAG offers assistance with data collection, it may be worth taking the next
step to facilitate data collection for a larger geographic area, in which case Approach 1 begins to
look more like Approaches 2 or 3.
Further, if SANDAG plans to pilot the tool, this will have implications for local data collection and
community engagement, which requires investment. If a pilot is not pursued, the effort runs the risk
of not being as useful or used and not reflecting local planning processes and realities.
Additional considerations related to this approach are included in Table 8.
5.2 Approach 2: Affiliate with another indicator system – use an existing tool
5.2.1 What it is
Several tools are attempting to lay the groundwork for indicator systems with which others could
affiliate. To affiliate with any one of these, San Diego would take one of these indicator systems
and online platforms and upload or publish local data to it. Affiliation would mean creating an
online system that publishes indicator data to a platform that has been developed by another
group. Approach 2 commits to getting the data and publishing it online (perhaps with the
exception of an affiliation with California Department of Public Health [CDPH], see below). There is
a range, however, in how much effort has been put forth by the potential affiliate organizations to
prepare the indicators, data sources, data processing methods, online platform technologies, and
other system components (e.g., development checklists, targets, or indexes). These differences are
elaborated on below.
5.2.2 Relevant indicator systems
The tools that SANDAG could affiliate with are Housing and Urban Development Healthy
Community Indicators (HUD HCI), San Francisco Department of Public Health (SFDPH) SCI, CDPH
Healthy Community Indicators (HCI), or the Transportation and Health Tool (THT). For the HUD tool
and the SCI, data would need to be gathered and published, while for CDPH’s HCI and the THT
these entities would do the data gathering and publishing, so the San Diego region may be able to
simply use these indicators and data. However, the THT’s smallest geographic unit is the region and
it is strictly limited to transportation and health domains, which is likely not broad enough for San
Diego’s vision. For these reasons, we are not presenting the THT as a viable option below. For all of
these tools, affiliation means going with the indicators that have been established in the tools, and
ceding some decision-making related to what the tool actually comprises.
HUD - Please see the appendices for details about the HUD HCI tool. HUD is investing in the upfront
work to identify data and methodologies and other decisions related to online data publishing and
visualization with the intention of facilitating the initial implementation for locations that pilot

35
their tool. Affiliating with HUD could mean a more involved partnership with, for example,
potential agreements about which indicators are used, how indicators should be visualized online,
and co-branding. The HUD tool has been developed with the input from SCI representatives, so
there may be many similarities in the content of the systems.
The SCI - The SCI has an existing online tool and therefore experience with implementing one,
maintaining it, and reaching out to partners and users to promote its application. These experiences
could prove very useful for the San Diego region if this approach is pursued. That said, affiliating
with the SCI has some significant unknowns. Currently, SFDPH is not clear about their intentions to
support formal affiliations with the SCI, so to pursue this approach may be as simple as setting up a
mentorship relationship with the SCI manager and modeling after their tools and processes. The
details and agreements of the affiliation would need to be explored with SFDPH.
CDPH – CDPH is in the process of sourcing and collecting data for the indicators they have decided
will be incorporated in their system, hiring appropriate contractors and staff to develop the
technical systems that would support the online interface, and establishing partnerships with
potential locations that are interested in applying the indicators to local processes. Affiliating with
CDPH would mean going with the indicators and interface that CDPH establishes, potentially with
some flexibility for local customization around indicators (e.g., adding/subtracting some), and
San Diego may be able to give some input into and influence the online interface. CDPH would be
the keeper and processor of the data, however, the affiliate would collaborate with the project lead
on data presentation and analysis and likely other details that come up.
With the exception of the SCI, each of these tools is still in development with no real organized user
interface to present data, so overall timelines may be an issue.
5.2.3 What would need to be done
SANDAG would need to decide first which tool to affiliate with, or begin having discussions to
understand the implications and feasibility of affiliating. Ultimately partners will need to commit to
working with an affiliate, although it may be possible to set up arrangements with all three or
some of the institutions (HUD, SFDPH, or CDPH). The institution and indicator system chosen will
have implications for the next steps as each partnership would look very different.
Although there would be some variation depending on the affiliate, it is a similar process after this
point as well. Indicator data will need to be collected, processed, and published; a plan developed
for outreach and promotion of the tool; and a plan specified for maintenance going forward. The
benefit of affiliating with either the HUD HCI, or the SCI would be having help with these tasks—
the project wouldn’t be starting from scratch—and would not have to figure out as much related to
the online interface and back end system because both HUD and the SCI have laid this groundwork;
the SCI more so than HUD. Affiliating with the SCI will likely mean a more self-directed approach
compared to HUD.
Affiliating with an existing indicator system would also likely involve engaging collaborative
partners locally and thinking through indicators to ensure local partners feel invested in the tool
and to gain an understanding of the alignment of local circumstances, goals, and priorities, and the
affiliate’s system.
36
Although the vision is for the San Diego region to be able to use the affiliate’s system, there will
still be effort needed to source local data and develop the online interface for a San Diego regional
tool. Therefore, some investment will be required to determine the time and resources necessary to
collaborate with an affiliate around these details.
Cost estimate range to affiliate with another indicator system: $100,000 to $200,000 to
develop and implement this approach. This excludes ongoing maintenance and outreach. Ongoing
maintenance and outreach is dependent on the choice of affiliation and is therefore too
wide-ranging to estimate.
5.2.4 Benefits and drawbacks
The benefits of this approach revolve around the resource and time-savings associated with having
a pre-set indicator system to use (i.e., minimal work to identify, and define the indicators and
methods to collect data) and the partnership and assistance of the affiliate entity. While this
approach would still require investments in data, stakeholder engagement, tool promotion, and
other activities, the affiliation would catalyze these efforts. Affiliation also would strengthen
relationships with the affiliate organizations.
The drawbacks of this approach are that SANDAG would have less say on the indicators included in
their system, and may face limitations in collaborating with an affiliate organization. The data and
interface also may be bound by what the parent system has to offer.
Because it involves collecting and publishing data (for HUD and SCI affiliation), this approach also
has the potential to cost more overall than Approach 1.
Additional considerations related to this approach are included in Table 8.
5.3 Approach 3: Develop a San Diego-specific tool tailored to meet regional vision and goals
5.3.1 What it is
This approach is more innovative than the previous approaches, as it would involve developing a
tailored set of indicators; collecting, processing, and publishing indicator data and supporting
information; developing a plan for outreach and promotion of the tool; maintaining it going
forward; and potentially creating an online interface and back end system (if an online system is
desired over a paper tool). For this approach, it also would be important, for the long term
sustainability and support for the tool, to identify appropriate local collaborative partners,
potentially forge new relationships, and create a shared vision and framework for partners to
collaborate and contribute.
SANDAG could decide to go with this approach to develop an indicator system and actually collect
and process the data for it, but not create the online visualization components. In this case, the tool
would be a paper report that could be updated in future years. This is similar to Approach 1, but
Approach 1 does not involve data collection, so this goes one step further.

37
5.3.2 Relevant indicator systems
The online systems that could serve as examples include Baltimore DataMind, the Boston Indicators
Projects, Greater Portland Pulse, Oregon Rural Communities Explorer, and the SCI. Not included as
examples are Metropolitan Philadelphia Indicators Project and Minneapolis Sustainability Indicators
because, while these are online indicator systems, the geographic scale of the data is not refined
enough. However, San Diego could still reference these for indicators or online interfaces.
The Healthy Communities Atlas (HCA) is an example of a relevant paper report, for which data were
collected and processed. However, the breadth of the indicator domains and indicators for this tool
is somewhat narrow in relation to the social and environmental determinants of health.
The Boston Indicators Projects, Greater Portland Pulse, and the SCI are examples of tools that
undertook a more involved process to engage stakeholders in the tool overall and specifically in the
task of identifying the appropriate indicators to include. Support for the tools and a sense of
forward momentum may be due to these engagement and collaboration efforts.
5.3.3 What would need to be done
This approach could begin with the creation of a workgroup that would be tasked with the
initiation of this work. The workgroup would identify appropriate partners; seek additional
funding; come up with a process for deciding which indicators to include; collect the data; process
and publish it; identify potential projects, plans, or policies on which to apply the system; and
conduct any training and outreach. If an online system were chosen there would be additional tasks
around selecting which technology systems to use, designing the interface, and developing these
systems.
Some specific advice gained through interviews includes:
(From Boston) At first the effort should just strive to have a set of goals and commit to tracking
indicators going forward and, over time, the tool will evolve
(From Boston) Get a handle on the different audiences that your system is targeted to and be
responsive to their needs
(From multiple respondents) Develop strong relationships with partners that will be able to
provide you with local data, and if possible, create a system where data sharing is
institutionalized as routine work
Cost estimate range to develop a San Diego-specific tool: $200,000 to $300,000 to develop
and implement this approach. This excludes ongoing maintenance and outreach. Ongoing
maintenance and outreach is estimated to cost $75,000 to $150,000 per year.
5.3.4 Benefits and drawbacks
Perhaps the largest benefit to this approach is that it allows the freedom to truly tailor the tool to
the local context, and be built to advance an agreed-upon set of goals. While it will be more time
and resource intensive, this may result in it being more used more often than some of the other
options. An online mapping system, while labor intensive, is a very effective tool for making data
more useful and accessible.

38
Another benefit of this approach is that the HCA could be used as the starting foundation for this
work. Given the fact that a significant amount of work to collect and present local data has already
been done, using the HCA and building upon it could demonstrate a commitment to make the tool
more collaborative and sustainable. Although substantial investments have been made in the HCA,
the feasibility of building from it should be explored. As mentioned above, the HCA uses a narrower
set of indicator domains (compared to some of the other systems analyzed in this report); all data
are gathered for Census block groups, which are the smallest geographic/statistical areas available
and can limit the indicator options; and data processing methods may be more sophisticated and
therefore resource intensive.
Drawbacks are that this is the most time and resource intensive process. Additional considerations
would need to be made about the pros and cons of creating a paper tool or putting the
information online, as a paper tool may not facilitate the long-term sustainability of the tool. In
contrast, an online system, while potentially more sustainable and usable, would require more
effort and resources to implement.
Additional considerations related to this approach are included in Table 8.
5.4 Approach 4: Integrate social determinants of health in the local planning process
5.4.1 What it is
The most groundbreaking of the approaches, this approach would essentially model off the Seattle
Healthy Living Assessment Tool (SHLAT) to have SANDAG recommend that local jurisdictions engage
in a more proactive neighborhood planning process, and essentially have SANDAG take the lead in
convening the local jurisdictional partners to create and use a tool modeled off the SHLAT. The
SHLAT process uses the indicator data as a point of engagement for discussions with partners, and
as a way to get a deeper understanding of the community’s vision for what would make them
healthy and have a better quality of life.
The Healthy Living Assessment process involves collecting indicator data for a local community that
is in the process of engaging with the planning authority around a community planning process.
The data are presented to community representatives and the planning agency facilitates a process
to get the community’s impressions of the indicator data—the extent to which it reflects people’s
everyday experiences related to health and quality of life in their neighborhoods. The Healthy
Living Assessment also includes a survey to gather data that is related to the indicators, but that is
not available publicly. These data sources are combined and used to identify community strengths
and opportunity areas, which become the basis for the community plan and implementation
strategies.
This approach would likely involve close collaboration with the City of Seattle Department of
Planning and Development to understand how this model could be implemented in the San Diego
region.
We included this in the list of approaches because it represents the most integrated way to use
indicators, engage community, and have this lead to concrete and tangible changes in community

39
conditions. It also may represent a way to foster community goodwill and build positive
relationships.
5.4.2 Relevant indicator systems
The SHLAT provides an indicator list, a community questionnaire, a neighborhood discussion guide,
and data synthesis templates that are all meant to be deployed as part of a robust stakeholder
engagement and community planning process. The SHLAT is the model for the process of using
indicators in a local planning process, but many of the other indicator systems examined in this
report could serve as the starting points for a set of indicators in a Healthy Living Assessment Tool
(HLAT). In fact, of the approaches presented here, Approach 1 could be used in combination with
the process outlined in this approach.
5.4.3 What would need to be done
This approach would require a strong commitment from local planning jurisdictions as it has
implications for community planning practice. This approach represents more than just providing a
resource (indicators and/or data) and suggestions for how to use it. It would actually be
recommending a more complete process for engaging local communities using a health lens.
Consultation with Seattle would be an important first step to thoroughly considering the
implications and appropriateness of the HLAT for the San Diego region.
SANDAG would likely still need to engage in an indicator selection process, as the indicators form
the basis of the indicators component of the HLAT and would need to reflect local priorities.
Although the SHLAT is a good starting point for the indicators for which data would need to be
collected, local customization and buy in would be needed. As mentioned above, SANDAG could
use a combination of Approach 1 (as the starting list of indicators) and take it one step further to
further describe the process and additional activities for Approach 4. Similarly, components from
any number and combination of the approaches presented here could be used to develop a hybrid
tool that best suits the San Diego region.
Decisions also would need to be made around initial implementation of the tool because this
approach does not represent a region-wide approach. Rather it would likely be implemented in
individual communities as they go through various planning processes, into which this tool could be
integrated. The implementation of a San Diego region HLAT could be piloted as appropriate
communities are identified.
This approach would require targeted local data collection for the indicators that are recommended
for the HLAT. SANDAG may choose to collect data or offer assistance with data collection as part of
this effort, or data collection could be left to the local jurisdictions, or arrangements could be made
to share in the data responsibilities in some way. Further implementation of the HLAT would
overlap with some existing local planning processes.
Cost estimate range to integrate social determinants of health in the local planning
process: $60,000 to $150,000 to develop and implement this approach. This is a wide range because
the approach includes a facilitated process and costs are dependent on a number of factors and
unknowns related to how it is implemented. For example, whether a new indicator system is
developed or whether one is adopted (e.g., SHLAT); whether primary data collection is supported;
how and if local partners are funded; the structure of the relationship between SANDAG and the

40
local jurisdictions; and whether or not local jurisdictions are offered technical assistance to
implement the tool.
5.4.4 Benefits and drawbacks
This approach allows SANDAG to embed a health analysis tool into existing planning and policy
processes more seamlessly than in other approaches. This approach also is the one with the clearest
path to authentically engaging communities in translating data for a greater understanding of the
implications of planning for health and in devising potential solutions that can address local
opportunities and challenges to improve community health.
The approach has the potential to influence local planning processes more than any of the other
approaches because it incorporates a structured process for community and agency collaboration.
By ensuring community and agency participation, this approach represents the most integrated way
to use indicators, engage community, and have this lead to concrete and tangible changes in
community conditions. It also may represent a way to foster community goodwill and build positive
relationships. In short, this is more of a holistic community planning approach than simply
developing of a set of indicators and some suggestions for ways to use them.
The drawbacks of this approach are that it involves a high level of resource investment and strategic
decision-making for how the tool will be implemented and maintained. It also would have to be
tailored to each local planning context every time it is used.
Additional considerations related to this approach are included in Table 8.
The following table summarizes the how the different approaches vary in terms of the categories
we examined.
Approach 1: Develop a list of indicators and recommendations for a process to apply them
Approach 2: Affiliate with another indicator system – use an existing tool
Approach 3: Develop a San Diego-specific tool tailored to meet regional vision and goals
Approach 4: Integrate social determinants of health in the local planning process

41
Table 8. Summary of implications of approaches for consideration
Approach 1:
Develop a list of
indicators and
recommendations
for a process to
apply them
Approach 2:
Affiliate with
another indicator
system
Approach 3:
Develop a San
Diego-specific tool
Approach 4:
Integrate social
determinants of
health in the local
planning process
Goals/ purpose
of approach
End result: Produce
only a prioritized
indicator list as a
framework, without
local data
Adopt a preexisting
indicator list and use
preexisting interface
to present local data
Create a customized
tool, either online or
paper-based, that is
informed by an
overarching
framework, and will
provide strategies for
implementation
Use tool to integrate
health into a
comprehensive
community planning
process
Users/
Applications
Applications will be
limited because of
the omission of data,
but users will be
able to adapt the
framework and
indicators for their
own needs
Users can be broad
depending on
SANDAG outreach
efforts, but
applications may be
limited by the parent
system’s interface
System can be tailored
for any range of users,
and the application of
the tool can likewise
be scaled up or down
depending on goals
and resources
Direct users will
skew more towards
local planning
jurisdictions, but
communities
engaged in a
process using the
tool are indirect, yet
very involved users
Indicators to
include
Can be chosen based
on a prioritization
process within
SANDAG and in
collaboration with
stakeholders
Pre-selected based
on the system with
which SANDAG
affiliates; may have a
chance to add
additional indicators
Can be chosen based
on a prioritization
process within
SANDAG and
stakeholders and will
be subject to data
availability
Can be chosen based
on a prioritization
process within
SANDAG and
stakeholders and
will be subject to
data availability
Data
availability
Data is not made
available for use
Data is collected and
made available for
use as part of the
tool
Data is collected and
made available for use
as part of the tool
Data is not made
available for use up
front. It is created in
the context of a
specific planning
process and made
available for use in
that particular
jurisdiction.

42
Process for
getting and
publishing
data
No data collection or
publishing
Depending on the
parent system
chosen, local data
will need to be
collected, or the
parent organization
will collect the data;
parent organization
will publish the data
Data collection,
processing, and
publishing will all be
done in-house using
either a paper or web-
based interface
Data collection,
processing, and
publishing can be
done in-house or by
local jurisdictions for
individual
communities
engaged in a
planning process
Engagement/
Outreach
In development,
stakeholder
engagement would
include coming to
consensus on and
creating the
framework for the
system, as well as
identifying
indicators for
inclusion
After the tool is
released,
stakeholder
engagement would
consist of providing
technical assistance
to users who are
applying the tool to
their own contexts
In development,
stakeholder
engagement would
include relationship-
building to develop
parameters around
affiliation, confirm
indicators, and to
obtain and process
local data
After the tool is
released, stakeholder
engagement may
occur around
applying the tool to
inform various
project contexts and
decision-making
processes, as well as
data updates
In development,
stakeholder
engagement would
include relationship-
building to make
decisions about
indicators and to
obtain and process
local data, and
designing the tool’s
interface
After the tool is
released, stakeholder
engagement may
occur around applying
the tool to inform
various project
contexts and decision-
making processes, as
well as data updates
In development,
stakeholder
engagement would
include relationship-
building to plan and
implement the tool
Tool
implementation
represents a
stakeholder
engagement process
in itself
Operations
(funding/
staffing/
cost)
Likely the most
affordable
approach, as
significant cost
savings will result
from not engaging
in data collection
and processing
Likely to be more
than Approach 1 but
less than Approaches
3 and 4, depending
on the scale of data
collection that the
parent system
requires
Likely to be the most
expensive approach, as
the indicator
framework and
indicators, data
collection and
processing, and tool
interface (either paper
or web-based) will
require significant
resources to develop
Likely to be similar
to Approach 3,
because there is the
potential for
significant expenses
related to
stakeholder
engagement and
help with local data
collection

43
Benefits/
Challenges
Major benefit:
Requires fewest
resources to develop;
SANDAG can focus
on creating a
framework and
working with
partners to apply the
tool rather than
maintaining data
Major challenge:
Local data won’t be
available to users,
which limits the
types of applications
for the tool for those
that are able to
collect their own
data using the tool’s
indicator framework
Major benefit:
Will be adopting a
framework and
interface that will
decrease the
resources and time to
develop and
maintain the tool,
and will strengthen
partnerships with
parent organization
Major challenge:
Data and interface
will be limited by
what the parent
system has to offer,
acknowledging that
their system may
change over time
Major benefit:
Will allow SANDAG
full control over
indicators, data, and
interface
Major challenge:
High level of resources
required, and high
level of strategic
decision-making for
how the tool is
developed and
maintained is
necessary
Major benefit:
With proper
deployment and
stakeholder
engagement, this
will allow SANDAG
to embed the tool
into existing
planning and policy
processes more
seamlessly than in
other approaches
Major challenge:
High level of
resources required,
and high level of
strategic decision-
making for how the
tool is developed
and maintained is
necessary

44
6. Conclusions and Next Steps
This best practices review sought to summarize a variety of characteristics related to existing
indicator systems and, based on this, provide a set of considerations and approaches to developing
a health analysis tool that would increase local capacity in the San Diego region to consider health
in the evaluation of plans, projects, and policies.
Existing indicator system materials were reviewed and representatives were interviewed from across
the country. This information provided significant insight into the potential purposes; users and
applications; indicator, technological, staffing, and funding processes; and the benefits and
challenges of developing, implementing, promoting, and maintaining a variety of health analysis
tools.
The Best Practices Report is the first step in determining a preferred scope for a San Diego Regional
Health Analysis Tool. The concept of a health analysis tool for the San Diego region originated from
the partnership of the San Diego (SANDAG) and Health and Human Services Agency (HHSA) as a
resource for local agencies, tribal governments, and community-based organizations. Once
developed, the tool should help guide local agencies and organizations in how to assess health in a
variety of local planning and project development processes. To ensure these local planning and
community organizations use the tool, potential future users may have a role in determining the
best approach for the tool.
The examination of nationwide health indicator systems helped outline four potential approaches
to consider for the San Diego region. Given the breadth of health analysis tools and indicator
systems in existence today, the approaches identified in this report are not intended to be inclusive
of the options available, but rather broadly capture the range of approaches that can be
implemented.
In subsequent months, SANDAG will solicit input from a variety of stakeholders regarding the initial
approaches posed in the report as a starting point for discussion and consensus. Future analysis of
staff resources, funding sources, and data availability by SANDAG and HHSA will further inform the
feasibility of approaches under consideration. It is anticipated that stakeholder input and the
resource feasibility analysis will collectively inform the preferred approach for developing a
San Diego Regional Health Analysis Tool. This work is currently scheduled through September 2016.
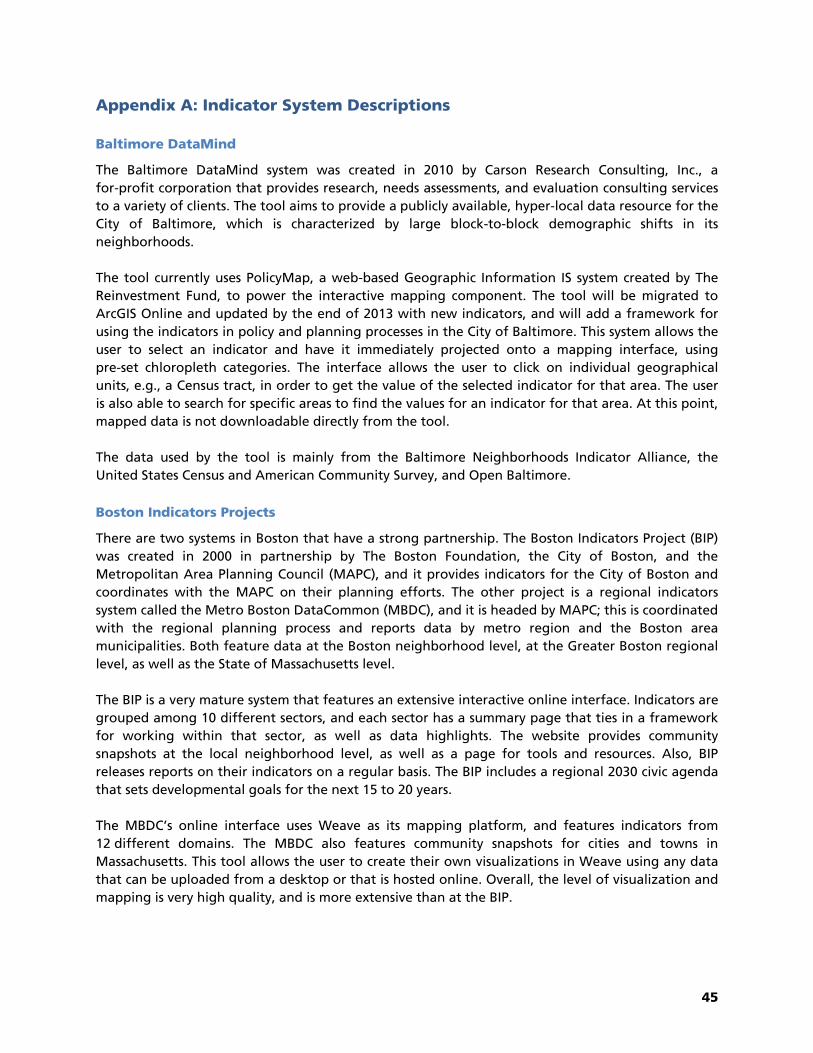
45
Appendix A: Indicator System Descriptions Baltimore DataMind
The Baltimore DataMind system was created in 2010 by Carson Research Consulting, Inc., a
for-profit corporation that provides research, needs assessments, and evaluation consulting services
to a variety of clients. The tool aims to provide a publicly available, hyper-local data resource for the
City of Baltimore, which is characterized by large block-to-block demographic shifts in its
neighborhoods.
The tool currently uses PolicyMap, a web-based Geographic Information IS system created by The
Reinvestment Fund, to power the interactive mapping component. The tool will be migrated to
ArcGIS Online and updated by the end of 2013 with new indicators, and will add a framework for
using the indicators in policy and planning processes in the City of Baltimore. This system allows the
user to select an indicator and have it immediately projected onto a mapping interface, using
pre-set chloropleth categories. The interface allows the user to click on individual geographical
units, e.g., a Census tract, in order to get the value of the selected indicator for that area. The user
is also able to search for specific areas to find the values for an indicator for that area. At this point,
mapped data is not downloadable directly from the tool.
The data used by the tool is mainly from the Baltimore Neighborhoods Indicator Alliance, the
United States Census and American Community Survey, and Open Baltimore.
Boston Indicators Projects
There are two systems in Boston that have a strong partnership. The Boston Indicators Project (BIP)
was created in 2000 in partnership by The Boston Foundation, the City of Boston, and the
Metropolitan Area Planning Council (MAPC), and it provides indicators for the City of Boston and
coordinates with the MAPC on their planning efforts. The other project is a regional indicators
system called the Metro Boston DataCommon (MBDC), and it is headed by MAPC; this is coordinated
with the regional planning process and reports data by metro region and the Boston area
municipalities. Both feature data at the Boston neighborhood level, at the Greater Boston regional
level, as well as the State of Massachusetts level.
The BIP is a very mature system that features an extensive interactive online interface. Indicators are
grouped among 10 different sectors, and each sector has a summary page that ties in a framework
for working within that sector, as well as data highlights. The website provides community
snapshots at the local neighborhood level, as well as a page for tools and resources. Also, BIP
releases reports on their indicators on a regular basis. The BIP includes a regional 2030 civic agenda
that sets developmental goals for the next 15 to 20 years.
The MBDC’s online interface uses Weave as its mapping platform, and features indicators from
12 different domains. The MBDC also features community snapshots for cities and towns in
Massachusetts. This tool allows the user to create their own visualizations in Weave using any data
that can be uploaded from a desktop or that is hosted online. Overall, the level of visualization and
mapping is very high quality, and is more extensive than at the BIP.

46
Greater Portland Pulse
The Greater Portland Pulse (GPP) tool was created by a partnership led by Portland State University’s
Institute of Portland Metropolitan Studies and Metro.
The tool is available as an online Weave interface, with pages for individual indicators and an
overarching framework that has guided the development of the tool. The framework, which was
created through an extensive regional stakeholder engagement process, identifies nine priority
functional areas of study that were then used to inform the creation of indicators. The focus of GPP
is on the greater Portland metro/regional area, presenting data from the counties of Clackamas,
Multnomah, and Washington in Oregon, and Clark County in Washington. The user is able to
explore health determinant data by topic, and demographics for the region. Data can be explored
by geographic scale (smallest is the Census tract level) or by visualization type (e.g., bar chart, data
table, map, etc.).
A novel approach that the GPP uses is its Data Stories section, which presents data that’s organized
around a specific topic and then provides a narrative to explain the data and put it into a regional
context. For example, the tool features a page on Halloween in the greater Portland area, with data
on the number of trick-or-treaters and the number of manufacturers of candy and costumes per
county.
Healthy Communities Atlas
The Healthy Communities Atlas is a paper tool with no online component, and was created for the
San Diego Association of Governments in 2012 as part of the San Diego County Health and Human
Services’ Healthy Works countywide initiative. The Atlas aims to align with the regional planning
processes—allowing local and regional users to analyze and visualize regional data at a small area
scale related to health and health determinants that are relevant to the regional planning process.
The tool provides a series of indicator sheets for each of four major domains and focuses on health
determinants, with each determinant featuring extremely detailed maps or histograms of the
relevant data. On each sheet, the topic and its relevance to healthy planning are briefly covered;
the map or maps for that section are explained in terms of data sources and any methods used; and
a short findings section explains the implications of the data presented.
California Department of Public Health Healthy Communities Data and Indicators Project
Because of California’s Sustainable Communities Strategy outlined in Senate Bill 375
(Steinberg, 2008) and Assembly Bill 32 (Nunez, 2006), the California Department of Public Health
(CDPH), through the California Strategic Growth Council, received a two-year research and
development grant to develop a health indicator system to be a statewide resource. Funds from this
project came from Proposition 84.
The CDPH Healthy Communities Index (HCI) is in development, and is currently vetting data sources
and solidifying relationships with data partners. Eventually, the tool is hoped to be a centralized
source of information for the chosen indicators to be used at the statewide and local levels.
The webpage for the CDPH HCI is fairly basic at this point; it is hosted directly on the CDPH website
and consists of a simple project description and links to data files (some of which are already

47
available for download in tabular format) and reports. The web interface will be revamped and
improved in the near future.
Housing and Urban Development Healthy Communities Index
The HCI is currently being developed by the United States Department of Housing and Urban
Development (HUD) as part of its Healthy Communities Transformation Initiative. Healthy Housing
Solutions, Inc., is the lead organization for this project (a contractor for HUD), and being that they
are still quite early in their development process, there is no concrete tool at this point. The HCI will
form the foundation of a more comprehensive Healthy Community Assessment Tool that will be
broadly applicable to any community that is trying to incorporate healthy planning and policy into
their jurisdiction.
The tool is meant to be pilot tested in four cities: Charleston, San Diego, Albuquerque, and
Minneapolis. Some of the intended products to be developed include a health indicators system, a
healthy development checklist, and policy and design strategies.
Mariposa Healthy Living Toolkit
In 2009, Mithun, Inc., a for-profit urban design, planning, architecture, landscape architecture, and
interior design firm hired by the Denver Housing Authority (DHA), published the South Lincoln
Health Impact Assessment (HIA) on a housing redevelopment in Denver, Colorado. This HIA used the
Healthy Development Measurement Tool (HDMT) checklist created by the San Francisco Department
of Public Health as a framework. The HIA was on a master plan for a 15-acre transit-oriented, mixed
income redevelopment.
The framework was originally a simple list of indicators with local data presented. In 2012, the DHA
launched the Healthy Living Initiative, also developed by Mithun, of which the Mariposa Healthy
Living Toolkit was a part. The toolkit improved upon the earlier 2009 version by presenting an
updated and prioritized list of indicators, updated data, a report card on progress since 2009, a
campaign checklist template, and new sections on how to use the toolkit and for policy implications
of the tool.
Metropolitan Philadelphia Indicators Project
The Metropolitan Philadelphia Indicators Project tool was created in 2003 by the Metropolitan
Philadelphia Indicators Project (MPIP), and was funded by the William Penn Foundation. The tool
was developed in order to provide a regional data portal for academic and community partners.
Initially, the tool was an annual paper report but, over time, MPIP focused more on the online
interface.
The online interface allows the user to first select a geographic area (the smallest area available is at
the Census tract level), then a set of indicators based on their domain, and the year that data is
available. Once these are selected, the interface allows you to visualize the data as a map, data
table, summary statistics, scatter plot, or rank list. Each of these options has customizable
formatting options to make the data appear how the user wants it to be presented. Data queries
can be saved for quick future reference.

48
Unfortunately, due to loss of funding, the last annual report was published in 2009, and the online
tool, while still functional, has not been updated for several years.
Minneapolis Sustainability Indicators
The City of Minneapolis Office of Sustainability created the Minneapolis Sustainability Indicators.
The Office of Sustainability and the related Sustainability Indicators system were created when in
2003, the Minneapolis City Council passed a resolution to develop a sustainability plan for the city.
Currently, the Minneapolis Sustainability Indicators system is an online tool that provides
hyper-local data to the City of Minneapolis and also informs performance metrics for all city
agencies. The majority of the data is at the City level only, but some indicators are available at
smaller geographic levels (e.g., ZIP code) or they are available as a stratified variable by either age
or ethnicity. There are three major domains in the tool: a healthy life, greenprint, and a vital
community. When the user selects an indicator, they are taken to a page with generally a city-level
chart of the indicator over time, a target value for that indicator, a trend analysis that attempts to
explain what the indicator has been doing over time, and the data sources. In a separate section,
this tool also provides discussion on how to take action, a list of published reports, and information
on the Minneapolis Climate Action Plan and on the Homegrown Minneapolis initiative.
Oregon Rural Communities Explorer
The Oregon Rural Communities Explorer was created and hosted by Oregon State University in
2010. Within the Explorer, the Communities Reporter Tool provides mapped community data for
the State of Oregon and Siskiyou County, California using a Microsoft Bing-based mapping
platform.
In the mapping interface, the user first selects as many communities as they want. Then, they can
choose to compare up to 3 of those communities or combine up to 12 communities to get
aggregated statistics. Finally, they can compare these statistics to either the whole state of Oregon
or California, or to either urban or the rural parts of either state separately. Once the user finishes
their selection, the interface generates a list of possible indicators and the relevant statistics for the
geographic selections for the years that there is data available.
Seattle Healthy Living Assessment
The Seattle Healthy Living Assessment (SHLA) was created for the City of Seattle Planning and
Development Department as part of a Communities Putting Prevention to Work grant, and was
piloted in 2011 for two neighborhoods undergoing neighborhood plan updates - Rainier Beach and
Broadview - Bitter Lake - Haller Lake.
The SHLA is a paper tool that is primarily used by the Seattle Planning and Development
Department and their partners and collaborators—data for indicators are not presented or available
for download online. The Planning Department published a paper report, however, that lists the
indicators for ten domains (e.g., food access, mobility and physical activity, and community stability)
and, for each indicator, provides a rationale, a benchmark, data sources, and suggested methods to
assess them.

49
The SHLA indicators are meant to be used in conjunction with a multiple-choice community
questionnaire and a guide for facilitating neighborhood discussions. Both of these supplemental
tools are intended to collect information that is otherwise left out of or is unavailable in the
indicator process.
Sustainable Communities Index
The Sustainable Communities Index (SCI) is the name of the former HDMT, which was created by the
San Francisco Department of Public Health’s (SFDPH) Program on Health Equity and Sustainability.
The tool was born out of the Eastern Neighborhoods Community Health Impact Assessment as a
way to put the research that was done on that project online to be made available to the public on
an ongoing basis.
Currently, SFDPH uses the SCI regularly in its work with other city agencies and community
organizations. The online interface presents the overarching framework of the indicators as eight
different domains, and each indicator page includes information on why it is a suitable indicator of
health and sustainability, methodologies for creating the indicator, any limitations that exist, and
reference citations. When the user clicks a city (at this time, only San Francisco is available), they are
taken to another page that features the local data, including a map, data table, interpretation of
the data, their geographic equity analysis, and data sources.
Other features of this tool include resources for how to best apply the tool for a variety of
audiences, e.g., planners, policy-makers, community organizations, etc., such as their healthy
development checklist, policy and design strategies, and health evidence and standards.
Transportation and Health Tool
The Transportation and Health Tool is being created by a joint partnership between the Centers for
Disease Control and Prevention and the United States Department of Transportation. It is currently
under development and will be launched online in fall 2014.
This tool, as its name implies, will exclusively focus on transportation and health domains. When it is
launched, the tool will be an easy-to-use instrument that will simultaneously allow the user to
explore pre-loaded transportation and health data at the regional and state levels. It also will allow
the user to compare how their state or Metropolitan Planning Organization is doing in their
indicator measures relative to other jurisdictions. The tool will then provide recommendations for
improving the outcome measures, as well as an evidence base for integrating health and
transportation issues.

50
Table 9. Indicator domain matrix
Hea
lth
Eco
no
my
/
Em
plo
ym
en
t
Ed
ucati
on
Ho
usin
g
Tra
nsp
ort
ati
on
En
vir
on
me
nt
Cri
me &
Sa
fety
om
mu
nit
y/ So
cia
l C
oh
esio
n/
art
icip
ati
on
oo
d/ Fo
od
Acce
ss
ark
s/O
pe
n S
pa
ce
Art
s an
d C
ult
ure
Acc
ess
to
Pu
bli
c R
eso
urc
es
1 Baltimore
DataMind
Children
and
Family
Health
Income and
Economic Well
Being
Education and
Youth
Crime &
Safety
2
Boston
Indicators
Project
Health Economy/
Technology Education Housing Transportation
Environment
& Energy
Public
Safety Civic Vitality
Cultural Life &
The Arts
2 Metro Boston
DataCommon
Public
Health
Economy/
Technology Education Housing Transportation
Environment
& Energy
Public
Safety
Civic Vitality
&
Governance
Arts & Culture Land Use &
Zoning
3 GPP Healthy
People
Economic
Opportunity Education
ousing and
ommunities
Access and
Mobility
Healthy
Natural
Environment
Safe People Civic
Engagement Arts & Culture
4
Healthy
Communities
Atlas
Injury
Prevention
Physical Activity
and Active
Transport/
Injury
Prevention
Air Quality
Physical
Activity
and Active
Transport.
Physical
Activity and
Active
Transport.
Nutrition
Physical
Activity and
Active
Transport
Physical Activity
and Active
Transport.
5
Healthy
Communities
Data and
Indicators
Project (CDPH
HCI)
Health
and Social
Equity
Adequate
Levels of
Economic,
Social
Development
Adequate
Levels of
Economic,
Social
Development
Meets Basic
Needs of
All
Meets Basic
Needs of All
Quality and
Sustainability
of
Environment
Social
Relationships
That Are
Supportive
and
Respectful
Social
Cohesion
Meets Basic
Needs of All
Meets Basic
Needs of All
Meets
Basic
Needs of
All
Meets Basic Needs
of All

51
6 HUD HCI
Employment
Opportunities/
Fiscal Health
Educational
Opportunities
Housing
Quality
Transportation
Services
Environmental
Hazards
Public
Safety
Social Inclusion/
Participation
Neighborhood
Facilities &
Services
Natural
Areas
Neighborhood
Facilities &
Services
7
Mariposa
Healthy Living
Toolkit
Healthy
Economy
Public
Infrastructure
Healthy
Housing
Sustainable,
Safe
Transportation
Environmental
Stewardship
Social
Cohesion
Social
Cohesion
Public
Infrastucture
Environmental
Stewardship/
Public
Infrastructure
Social
Cohesion/
Public
Infrastruct
ure
Public
Infrastucture
8
Metropolitan
Philadelphia
Indicators
Project
Health
Regional
Economy/
Taxes/
Family
Income/
Education/
School Quality Housing
Regional
Transportation
The
Environment
Safety/
Crime and
Criminal
Justice
Civic
Participation
Arts and
Culture
Land Use
Regulations
9
Minneapolis
Sustainability
Indicators
Health
Employment
and poverty/
Arts and
economy/
Green jobs
Graduation
Rate
Cost
Burdened
Households
/
Homelessn
ess
Transportation
Alternatives/
Bicycling
Climate
Change/
Renewable
Energy/
Air Quality/
Waste
Reduction and
Recycling/
Airport Noise/
Tree Canopy/
Stormwater/
Healthy Lakes,
Streams and
Rivers/
Brownfield
Sites
Violent
Crimes
Community
Engagement Local Food

52
10
Oregon Rural
Communities
Explorer
Health &
Mortality
Income/
Employment
& Labor
Market/
Economic
Resources
Education Housing Environment
al Health
Crime &
Abuse
Community
Capacity/
Family
Structure/
Migration
Food System
Natural
Resources &
Amenities
11 SHLAT
Access to
Economic
Opportunitie
s
Youth and
Education
Community
Stability/
Housing
Mobility &
Physical
Activity/
Transportation
Mobility &
Physical
Activity/
Safety
Community
Character,
Gathering,
and Support
Networks
Food Access
Mobility &
Physical
Activity/
Parks and
Recreation
Mobility &
Physical Activity
12 SCI Health Economy Education Housing Transportation Environment Community Community Public Realm Environment Public
Realm Public Realm
13 THT Health Transportation
Does not include a category for contextual factors, such as population, race/ethnicity, age, and sometimes household income, but these are included in most tools
Creating a distinct classification system that is valid and consistent across indicators systems is challenging, therefore this is as systematic as possible given the variety in
projects. There may be overlap, redundancy, or misclassification in domain classifications

53
Appendix B: Expanded Findings from Project Interviews Tool goals and/or purposes
Baltimore DataMind – This system was developed by Carson Research Consulting, Inc. (CRC), due
to the work that its Executive Director had done with the Baltimore City Data Collaborative and
the Baltimore Neighborhood Indicators Alliance, though the actual project was not sponsored
by either of these groups. The goals of the CRC project were to create a hyper-local, accessible
mapping, and data portal for community and start-up groups to be able to use the data that
was already housed in various places, but wasn’t in an easy-to-use format.
Boston indicator projects
o The goals of The Boston Indicators Project are to, “democratize access to information, foster
informed public discourse, track progress on shared civic goals, and report on change in ten
sectors.”
o The goal of the regional Metro Boston DataCommon is to measure progress on Boston
Metropolitan Area Planning Council’s civic agenda, which is established as part of its 30-year
plan for the region, known as MetroFuture. The MetroFuture plan supports a vision of smart
growth and regional collaboration through the promotion of efficient transportation
systems, conservation of land and natural resources, improvement of the health and
education of residents, and an increase in equitable economic development opportunities
for prosperity.
o There is approximately a 40 percent overlap in the indicators for Boston’s two projects.
Greater Portland Pulse – the goal of the Greater Portland Pulse (GPP) is to have a set of
indicators to include and track as part of metro-wide strategic plan; the mayor/city was
interested in having indicators to track progress; United Way wanted to use indicators for
community impact assessments. There was not a consistent set of indicators being tracked over
time.
o Goals were to have ONE set of measures that the entire metro region (four counties) could
use to track over time.
Healthy Communities Atlas - Using available data that could be mapped, get a sense of current
health conditions, and how communities compare with each other. Tie indicators to the
regional transportation plan. A main goal is to understand current conditions and have a way to
target and identify places where built environment conditions related to health need to be
improved and strategies developed to do this.
California Department of Public Health Healthy Communities Data and Indicators Project – The
Strategic Growth Council mandated the creation of the tool via Assembly Bill 32 and Senate
Bill 375. Its goals are to provide a standardized set of statistical measures and tools to be used
for planning healthy communities and evaluating the impacts of plans, projects, policy, and
environmental changes on community health.

54
Housing and Urban Development Healthy Communities Index – The Housing and Urban
Development (HUD) Healthy Communities Index aims to develop a systematic, evidence-based
approach to assist local jurisdictions in assessing the physical, social, and economic roots of
community health, and identifying actionable policy and program activities to improve the
health and quality of life for residents. Provide a standardized and evidence based tool that
communities can use as a starting point to identify and prioritize the issues of greatest concern.
Defines criteria and metrics for community health; supports healthy communities research; and
showcases best and most promising practices for healthy communities.
Mariposa Healthy Living Toolkit – The tool was adapted for a master planning process, and a
health impact assessment of it, from the Healthy Development Measurement Tool, now the
Sustainabile Communities Index (SCI). The purpose is to inform design and development
decision-making of the Denver Housing Authority (DHA), with a focus on influencing health
determinants in the built environment and in programming. To measure progress and adjust
design to respond to priority community issues.
MetroPhilaMapper – To have a regional indicator system to see how communities were
changing and persisting. To have an interactive mapping interface. To make data available and
serve as a regional resource for academics, non-profit partners, the public, and anyone
interested in finding reliable data for the region.
Minneapolis Sustainability Indicators – These indicators are embedded in all citywide agencies as
part of their annual evaluation of performance metrics, which were adopted and developed in
large part because of the actions of a mayor that favored putting these into place.
Oregon Rural Communities Explorer – To provide an information resource to rural community
members to elevate the conversations that people are having about health and equity. To be a
trusted source of information about communities that is used to make decisions about
programs and policies that contribute to the overall wellbeing of Oregonians. Foster informed
public discourse.
Seattle Healthy Living Assessment – “To identify health assets and health gaps in a community
and a template for synthesizing data.” “Research has shown that our neighborhoods have clear
impacts on our health that range from obesity and diabetes, to mental health and life
expectancy. The Healthy Living Assessment is a tool for uncovering these findings and
translating them into actions that may improve community health.”
Sustainable Communities Index – Developed as part of a community engagement and visioning
process for a specific neighborhood planning project, where the health perspective was being
incorporated from an early point. Rather than develop the indicators for separate planning
processes as they came up, they replicated them for neighborhoods across the city. Intention
was to create a set of indicators that reflect community wellbeing and that match up with
policy and design strategies that could be used in development plans and planning projects. Has
become broader more about performance tracking for sustainability overall.
Transportation and Health Tool - The goal is to increase knowledge and awareness about the
links between transportation and health; inform health-supportive state and regional
55
transportation policy and project decisions; and strengthen collaborations between
transportation and public health sectors.
o Want to offer an easy to use online tool with pre-populated data; an assessment of how
well your state or Metropolitan Planning Organization (MPO) is doing to include health
within the transportation decision and policy-making process; recommendations for policy
improvements; an evidence base for integrating health and transportation
Users and applications
Baltimore DataMind – Due to underdeveloped evaluation tools for the first beta version the
uses of the tool are unknown at this time, but the second version of the project will include
more robust tracking methodologies.
Boston Indicator Projects – Community organizations include data in grant applications. Funders
use it to understand data and outcomes and how to connect their work to larger civic goals and
the indicators of these. Used in strategic planning – measuring and tracking progress on civic
agenda; to identify people in the community to which to target services (Federal Emergency
Management Agency planner)/ Another planner used the data to show patterns of foreclosures,
which built support for a grant to address the foreclosure issues.
Greater Portland Pulse – Identify areas to implement specific projects. Some people just go to
the site to get specific datasets. Updating existing conditions for specific plans. GPP is in the
process of developing portals with custom data and interfaces for their more involved partners
(Bureau of Planning and Sustainability, Metro). This allows their partners to tailor the site to
their needs.
Healthy Communities Atlas – Some users use the Healthy Communities Atlas data to do their
own analyses and others just use the results in baseline conditions reports or to identify target
areas for interventions (bike and pedestrian planning work), for example.
California Department of Public Health Healthy Communities Data and Indicators Project – Plans
for indicators to be used in Community Health Needs Assessments for the Affordable Care Act,
state health department accreditation. For state health department to measure progress
towards meeting the Centers of Disease Control’s (CDC) chronic disease goals. Plans for MPOs to
use indicators in Sustainable Communities Strategy and comprehensive planning processes.
Housing and Urban Development Healthy Communities Index – Plans for HUD HCI to be used by
city planners to document existing conditions in preparation for a planning process, community
advocates to make the case for investments in certain neighborhood resources, concerned
citizens to support their arguments to public officials about decisions before them, public health
professionals to document health data and risk factors, and local officials to decide where to
make certain investment (e.g., affordable housing projects).
Mariposa Healthy Living Toolkit – Used the toolkit to evaluate how three different development
options being considered by the DHA performed. The best option became the approved
redevelopment plan. The tool also used to determine implementation steps (physical plan and
also programming and social services) for the development.

56
MetroPhilaMapper – The tool has been used by various partners of Metropolitan Philadelphia
Indicators Project in advocacy campaigns, grant writing and research proposals, student
dissertations, and content in the tool has been cited in articles by local media outlets.
Minneapolis Sustainability Indicators - Undertook a climate action process to get at the climate
change indicator (resulted in an ordinance that was brought before the city council to
benchmark energy use). Also brought about a state requirement for storm water planning
(from the public works department).
Oregon Rural Communities Explorer - Program planning, improving personal understanding of
rural issues and communities, preparing presentations, grant writing, business planning. Tool is
more focused on community than specifically geared towards people whose role is planner,
although they do work with county planning departments.
Seattle Healthy Living Assessment – They have specifically used the Seattle Healthy Living
Assessment in three different communities. In each community they work with local community
organizations and the health department to gather available data for a set of indicators and
then they do surveys and meetings with community to get reactions to the indicators and
personal experiences. One big function is community building, but they also engage other city
agencies in the process to create the plan and begin implementing it.
Sustainable Communities Index – Used for a baseline conditions assessment and to provide
policy recommendations. Used by a youth commission to highlight priority areas for future
campaigns and to develop working groups. Has been used to forge relationships with other city
agencies around certain indicators or sets of indicators. For example, they have a staff person
who provides technical assistance to the transportation agency and Walk SF around the traffic
safety and other transportation indicators. They also have a specific health department partner
that focuses on land use and zoning, climate change, and labor and the work environment.
Transportation and Health Tool – It is envisioned that it will allow transportation professionals
to see how their state or region compares to others and to get ideas for strategies to improve
where/how improvement is needed. Also hoped it will be used to foster communications
between transportation and non-transportation representatives and to allow these folks to
work on issues with co-benefits across agencies and organizations.
Frequency of application
Baltimore DataMind – Because their evaluation tools for the first, beta version of their tool are
underdeveloped, the uses of the tool are unknown at this time, but the second version of the
project will include more robust tracking methodologies.
Boston indicator projects – Used, but would like them to be used more.
Greater Portland Pulse – Used by some frequently, but would like it to be used more. They are
working on this with the portals and partnerships.
Healthy Communities Atlas Used by some, but efforts to make data available online would
make the tool more used more frequently. Staff is working on developing an online application.
57
Staff felt this use was meaningful and worthwhile for participants, and that these efforts would
yield additional usage in some form.
California Department of Public Health Healthy Communities Data and Indicators Project –
Some users access it frequently (local health departments and the state health department).
Otherwise, they are working on developing a pilot program to engage other types of users.
Google analytics mentioned as a way to gauge how frequently it is used.
Housing and Urban Development Healthy Communities Index – The project is in development
Mariposa Healthy Living Toolkit – Used in one planning process – throughout the stages of the
planning process. Updated data based on implementation and construction to date, and
presented to the DHA, but it has not been used in other planning processes. DHA is considering
it for use in future projects.
MetroPhilaMapper – For a period of time, certain media groups and advocacy organizations
used the tool frequently, but because the tool has not been updated in several years, usage has
gone down. The original paper version of the tool was meant to turn readers over to the
website that had download links for data and reports, and was used less and less as MPIP
focused on the interactive web interface.
Minneapolis Sustainability Indicators – In terms of website usage, they are visited frequently
compared to other city departments. They are proactive in publishing results and highlights of
indicators. Mentioned tracking measures – they use them for tracking usage.
Oregon Rural Communities Explorer – They are always striving to reach more people and they
have seen an upward trend in the number of visiting the site (they track with Google analytics).
They also know that of the people they have surveyed, a lot had heard of the site (80%) and of
those a majority had used the data (70%).
Seattle Healthy Living Assessment – It has been used three times as part of a specific planning
process for an area of the city and they are intending to use it again in other areas.
Sustainable Communities Index – Used pretty frequently, but there are still some who have not
heard of it and they would like it to be used more. It is hard to keep tabs on how much it is
being used, especially by certain users (students, academics, community groups). Census data is
very popular, though it is not their primary focus.
Transportation and Health Tool – In development.
Indicator selection process
Baltimore DataMind – Mainly borrowed the process used by the Baltimore Neighborhood
Indicators Alliance to maintain consistency.
Boston Indicator Projects – (for Boston Indicators Project) Held a series of forums with a diverse
group of stakeholders and considered what was important to measure and what data available.
(for regional indicators) Went through a 5-year, very inclusive and extensive process for coming
up with MetroFuture – the region’s 30-year plan (citation). MetroFuture comprises 65 specific
58
goals for the year 2030, as well as objectives and indicators to measure progress toward
achieving the goals. The regional indicator project consists of these indicators developed as part
of MetroFuture.
Greater Portland Pulse – Started with the categories of indicators, found experts in the different
categories, asked experts for 18-month commitment. Then in each category they identified
desired outcomes (goals) and then drivers that could contribute to those outcomes. Indicators
measure drivers and once these were identified they researched to see if they were available.
Criteria – data available, represent all four counties in the region, represent the racial/ethnic
categories of residents in the region, indicators allow for the detection of disparities.
Healthy Communities Atlas – Formed a small working group that consisted of the consultant’s
team, public health agency representatives, and the San Diego Association of Governments
staff. This group used their technical understanding and knowledge of the literature to propose
indicators to include. Public Health Stakeholder and Technical Working Groups reviewed and
approved of the final set of indicators. Criteria – data available to create recommended
indicators at the desired geographic scale (Census block group).
California Department of Public Health Healthy Communities Data and Indicators Project –
Indicator domains came from the one-year (and five meetings) visioning process that the Health
in All Policies Workgroup engaged in. Also BARHI and County Health Rankings were guides.
Criteria – validity and reliability, availability of data, sustainability of the data source, data
updated, use public sources of data whenever possible.
Housing and Urban Development Healthy Communities Index – Very extensive process. HUD and
consultant, Healthy Housing Solutions (HHS), proposed ten domains. HHS conducted a literature
review to identify indicators in these domains. They asked a group of subject matter experts to
do additional literature review for the ten domains and considering a set of criteria, propose
two to four indicators in each domain. Then HHS and HUD asked a National Advisory Panel
(about 25 people) to go through a similar feedback process based on a set of criteria and
HUD/HHS are now in the process of incorporating the NAP’s feedback. Their goal is to have
approximately 40 indicators. Criteria – measurability, nexus to health, data availability at a
neighborhood scale, publicly available data, indicator actionability, community relevance. They
are in the process of finalizing the final list of indicators and this has taken about a year to get
to this point.
Mariposa Healthy Living Toolkit – Started with SCI indicators and adapted to Denver. Criteria –
data availability, indicator relevance to the decision on the housing redevelopment, and the
scale of the development. Had a community and a technical working group review the
indicators. Did a round of review in 2009 (took two months) and an updating round in 2012
(included a more rigorous process). Referenced the literature and the NYC Active Design
Guidelines, as well as LEED-ND, LEED-NC, Enterprise Green Communities Criteria, and the
Sustainable Sites Initiative.
MetroPhilaMapper – Much of work done in-house and with a 15-member advisory group that
involved business, finance, education, child advocacy, environmental organizations.

59
Minneapolis Sustainability Indicators – The initial process was consensus based and a community
process. Now they update the list and this process takes about six to eight months. For update,
start with the city departments (subject matter experts), confirming this is still the best way to
measure this and what is the appropriate target level and year. The environmental advisory
commission gives feedback and the city council members give feedback and approve them.
Oregon Rural Communities Explorer – Their process is not that extensive because they do not
have much of a filter. Their goal is to make as much data available as possible and to make it
simple and easy to use. They do not have targets for their indicators. They adjust the indicators
as necessary when they do yearly updates, so they do not get too concerned with getting it
perfect.
Seattle Healthy Living Assessment – Mostly an internal process of coming up with the indicators,
but since they used them in conjunction with a survey and could get feedback about the
meaning of the indicators, they indicators were supported by a community process. Criteria –
based on existing data, presence of research indicating a connection between the indicator and
population health outcomes, available at the neighborhood AND city level.
Sustainable Communities Index – Selected as part of a community visioning and planning
process and informed by academic research. Also informed by needing to be collected and
maintained over time. The process of updating them is more internal and based on research,
knowledge and experience now.
Transportation and Health Tool – With a set of core partners (CDC, Department of
Transportation, American Public Health Association, Planning Communities), came up with a
long list of potential indicators. Then did literature search and removed many of these (down to
34). Criteria – research and understanding of the indicator, data availability, scale of date, data
coverage, balance between topic areas, meaningful/understandable. Then talked about with a
group of about 40 experts and got down to 14 indicators. Not calling contextual factors
indicators.
Collecting, processing, and updating data for indicators
Baltimore DataMind – Using Census data and other city agency data.
Boston indicator projects – Use available data and have some funding to collect their own data.
University partner was helpful for data issues.
Greater Portland Pulse – Rely on data that is public and free. Also relied on stakeholders who
were data savvy and graduate students helped too. Initially took three to four months to get
data up. Have access to university’s resources – the office of academic computing (this is a huge
advantage). They use Weave, which allows them to upload spreadsheets to it. They can be
pretty simple and quick about inputting and uploading data.
Healthy Communities Atlas – Urban Design 4 Health did all the data collection and processing. It
took a while, but they have documentation, so it could be updated if desired.

60
California Department of Public Health Healthy Communities Data and Indicators Project –
Using mostly public sources of data. Data from state agencies. Have in-house technological
capacity to process and prepare data, but looking to hire others to help.
Housing and Urban Development Healthy Communities Index – Doing initial steps of figuring
out how to apply the data to the indicator and will provide technical assistance – to make it
easier for pilot cities to get the data, process it and upload it.
Mariposa Healthy Living Toolkit – Relied on preexisting data (Census and City agency data) and
surveys that were already done and relevant for the neighborhood. Also partnered with the
local boys and girls club to implement the Pedestrian Environmental Quality Index, and did
some limited mapping analysis.
MetroPhilaMapper – Had to mostly rely on existing data and documentation. They could not
get access to some city data. Started getting and processing data in-house and then used
outside help for mapping.
Minneapolis Sustainability Indicators – Update process takes four to six months. Work with
partners (e.g., public health department) to get the data and some partners process it for them.
Use Census data and they do the processing.
Oregon Rural Communities Explorer – Use available data. Update yearly. Takes about four
months to update the data. In some cases they have to key in the data (if they got it from
spreadsheets). They prepare the data in spreadsheets and upload those into a SQL server.
Seattle Healthy Living Assessment – They use data that is in the public domain, but some of
their data was collected manually because this was easier and more reliable. Also developed
relationships with city departments with data (like police precincts), which was important. They
also do surveys as part of their process.
Sustainable Communities Index – Rely on data that is easier to get (Census) and that they can
get access to through other city departments and data partners (DataSF). Very time intensive to
update it – took them over a year to get the data, clean it, process it, and upload it.
Transportation and Health Tool – Using regional and state-wide data, so this is not as much of
an issue for them. Their issue is more about whether or not indicators are meaningful at a state
or regional scale.
Interface and backend
Boston indicator projects – Open source. Use Weave as data visualization component. Use Jengo
and Geoserver. Mentioned Tableau as having a nice interface, but this is proprietary. They seem
really tech savvy. Advice: look for a technical partner.
Greater Portland Pulse – Graduate student designed interface. Use Weave, but don’t necessarily
recommend it. They have help from the university’s computing department when they have
issues with Weave.
61
California Department of Public Health Healthy Communities Data and Indicators Project – Have
technical capacity in the main leader of the project and with input from others. He is the web
master.
MetroPhilaMapper – Designed in-house. Not too sophisticated. Mapping done by a consultant
Minneapolis Sustainability Indicators – Designed in-house and also with the help of an intern
interested in these. Use the city’s content management system
Oregon Rural Communities Explorer – Used one programmer, some contractors and the
university’s existing design to create the interface and the structure of the data. They also focus
group tested them and have checked in with users to make sure the interface is still working.
Sustainable Communities Index – Had one contractor design the interface and back end with
the input of staff in the department. The interface is simple – you input text and upload tables
and maps. Once their structure was in place it is easy to work with, but more set and hard to
change if you wanted to.
Outreach process
Baltimore DataMind – Haven’t really done any outreach but are thinking of partnering with
foundations to get grants to train community members.
Boston indicator projects – Do specific outreach. Trainings every other week and conference
once a year or every other year focused on how to use data for civic change. Blogging and
Twitter.
Greater Portland Pulse – Put out a newsletter to report on data updates and new developments,
present at conferences, Facebook page points out connections between current events and
data. Do specialized presentations to potential partners (Portland Community College) and they
(when asked) will do data customizations and special projects. Are working on publishing a tool
box and case studies for how to use an indicator site. Attend conferences – regional equity
conference.
Healthy Communities Atlas – Worked through established stakeholder groups put together by
the MPO. Also thought that the word got out through the representatives for the local
jurisdictions, as these were a primary intended user.
California Department of Public Health Healthy Communities Data and Indicators Project –
Haven’t done a lot. Planning to do it through pilot projects as there is a strong participatory
element to getting users involved. Plan to put out manuals on how to do specific things on the
website.
Housing and Urban Development Healthy Communities Index – Will happen through pilot cities
– more up to them how they want to do it.
Mariposa Healthy Living Toolkit – Its written materials are intended to facilitate the continued
use of this tool in other planning processes. Getting people involved in the planning process
that used the tool is also part of the outreach process.

62
MetroPhilaMapper – Series of workshops that trained a wide variety of users (legislative
assistants, mayor’s office of community service, people in social services agencies).
Minneapolis Sustainability Indicators – No outreach or trainings.
Oregon Rural Communities Explorer – Trainings around the state (1 to 2 hour workshops, 8 to
12 per year) and are part of a leadership development training that their funder puts on.
Maintain listserv of users. Facebook and Twitter. They have a person who does the trainings and
he also provides some assistance for users who need it (not time intensive, though).
Seattle Healthy Living Assessment – The tool is the outreach and it brings together different city
departments and community members and organizations.
Sustainable Communities Index – They do about one training per year on the tool for
community groups and/or city agency representatives. They do an indicator exercise as part of
its Health Impact Assessments training that they do once per year. They do meetings by request
too with community organizations and actively build partnerships with representatives in other
agencies or organizations around certain indicators.
Transportation and Health Tool – educating champions at different geographic scales and across
jurisdictions.
Funding/Costs
Baltimore DataMind – Self-funded. They are a private company. About $100,000 (annual).
Boston indicator projects – The Boston Foundation funded the Boston Indicators Project and this
was done collaboratively and with general operating funds for the Metro Boston Indicators
Project.
Greater Portland Pulse – A few different organizations put in funds to get it started (between
$5,000 and $60,000 each) and these are their core partners. They continually look for funding,
which is hard. $250,000 per year
Healthy Communities Atlas – Project (and the consultant who executed it) were written into the
CPPW Grant about $150,000.
California Department of Public Health Healthy Communities Data and Indicators Project – A
two-year grant was part of the sustainable communities and climate change reduction portion
of Proposition 84. They will need to get other funding for operations and implementation,
especially for any IT-related projects, such as a more robust web interface, as the approval
process requires more extensive documentation on what the functionality and capacity of the
project will be. CDPH is currently applying for other grants to support this effort, $150,000 to
$200,000.
Housing and Urban Developement Healthy Communities Index - The HCI is one aspect of HUD’s
three-year Healthy Communities Transformation Initiative. Funding of $500,000 per year
includes indicator selection and creation of the Index itself; development of a web-based
Assessment Tool; and the piloting stage.

63
Mariposa Healthy Living Toolkit – funding came from the planning budget as part of the
pre-development costs for the development. What they ended up doing was more than they
were funded to do. About $50,000; excluding additional in-kind staff, partner, and consultant
time.
MetroPhilaMapper – Three-year grant from the William Penn Foundation also used funds for
another project and put it towards this. $125,000 to $200,000 per year.
Minneapolis Sustainability Indicators – Project funded through the Office of Sustainability
through the City of Minneapolis general operating budget.
Oregon Rural Communities Explorer – Funded continually through the Ford Family Foundation.
At beginning Oregon State University contributed money to the project. Library also has kicked
in money. Project has taken more of people’s time than expected and people have given more
of their time than they are being reimbursed for. $100,000 per year, but should get more.
Seattle Healthy Living Assessment – Communities Putting Prevention to Work (CPPW) grant and
then transferred funding to general fund. About $60,000 (total CPPW grant was $108,000 and
the Healthy Living Assessment took about half)
Sustainable Communities Index – Functions supported by general fund.
Transportation and Health Tool – Funded by Centers for Disease Control and Department of
Transportation. Total about $180,000 per year (3-year project).
Staffing
Baltimore DataMind – One to two people not full time
Boston indicator projects – Have about ten people, but no one works on the indicators project
full time. Everyone has other responsibilities and sometimes this other work contributes to and
complements the indicators data.
Greater Portland Pulse – One full time person, two part time graduate students, a couple others
who devote some time, but are not close to full time.
Healthy Communities Atlas – Had 4 people working (none full time) on it plus the consultant,
who carried much of the execution responsibility. Consultant likely had more than one person
working on it, but no full time commitments.
California Department of Public Health Healthy Communities Data and Indicators Project – More
than 1 person devoting only a portion of their time to the project.
Housing and Urban Developement Healthy Communities Index – Too many people involved to
give an accurate estimate. In addition to a number of subject matter experts, two staff from
Healthy Housing Solutions very involved, and a team from HUD with two main HUD staff.
Mariposa Healthy Living Toolkit – Two to three people working on it but not devoting all of
their time.

64
MetroPhilaMapper – One project manager devoting most, if not all of their time. Two to three
graduate students. Also higher level people involved at some percentage of their time.
Minneapolis Sustainability Indicators – Two staff and one intern, though not sure if the two
staff are full time on this project (probably not).
Oregon Rural Communities Explorer – One person full time, plus through two people and some
graduate research assistants they make less than one full time equivalent (less than 2 full time
employees).
Seattle Healthy Living Assessment – Approximately five people work on the project, though
they don’t devote near all of their time to it.
Sustainable Communities Index – Approximately four people working on it some with one of
these people devoting more time than the others and with help from interns here and there.
Transportation and Health Tool – Four people, one of whom is devoting most of their time to
the project. Six to eight people with some involvement on a more regular basis.
Benefits/Challenges
Baltimore DataMind – Benefits: data visualization is rewarding and not many people are doing
it. Challenges: Funding challenges. Technology challenges – finding the right program (e.g.,
google maps or policy map) that is user friendly and has the functionality you want (ability to
print or paste an electronic version into a file). Getting the word out about the project was
hard. Collaborating with partners – had a hard time reaching and connecting with
organizations doing similar things to make the work less redundant and to pool resources.
Boston indicator projects – Benefits: Its collaborations around the data and indicator work is key
to the longevity of the project. For example, if there are leadership changes, the project doesn’t
end, but you can figure out how to shift responsibilities temporarily. Challenges: collaborations
are hard. One example, partners are accountable to different people and have different
timelines, so it can be difficult to align goals and schedules to accomplish something everyone is
happy with. Can be hard to please everyone.
Greater Portland Pulse – Benefits: are just starting to be more strategic with getting the site and
information used and creating partnerships after three years (most of this time was spent
developing the indicators). Being part of the NNIP has been a big benefit – having leaders and
examples to follow. Challenges: tradeoffs between budget and data collection or sophistication.
Has been hard to operate in the absence of an overarching ideology or framework because they
can’t advocate for anything themselves. Having a regional focus is both good and bad – makes
data issues hard sometimes – e.g., getting consistent data.
Healthy Communities Atlas – Benefits: got a good and useful product that caught people’s
attention and is being used by some. Challenges: they had wanted to connect health outcomes
to measures of the built environment, but the health data collected are not easily comparable
due to their scale. Collecting the data, storing it, and disseminating it are all challenges, but
they did overcome these to produce the Atlas.

65
California Department of Public Health Healthy Communities Data and Indicators Project –
Benefits: infrastructure and programming resources (e.g., systems that function through the
same programs, like SAS) make it so you can do more with your initial investment.
Collaborations with other indicator projects and a commitment to not be competitive or
redundant. Challenges: collaborations – responding to the needs of different organizations and
being flexible. May have to change original plans to create an indicator that is more used.
Challenging to get all user communities engaged. Getting data is challenging.
Housing and Urban Development Healthy Communities Index – Benefits: having a very
thoughtful and robust process for selecting indicators that involved a large group of
stakeholders with a diversity of perspectives. Challenges: Getting people on the same page
about goals and data. Keeping the project moving. Having the project be used. Tradeoff
between making data easy to use or sophisticated and fancy. Can take a long time to do it right
and have a robust process.
Mariposa Healthy Living Toolkit – Benefits: Brought people to the table that normally wouldn’t
be involved in housing decisions. Successfully integrated indicators into the redevelopment
process. Developers now required by the housing authority to meet criteria plan for health
outcomes. City council member became champion of integrating health in decision-making.
Challenges: tracking data over time – who should do it, at what level, and the best way to do it.
How to talk about health, especially to community members. Keeping people involved over the
long term and how to motivate change. Making evidence at a higher geography relevant for
very localized planning and issues.
MetroPhilaMapper – Benefits: pushed idea of data as important for informing community
priorities. Earlier system to join the NNIP. System fulfilled its original purpose and goals.
Challenges: the regional scale made it hard to ground the data in local issues. Getting
stakeholders on the same page about the project’s goals. For example, funder was hands off
and an academic institution, so they were more interested in data quality and publishing, rather
than on community concerns. Funding challenges – funded by a foundation that was hands off
and had different priorities. Funding priorities also shifted from the goals to make data
available to make better policy and program changes to an impact oriented purpose where
people wanted to show changes. All their challenges caused the project to now become an
archive that doesn’t get updated. They emphasized having multiple sources of funding and
having a connection to the community to increase project sustainability and longevity.
Minneapolis Sustainability Indicators – Benefits: incorporating indicators in ongoing
performance review, which validates them and confirms their utility and importance. Figuring
out how to go from a paper report to online reporting was a big success, especially doing so at
a low cost. Important to pay attention to emerging issues and reflect those in the tool. Has been
good for them to have engaged policy-makers at a high level and to have them see value in the
process. Challenges: Indicator selection decisions difficult – what to measure and how to
measure it. Census data is unreliable at small geographic scales.
Oregon Rural Communities Explorer – Benefits: have seen some success with their initial goal of
elevating the conversation – people ask more about relationships between community
characteristics and how to use the information in program planning. Their site is really easy to
use. Businesses are using the information for the business decisions, which shows there is an

66
economic development benefit to the work. They have modest goals, so they can pay attention
to doing them well. Challenges: updating a lot of data every year, which requires people and
they don’t have a lot of people. Foundation funded, which feels tenuous. Data quality is hard –
you need people who are able to keep the data straight and who pay attention to the details
and can see when things are funky. This is a challenge with using grad students. Challenging to
get people to use the data to make decisions. People use the data to justify something that they
are already doing, rather than it determining what is done. Challenging having the goal of
democratizing access to data, but maintaining the credibility of the data and them as the
resource.
Seattle Healthy Living Assessment – Benefits: The tool is a great complement to community
process. It champions people and takes people to champion. It is and continues to be the
primary fabric of planners and public health people. They are looking to implement it again
locally and even share it with others in different locations. Challenges: data and resolution are
challenges. Challenging aligning frameworks and goals – public health and planners want them
to be able to connect the work to specific health outcomes, but this doesn’t make as much sense
to the community and it is not always possible to do. They have moved to talking more about
community resilience, the presence of jobs and economic development. These are also things
that are harder for planners to work on. It is a challenging framework for planners – think
about things holistically and broadly.
Sustainable Communities Index – Benefits: It is an amazing tool. They haven’t seen many like it,
that are simple and effective and with visually compelling maps. They have created strong
partnerships. For example, their work around pedestrian safety corridors has resulted in these
maps being posted in police stations and used for decision-making. Some indicators are really
powerful and are used by different groups and city agencies. The tool has helped
institutionalize relationships with other city departments. Has resulted in the health department
being viewed as a neutral entity that can bring information about health relationships and data
to decisions being made across the city in a variety of sectors. Specifically, their air quality work
has contributed to the addition of an article to the health code that specifies sensitive use
categories and air quality areas of concern and requires the use of filtrations systems to remove
a percentage of the particulate matter. They have done different but similarly exciting work
around making building code violations data available and creating standards for publishing it
online and in commercial contexts, so people can use it to make decisions about where to live.
Challenges: time intensity of maintaining and promoting the information and data – they have
more than just data, but also policy and design standards, literature evidence, and promoting
the development checklist. It is hard to keep the staff and tool in people’s consciousness to have
the data used and make a difference in decision-making.
Transportation and Health Tool – Benefits: a very comprehensive literature review has told them
areas that need more research and is an amazing resource. Challenges: everybody brings a
vision of what they want it to be and some are experts with strong opinions. You have to
manage expectations very carefully. You need to have a strong and clear set of goals and a
vision that you can keep coming back to in these challenging times.

67
Appendix C: Interview Instrument San Diego Association of Governments/Health and Human Services Agency – Health
Analysis Tool Scope Development
Best Practices from Other Locations
Name of the indicator system and location:
Name of interviewee:
Interviewee’s affiliation:
Date of interview:
Explanation of the project and request for input
I am with a non-profit organization, based in Oakland California, called Human Impact Partners.
Just to tell you a little bit about us - our mission is to increase the consideration of health and equity
in decision-making and we do this by raising awareness of and collaboratively using data, processes
and tools to evaluate the health benefits, impacts and equity implications of decisions.
I’m talking to you today because the San Diego Association of Governments (also known as
SANDAG) and the Health and Human Services Agency (HHSA) in San Diego, as part of their
Community Transformation Grant from the Centers for Disease Control, have hired us to develop a
scope for what we have been calling a health analysis tool – which is just a fancy name for an
indicator system. The tool is one part of a broader strategy to build capacity throughout the
San Diego region to conduct health assessments on a variety of proposed planning-related projects,
policies and plans at the regional and local levels.
In this context, our partners in San Diego have asked us to do some research to better understand
other efforts to scope, develop and implement similar types of health analysis tools or indicator
systems that have been created across the country. We have done a scan of other indicator systems
(of which there are many) by looking at what is available online and have narrowed our list down
to a few that we would like to learn more about. We have prepared a list of questions to help us
understand best practices in terms of the goals, applications and users of other indicator systems;
the processes utilized for scoping, developing, marketing, staffing and maintaining projects; and
successes and challenges experienced in these efforts. We are planning to interview about a dozen
locations and summarize what we hear in a report that we will present to SANDAG and HHSA.
We have identified the XX as a project that we would like to hear more about. We think your
experiences will be very valuable for our partners and we would very much appreciate your time
and insights related to the project. Would you be willing to participate in the interview? It
shouldn’t take more than an hour.
Do you have any questions for me before we get started?

68
Questions
Purpose and Applications
1) Why did you decide to create the XX? What were the goals of the project? What would you
say is the primary purpose for the XX?
2) Who are the users? [Prompt: If the groups below are not mentioned, ask about them
specifically]
___ local planning jurisdictions
___ public health departments
___ other government agencies (e.g., transportation, housing)
___ community groups or advocacy organizations?
3) Do you know how these different groups have used it and what have been some of the
outcomes?
4) Do you have a sense for how much (or how little) it is being used by different groups [Prompt:
frequent, occasional, never]? If you have an online version and a paper version (or report), do
you have a sense for which is more utilized?
5) Who are some of your partners and how do you work with them? [Prompt: partners could be
development or implementation-related or client/user-related]
6) Is the project part of a collective with other locations? If so, what do you have to do to be part
of the collective?
Process
What has been your process?
1) For funding the project? [Prompt: Where does your funding come from? Was it difficult to
secure? Did you have to convince any particular people and how did you do that?]
2) For selecting the indicators? [Prompt: Did you do research to inform your choices? Who was
involved in making decisions about indicators to include/exclude? Did you engage any
stakeholders in particular (policy-makers, agency staff, community/advocacy organizations,
others)?]
3) For getting and processing the data? [Prompt: you could give me a couple examples of data
sources and how you got them?]
4) For designing the components and interface and adding the data? Did you work with any
contractors? [Prompt: process for implementing the online technological components?]
5) For outreach to or training for potential users, or piloting the project in a particular area? Do
you have a sense for the level of ease or difficulty of use?
6) What is your philosophy on high resolution data (i.e., small geographic scale)?

69
7) How many staff people work in the program/department that is responsible for XX?
8) What were and are the costs – actual and/or staff time – to implement, maintain and respond
to questions or requests about the system? How involved does staff have to be every time the
tool is used?
Reflections
[Pay attention to things that have already been mentioned that these questions ask about]
1) What were some of the things that worked out really well with the project?
2) Did the system fulfill its purpose and/or meet its goals?
3) Did you have any unexpected benefits or issues that came up (e.g., audiences, users,
applications, design aspects)? If issues came up, how did you deal with them?
4) What were/are some of your challenges? [Prompt: challenges related to indicators and data,
implementation or maintenance, and/or promoting the tool and having it used]
5) Do you have anything else to share about the project overall or implementing and sustaining
it?