house prices, ownership and affordability: trends in … · house prices, ownership and...
TRANSCRIPT

House prices, ownership and
affordability: trends in New South Wales
Briefing Paper No 1/2014
by Andrew Haylen

RELATED PUBLICATIONS
Economic Indicators NSW (October 2013). Statistical Indicators 09/2013 by Andrew Haylen
Social Housing. E-brief 8/2011 by Louise O’Flynn
Housing Affordability. Briefing Paper 04/2011 by Louise O’Flynn
Affordable Housing in NSW: Past to Present. Briefing Paper
No. 14/2005 by John Wilkinson
CORRIGENDUM
A new Figure 14 has been inserted in this publication; Figure 13 has been revised, as has Figure 28 (formerly Figure 27).
ISSN 1325-5142
ISBN 978-0-7313-1911-4
January 2014
© 2014
Except to the extent of the uses permitted under the Copyright Act 1968, no part of this document may be reproduced or transmitted in any form or by any means including information storage and retrieval systems, without the prior consent from the Manager, NSW Parliamentary Research Service, other than by Members of the New South Wales Parliament in the course of
their official duties.

House prices, ownership and affordability: trends in New South
Wales
by
Andrew Haylen
NSW PARLIAMENTARY RESEARCH SERVICE
Gareth Griffith (BSc (Econ) (Hons), LLB (Hons), PhD), Manager, Politics & Government/Law .......................................... (02) 9230 2356 Lenny Roth (BCom, LLB), Senior Research Officer, Law ....................................................... (02) 9230 2768 Lynsey Blayden (BA, LLB (Hons), GradDipLaw), Research Officer, Law ................................................................. (02) 9230 3085 Jack Finegan (BA (Hons), MSc), Research Officer, Environment/Planning ..................................... (02) 9230 2906 Andrew Haylen (BResEc (Hons)), Research Officer, Public Policy/Statistical Indicators .................. (02) 9230 2484 Daniel Montoya (BEnvSc (Hons), PhD), Research Officer, Environment/Planning ..................................... (02) 9230 2003 John Wilkinson (MA, PhD), Research Officer, Economics ...................................................... (02) 9230 2006
Should Members or their staff require further information about this publication please contact the author.
Information about Research Publications can be found on the Internet at:
http://www.parliament.nsw.gov.au/prod/parlment/publications.nsf/V3LIstRPSubject
Advice on legislation or legal policy issues contained in this paper is provided for use in parliamentary debate and for related parliamentary purposes. This paper is not professional legal opinion.

CONTENTS
LIST OF FIGURES AND TABLES .................................................................... iii
SUMMARY ........................................................................................................ vi
1. INTRODUCTION ..................................................................................... 1
2. TRENDS IN HOUSE PRICES ................................................................. 2
2.1 Capital city house prices ....................................................................... 2
2.2 NSW house prices................................................................................. 4
2.2.1 Sydney price outlook ...................................................................... 7
2.3 Housing bubble? ................................................................................... 7
3. HOUSING DEMAND ............................................................................... 9
3.1 General demand drivers ........................................................................ 9
3.1.1 Population growth ......................................................................... 10
3.1.2 Economic and income growth ....................................................... 11
3.1.3 Employment .................................................................................. 13
3.1.4 Interest rates ................................................................................. 14
3.2 Structural changes in demand ............................................................ 15
3.3 Composition of housing demand ........................................................ 16
3.3.1 Owner occupier demand – Non-first home buyers ........................... 17
3.3.2 First home buyer demand ............................................................. 19
3.3.3 Investor demand ........................................................................... 23
3.3.4 Foreign investor demand .............................................................. 26
4. HOUSING SUPPLY............................................................................... 31
4.1 Building approvals ............................................................................... 33
4.1.1 Australia ........................................................................................ 33
4.1.2 New South Wales ......................................................................... 35
4.2 Housing supply responsiveness .......................................................... 37

5. HOME OWNERSHIP AFFORDABILITY INDICATORS ........................ 39
5.1 Rental prices and housing costs ......................................................... 39
5.2 Household income to house price ratio ............................................... 43
5.2.1 Comparison within Australia ......................................................... 44
5.3 Mortgage repayments ......................................................................... 46
5.4 Household debt ................................................................................... 46
5.5 Affordability indexes ............................................................................ 47
5.5.1 Real Estate Institute of Australia Affordability Index ..................... 48
5.5.2 Commonwealth Bank of Australia–Housing Industry Association Housing Affordability Index ........................................................................ 49
5.5.3 BIS Shrapnel Home Loan Affordability Index ................................ 51
5.5.4 Demographia International Housing Affordability Survey .............. 52
6. OUTCOMES OF REDUCED AFFORDABILITY ................................... 54
6.1 Home ownership rates ........................................................................ 54
6.2 Wealth distribution ............................................................................... 56
7. CONCLUSION ...................................................................................... 59

LIST OF FIGURES AND TABLES
Value of residential purchases by buyer type, Australia .................................... vii
Figure 1: Real house prices, GDP per capita and weekly earnings .................... 2
Figure 2: Selected capital city house price indexes ............................................ 3
Figure 3: Selected capital city median established house prices........................ 4
Figure 4: NSW quarterly regional house prices, nominal, all dwellings .............. 5
Figure 5: Sydney inner-ring dwelling prices, by strata type ............................... 6
Figure 6: Inner ring prices relative to average NSW prices, by strata type ......... 7
Figure 7: NSW population and annual change in Sydney population ............... 10
Figure 8: Quarterly change in NSW population ................................................ 11
Figure 9: NSW full time adult weekly earnings ................................................. 12
Figure 10: Change in NSW gross state product and median dwelling price ..... 12
Figure 11: Unemployment rate, all persons, NSW ........................................... 13
Figure 12: Cash rate and standard variable rate .............................................. 14
Figure 13: Value of residential purchases by buyer type, Australia .................. 16
Figure 14: Distribution of residential home buyers, by type .............................. 17
Figure 15: Non-first home buyer owner-occupier dwellings financed, NSW and NSW median dwelling price.............................................................................. 18
Figure 16: Proportion of owner-occupier non-first home buyers, NSW and Australia ........................................................................................................... 19
Figure 17: Owner-occupier first home buyer dwellings financed, NSW ............ 20
Figure 18: Number of first home buyer grants, NSW ........................................ 21
Figure 19: First home buyer proportion of owner-occupier dwellings financed, NSW and Australia ........................................................................................... 22
Figure 20: Owner-occupier and investor finance, Australia .............................. 24
Figure 21: Value of household financial and non-financial assets, by type, Australia ........................................................................................................... 25
Figure 22: Ratio of dwelling to share asset values ........................................... 26
Figure 23: Residential foreign investment approvals, nominal, Australia ......... 27

Figure 24: Value of residential foreign investment, nominal, by stage of development ..................................................................................................... 27
Figure 25: Value of residential real estate foreign investment, nominal, by state ......................................................................................................................... 28
Figure 26: Value of residential real estate foreign investment, nominal, by country ............................................................................................................. 29
Figure 27: Value of foreign investment, nominal, by industry ........................... 29
Figure 28: Foreign investment approvals as a proportion of total purchase values, Australia ............................................................................................... 30
Figure 29: Real house price and construction cost indexes, Australia ............. 32
Table 1: Cumulative demand-supply gap, Australia ......................................... 32
Figure 30: Annual dwelling approvals, by type, Australia ................................. 34
Figure 31: Annual value of residential work, by type, Australia, original ........... 35
Figure 32: Annual dwelling approvals, by type, NSW ....................................... 36
Figure 33: Annual value of residential work, by type, NSW, original ................ 36
Figure 34: Median rent for all dwellings, by area, NSW .................................... 40
Figure 35: Rent-to-income ratios, by quintile and renter stress ........................ 41
Figure 36: Weekly housing costs, by tenure and landlord types, Australia ....... 42
Figure 37: Housing costs for renter with private landlord, by state, 2011-12 .... 42
Figure 38: National dwelling price-to-income-ratio, by measurement type ....... 43
Figure 39: Dwelling price-to-income-ratio, by area, nationwide medians ......... 45
Figure 40: Dwelling price-to-income-ratio, by capital city, nationwide medians 45
Figure 41: Housing interest payments as a proportion of disposable income, Australia ........................................................................................................... 46
Figure 42: Household debt as a proportion of household assets, Australia ...... 47
Figure 43: Real Estate Institute of Australia Housing Affordability Index .......... 49
Figure 44: CBA-HIA Housing Affordability Index, Methodology 1 ..................... 50
Figure 45: CBA-HIA Housing Affordability Index, Methodology 2 ..................... 51
Figure 46: BIS Shrapnel Home Loan Affordability Index .................................. 52
Figure 47: Demographia Median Multiple ......................................................... 53
Figure 48: Home ownership rates, by age and income quintile ........................ 54
Figure 49: Home ownership rates, by age group, Australia .............................. 55
Figure 50: Income required to service an average FHB loan, Australia ........... 56
Figure 51: Net household worth by age and tenure .......................................... 57
Figure 52: Change in wealth, by home owner group, 2002 to 2010 ................. 57
Figure 53: Change in wealth, by age group, 2002 to 2010 ............................... 58

SUMMARY
Capital city house prices
Between 1995 and 2005, real house prices in Australia increased by more than 6 per cent annually. This was well above the average annual increase in the 20 years to 1995 of just 1.1 per cent.
When compared with some other capital Australian cities, established house prices in Sydney grew at a considerably slower pace through much of the 2000s; and most capital cities experienced flat or negative growth toward the end of the 2000s. Since the end of 2012, capital city established house prices have generally increased. The median established house price in Sydney has increased by 15 per cent since December 2011. Perth (up by 9 per cent) also experienced relatively strong median house price growth over this period. As of March 2013, Sydney had the highest median established house price at $605,000, followed by Perth ($528,000) and Melbourne ($480,000). [2.1]
NSW house prices
Between June 1990 and June 2013, the median NSW dwelling price (for all dwellings) increased by $339,000 (262 per cent). Price growth has been most pronounced in the Greater Sydney region where the median dwelling price in the Inner Ring of Sydney increased by $555,000; prices in the Middle and Outer Rings of Greater Sydney grew by $455,000 and $332,000 respectively.
The recent upturn in the Sydney market is being led by inner Sydney which has outperformed Sydney’s overall median growth. Since the end of 2012, the median Inner Sydney Ring dwelling price grew by $70,000. The median dwelling price in the middle and outer Sydney rings also grew by $56,000 and $38,000 respectively. [2.2]
According to BIS Shrapnel, growth in Sydney’s median house price is forecast to continue rising by 6.5 per cent in 2013-14, 6.1 per cent in 2014-15, and 5.1 per cent in 2015-16. This growth is expected to be driven by improved State economic conditions and also by the deficiency of dwelling stock into the middle and outer suburbs. [2.2.1]
General demand drivers
On the demand side, a number of factors have contributed to the strong growth in house prices over the last two decades: high population growth (primarily as a result of high migration); real household income growth; nominal interest rates have fallen; and financial deregulation has meant that housing finance is more readily available. [3.1]
Between 1991 and 2011, NSW’s population increased by 1.3 million people, with Sydney accounting for 71 per cent of this increase. New South Wales’ population increased by 92,827 persons through the year to March 2013 which represents an increase of 1.8 per cent which was the highest level of growth since the 12 months to March 2008. [3.1.1]

Between 1993 and 2000, Gross State Product (GSP) grew in NSW at an average annual rate of 4 per cent. This strong period of economic growth also corresponded with the rapid increase in real estate prices which grew at an average rate of 7.5 per cent over the same period. [3.1.2]
The move to a low-inflation environment saw interest rates fall over much of the 1990s and remain at these relatively low levels throughout the 2000s. The Productivity Commission (2004) and the Senate Select Committee on Housing Affordability in Australia (2008) both concluded that cheaper and more accessible housing finance underpinned demand and house price growth. The current monetary easing cycle has seen the cash rate fall by 225 basis points to 2.5 per cent (its lowest level in more than 50 years), which has triggered strong demand growth in the last 12 months. [3.1.4]
Composition of housing demand
Prior to the late 1980s, housing demand was largely accounted for by owner occupiers. However, the rapid escalation of prices in the early 1990s, combined with structural tax changes and improved access to credit, saw residential real estate become a highly desirable form of investment. First home buyers and owner-occupiers are now not only competing with domestic investors, but also foreign investors. [3.3]
Value of residential purchases by buyer type, Australia
Upgraders and downsizers represent the largest component of residential real estate demand in NSW. In November 2013, there were 16,140 non-first home buyer (NFHB) owner occupier dwellings financed in NSW. This is above the previous 6-year monthly high of 15,264 reached in October 2013. There have been 156,751 NFHB owner occupier dwelling finance commitments over the 12 months to November 2013. This is well above the calendar average of 125,759 since 2007. NFHB demand as a proportion of owner occupier demand reached a high of 93 per cent in NSW, around 6 per cent above the Australian average. [3.3.1]
$b
50
100
150
200
250
300
350
19
95
-96
19
96
-97
19
97
-98
19
98
-99
19
99
-00
20
00
-01
20
01
-02
20
02
-03
20
03
-04
20
04
-05
20
05
-06
20
06
-07
20
07
-08
20
08
-09
20
09
-10
20
10
-11
20
11
-12
20
12
-13
First Home Buyers (FHB)
Non-FHB
Investor
Foreign investor
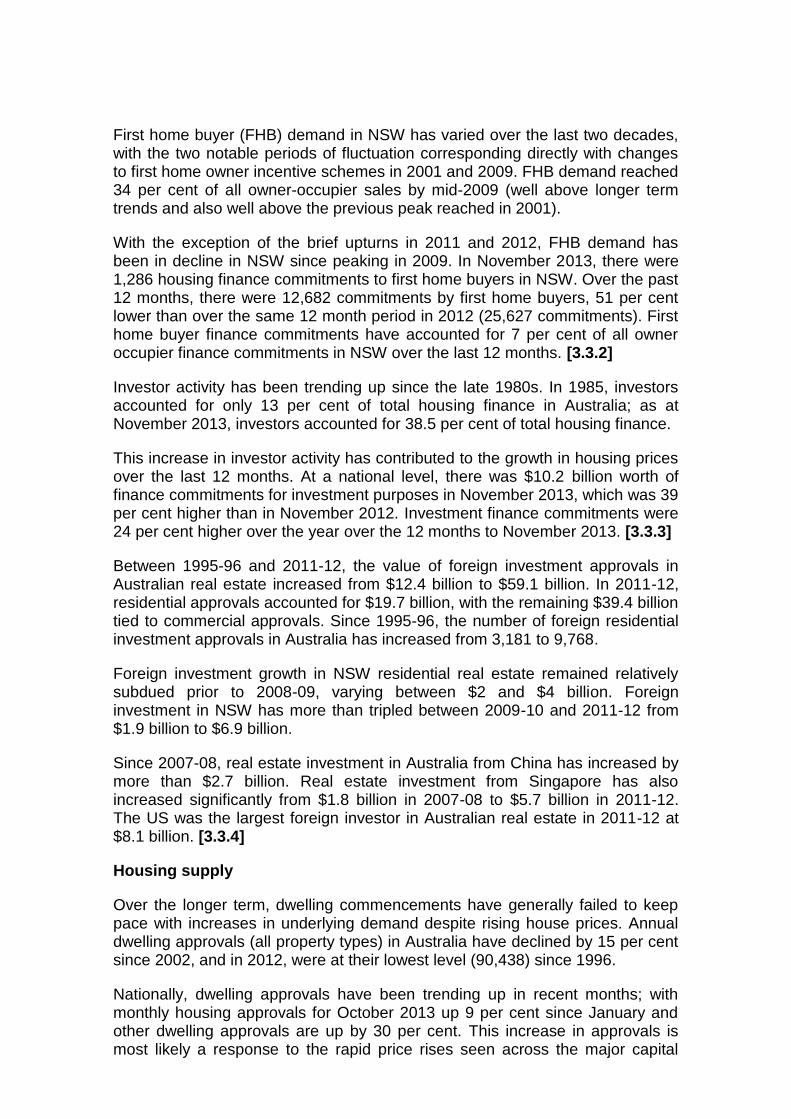
First home buyer (FHB) demand in NSW has varied over the last two decades, with the two notable periods of fluctuation corresponding directly with changes to first home owner incentive schemes in 2001 and 2009. FHB demand reached 34 per cent of all owner-occupier sales by mid-2009 (well above longer term trends and also well above the previous peak reached in 2001).
With the exception of the brief upturns in 2011 and 2012, FHB demand has been in decline in NSW since peaking in 2009. In November 2013, there were 1,286 housing finance commitments to first home buyers in NSW. Over the past 12 months, there were 12,682 commitments by first home buyers, 51 per cent lower than over the same 12 month period in 2012 (25,627 commitments). First home buyer finance commitments have accounted for 7 per cent of all owner occupier finance commitments in NSW over the last 12 months. [3.3.2]
Investor activity has been trending up since the late 1980s. In 1985, investors accounted for only 13 per cent of total housing finance in Australia; as at November 2013, investors accounted for 38.5 per cent of total housing finance.
This increase in investor activity has contributed to the growth in housing prices over the last 12 months. At a national level, there was $10.2 billion worth of finance commitments for investment purposes in November 2013, which was 39 per cent higher than in November 2012. Investment finance commitments were 24 per cent higher over the year over the 12 months to November 2013. [3.3.3]
Between 1995-96 and 2011-12, the value of foreign investment approvals in Australian real estate increased from $12.4 billion to $59.1 billion. In 2011-12, residential approvals accounted for $19.7 billion, with the remaining $39.4 billion tied to commercial approvals. Since 1995-96, the number of foreign residential investment approvals in Australia has increased from 3,181 to 9,768.
Foreign investment growth in NSW residential real estate remained relatively subdued prior to 2008-09, varying between $2 and $4 billion. Foreign investment in NSW has more than tripled between 2009-10 and 2011-12 from $1.9 billion to $6.9 billion.
Since 2007-08, real estate investment in Australia from China has increased by more than $2.7 billion. Real estate investment from Singapore has also increased significantly from $1.8 billion in 2007-08 to $5.7 billion in 2011-12. The US was the largest foreign investor in Australian real estate in 2011-12 at $8.1 billion. [3.3.4]
Housing supply
Over the longer term, dwelling commencements have generally failed to keep pace with increases in underlying demand despite rising house prices. Annual dwelling approvals (all property types) in Australia have declined by 15 per cent since 2002, and in 2012, were at their lowest level (90,438) since 1996.
Nationally, dwelling approvals have been trending up in recent months; with monthly housing approvals for October 2013 up 9 per cent since January and other dwelling approvals are up by 30 per cent. This increase in approvals is most likely a response to the rapid price rises seen across the major capital

cities, including Sydney, at the end of 2012 and throughout 2013. [4.1.1]
In NSW, between 1995 and 2012, the annual number of dwelling approvals (all property types) decreased by 22 per cent from 57,528 to 36,394. This decrease was largely accounted for by the 40 per cent decline in housing approvals over this period. The number of ‘other’ dwelling approvals has fluctuated over this period, but recent downward growth has meant they remain around the 20-year historical average. [4.1.2]
Home ownership affordability
Rental prices, which form a large component of a prospective home buyers housing costs, have risen consistently in NSW over the last two decades, with the growth most pronounced in the inner urban areas of Sydney. Between March 1993 and March 2013, the median rent (for all properties) in the inner ring of Sydney more than doubled from $195 to $560; while the median rent in the middle ring of Sydney increased by $300. [5.1]
The ratio of dwelling prices to income in Australia was relatively stable over the early to mid-1980s, but rose considerably during the late 1980s, the 1990s and the early 2000s, driven by rising dwelling prices. Between 2003 and 2012, the ratios flattened and then trended lower. Sydney’s house price to income ratio has tended to be above those of the other State capitals. [5.2]
Housing interest repayments in Australia have increased over the last decade as a proportion of disposable income. Throughout the 1990s, this figure fluctuated between 4 and 6 per cent. Between December 2001 and June 2008, this ratio increased from 5.1 to 10.9 per cent. This period reflected rising interest rates and declining affordability for households. While this ratio has declined following its peak in 2008, it still remains above the 20 year historical average of 6.7 per cent. [5.3]
Gearing (the ratio of the value of housing debt to housing assets) has nearly tripled since the late 1980s, increasing from 10.6 per cent in September 1985 to 28.4 per cent in June 2010. This can expose borrowers and owner-occupiers to financial risk and variation in interest rates which may undermine the long-term affordability of home-ownership. [5.4]
The most widely reported measures of home loan affordability in Australia are the Real Estate Institute of Australia Home Loan Affordability Indicator, the Commonwealth Bank of Australia–Housing Industry Association Housing Affordability Index, and the BIS Shrapnel Home Loan Affordability Index. All three indexes show that home loan affordability has fluctuated considerably in the last two decades; and while affordability improved between 2010 and 2012 following a decline in interest rates, affordability remains relatively weak on a longer term historical basis. However, the methodological and data limitations associated with these indexes prevent a complete and localised assessment of affordability. Also, these indexes are not entirely up to date.
With interest rates at the bottom of the easing cycle and price growth expected to continue, the affordability problem is unlikely to improve significantly in the next few years. Sydney and Melbourne, which are the least affordable capital

cities in Australia, are also ranked 3rd and 6th globally in terms of unaffordability by the Demographia International Housing Affordability Survey. [5.5]
Outcomes of reduced affordability
Home ownership rates for young households have declined steadily since the mid-1980s and represent a negative outcome of the affordability problem in Australia. According to Battellino (2012), it may be that this is driven by demographic factors; but it is largely financially driven by unaffordability. [6.1]
There are wealth implications from not having affordable access to home ownership. Owner-occupiers not only own all of the owner-occupied housing wealth, they also own most of the wealth in investment housing and most non-housing wealth. Baby boomer households (born from 1945 to 1960 and in middle age in 2005-06) who were able to become home owners (most likely in the 1970s or 1980s and no later than the 1990s) have the greatest holdings of all forms of wealth. Households who have not been able to gain access to home ownership have relatively little wealth of any sort. [6.2]
House prices, ownership and affordability: trends in New South Wales
1
1. INTRODUCTION
In the last few decades, house prices in Australia have risen significantly faster than average household incomes. Most of the increase in real house prices occurred in two episodes, in the late 1980s boom and the subsequent boom in the late 1990s and into the previous decade. While this growth has generally been broad-based across Australia, Sydney has been especially susceptible to rising house prices in recent years.
Because of these price outcomes, the Australian property market can be characterised as a tale of the housing “haves” and the housing “have-nots”. Typically, the “haves” purchased their home many years ago when prices were far more affordable. This group of home owners have since experienced significant capital gains, which over time and in certain instances, have been used to purchase multiple properties. This created unprecedented wealth accumulation through the 1990s and 2000s. The “have-nots” are typically renters and prospective first home buyers who face the highest rates of housing stress and the greatest affordability constraints.1
This briefing paper will present historical trends in housing prices, with a particular focus on the supply and demand factors in NSW that have contributed to the strong price growth over the past two decades. In doing so, it will emphasise the combined effects of strong underlying demand drivers (such as population, income and employment growth); a shifting composition of housing demand; and a subdued housing supply response in contributing to the price growth in Sydney and NSW. By assessing the key indicators of affordability, the paper will discuss the implications of rising house prices for affordability, and in turn, on wealth accumulation and home ownership rates across different age and demographic segments in NSW and Australia.
It should be noted that the analysis in this paper will largely focus on trends in house prices, ownership and affordability as it relates to NSW. Data limitations in certain instances prevent analysis at a State level; where this is the case, analysis is conducted at a national level. While this paper discusses certain policies with reference to statistical trends, it does not conduct in depth policy analysis in terms of potential causes and responses to housing affordability in Australia; this is beyond the scope of the research.2
1 AMP, The Great Australian Dream – Just a dream?, 2011
2 For further policy analysis see O’Flynn, L., Housing Affordability, 2011, NSW Parliamentary Research Service, Briefing Paper No 04/2011

NSW Parliamentary Research Service
2
2. TRENDS IN HOUSE PRICES
Between 1995 and 2005, real house prices in Australia increased by more than 6 per cent annually, with an average annual increase of almost 15 per cent from 2001 to 2003. This was well above the average annual increase in the 20 years to 1995 of just 1.1 per cent.3 Prices in most capital cities stabilised toward the end of the late 2000s but record low interest rates have contributed to strong growth in housing prices over the last 12 months.
Since the mid-1990s, real house prices have increased at a significantly higher rate than real wages and income (Figure 1). Between 1995 and 2010, real GDP per capita and average weekly earnings increased by an average annual rate of 2 and 3.9 per cent respectively.4 This would suggest that there are key affordability issues resulting from this rapid price growth (Section 5).
Figure 1: Real house prices, GDP per capita and weekly earnings5
The distribution of this house price growth has varied between the capital cities and the urban and regional areas of individual States. This section of the paper will focus on the general trends in capital city housing prices in Australia and house prices in NSW and Sydney. The purpose of which is to identify particular areas of NSW that have been especially susceptible to this strong house price growth.
2.1 Capital city house prices
When compared with some other capital Australian cities, established house prices in Sydney have grown at a considerably slower pace over the last
3 Yates, J., Housing in Australia in the 2000s: On the agenda too late?, Reserve Bank of Australia, 2011
4 ABS, Australian National Accounts: National Income, Expenditure and Product, Cat. No. 5602.0, Sep 2013; ABS, Average Weekly Earnings, Australia, May 2013
5 Source: Yates, J., Housing in Australia in the 2000s: On the agenda too late?, Reserve Bank of Australia, 2011

House prices, ownership and affordability: trends in New South Wales
3
decade or so (Figure 2). Since December 2003, dwelling prices have, on average, risen by: 25 per cent in Sydney; 50 per cent in Brisbane; 71 per cent in Melbourne; and 119 per cent in Perth.
Figure 2: Selected capital city house price indexes6
Price growth for the more populous capital cities (apart from Sydney) had been relatively strong prior to the Global Financial Crisis. In its aftermath, prices fell over the course of around one year before recovering in mid-2009 and reaching a new peak in 2010. This recovery was, in part, due to the government stimulus provided during this period in the form of first home owner’s grants. Between 2010 and 2012, however, price growth was either flat or negative across all of these capital cities.
Since the end of 2012, capital city established house prices have generally increased. The weighted Australian capital city house price index increased by around 8 per cent between the September 2012 and 2013 quarters, driven by strong price growth in Sydney (up by 11 per cent), Perth (9 per cent) and Melbourne (8 per cent).
As of March 2013, Sydney still had the highest median established house price at $605,000, followed by Perth ($528,000), Melbourne ($480,000) and Brisbane ($445,000). The median established house price in Sydney has increased by around 15 per cent since December 2011. Perth (up by 9 per cent) also experienced relatively strong median house price growth over this period (Figure 3).
6 Source: ABS, House Price Indexes: Eight Capital Cities, Cat. No. 6416.0, September 2013
Index 2003-04
50
100
150
200
250M
ar-2
00
2
De
c-2
00
2
Sep
-20
03
Jun
-20
04
Mar
-20
05
De
c-2
00
5
Sep
-20
06
Jun
-20
07
Mar
-20
08
De
c-2
00
8
Sep
-20
09
Jun
-20
10
Mar
-20
11
De
c-2
01
1
Sep
-20
12
Jun
-20
13
Sydney Melbourne Brisbane
Adelaide Perth

NSW Parliamentary Research Service
4
Figure 3: Selected capital city median established house prices7
The last few months have seen a significant shift in Australia’s housing markets with a surge in auction activity. According to Westpac (2013), clearance rates showed a big surge over the September quarter with a 70 per cent clearance rate nationally and a rate of 78 per cent in Sydney. This is in the context of a strong rise in the number of auctions, up about 30 per cent over three months.8
It should be noted that auction activity does have regular seasonal variations, with spring a typically stronger period. Auction activity also only captures a portion of the market and is heavily skewed towards Sydney and Melbourne. Nationally, only about 10 to 15 per cent of property sales are conducted via auction. That rises to between 15 and 20 per cent for Sydney and Melbourne which account for around 80 per cent of auctions nationally. This auction data mostly reflects conditions in Sydney and Melbourne rather than the nation as a whole.9
2.2 NSW house prices
Based on nominal data from Housing NSW, State house prices have increased significantly over the last two decades. Since June 1990, the median NSW dwelling price (for all dwellings) has increased by $339,000 (262 per cent). Dwelling price growth in NSW has been most pronounced in the Greater Sydney region. For example, between June 1990 and June 2013, the median dwelling price in the Inner Ring of Sydney increased by $555,000; prices in the Middle and Outer Rings of Greater Sydney grew by $455,000 and $332,000respectively.
7 Source: ABS, House Price Indexes: Eight Capital Cities, Cat. No. 6416.0, September 2013
8 Westpac, Market outlook, October 2013
9 Westpac, Market outlook, October 2013
$'000
100
200
300
400
500
600
700
Mar
-20
02
No
v-2
00
2
Jul-
20
03
Mar
-20
04
No
v-2
00
4
Jul-
20
05
Mar
-20
06
No
v-2
00
6
Jul-
20
07
Mar
-20
08
No
v-2
00
8
Jul-
20
09
Mar
-20
10
No
v-2
01
0
Jul-
20
11
Mar
-20
12
No
v-2
01
2
Sydney Melbourne
Brisbane Adelaide
Perth
House prices, ownership and affordability: trends in New South Wales
5
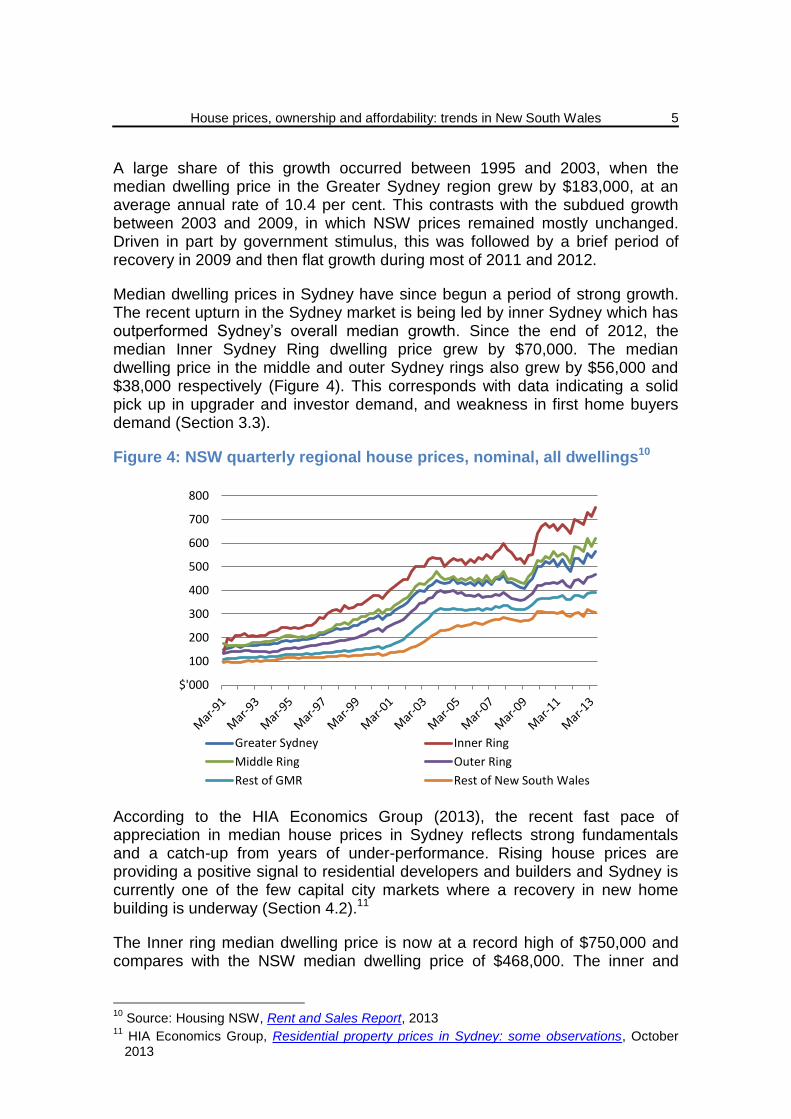
A large share of this growth occurred between 1995 and 2003, when the median dwelling price in the Greater Sydney region grew by $183,000, at an average annual rate of 10.4 per cent. This contrasts with the subdued growth between 2003 and 2009, in which NSW prices remained mostly unchanged. Driven in part by government stimulus, this was followed by a brief period of recovery in 2009 and then flat growth during most of 2011 and 2012.
Median dwelling prices in Sydney have since begun a period of strong growth. The recent upturn in the Sydney market is being led by inner Sydney which has outperformed Sydney’s overall median growth. Since the end of 2012, the median Inner Sydney Ring dwelling price grew by $70,000. The median dwelling price in the middle and outer Sydney rings also grew by $56,000 and $38,000 respectively (Figure 4). This corresponds with data indicating a solid pick up in upgrader and investor demand, and weakness in first home buyers demand (Section 3.3).
Figure 4: NSW quarterly regional house prices, nominal, all dwellings10
According to the HIA Economics Group (2013), the recent fast pace of appreciation in median house prices in Sydney reflects strong fundamentals and a catch-up from years of under-performance. Rising house prices are providing a positive signal to residential developers and builders and Sydney is currently one of the few capital city markets where a recovery in new home building is underway (Section 4.2).11
The Inner ring median dwelling price is now at a record high of $750,000 and compares with the NSW median dwelling price of $468,000. The inner and
10
Source: Housing NSW, Rent and Sales Report, 2013 11
HIA Economics Group, Residential property prices in Sydney: some observations, October 2013
$'000
100
200
300
400
500
600
700
800
Greater Sydney Inner Ring
Middle Ring Outer Ring
Rest of GMR Rest of New South Wales

NSW Parliamentary Research Service
6
middle rings of Sydney are therefore at a considerable premium to other residential areas in NSW.
Non-strata dwellings (houses) have historically been sold at a premium to strata dwellings (apartments, units etc.) because they are generally larger properties. Non-strata dwelling prices have, however, also increased at a higher rate than strata dwelling prices, particularly since the early 2000s (Figure 5). There are a couple of explanations for this trend. With constraints on land supply in inner Sydney, houses are obviously in shorter supply, which places upward pressure on prices. The average size of individual strata dwellings is also likely to have decreased over time as developers opt for smaller one and two bedroom dwellings in apartment complexes.
Figure 5: Sydney inner-ring dwelling prices, by strata type12
Non-strata dwellings in Sydney have also increased at a higher rate than strata dwellings when compared with the NSW average of each respective property type. Since March 1993, the ratio of inner ring non-strata prices to the NSW average has increased by 0.83, compared to that of strata prices which have only increased by 0.11 (Figure 6).
12
Source: Housing NSW, Rent and Sales Report, 2013
$'000
200
400
600
800
1000
1200
1400
Non-strata
Strata

House prices, ownership and affordability: trends in New South Wales
7
Figure 6: Inner ring prices relative to average NSW prices, by strata type13
2.2.1 Sydney price outlook
According to BIS Shrapnel (2013), growth in Sydney’s median house price is forecast to continue rising by 6.5 per cent in 2013-14, 6.1 per cent in 2014-15, and 5.1 per cent in 2015-16. This growth is expected to be driven by improved State economic conditions and also by the deficiency of dwelling stock into the middle and outer suburbs.
Median house price growth is expected to slow through 2015-16 as a corresponding rise in dwelling construction begins to erode the dwelling deficiency and forecast tightening interest rate policy begins to dampen demand. This is forecast by BIS Shrapnel to take Sydney’s median house price to $820,000 by June 2016.14
2.3 Housing bubble?
After initially failing to respond to rate cuts, house prices are now in a period of strong growth, particularly in Sydney. Fears of a renewed bubble have also been heightened by a surge in Sydney’s auction clearance rate above the 80 per cent level, well above its normal cyclical high of around 70 per cent.15
According to Westpac (2013), the current situation should be kept in perspective. Prices nationally have only just regained their previous peak. Westpac argued strongly that if there was a bubble in house prices it would have been present in 2007-08 and would have been very unlikely to have
13
Source: Housing NSW, Rent and Sales Report, 2013 14
BIS Shrapnel, Australian Housing Outlook 2013 – 2016, October 2013 15
Oliver, S., Australian housing – economic saviour or just another bubble?, August 2013, AMP Capital
Ratio
0.5
1
1.5
2
2.5
3
Ratio Non-strata Inner ring to NSW
Ratio strata inner ring to NSW

NSW Parliamentary Research Service
8
survived the ‘stress test’ of the GFC. While activity has strengthened in recent months, current conditions are well below the booms that have seen overheating in the past. In 2003, for example, the value of housing finance approvals rose by 37 per cent per annum for 3 years and prices increased by 63 per cent.16 According to the Commonwealth Bank (2013), a true bubble rising prices need to be backed up by an acceleration in housing credit growth over a relatively short period; an easing in lending standards; and an expectation that dwelling prices keep rising.17
Nevertheless, Oliver (2013) suggests Australian house prices still remain overvalued which can be seen in a couple of key indicators:18
while real house prices have fallen from an extreme of 25 per cent above their long term trend in 2010, they are still above it by around 7 per cent;
the ratio of house prices to incomes in Australia is 21 per cent above its long term average, leaving it toward the higher end of OECD countries (Section 5.2).19
At a national level, apart from overvaluation and strong Sydney auctions, there is little evidence of a housing bubble at present. For example, house price growth averaging around 5 per cent per annum is tame by past standards. At a similar stage following interest rate easing cycles commencing in July 1996, February 2001 and September 2008 capital city house prices were showing annual growth of 8, 19 and 19 per cent respectively. At present, house price strength is not broad based, with much of the growth occurring in Sydney and Perth (Section 2.1). Growth in housing credit is also around a record low of just 4.6 per cent compared to 20 per cent in 2004.20
16
Westpac, Market outlook, October 2013 17
Commonwealth Bank, Housing bubbles – eight questions and some answers, October 2013, Global Markets Research
18 Oliver, S., Australian housing – economic saviour or just another bubble?, August 2013, AMP Capital
19 Demographia, 9
th Annual International Housing Affordability Survey – Ratings for Metropolitan
Markets, 2013 20
Oliver, S., Australian housing – economic saviour or just another bubble?, August 2013, AMP Capital

House prices, ownership and affordability: trends in New South Wales
9
3. HOUSING DEMAND
There is widespread agreement that real house prices in NSW have been driven by demand fundamentals underpinned by supply constraints.
In housing, the “liquid” part of the market is quite small. About 4 to 6 per cent of the dwelling stock is turned over each year and new construction adds around 1 or 2 per cent to the stock. The rest is locked up. The limited amount of stock in play magnifies the price effect of changes in the supply-demand fundamentals.21
On the demand side, a number of factors have contributed to the strong growth in house prices over the last two decades: high population growth (primarily as a result of high migration); real household income growth; nominal interest rates have fallen; borrowing capacity has increased; deregulation and financial innovation have meant that finance is more readily available; taxation systems generally encouraged investment in housing; and increases in household wealth have reinforced underlying demand pressures.22 These and other demand factors are considered in this section of the paper, the aim of which is to assess the general trends in these housing demand variables rather than attempt to qualify the relative importance of each individual factor.
3.1 General demand drivers
Underlying demand for new dwellings is driven primarily by population growth which comes from the combination of natural increase (births less deaths) and overseas/interstate migration flows.
Despite relatively subdued income and employment growth since the GFC, housing demand in NSW has remained strong as a consequence of rapid population growth and rising affordability on the back of lower mortgage rates. On the other side of the equation, housing supply growth has been limited (Section 4). As a result, there is an excess demand for dwellings.23
Going forward, underlying demand drivers and house price growth remains uncertain, with unemployment predicted to rise and economic growth expected to remain subdued. Wage growth also remains relatively weak in a low inflation economy. According to Australian Property Monitors (2013), a weakening economic outlook will keep a downward bias on interest rate settings, which will provide further short-term stimulus to housing markets. Although lower interest rates are generally positive for housing markets, declining economic activity and rising unemployment is likely to have a dampening effect on home buyer activity
21
Commonwealth Bank, Housing bubbles – eight questions and some answers, October 2013, Global Markets Research
22 Yates, J., Housing in Australia in the 2000s: On the agenda too late?, Reserve Bank of Australia, 2011
23 Commonwealth Bank, Housing bubbles – eight questions and some answers, October 2013, Global Markets Research

NSW Parliamentary Research Service
10
over the longer-term.24
3.1.1 Population growth
Population growth underpins housing demand and has had a pivotal role in the price increases experienced across NSW and Sydney.25
Over the last two decades, Australia’s population has increased by just over 5 million. That represents an average annual increase of 1.2 per cent. NSW accounted for 26 per cent of this population increase and over this period Sydney’s population increased by 936,000.
New South Wales’ population increased by 92,827 persons through the year to March 2013; up from an increase of 83,499 persons over the previous year to March 2012. This represents an increase of 1.8 per cent which was the highest level of growth since the 12 months to March 2008 (Figure 7).
Figure 7: NSW population and annual change in Sydney population26
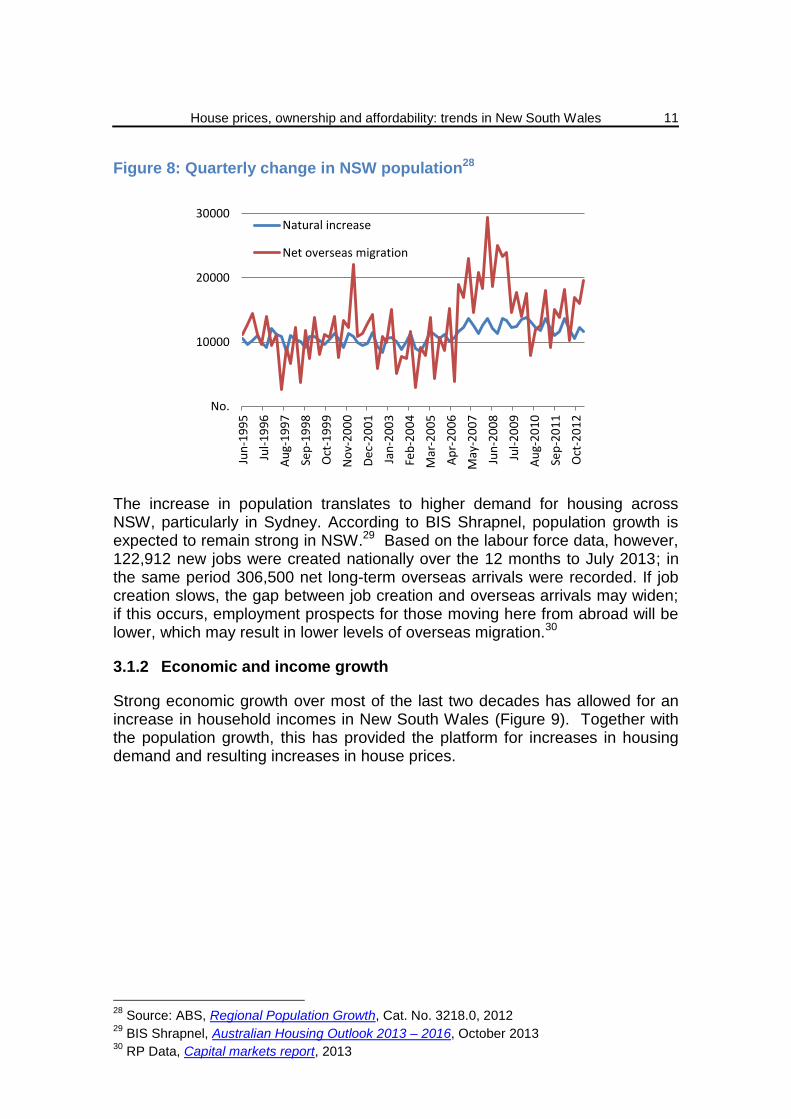
There are two components to population growth: net overseas migration and natural increase (births minus deaths). Both measures remain elevated on a historical basis (Figure 8), and in the year to March 2013, natural increase contributed to 43 per cent of the State’s population growth (46,511) and net overseas migration contributed the additional 57 per cent (62,891). Housing demand from overseas and interstate migration is more immediate as this group will require accommodation upon arriving, be it owner occupation or rental.27
24
Australian Property Monitors, Housing market report, August 2013 25
Senate Select Committee on Housing Affordability in Australia, A good house is hard to find: Housing affordability in Australia, 2008, Commonwealth of Australia, Canberra; Productivity Commission, First home ownership, 2004, Inquiry Report No. 28
26 Source: ABS, Australian Demographic Statistics, Cat. No. 3101.0, March 2013
27 BIS Shrapnel, Australian Housing Outlook 2013 – 2016, October 2013
No.
18000
36000
54000
72000
90000
million
1
2
3
4
5
19
91
19
92
19
93
19
94
19
95
19
96
19
97
19
98
19
99
20
00
20
01
20
02
20
03
20
04
20
05
20
06
20
07
20
08
20
09
20
10
20
11
Total NSW Population (LHS)
Annual Change (RHS)
House prices, ownership and affordability: trends in New South Wales
11
Figure 8: Quarterly change in NSW population28
The increase in population translates to higher demand for housing across NSW, particularly in Sydney. According to BIS Shrapnel, population growth is expected to remain strong in NSW.29 Based on the labour force data, however, 122,912 new jobs were created nationally over the 12 months to July 2013; in the same period 306,500 net long-term overseas arrivals were recorded. If job creation slows, the gap between job creation and overseas arrivals may widen; if this occurs, employment prospects for those moving here from abroad will be lower, which may result in lower levels of overseas migration.30
3.1.2 Economic and income growth
Strong economic growth over most of the last two decades has allowed for an increase in household incomes in New South Wales (Figure 9). Together with the population growth, this has provided the platform for increases in housing demand and resulting increases in house prices.
28
Source: ABS, Regional Population Growth, Cat. No. 3218.0, 2012 29
BIS Shrapnel, Australian Housing Outlook 2013 – 2016, October 2013 30
RP Data, Capital markets report, 2013
No.
10000
20000
30000
Jun
-19
95
Jul-
19
96
Au
g-1
99
7
Sep
-19
98
Oct
-19
99
No
v-2
00
0
De
c-2
00
1
Jan
-20
03
Feb
-20
04
Mar
-20
05
Ap
r-2
00
6
May
-20
07
Jun
-20
08
Jul-
20
09
Au
g-2
01
0
Sep
-20
11
Oct
-20
12
Natural increase
Net overseas migration

NSW Parliamentary Research Service
12
Figure 9: NSW full time adult weekly earnings31
Between 1993 and 2000, Gross State Product (GSP) grew in NSW at an average annual rate of 4 per cent. This strong period of economic growth also corresponded with the rapid increase in real estate prices which grew at an average rate of 7.5 per cent over the same period (Figure 10).
Figure 10: Change in NSW gross state product and median dwelling price32
This was followed by a period of more subdued economic growth for NSW in
31
Source: ABS, Average Weekly Earnings, Australia, Cat. No. 6302.0, May 2013 32
Source: ABS, Australian National Accounts: State Accounts, Cat. No. 5220.0, 2012-13
$
400
800
1200
1600
No
v-1
99
4
Feb
-19
96
May
-19
97
Au
g-1
99
8
No
v-1
99
9
Feb
-20
01
May
-20
02
Au
g-2
00
3
No
v-2
00
4
Feb
-20
06
May
-20
07
Au
g-2
00
8
No
v-2
00
9
Feb
-20
11
May
-20
12
-5
%
5
10
15
20
%
1
2
3
4
5
6
Annual GSP change
Annual NSW dwelling price change

House prices, ownership and affordability: trends in New South Wales
13
which GSP grew at an average rate of 2 per cent between 2001 and 2009. The slowdown of the State’s economy was also accompanied by stagnant real estate price growth in NSW between 2005 and 2009. With the exception of the sharp upturn in prices in 2010, dwelling price growth remained relatively flat in NSW from 2003 to 2012.
The median dwelling price in NSW increased by over 5 per cent in the year ending June 2013; there are doubts as to whether this price rise can be sustained because economic growth and wage fundamentals remain relatively weak. For instance, New South Wales’ GSP increased by 1.84 per cent over the 12 months to June 2013, with the value of the domestic economy’s output at $471 billion. This increase remains below the long run average and is down on the growth in the 12 months to June 2011 (2.36 per cent) and 2012 (2.32 per cent).
3.1.3 Employment
At a national level, the rate of unemployment (5.8 per cent in November) is currently at its highest level since September 2009. The rate of unemployment in NSW (5.9 per cent) is also at its highest level since September 2009 (Figure 11).
Figure 11: Unemployment rate, all persons, NSW33
Federal Treasury recently stated that they are forecasting national unemployment to peak at 6.25 per cent in mid-2014. If unemployment does reach this level nationally it would be the highest unemployment rate since September 2002. According to RP Data (2013), this prospect of rising unemployment in NSW may dampen consumer confidence and demand for credit, and subsequently impact on the State’s housing market.34
33
Source: ABS, Labour Force, Australia, Cat. No. 6202.0, Nov 2013 34
RP Data, Capital markets report, 2013
%
5
6
7
Jan
-20
00
No
v-2
00
0
Sep
-20
01
Jul-
20
02
May
-20
03
Mar
-20
04
Jan
-20
05
No
v-2
00
5
Sep
-20
06
Jul-
20
07
May
-20
08
Mar
-20
09
Jan
-20
10
No
v-2
01
0
Sep
-20
11
Jul-
20
12
May
-20
13

NSW Parliamentary Research Service
14
3.1.4 Interest rates
The move to a low-inflation environment saw interest rates fall over much of the 1990s and remain at these relatively low levels throughout the 2000s. At the same time, increased competition among housing lenders has made it easier for many borrowers to obtain loans, and contributed to lower interest costs by reducing lending margins.35 The Productivity Commission (2004) and the Senate Select Committee on Housing Affordability in Australia (2008) both concluded that cheaper and more accessible housing finance has underpinned demand and house price growth.36
The current interest rate easing cycle, which began in November 2011 with a 25 basis point reduction, did not have the immediate impact that previous easing cycles have had on the housing market. Since that time the cash rate has fallen by 225 basis points to 2.5 per cent, its lowest level in more than 50 years (Figure 12). BIS Shrapnel (2013) indicate that the relatively low level of affordability at the start of this period dampened the impact of rate cuts on the housing market.
Since the start of the easing cycle, the ratio of the standard variable rate to the cash rate has increased from 1.5 to a historical high of 2.5. This confirms that while the RBA has been decreasing the cash rate, the banks have not been passing on the entirety of the rate cuts, a factor which may have contributed to the slow market response.
Figure 12: Cash rate and standard variable rate37
35
Worthington, A., The quarter century record on housing affordability, affordability drivers, and government policy responses in Australia, 2011, Griffith Business School
36 Senate Select Committee on Housing Affordability in Australia, A good house is hard to find: Housing affordability in Australia, 2008; Productivity Commission, First home ownership, 2004, Inquiry Report No. 28
37 Source: Reserve Bank of Australia, Monetary Policy Changes, 2013, Statistical Table A2
Ratio
0.5
1
1.5
2
2.5
3
%
3
6
9
12
15
18
Au
g-9
0
Jan
-92
Jun
-93
No
v-9
4
Ap
r-9
6
Sep
-97
Feb
-99
Jul-
00
De
c-0
1
May
-03
Oct
-04
Mar
-06
Au
g-0
7
Jan
-09
Jun
-10
No
v-1
1
Ap
r-1
3
Cash rate Standard variable rate Ratio SVR to CR

House prices, ownership and affordability: trends in New South Wales
15
Nevertheless, standard variable mortgage rates have fallen by approximately 185 basis points in the current easing cycle, from 7.8 per cent to around 5.95 per cent. Considerable improvements in other aspects of affordability over 2012 (such as the relatively slow price growth in the 3 years previous), complemented with these record low interest rates, catalysed an increase in turnover throughout the housing market in 2013.38 The RBA still has scope to cut rates further should the need arise. According to RP Data (2013), the likelihood of further interest rate cuts seems fairly high given that Federal Treasury is now forecasting that economic growth will slow to 2.5 per cent this year and the unemployment rate will peak at 6.25 per cent.39
3.2 Structural changes in demand
According to Yates (2011), financial deregulation was a major source of stimulus to the high rate of real house price inflation from the mid-1990s. This was seen as a structural change that facilitated housing demand.40
Financial deregulation specifically promoted greater competition and product innovation and, through reduced interest margins and increased finance availability, increased borrowing capacity which boosted housing demand. According to Ellis (2006) there are questions as to whether the increase in demand represented a once-off shift to a new and higher equilibrium level of effective demand for housing, arising from structural change in the housing finance system, or whether it was the start of a house price bubble.41
The cost of housing services and the effective returns available from investment in housing were also key economic drivers affecting housing demand. User costs are affected by the way in which housing is treated by the tax system. In the past decade the tax-privileged status accorded to owner-occupied housing by its exemption from the capital gains tax in the mid-1980s has remained unchanged.42 As highlighted in the Henry Report, changes to the treatment of capital gains in 1999 affected returns available from investment in rental property and particularly from highly geared investment.43 An increase in investor demand arising from the 1999 changes to the tax system was identified by the then Governor of the Reserve Bank of Australia as a key factor contributing to the boom at the start of this period.
38
BIS Shrapnel, Australian Housing Outlook 2013 – 2016, October 2013 39
RP Data, Capital markets report, 2013 40
Yates, J., Housing in Australia in the 2000s: On the agenda too late?, Reserve Bank of Australia, 2011
41 Ellis, L., Housing and Housing Finance: The View from Australia and Beyond, 2006, RBA Research Discussion Paper No 2006-12.
42 Yates, J., Housing in Australia in the 2000s: On the agenda too late?, Reserve Bank of Australia, 2011
43 Department of Treasury, Australia’s Future Tax System, December 2009, Report to the Treasurer, Part Two Detailed Analysis, Volume 1, p 69

NSW Parliamentary Research Service
16
3.3 Composition of housing demand
Prior to the late 1980s, housing demand was largely accounted for by owner occupiers. However, the rapid escalation of prices in the early 1990s, combined with structural tax changes and improved access to credit, saw residential real estate become a highly desirable form of investment. Property owners were able to use the equity in existing properties (which would have increased significantly during this period) to obtain further finance for the purchase of investment properties. This resulted in unprecedented wealth accumulation and growth in market share for investors through the 1990s and early 2000s.
To illustrate, in 1985 investors accounted for only 13 per cent of total housing finance in Australia; as at November 2013, investors accounted for 38.5 per cent of total housing finance. Further, this figure represents only part of the total market share of investors in Australian residential real estate.
First home buyers and owner-occupiers are now competing with domestic investors, as well as foreign investors (Figure 13). Foreign investment in Australian residential real estate has more than tripled since the mid-1990s, increasing from $6.2 billion in 1995-96 to $19.7 billion in 2010-11. In the last two years alone, foreign investment in NSW residential real estate has increased from $2 billion in 2009-10 to $7 billion in 2011-12.
Figure 13: Value of residential purchases by buyer type, Australia44
44
Sources: ABS, Housing finance, Australia, Cat No. 5609.0, October 2013; Foreign Investment Review Board, Annual Reports, 1995 to 2012. Data related to the total value of residential purchases in Australia is not available; as such this figure has been calculated based on a number of assumptions to give an indication of the composition of housing demand in Australia. It should not be construed as actual purchase shares from these respective groups. The investor shares of purchases, for example, have been calculated based on investor finance shares for purchases in ABS 5609.0. The purchase share attributable to investors is likely to be higher as investors usually have more equity than prospective owner-occupiers.
$b
50
100
150
200
250
300
350
19
95
-96
19
96
-97
19
97
-98
19
98
-99
19
99
-00
20
00
-01
20
01
-02
20
02
-03
20
03
-04
20
04
-05
20
05
-06
20
06
-07
20
07
-08
20
08
-09
20
09
-10
20
10
-11
20
11
-12
20
12
-13
First HomeBuyers (FHB)
Non-FHB
Investor
Foreigninvestor

House prices, ownership and affordability: trends in New South Wales
17
The growth in the combined proportion of domestic and foreign investors in the residential real estate market has increased total housing demand, placing upward pressure on prices (Figure 14). There is the possibility that first home-buyers and owner-occupiers will be squeezed out of the market in coming years if trends in residential real estate investment continue on current trajectories.
Figure 14: Distribution of residential home buyers, by type
Where possible, this section of the paper will assess the trends in owner-occupier, first-home buyer and investor (domestic and foreign) ownership in residential real estate in NSW. Data limitations prevent this in certain areas, in which case, aggregated data for Australia will be assessed instead.
3.3.1 Owner occupier demand – Non-first home buyers
Upgraders and downsizers represent the largest component of residential real estate demand in NSW. Given this, it is unsurprising that NSW non-first home buyer (NFHB) demand has followed a similar trend to that of the median dwelling price. For example, the strong price growth through the 1990s also corresponded with the strong growth in owner-occupier demand. Similarly, the downturn in owner-occupier demand through the early 2000s was accompanied by stagnant price growth (Figure 15). The combined impact of increases in income, wealth accumulation and generous tax concessions to higher-income households provides some explanation as to why owner-occupier households increased their demand for housing through the 1990s and early 2000s.45 NFHB demand and median dwelling prices diverged around 2008-09; an increase in FHB demand, combined with weak supply growth during this period,
45
Yates, J., Housing in Australia in the 2000s: On the agenda too late?, Reserve Bank of Australia, 2011
0%
10%
20%
30%
40%
50%
60%
70%
80%
90%
100%
Foreign investors Investors Non-FHB First Home Buyers (FHB)

NSW Parliamentary Research Service
18
help to explain this trend.
Figure 15: Non-first home buyer owner-occupier dwellings financed, NSW and NSW median dwelling price46
In November 2013, there were 16,140 NFHB owner occupier dwellings financed in NSW, which accounted for 33 per cent of all NFHB dwellings financed in Australia. This is above the previous 6-year high of 15,264 reached in October 2013. There have been 156,751 NFHB owner occupier dwelling finance commitments over the 12 months to November 2013. This is well above the calendar average of 125,759 since 2007.
Figure 16 shows that NFHB owner occupier demand in NSW, as a proportion of all owner-occupier demand, has been trending up since mid-2009. This is consistent with the upward trend in NSW prices (particularly in the Greater Sydney region) over this period. The sharp decline in the NFHB ownership rate in 2009 (when it was at a historical low of 66 per cent) reflected the weak economic conditions from the GFC combined with the increase in FHB demand stemming from the government incentives at the time (Section 3.3.2).
46
Sources: ABS, Housing Finance, Australia, Cat. No. 5609.0, October 2013; Housing NSW, Rent and Sales Report, 2013
$'000
100
200
300
400
500
No.
3000
6000
9000
12000
15000
18000
Sep
-91
Jan
-93
May
-94
Sep
-95
Jan
-97
May
-98
Sep
-99
Jan
-01
May
-02
Sep
-03
Jan
-05
May
-06
Sep
-07
Jan
-09
May
-10
Sep
-11
Jan
-13
Owner-occupier finance
NSW median dwelling price

House prices, ownership and affordability: trends in New South Wales
19
Figure 16: Proportion of owner-occupier non-first home buyers, NSW and Australia47
The recent increase in owner-occupier demand reflects a number underlying factors, most notably the increase in affordability resulting from the monetary easing that has occurred since the GFC; and also the relatively strong overseas migration and population growth that has occurred in the last few years. This growth, combined with weak first home buyer demand (discussed below), has seen the share of NFHB demand as a proportion of total owner-occupier demand increase significantly since 2009 (Figure 16).
The removal of most of the government FHB incentives, combined with the sharp rise in prices in 2013, has seen NFHB owner occupier demand reach a high of 93 per cent in NSW, around 6 per cent above the Australian average.
3.3.2 First home buyer demand
First home buyer demand in NSW has varied over the last two decades, with the two notable periods of fluctuation corresponding directly with changes to first home owner incentive schemes in 2001 and 2009.
In order to offset the effect of the GST, the First Home Owners Grant (FHOG) was reintroduced in 2000 to provide a short-term stimulus to the housing construction sector.48 The Federal–State intergovernmental agreement called for the establishment of a uniform scheme across States and Territories which was to be administered by the respective jurisdictions. The grant was set at $7,000, and because of worsening economic conditions at the time was temporarily increased in 2001 to $10,000 for newly constructed homes. By January 2004, the scheme had provided $4.3 billion in assistance to over half a
47
Source: ABS, Housing Finance, Australia, Cat. No. 5609.0, October 2013 48
Productivity Commission, First home ownership, 2004, Inquiry Report No. 28
%
70
80
90
100
Jul-
19
91
Oct
-19
92
Jan
-19
94
Ap
r-1
99
5
Jul-
19
96
Oct
-19
97
Jan
-19
99
Ap
r-2
00
0
Jul-
20
01
Oct
-20
02
Jan
-20
04
Ap
r-2
00
5
Jul-
20
06
Oct
-20
07
Jan
-20
09
Ap
r-2
01
0
Jul-
20
11
Oct
-20
12
NSW
Australia
NSW Parliamentary Research Service
20
million first time buyers nationwide.49
According to BIS Shrapnel (2013), the composition and timing of any incentives to first home buyers does not create new demand (as everyone can only be a first home buyer once) but rather affects the timing of demand. Temporary grants and incentives bring forward future demand, leaving a smaller pool of buyers immediately after. The removal of grants may not only bring demand forward to beat the expiry date, but also delays subsequent demand, as the next round of first home buyers need to take more time to save what they would have otherwise received in grants.50
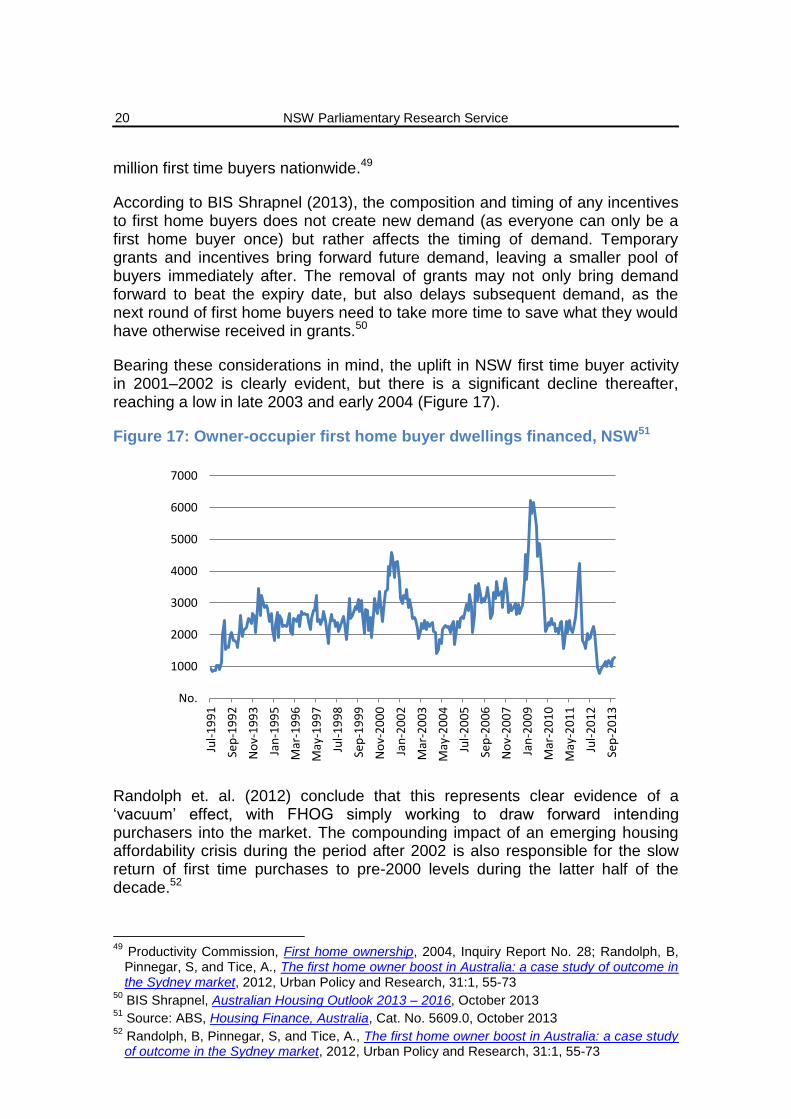
Bearing these considerations in mind, the uplift in NSW first time buyer activity in 2001–2002 is clearly evident, but there is a significant decline thereafter, reaching a low in late 2003 and early 2004 (Figure 17).
Figure 17: Owner-occupier first home buyer dwellings financed, NSW51
Randolph et. al. (2012) conclude that this represents clear evidence of a ‘vacuum’ effect, with FHOG simply working to draw forward intending purchasers into the market. The compounding impact of an emerging housing affordability crisis during the period after 2002 is also responsible for the slow return of first time purchases to pre-2000 levels during the latter half of the decade.52
49
Productivity Commission, First home ownership, 2004, Inquiry Report No. 28; Randolph, B, Pinnegar, S, and Tice, A., The first home owner boost in Australia: a case study of outcome in the Sydney market, 2012, Urban Policy and Research, 31:1, 55-73
50 BIS Shrapnel, Australian Housing Outlook 2013 – 2016, October 2013
51 Source: ABS, Housing Finance, Australia, Cat. No. 5609.0, October 2013
52 Randolph, B, Pinnegar, S, and Tice, A., The first home owner boost in Australia: a case study of outcome in the Sydney market, 2012, Urban Policy and Research, 31:1, 55-73
No.
1000
2000
3000
4000
5000
6000
7000
Jul-
19
91
Sep
-19
92
No
v-1
99
3
Jan
-19
95
Mar
-19
96
May
-19
97
Jul-
19
98
Sep
-19
99
No
v-2
00
0
Jan
-20
02
Mar
-20
03
May
-20
04
Jul-
20
05
Sep
-20
06
No
v-2
00
7
Jan
-20
09
Mar
-20
10
May
-20
11
Jul-
20
12
Sep
-20
13

House prices, ownership and affordability: trends in New South Wales
21
The First Home Owners Boost (the ‘Boost’) was announced in October 2008 as part of the Australian Government’s Economic Security Strategy. The Boost provided an additional grant on top of existing FHOG arrangements in place, and amounted to an extra $7,000 for buying an established home (a total of $14,000) and an extra $14,000 for buying or building a new home (a total of $21,000). Between 2006 and 2008, the monthly number of grants paid in NSW fluctuated between 3,200 and 4,800. A substantial upturn was seen in the early months of 2009 following the arrival of the Boost, peaking at 7,176 in June 2009. By December 2009, the figure had fallen back to 3,745. June 2010 saw just 2,982 grants paid and December 2010, 2,611 (Figure 18). In the peak months of 2009, over $100 million in grants was provided; by January 2011 this had fallen back to just over $20 million.53
Figure 18: Number of first home buyer grants, NSW54
These incentives of the FHOG, coupled with the lower mortgage rates, meant the stimulus effect in 2009 was much more pronounced. The impact of the FHOG Boost on NSW demand is clearly apparent in Figure 19; with FHB demand reaching 34 per cent of all owner-occupier sales by mid-2009 (well above longer term trends and also well above the previous peak reached in 2001).
53
Randolph, B, Pinnegar, S, and Tice, A., The first home owner boost in Australia: a case study of outcome in the Sydney market, 2012, Urban Policy and Research, 31:1, 55-73
54 Source: NSW Office of State Revenue, Data and statistics – First home benefits, 2013
No.
2000
4000
6000
8000
Jul-
05
Jan
-06
Jul-
06
Jan
-07
Jul-
07
Jan
-08
Jul-
08
Jan
-09
Jul-
09
Jan
-10
Jul-
10
Jan
-11
Jul-
11
Jan
-12
Jul-
12
Jan
-13
Jul-
13

NSW Parliamentary Research Service
22
Figure 19: First home buyer proportion of owner-occupier dwellings financed, NSW and Australia55
Whilst new highs were seen during the Boost, the fall off has been equally pronounced and recent data suggests that the additional grants provided during 2008–2009 and 2009–10 were in large part counterbalanced by a significant shortfall in 2010–11.56
Demand in New South Wales surged at the end of 2011, prior to stamp duty exemptions for established dwelling purchasers being removed (Figure 19). Demand in New South Wales was then boosted in the September 2012 quarter in advance of the removal of the existing $7,000 First Home Owner Grant for purchasers of existing dwellings from October 2012.
With the exception of the brief upturns in 2011 and 2012, FHB demand has been in decline in NSW since peaking in 2009.57 The last year, in particular, has seen a noticeable decline in first home ownership. In November 2013, there were 1,286 housing finance commitments to first home buyers in NSW. Over the past 12 months, there were 12,682 commitments by first home buyers, 51 per cent lower than over the same 12 month period in 2012 (25,627 commitments). First home buyer finance commitments have accounted for 7 per cent of all owner occupier finance commitments in NSW over the last 12 months. In November 2013 this figure was at 7.4 per cent, just above the historical monthly low of 6.8 per cent reached in September 2013. The first home ownership rate in NSW also remains well below the national average of 14 per cent.58
55
Source: ABS, Housing Finance, Australia, Cat. No. 5609.0, October 2013 56
Randolph, B, Pinnegar, S, and Tice, A., The first home owner boost in Australia: a case study of outcome in the Sydney market, 2012, Urban Policy and Research, 31:1, 55-73
57 BIS Shrapnel, Australian Housing Outlook 2013 – 2016, October 2013
58 BIS Shrapnel, Australian Housing Outlook 2013 – 2016, October 2013
%
10
20
30
40Ju
l-1
99
1
Oct
-19
92
Jan
-19
94
Ap
r-1
99
5
Jul-
19
96
Oct
-19
97
Jan
-19
99
Ap
r-2
00
0
Jul-
20
01
Oct
-20
02
Jan
-20
04
Ap
r-2
00
5
Jul-
20
06
Oct
-20
07
Jan
-20
09
Ap
r-2
01
0
Jul-
20
11
Oct
-20
12
NSW
Australia
House prices, ownership and affordability: trends in New South Wales
23
In terms of the effectiveness of a FHB scheme in improving long-term affordability, Randolph et. al (2012) make the following assessment:
The vacuum effect identified in this analysis in both 2002–2003 and after 2009, raises a number of questions regarding the effectiveness of the policy objectives. If, as appears to be the case here, a one-off stimulus simply acts to bring forward demand which then results in a slump in FHB demand, then the value of such a measure as sustained support for affordable housing is open to question. While it may shore up demand during a period of uncertainty, the effect may simply be to exacerbate the problem once the immediate positive impact of the intervention has passed through the system.59
Randolph et. al (2012) add that much of the criticism of the grant therefore focuses on:
…the inevitability that, as a demand side cash handout, its ‘value’ quickly becomes accommodated within market pricing and vendor expectations. Where those grants are then subjected to time-limited boosts, there is also concern regarding the market implications of concentrating first home buyer activity over a short time period and adding to inflationary pressures on particular segments of the market.60
3.3.3 Investor demand
Investors have been a key ingredient of rising housing market activity in recent years, driven by solid yields, low borrowing and deposit rates, an underperforming and volatile stock market and the real prospect of short-term capital gains.61 Investor demand has boosted housing prices, especially in more favourably located housing which is in limited supply (i.e. inner Sydney suburbs). According to Williams and Macken (2013), tax breaks and incentives for those in housing have distorted demand, had perverse consequences on supply and resulted in unprecedented wealth accumulation.62
There have been concerns, particularly following price rises in recent months, that investors have been ‘crowding out’ first home buyers. Competition in the housing market has increased noticeably in the last two decades as investor activity has been trending up since the late 1980s (Figure 20). As noted, in 1985, investors accounted for only 13 per cent of total housing finance in Australia; as at November 2013, investors accounted for 38.5 per cent of total housing finance.
59
Randolph, B, Pinnegar, S, and Tice, A., The first home owner boost in Australia: a case study of outcome in the Sydney market, 2012, Urban Policy and Research, 31:1, 55-73
60 Randolph, B, Pinnegar, S, and Tice, A., The first home owner boost in Australia: a case study of outcome in the Sydney market, 2012, Urban Policy and Research, 31:1, 55-73
61 Richards, A., Some observations on the cost of housing in Australia, 2008, Reserve Bank of Australia, Address to Economic and Social Outlook Conference The Melbourne Institute
62 Williams, T, and Macken, S., Homes for all: the 40 things we can do to improve supply and affordability, 2013, The McKell Institute

NSW Parliamentary Research Service
24
Figure 20: Owner-occupier and investor finance, Australia63
This figure represents only part of the total market share (in terms of purchases) of investors in Australian residential real estate. This data is provided by the ABS and represents the finance commitments of owner-occupiers and investors to leading lenders and financial institutions. Investors almost certainly have more equity than prospective owner-occupiers (particularly first home buyers) and as a result, housing finance will account for a smaller proportion of the total purchase price. In reality, the investor share in residential real estate purchases in Australia and NSW is likely to be even higher than is indicated in Figure 20.
This increase in investor activity has contributed to the growth in housing prices over the last 12 months. At a national level, there was $10.2 billion worth of finance commitments for investment purposes in November 2013, which was 39 per cent higher than in November 2012. Investment finance commitments were 24 per cent higher over the 12 months to November 2013.
According to BIS Shrapnel, investor activity has been even more pronounced in New South Wales, which has been experiencing strong growth in investor demand and experiencing corresponding declines in first home buyer numbers (Section 3.3.2).64 Investment lending is surging in New South Wales (up 28 per cent in 2012-13), offsetting the low first home buyer numbers and helping to maintain purchaser demand in the market.65
Investment activity is now at its highest level since it peaked in June 2007 and is particularly strong at present because the returns on less risky assets, such as bank deposits, are comparatively low; hence many investors are seeking a higher level of return. In Australia, housing is typically viewed as relatively low
63
Source: ABS, Housing Finance, Australia, Cat. No. 5609.0, October 2013 64
BIS Shrapnel, Australian Housing Outlook 2013 – 2016, October 2013 65
RP Data, Capital markets report, 2013
Ratio
1
2
3
4
5
6
7
$b
20
40
60
80
100
120
140
160
180
200
19
85
19
87
19
89
19
91
19
93
19
95
19
97
19
99
20
01
20
03
20
05
20
07
20
09
20
11
20
13
Owner-occuper
Investor
Ratio

House prices, ownership and affordability: trends in New South Wales
25
risk and capital growth and rental yields are factored in, the return on residential property is currently quite attractive.66
When the returns currently available on relatively risk-free asset classes such as bank deposits and government bonds are assessed, it is easy to understand why investors are targeting other asset classes such as property. At the end of July 2013, the overnight cash rate was recorded at 2.75 per cent; one year term deposits had an interest rate of 3.7 per cent; and 5 and 10 year Australian Government Bonds were returning 3.09 per cent and 3.75 per cent, respectively.67
A recently underperforming and volatile stock market has meant that real estate is viewed as a more secure and assured investment. Data limitations prevent a more substantial assessment of the shift from shares to dwelling assets; however, the value of share ownership has trended downwards in Australia since the global financial crisis (Figure 21). Between June 2007 and June 2013, the value of share ownership has declined by 24 per cent from $732 billion to $557 billion; while the value of dwelling ownership has increased by more than 28 per cent. It is possible that a large proportion of this decline has resulted from a decrease in the asset value, perhaps more so than from the rate of dwelling or share ownership. In any event, there has been a distinct downward trend in the asset value of shares in Australia.
Figure 21: Value of household financial and non-financial assets, by type, Australia68
Over the past 12 months, capital city home values have increased by 4.9 per
66
RP Data, Capital markets report, 2013 67
RP Data, Capital markets report, 2013 68
Source: Reserve Bank of Australia, Selected assets and liabilities of the private non-financial sectors, 2013, Statistical Table B20
$b
1000
2000
3000
4000
5000
Jun
-19
88
Feb
-19
90
Oct
-19
91
Jun
-19
93
Feb
-19
95
Oct
-19
96
Jun
-19
98
Feb
-20
00
Oct
-20
01
Jun
-20
03
Feb
-20
05
Oct
-20
06
Jun
-20
08
Feb
-20
10
Oct
-20
11
Jun
-20
13
Deposits
Pension funds
Shares
Superannuation claims
Dwellings

NSW Parliamentary Research Service
26
cent and gross rental yields on a typical investment property by 4.2 per cent. As a result, an increasing number of investors are moving away from the share market into property based on these expected returns. The ratio between the asset values of dwellings to that of shares in Australia has, for example, increased from 4.72 to 7.92 between June 2007 and June 2013 (Figure 22).
Figure 22: Ratio of dwelling to share asset values69
3.3.4 Foreign investor demand
According to nominal data from the Foreign Investment Review Board (FIRB), between 1995-96 and 2011-12, the value of foreign investment approvals in Australian real estate increased from $12.4 billion to $59.1 billion. In 2011-12, residential approvals accounted for $19.7 billion, with the remaining $39.4 billion tied to commercial approvals. This section of this briefing paper will focus solely on trends in residential foreign investment. It should be noted that most of the data obtained from the FIRB is only available at a national level and the analysis will be conducted accordingly.
As noted, the value and number of residential foreign investment approvals in Australia have more than tripled since 1995-96. Since then, the number of residential approvals has increased from 3,181 to 9,768; and the value of these approvals has increased from $6.2 billion to $19.7 billion, reaching a high of $20.9 billion in 2010-11 (Figure 23).
69
Source: Reserve Bank of Australia, Selected assets and liabilities of the private non-financial sectors, 2013, Statistical Table B20
Ratio
3
6
9
12
15
18
Jun
-19
88
Feb
-19
90
Oct
-19
91
Jun
-19
93
Feb
-19
95
Oct
-19
96
Jun
-19
98
Feb
-20
00
Oct
-20
01
Jun
-20
03
Feb
-20
05
Oct
-20
06
Jun
-20
08
Feb
-20
10
Oct
-20
11
Jun
-20
13

House prices, ownership and affordability: trends in New South Wales
27
Figure 23: Residential foreign investment approvals, nominal, Australia70
Most of the residential investment in Australian real estate over the last two decades has occurred through development (or off-the-plan) projects. In 2011-12, development projects accounted for 79 per cent of total foreign investment, down from a high of 95 per cent in 1995-96. Given this decline, investment in developed (or established) real estate has been trending up over this period to account for the remaining 21 per cent foreign residential investment in Australia (Figure 24).
Figure 24: Value of residential foreign investment, nominal, by stage of development71
70
Source: Foreign Investment Review Board, Annual Reports, 1995 to 2012 71
Source: Foreign Investment Review Board, Annual Reports, 1995 to 2012
$b
5
10
15
20
25
No.
2000
4000
6000
8000
10000
120001
99
5-9
6
19
96
-97
19
97
-98
19
98
-99
19
99
-00
20
00
-01
20
01
-02
20
02
-03
20
03
-04
20
04
-05
20
05
-06
20
06
-07
20
07
-08
20
08
-09
20
09
-10
20
10
-11
20
11
-12
Number
Value
$b
4
8
12
16
20
24
19
95
-96
19
96
-97
19
97
-98
19
98
-99
19
99
-00
20
00
-01
20
01
-02
20
02
-03
20
03
-04
20
04
-05
20
05
-06
20
06
-07
20
07
-08
20
08
-09
20
09
-10
20
10
-11
20
11
-12
Developed For development

NSW Parliamentary Research Service
28
Aside from the fluctuations around 1999-2000 and 2007-08, foreign investment growth in NSW residential real estate remained relatively subdued prior to 2008-09, varying between $2 and $4 billion (Figure 25). Since then, foreign investment in NSW has increased dramatically, more than tripling between 2009-10 and 2011-12 from $1.9 billion to $6.9 billion. Foreign investment as a proportion of total residential purchases in NSW has increased from 3 per cent to 13 per cent during this period. Victoria also experienced a similar trend, increasing from $2.4 billion in 2009-10 to a high of $9.3 billion the following year. Growth in the Queensland and Western Australia has remained comparatively subdued.
Figure 25: Value of residential real estate foreign investment, nominal, by state72
Much of the publicity surrounding foreign investment in residential property has related to the boom in Chinese investment. While it is difficult to classify the growth in Chinese real estate investment as a sustained boom, there have been significant increases in recent years (Figure 26). It should be noted that data provided by the FIRB in their annual reports is aggregated and not split between residential and commercial investment; and that disaggregated data was not available for the 2008-09 financial year. Nevertheless, since 2007-08, real estate investment in Australia from China has increased by more around $2.7 billion. Real estate investment from Singapore has also increased significantly from $1.8 billion in 2007-08 to $5.7 billion in 2011-12. The US was the largest foreign investor in Australian real estate in 2011-12 at $8.1 billion.
72
Source: Foreign Investment Review Board, Annual Reports, 1995 to 2012
$m
2000
4000
6000
8000
10000
1995-96 1999-00 2003-04 2007-08 2011-12
NSW
QLD
VIC
WA

House prices, ownership and affordability: trends in New South Wales
29
Figure 26: Value of residential real estate foreign investment, nominal, by country73
Foreign investment in real estate as a proportion of total foreign investment in Australia has also increased significantly in the last few years. In 2008-09, real estate accounted for 12.9 per cent of all foreign investment in Australia and increased to 34.3 per cent in 2011-12 (Figure 27).
Figure 27: Value of foreign investment, nominal, by industry74
The specific effect of foreign investment on residential real estate prices is difficult to quantify and is beyond the scope of this research. Nevertheless, based on the data available, there are clear upward trends in the number and
73
Source: Foreign Investment Review Board, Annual Reports, 1995 to 2012 74
Source: Foreign Investment Review Board, Annual Reports, 1995 to 2012
$m
2000
4000
6000
8000
10000
12000
14000
US
Singapore
China
$m
50000
100000
150000
200000
250000 Tourism
Services
Resource Processing
Real estate
Mineral exploration anddevelopment
Manufacturing
Finance and insurance
Agriculture, forestry andfisheries

NSW Parliamentary Research Service
30
value of foreign investment in NSW and Australian residential real estate. Foreign investment approvals also account for around 6 per cent of the value residential real estate purchases in Australia. While the foreign investment share of total purchases trended down in Australia from the mid-1990s, this is because of an increase in the total value of purchases, driven in part by the growth in domestic investor demand (Figure 28).
Figure 28: Foreign investment approvals as a proportion of total purchase values, Australia75
Local investors76 and foreign investors now collectively account for a significant proportion (49 per cent in 2012-13) of Australian residential real estate purchases (Figure 13, Section 3.3). A continuation of investment on recent trajectories will increase competition in residential real estate and place upward pressure on prices in NSW. Investors have a distinct advantage as they are able to absorb the capital growth and leverage that against future purchases. For prospective owner-occupiers, increased competition and subsequent price rises represent a significant cost and undermines home ownership affordability.
75
Author estimates derived from: Foreign Investment Review Board, Annual Reports, 1995 to 2012; ABS, Housing Finance, Australia, Cat. No. 5609.0, October 2013;
76 Local investors account for 50 per cent of total housing finance used for purchases and whose actual share of purchases is likely to be even higher
0%
2%
4%
6%
8%
10%
12%
19
95
-96
19
96
-97
19
97
-98
19
98
-99
19
99
-00
20
00
-01
20
01
-02
20
02
-03
20
03
-04
20
04
-05
20
05
-06
20
06
-07
20
07
-08
20
08
-09
20
09
-10
20
10
-11
20
11
-12
20
12
-13
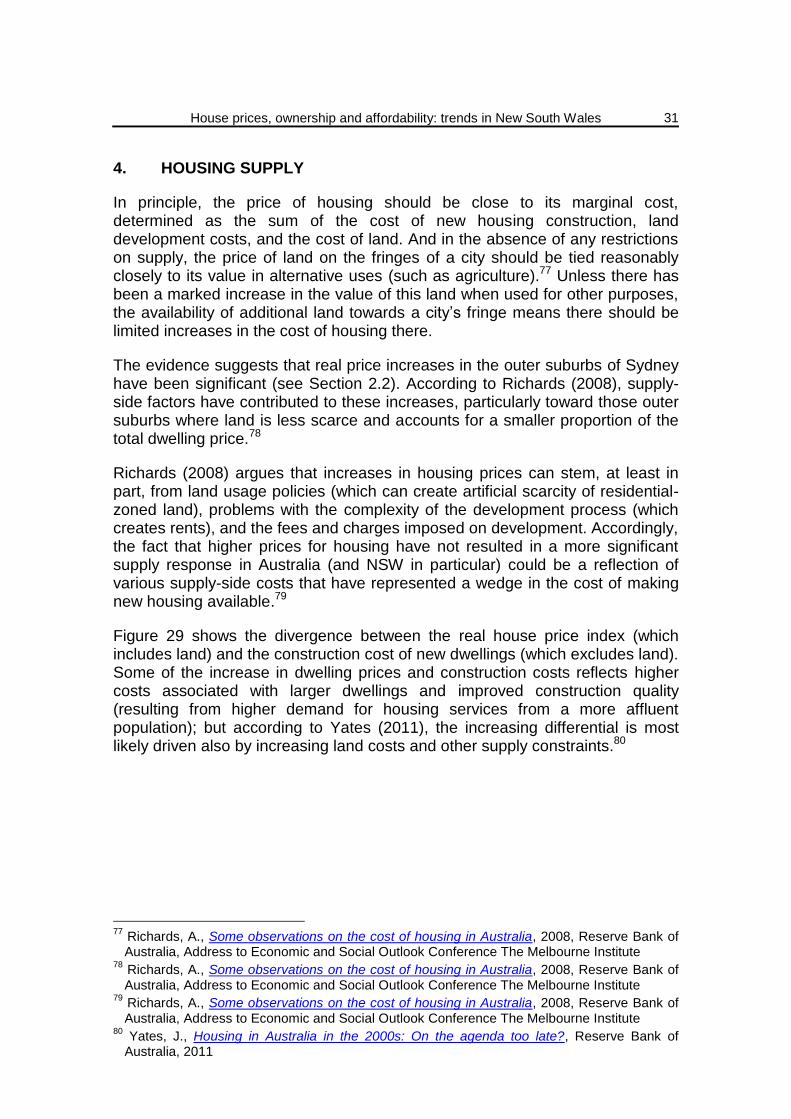
House prices, ownership and affordability: trends in New South Wales
31
4. HOUSING SUPPLY
In principle, the price of housing should be close to its marginal cost, determined as the sum of the cost of new housing construction, land development costs, and the cost of land. And in the absence of any restrictions on supply, the price of land on the fringes of a city should be tied reasonably closely to its value in alternative uses (such as agriculture).77 Unless there has been a marked increase in the value of this land when used for other purposes, the availability of additional land towards a city’s fringe means there should be limited increases in the cost of housing there.
The evidence suggests that real price increases in the outer suburbs of Sydney have been significant (see Section 2.2). According to Richards (2008), supply-side factors have contributed to these increases, particularly toward those outer suburbs where land is less scarce and accounts for a smaller proportion of the total dwelling price.78
Richards (2008) argues that increases in housing prices can stem, at least in part, from land usage policies (which can create artificial scarcity of residential-zoned land), problems with the complexity of the development process (which creates rents), and the fees and charges imposed on development. Accordingly, the fact that higher prices for housing have not resulted in a more significant supply response in Australia (and NSW in particular) could be a reflection of various supply-side costs that have represented a wedge in the cost of making new housing available.79
Figure 29 shows the divergence between the real house price index (which includes land) and the construction cost of new dwellings (which excludes land). Some of the increase in dwelling prices and construction costs reflects higher costs associated with larger dwellings and improved construction quality (resulting from higher demand for housing services from a more affluent population); but according to Yates (2011), the increasing differential is most likely driven also by increasing land costs and other supply constraints.80
77
Richards, A., Some observations on the cost of housing in Australia, 2008, Reserve Bank of Australia, Address to Economic and Social Outlook Conference The Melbourne Institute
78 Richards, A., Some observations on the cost of housing in Australia, 2008, Reserve Bank of Australia, Address to Economic and Social Outlook Conference The Melbourne Institute
79 Richards, A., Some observations on the cost of housing in Australia, 2008, Reserve Bank of Australia, Address to Economic and Social Outlook Conference The Melbourne Institute
80 Yates, J., Housing in Australia in the 2000s: On the agenda too late?, Reserve Bank of Australia, 2011

NSW Parliamentary Research Service
32
Figure 29: Real house price and construction cost indexes, Australia81
Sluggish supply responses to demand shocks are seen to have contributed to an overall housing shortage in Australia in the past decade. The National Housing Supply Council (NHSC) in its report on the state of the residential property market, estimated a gap (or undersupply) of 85,000 private dwellings in 2008.82 According to the NHSC, the estimated dwelling gap in June 2009 was 178,400 and was expected to increase by 72.6 per cent to 308,000 by 2014 (Table 1).
Table 1: Cumulative demand-supply gap, Australia83
Year ended 30 June Cumulative gap supply-demand gap
2011 214,700
2012 243,700
2013 272,800
2014 301,100
2015 328,800
2020 456,400
2030 640,200
This section of the paper will assess recent trends in housing supply which have contributed to this demand-supply gap and subsequent price rises in Australia and NSW. This section will briefly outline possible causes of the slowdown in housing supply. The complexity and jurisdictional variation in land-use policies prevents a detailed policy analysis and is beyond the scope of this research.
81
Source: Yates, J., Housing in Australia in the 2000s: On the agenda too late?, Reserve Bank of Australia, 2011
82 Soos, P., Bubbling over: the end of Australia’s $2 trillion housing party, 2011
83 Source: National Housing Supply Council, State of the Supply Report, 2011

House prices, ownership and affordability: trends in New South Wales
33
4.1 Building approvals
According to Battellino (2009), one of the key challenges in overcoming this apparent gap will be to ensure that the supply of housing is able to respond adequately to the increased demand. There is a broad consensus that in recent years Australia has not built enough dwellings. This shortfall in housing is not because investment in dwellings has been cut back. In fact, over the past decade dwelling investment has been higher (around 6 per cent of GDP) than it has typically been in the past.84
In short, the apparent contradiction between the shortage of dwellings and the high investment in dwellings arises because a high proportion of dwelling investment is going into improving the quality of existing dwellings and building accommodation additional to primary residences.85
4.1.1 Australia
In the decades prior to the 2000s, the rate of new construction in Australia showed strong cyclical tendencies with a general upward trend to the mid-1990s. Yates (2011) suggests that cyclicality in dwelling construction has traditionally been attributed to a stock adjustment cycle where there are significant lags in supply responses to fluctuations in demand.86 Since then, cycles have dampened and production has slowed.
Dwelling commencements have generally failed to keep pace with increases in underlying demand despite rising house prices. For example, annual dwelling approvals (all property types) have declined by 15 per cent since 2002 (Figure 30). Annual housing approvals are also at their lowest point (90,438) since 1996. This lack of supply responsiveness to price is seen to exacerbate demand-side pressures such as population growth. Sluggish supply responses have generally been attributed to planning or regulatory constraints, but according to Yates (2011), there is little systematic evidence on whether these increased in the 2000s in Australia.87
84
Battellino, R., Housing and the economy, 2009, Reserve Bank of Australia, Remarks to the 6th National Housing Conference Melbourne Convention and Exhibition Centre
85 Battellino, R., Housing and the economy, 2009, Reserve Bank of Australia, Remarks to the 6th National Housing Conference Melbourne Convention and Exhibition Centre
86 Yates, J., Housing in Australia in the 2000s: On the agenda too late?, Reserve Bank of Australia, 2011
87 Yates, J., Housing in Australia in the 2000s: On the agenda too late?, Reserve Bank of Australia, 2011

NSW Parliamentary Research Service
34
Figure 30: Annual dwelling approvals, by type, Australia88
Dwelling approvals have been trending up in recent months; with monthly housing approvals for October 2013 up 9 per cent since January and other dwelling approvals are up by 30 per cent. This increase in approvals is most likely a response to the rapid price rises seen across the major capital cities, including Sydney, at the end of 2012 and throughout 2013.
As at September 2013, 44.3 per cent of new dwelling approvals in Australia were for units, with the remaining 55.7 per cent for houses. Although detached houses remain the dominant dwelling type, the 44.3 per cent of units approved over the year is a near record high proportion of unit approvals. Not only are units more affordable than detached houses, they are also being delivered into inner city areas and along strategically located transport spines where a large proportion of the population prefers to live. There has recently been a strong trend towards unit approvals, and according to RP Data (2013), affordability factors will result in a continuation of this trend.89
There appears to be an apparent contradiction between long-term trends in dwelling approvals and the value of investment in Australia. For example, since June 1991, the quarterly value of residential work in Australia has increased by 89 per cent (Figure 31). Over the same period, and in spite of the increasing demand, dwelling approvals have mostly remained at similar levels they were at in the early 1990s.
88
Source: ABS, Building Approvals, Australia, Cat. No. 8731.0, October 2013 89
RP Data, Capital markets report, 2013
No.
40000
80000
120000
160000
19
90
19
91
19
92
19
93
19
94
19
95
19
96
19
97
19
98
19
99
20
00
20
01
20
02
20
03
20
04
20
05
20
06
20
07
20
08
20
09
20
10
20
11
20
12
20
13
House
Other
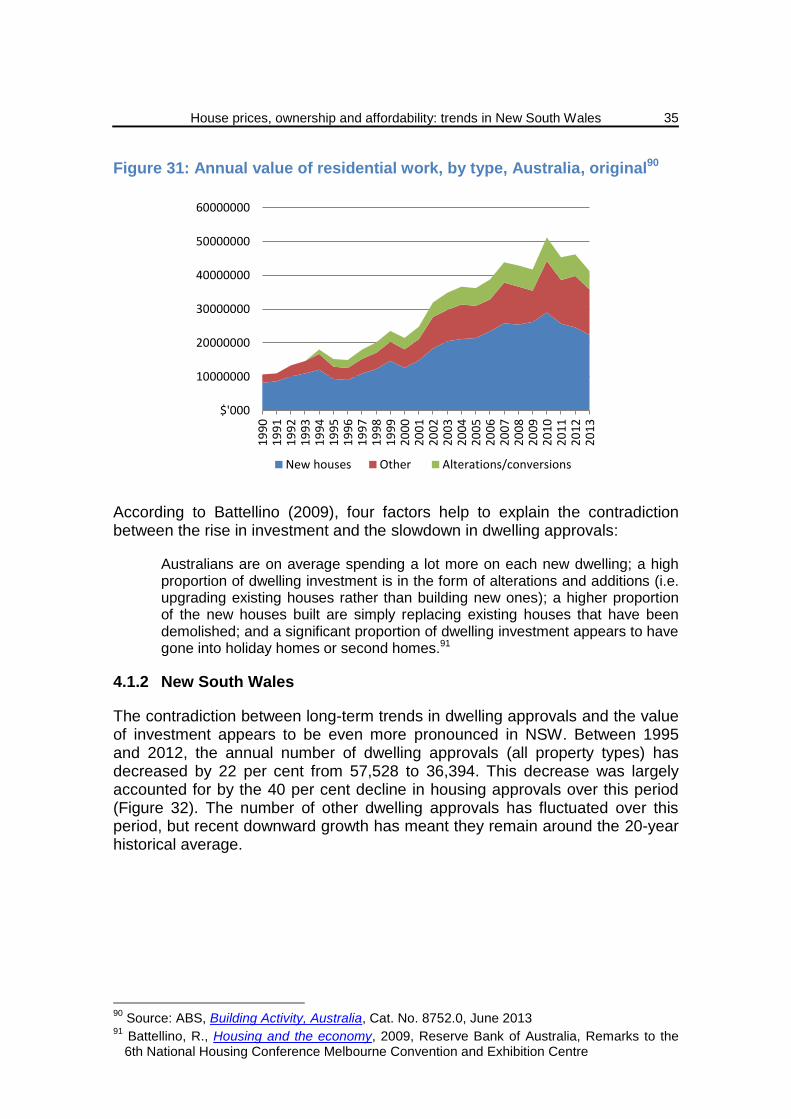
House prices, ownership and affordability: trends in New South Wales
35
Figure 31: Annual value of residential work, by type, Australia, original90
According to Battellino (2009), four factors help to explain the contradiction between the rise in investment and the slowdown in dwelling approvals:
Australians are on average spending a lot more on each new dwelling; a high proportion of dwelling investment is in the form of alterations and additions (i.e. upgrading existing houses rather than building new ones); a higher proportion of the new houses built are simply replacing existing houses that have been demolished; and a significant proportion of dwelling investment appears to have gone into holiday homes or second homes.91
4.1.2 New South Wales
The contradiction between long-term trends in dwelling approvals and the value of investment appears to be even more pronounced in NSW. Between 1995 and 2012, the annual number of dwelling approvals (all property types) has decreased by 22 per cent from 57,528 to 36,394. This decrease was largely accounted for by the 40 per cent decline in housing approvals over this period (Figure 32). The number of other dwelling approvals has fluctuated over this period, but recent downward growth has meant they remain around the 20-year historical average.
90
Source: ABS, Building Activity, Australia, Cat. No. 8752.0, June 2013 91
Battellino, R., Housing and the economy, 2009, Reserve Bank of Australia, Remarks to the 6th National Housing Conference Melbourne Convention and Exhibition Centre
$'000
10000000
20000000
30000000
40000000
50000000
60000000
19
90
19
91
19
92
19
93
19
94
19
95
19
96
19
97
19
98
19
99
20
00
20
01
20
02
20
03
20
04
20
05
20
06
20
07
20
08
20
09
20
10
20
11
20
12
20
13
New houses Other Alterations/conversions

NSW Parliamentary Research Service
36
Figure 32: Annual dwelling approvals, by type, NSW92
The value of residential investment in NSW, on the other hand, has increased significantly over this period. Between 1995 and 2012, the annual value of residential dwelling investment more than doubled from $5.6 billion to $11.4 billion. A large proportion of this growth was accounted for by non-housing investment. For example, during this period, non-housing investment increased (i.e. investment in renovations and units) at an annual average rate of 4.7 per cent, while housing investment increased at a rate of 3.3 per cent. This would appear to support the idea that house buyers in NSW are on average spending a lot more on each new dwelling; and that a growing proportion of dwelling investment occurs on non-house dwellings and is in the form of alterations and additions (Figure 33).
Figure 33: Annual value of residential work, by type, NSW, original93
92
Source: ABS, Building Approvals, Australia, Cat. No. 8731.0, October 2013 93
Source: ABS, Building Activity, Australia, Cat. No. 8752.0, June 2013
No.
10000
20000
30000
40000
19
90
19
91
19
92
19
93
19
94
19
95
19
96
19
97
19
98
19
99
20
00
20
01
20
02
20
03
20
04
20
05
20
06
20
07
20
08
20
09
20
10
20
11
20
12
20
13
Houses
Other
$'000
4000000
8000000
12000000
16000000
19
90
19
91
19
92
19
93
19
94
19
95
19
96
19
97
19
98
19
99
20
00
20
01
20
02
20
03
20
04
20
05
20
06
20
07
20
08
20
09
20
10
20
11
20
12
20
13
Alteration
Other
House

House prices, ownership and affordability: trends in New South Wales
37
4.2 Housing supply responsiveness
Housing demand fundamentals have generally been strong over the past two decades, underpinned by a high rate of population growth, relatively low unemployment rates and the strong growth in household income. At the same time, however, the number of new residential dwellings built relative to the size of the Australian population declined.94 There have been suggestions that supply-side constraints have inhibited the responsiveness of housing construction activity to price signals in Australia, which have further aggravated demand-side pressures.
As evidence, the OECD (2011) concludes that while the price elasticity95 of housing supply in Australia is about average for the OECD, it is relatively low when compared to countries with a similar population density, such as the US and Canada. This means that following increases in demand and subsequent price rises, housing development and construction in Australia is less responsive than in the US and Canada.
According to Worthington (2011), part of the problem in Australia are the inherent geographical and demographic conditions (including physical limitations on land for development and urbanisation) which restrict housing supply in certain areas and open up differences in regional housing affordability. The point can be illustrated by reference to Sydney and Melbourne, Australia’s two largest urban areas. Sydney is constrained by mountains to the west, the ocean to the east and national parks to the north and south, thereby pushing fringe development in a relatively narrow band to the northwest and southwest. Melbourne, on the other hand, is located on a broad flat plain with development opportunities technically available around much of the city.96 Sydney’s geographical limitations can add considerably to the overall cost of housing where the cost of an ‘infill’ dwelling in an established medium-density area can be 30 per cent higher than a corresponding ‘greenfield’ development.97
Worthington (2011) also suggests that government policy affects the supply of housing, as it relates to both land and housing planning, regulation and taxation. Putting taxation aside, the State and local governments have capacity to influence housing markets through zoning and development plans, thereby contributing to house prices through the approval of new dwellings and redevelopment in existing areas. This is particularly important because of the
94
Hsieh, W, Norman, D, and Orsmond, D., Supply-side issues in the housing sector, 2012, Reserve Bank of Australia, Bulletin – September Quarter 2012
95 Elasticity is the responsiveness of supply or demand to price movements.
96 Worthington, A., The quarter century record on housing affordability, affordability drivers, and government policy responses in Australia, 2011, Griffith Business School
97 Stuchbury, M., Voters defend the quarter-acre dream, The Weekend Australian 4-5 Dec, p. 12; Infill development occurs on vacant or undeveloped land within an existing community, and that is enclosed by other types of development. Greenfield development occurs on undeveloped land in a city or rural area either used for agriculture, landscape design, or left to naturally evolve.
NSW Parliamentary Research Service
38
presence of a supposed structural gap between housing demand and supply and the argument that building approvals and infrastructure charges are one of the main reasons for the increase in housing costs.98
The Productivity Commission (2004) concluded that planning processes have not contributed in a significant way to the housing affordability problem.99 The PC report was published nearly a decade ago and dwelling approvals have since declined to a 20 year low. Without further research, which is beyond the scope of this paper, it is difficult to ascertain specific causes of this decline in housing approvals and emerging demand-supply gap over the last decade. The OECD (2011) did, however, conclude that housing supply in Australia could be made more responsive by: designing and enforcing efficient land-use regulations; providing infrastructure and other services along with housing; and using well-designed taxes to encourage the appropriate use of land for residential purposes.
98
Worthington, A., The quarter century record on housing affordability, affordability drivers, and government policy responses in Australia, 2011, Griffith Business School
99 Productivity Commission, First home ownership, 2004, Inquiry Report No. 28

House prices, ownership and affordability: trends in New South Wales
39
5. HOME OWNERSHIP AFFORDABILITY INDICATORS
Prior to the 1970s, a household with average weekly earnings had a borrowing capacity that was more than adequate to fund the purchase of a median price dwelling. According to Yates (2011), the foundations of this high and stable home ownership rate began to be challenged from about the mid-1980s with the emerging divergence of house prices with respect to income.100 Following the strong growth in real house prices in the last two decades (and triggered by price growth in the last 12 months), there have been renewed concerns about the viability of purchasing a home, especially for first home buyers.101
The standard measures of affordability show an improvement when average household income is growing faster than housing prices, or when mortgage interest rates are falling so that the borrowing power of households is increasing. The interaction of house prices, incomes and the cost of mortgage finance affect the ability of potential first homebuyers to access home ownership and as such are the most common indicators of affordability.102
While affordability problems can vary cyclically, house price and household income data suggests there is an underlying structural affordability problem in Australia that has worsened in recent years.103 As evidence, between 1960 and 2006 real house prices increased at an average of 2.7 per cent annually, ahead of 1.9 per cent growth in per household real incomes.104
Because they are relatively straightforward and accurate, the price to household income and deposit gap measures are the most widely used to assess historical trends in affordability. Home-ownership affordability is, however, multi-dimensional and encompasses a range of issues other than point-of-purchase affordability. Affordability can be undermined for prospective and incumbent home owners across all stages of the ownership life-cycle. Given this, several indicators of affordability are assessed in this section of the paper.
5.1 Rental prices and housing costs
Rising housing and rental costs may prevent prospective home buyers (particularly in inner urban areas) from saving a large enough deposit; or at the very least, it will take a longer period of time than it would have previously. For these buyers, there is a significant opportunity cost in waiting to buy a first home which materialises in two ways. Firstly, as real house prices rise (usually disproportionately with income) the deposit required to buy a home of a fixed
100
Yates, J., Housing in Australia in the 2000s: On the agenda too late?, Reserve Bank of Australia, 2011
101 Soos, P., Bubbling over: the end of Australia’s $2 trillion housing party, 2011
102 Yates, J., Australia’s housing affordability crisis, 2011, The Australian Economic Review, Vol. 41, no. 2, pp.200-14
103 Yates, J., Australia’s housing affordability crisis, 2011, The Australian Economic Review, Vol. 41, no. 2, pp.200-14
104 Soos, P., Bubbling over: the end of Australia’s $2 trillion housing party, 2011

NSW Parliamentary Research Service
40
size will rise with time. This cost is then compounded because prospective home buyers are not absorbing any of the capital growth.
Rental prices, which form a large component of a prospective home buyers housing costs, have risen consistently in NSW over the last two decades, with the growth most pronounced in the inner urban areas of Sydney. Between March 1993 and March 2013, the median rent (for all properties) in the inner ring of Sydney more than doubled from $195 to $560; while the median rent in the middle ring of Sydney increased by $300 (Figure 34).
Figure 34: Median rent for all dwellings, by area, NSW105
For renters, affordability is typically measured by the ratio of rent paid to household income. Survey data from the RBA (2008) shows that, at a national level, the proportion of income allocated to rent payments has risen over the past two decades for renter households of all income levels (Figure 35). In addition, the share of lower-income households in housing stress (paying more than 30 per cent of their income in meeting their housing costs) has risen.106
105
Source: Housing NSW, Rent and Sales Report, 2013 106
Richards, A., Some observations on the cost of housing in Australia, 2008, Reserve Bank of Australia, Address to Economic and Social Outlook Conference The Melbourne Institute
$/week
100
200
300
400
500
600
700
Greater Sydney Inner Ring Middle Ring
Outer Ring Rest of GMR Rest of NSW
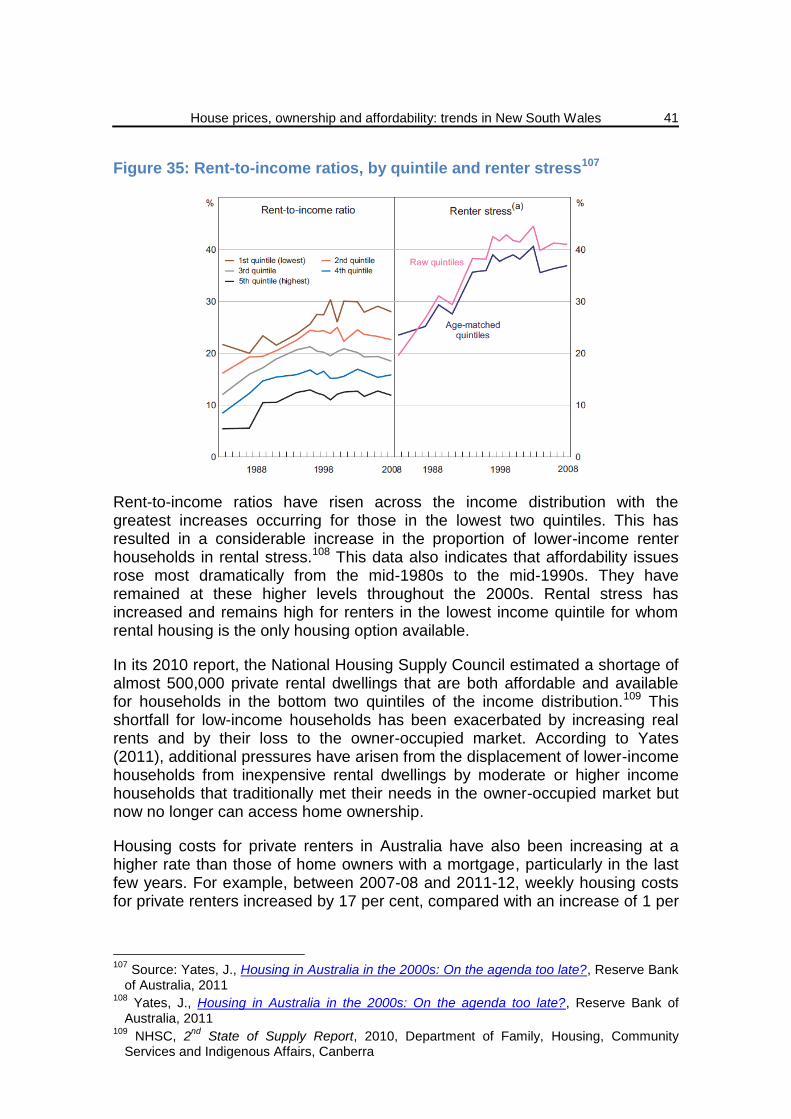
House prices, ownership and affordability: trends in New South Wales
41
Figure 35: Rent-to-income ratios, by quintile and renter stress107
Rent-to-income ratios have risen across the income distribution with the greatest increases occurring for those in the lowest two quintiles. This has resulted in a considerable increase in the proportion of lower-income renter households in rental stress.108 This data also indicates that affordability issues rose most dramatically from the mid-1980s to the mid-1990s. They have remained at these higher levels throughout the 2000s. Rental stress has increased and remains high for renters in the lowest income quintile for whom rental housing is the only housing option available.
In its 2010 report, the National Housing Supply Council estimated a shortage of almost 500,000 private rental dwellings that are both affordable and available for households in the bottom two quintiles of the income distribution.109 This shortfall for low-income households has been exacerbated by increasing real rents and by their loss to the owner-occupied market. According to Yates (2011), additional pressures have arisen from the displacement of lower-income households from inexpensive rental dwellings by moderate or higher income households that traditionally met their needs in the owner-occupied market but now no longer can access home ownership.
Housing costs for private renters in Australia have also been increasing at a higher rate than those of home owners with a mortgage, particularly in the last few years. For example, between 2007-08 and 2011-12, weekly housing costs for private renters increased by 17 per cent, compared with an increase of 1 per
107
Source: Yates, J., Housing in Australia in the 2000s: On the agenda too late?, Reserve Bank of Australia, 2011
108 Yates, J., Housing in Australia in the 2000s: On the agenda too late?, Reserve Bank of Australia, 2011
109 NHSC, 2
nd State of Supply Report, 2010, Department of Family, Housing, Community
Services and Indigenous Affairs, Canberra
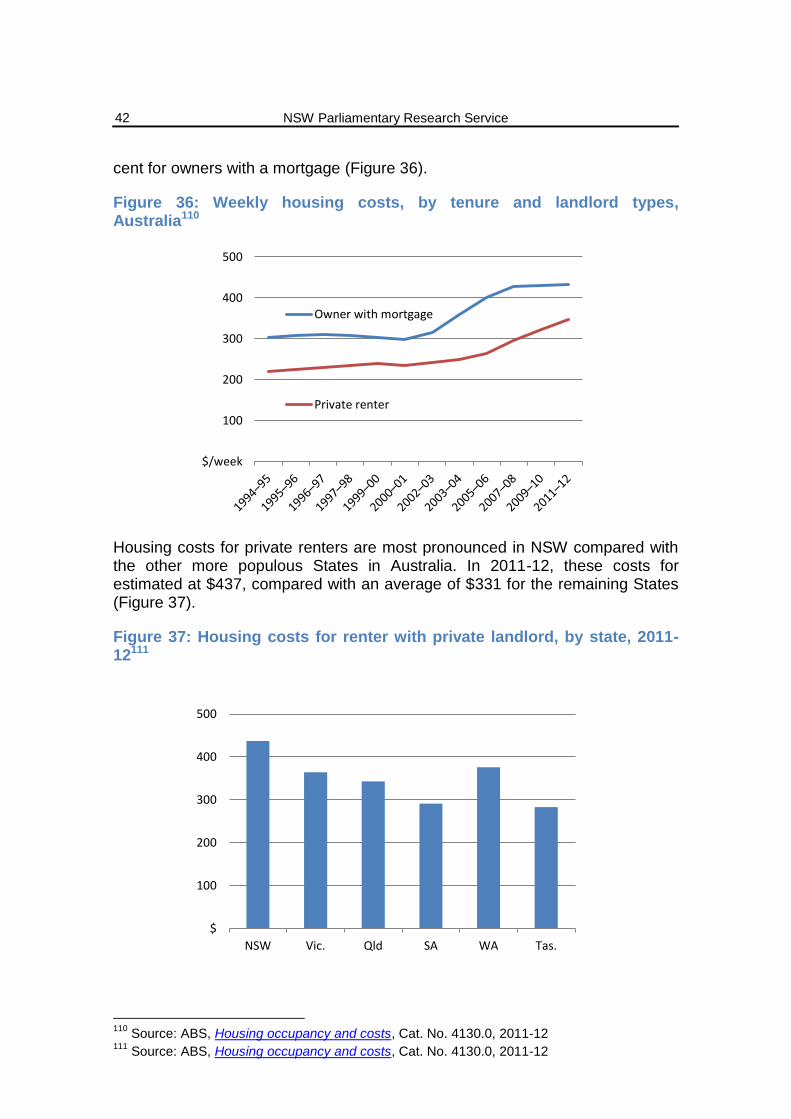
NSW Parliamentary Research Service
42
cent for owners with a mortgage (Figure 36).
Figure 36: Weekly housing costs, by tenure and landlord types, Australia110
Housing costs for private renters are most pronounced in NSW compared with the other more populous States in Australia. In 2011-12, these costs for estimated at $437, compared with an average of $331 for the remaining States (Figure 37).
Figure 37: Housing costs for renter with private landlord, by state, 2011-12111
110
Source: ABS, Housing occupancy and costs, Cat. No. 4130.0, 2011-12 111
Source: ABS, Housing occupancy and costs, Cat. No. 4130.0, 2011-12
$/week
100
200
300
400
500
Owner with mortgage
Private renter
$
100
200
300
400
500
NSW Vic. Qld SA WA Tas.

House prices, ownership and affordability: trends in New South Wales
43
5.2 Household income to house price ratio
The price-to-income ratio gives an indication of the relative expense of a home for a typical household. It is widely cited by commentators, and is often taken as a summary statistic of over or undervaluation in the housing market.112
Figure 38 shows the national dwelling prices to income, calculated by the RBA in two different ways. The lower ratio is based on average dwelling prices together with average household income from the national accounts, while the higher ratio is based on median dwelling prices together with median income from surveys.
There is a clear difference in levels between the two series. Nevertheless, the series move together so that analysis of the ratio is largely unaffected by the particular series used. According to both measures, the ratio of dwelling prices to income was relatively stable over the early to mid-1980s, but rose considerably during the late 1980s, the 1990s and the early 2000s, driven by rising dwelling prices. Between 2003 and 2012, the ratios flattened and then trended lower.
Figure 38: National dwelling price-to-income-ratio, by measurement type113
Price-to-income ratios are often used in isolation to assess affordability. However, according to Fox and Finlay (2012), this only makes sense if other factors affecting borrowing capacity are unchanged. As borrowing capacity increases, households have greater ability to purchase housing and prices can be bid up more than the increase in incomes. In this case, higher price-to-
112
Fox, R and Finlay, R., Dwelling prices and household income, 2012, Reserve Bank of Australia, Bulletin – December 2012
113 Source: Fox, R and Finlay, R., Dwelling prices and household income, 2012, Reserve Bank of Australia, Bulletin – December 2012

NSW Parliamentary Research Service
44
income ratios do not automatically imply less affordable housing, but can be a consequence of households’ greater ability to pay for housing (i.e. lower mortgage costs).114
Fox and Finlay (2012) conclude that the rise in the price-to-income ratio through the late 1980s to the early 2000s reflected a range of factors, outside of income, that affected households’ ability and willingness to pay for housing. For example, financial market deregulation in the 1980s meant less credit rationing, increasing the amount households could borrow and opening the borrowing market to a wider set of households. The effect of this increase in credit supply was amplified by falling inflation, which declined from an average of 10 per cent in the 1970s to around 2 to 3 per cent by the 1990s.
Lower nominal interest rates also reduced the degree of ‘front-end loading’ in housing loans, whereby the servicing and repayment burden is disproportionately large in the early years of the loan. This increased the maximum possible loan serviceable with a given level of income, increasing prospective buyers’ spending capacity over and above any rises in their income. Fox and Finlay (2012) suggest that, since the late 1990s, changes in capital gains tax may have served to make dwellings more attractive to investors, while subsidies for first home buyers have supported their capacity to pay for dwellings.115
5.2.1 Comparison within Australia
Although incomes tend to be higher in capital cities than regional areas (by around 25 per cent on average according to the ABS), median dwelling prices still tend to be proportionally higher in capital cities (by around 50 per cent on average); and while capital cities, on average, have a higher price-to-income ratio than in regional areas, both have tended to follow similar trajectories (Figure 39).116
114
Fox, R and Finlay, R., Dwelling prices and household income, 2012, Reserve Bank of Australia, Bulletin – December 2012; Worthington, A., The quarter century record on housing affordability, affordability drivers, and government policy responses in Australia, 2011, Griffith Business School
115 Fox, R and Finlay, R., Dwelling prices and household income, 2012, Reserve Bank of Australia, Bulletin – December 2012
116 Fox, R and Finlay, R., Dwelling prices and household income, 2012, Reserve Bank of Australia, Bulletin – December 2012
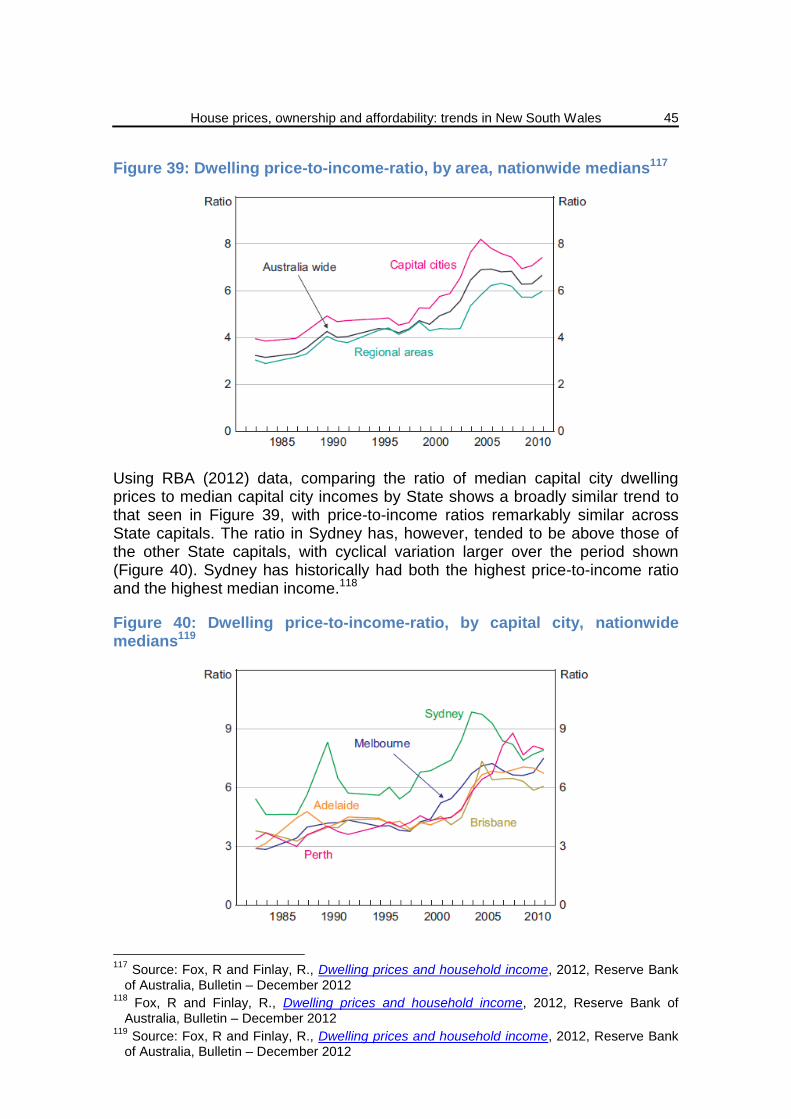
House prices, ownership and affordability: trends in New South Wales
45
Figure 39: Dwelling price-to-income-ratio, by area, nationwide medians117
Using RBA (2012) data, comparing the ratio of median capital city dwelling prices to median capital city incomes by State shows a broadly similar trend to that seen in Figure 39, with price-to-income ratios remarkably similar across State capitals. The ratio in Sydney has, however, tended to be above those of the other State capitals, with cyclical variation larger over the period shown (Figure 40). Sydney has historically had both the highest price-to-income ratio and the highest median income.118
Figure 40: Dwelling price-to-income-ratio, by capital city, nationwide medians119
117
Source: Fox, R and Finlay, R., Dwelling prices and household income, 2012, Reserve Bank of Australia, Bulletin – December 2012
118 Fox, R and Finlay, R., Dwelling prices and household income, 2012, Reserve Bank of Australia, Bulletin – December 2012
119 Source: Fox, R and Finlay, R., Dwelling prices and household income, 2012, Reserve Bank of Australia, Bulletin – December 2012
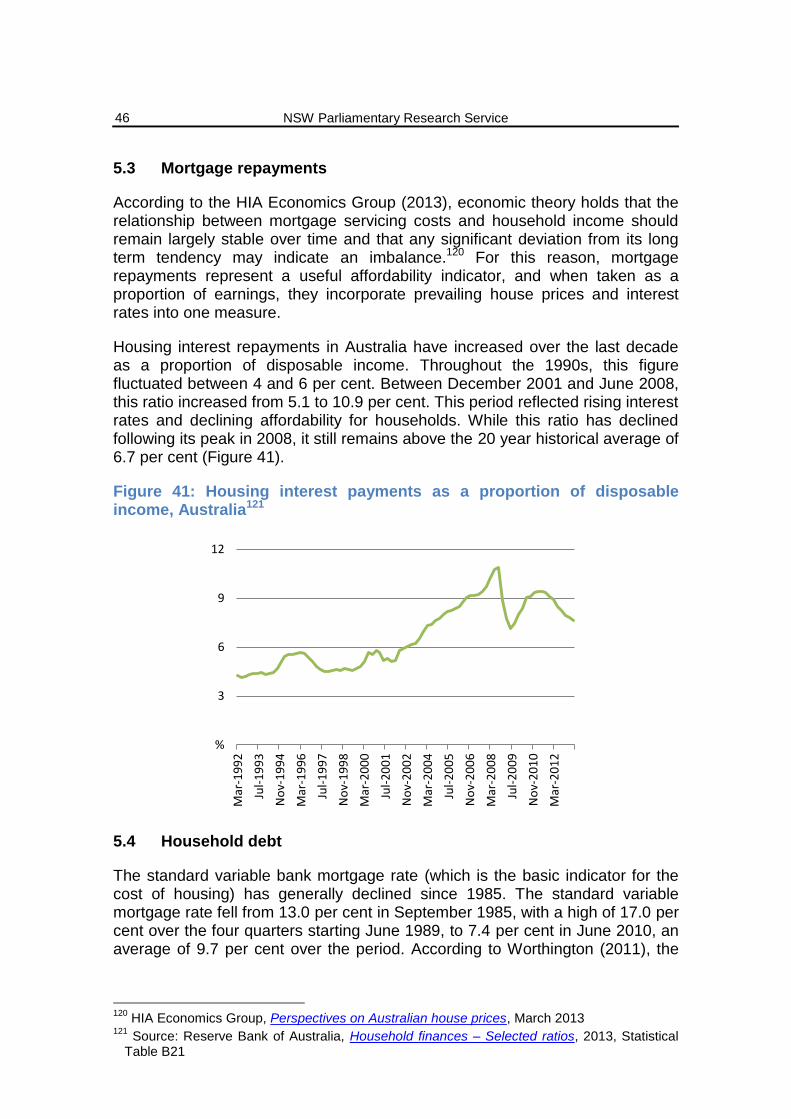
NSW Parliamentary Research Service
46
5.3 Mortgage repayments
According to the HIA Economics Group (2013), economic theory holds that the relationship between mortgage servicing costs and household income should remain largely stable over time and that any significant deviation from its long term tendency may indicate an imbalance.120 For this reason, mortgage repayments represent a useful affordability indicator, and when taken as a proportion of earnings, they incorporate prevailing house prices and interest rates into one measure.
Housing interest repayments in Australia have increased over the last decade as a proportion of disposable income. Throughout the 1990s, this figure fluctuated between 4 and 6 per cent. Between December 2001 and June 2008, this ratio increased from 5.1 to 10.9 per cent. This period reflected rising interest rates and declining affordability for households. While this ratio has declined following its peak in 2008, it still remains above the 20 year historical average of 6.7 per cent (Figure 41).
Figure 41: Housing interest payments as a proportion of disposable income, Australia121
5.4 Household debt
The standard variable bank mortgage rate (which is the basic indicator for the cost of housing) has generally declined since 1985. The standard variable mortgage rate fell from 13.0 per cent in September 1985, with a high of 17.0 per cent over the four quarters starting June 1989, to 7.4 per cent in June 2010, an average of 9.7 per cent over the period. According to Worthington (2011), the
120
HIA Economics Group, Perspectives on Australian house prices, March 2013 121
Source: Reserve Bank of Australia, Household finances – Selected ratios, 2013, Statistical Table B21
%
3
6
9
12
Mar
-19
92
Jul-
19
93
No
v-1
99
4
Mar
-19
96
Jul-
19
97
No
v-1
99
8
Mar
-20
00
Jul-
20
01
No
v-2
00
2
Mar
-20
04
Jul-
20
05
No
v-2
00
6
Mar
-20
08
Jul-
20
09
No
v-2
01
0
Mar
-20
12

House prices, ownership and affordability: trends in New South Wales
47
downward trend in home lending rates is arguably not only a condition of the Australian economy, but also stemmed from financial deregulation and the progressive narrowing of the spread between mortgage rates and the official cash rate from increased competition in the banking and non-banking sector.122
With lower interest rates and borrowing costs, the cost of finance has declined in recent years, which has led to an increase in the level of debt (as a proportion of household assets) in Australia. Gearing (the ratio of the value of housing debt to housing assets) has nearly tripled since the late 1980s, increasing from 10.6 per cent in September 1985 to 28.4 per cent in June 2010 (Figure 42). Gearing and debt servicing are substantially higher in owner-occupied debt-holding (especially low-income) households than what the aggregate figures suggest.123 This can expose borrowers and owner-occupiers to financial risk and variation in interest rates which may undermine the long-term affordability of home-ownership.
Figure 42: Household debt as a proportion of household assets, Australia124
5.5 Affordability indexes
The most widely reported measures of home loan affordability in Australia are the Real Estate Institute of Australia Home Loan Affordability Indicator, the Commonwealth Bank of Australia–Housing Industry Association Housing Affordability Index, and the BIS Shrapnel Home Loan Affordability Index.
122
Worthington, A., The quarter century record on housing affordability, affordability drivers, and government policy responses in Australia, 2011, Griffith Business School
123 Worthington, A., The quarter century record on housing affordability, affordability drivers, and government policy responses in Australia, 2011, Griffith Business School
124 Source: Reserve Bank of Australia, Household finances – Selected ratios, 2013, Statistical Table B21
%
7
14
21
28
35
Mar
-19
77
Feb
-19
79
Jan
-19
81
De
c-1
98
2
No
v-1
98
4
Oct
-19
86
Sep
-19
88
Au
g-1
99
0
Jul-
19
92
Jun
-19
94
May
-19
96
Ap
r-1
99
8
Mar
-20
00
Feb
-20
02
Jan
-20
04
De
c-2
00
5
No
v-2
00
7
Oct
-20
09
Sep
-20
11
NSW Parliamentary Research Service
48
While providing a useful measure of the underlying trend in home loan affordability the various indexes should be treated with caution when analysing shorter-term cyclical trends.125 With reference to the completeness and accuracy of these indexes, the Productivity Commission (2004) concluded that:
…the available indexes all suffer from methodological and data problems that
preclude precise conclusions, particularly concerning first home buyers. 126
The indexes presented in this section of the paper measure affordability at a national level. As discussed in Section 2, house price movements have not been broad based in the last 12 months and have been localised in capital cities, notably Sydney and Perth. Further, there are usually large discrepancies in price growth within these cities (i.e inner urban areas usually experience stronger price growth). As such, these indexes are limited in the extent to which they can capture more localised issues of affordability.
The REIA and BIS Shrapnel Indexes have been updated as at June 2013 in their most recent publications; while the Demographia Index has only been updated as at 2012. There are often marked seasonality effects in real estate price growth, particularly in Sydney which exhibited strong activity in the spring of 2013. This price movement is not captured in any of these indexes.
The CBA-HIA Affordability Report (2013) states that:
The affordability index measures the extent to which average weekly earnings can repay and service a mortgage for a median-priced dwelling. The index is calculated based on prevailing mortgage interest rates, average weekly earnings and median home prices. Essentially, the concept of affordability explores the proportion of earnings absorbed by servicing costs on a 25 year mortgage with a 90 per cent Loan-to-Valuation-Ratio (LVR) at inception.
The REIA and BIS Shrapnel Affordability Indexes implement similar methodologies which effectively measure the servicing costs of a loan. While this is an important aspect of affordability for first home buyers, the ability to save for a deposit and having access to home ownership in the first instance is an equally important component of affordability which is not measured by these indexes. First-home buyer rates of new ownership (discussed in Section 3.3.2) are perhaps more reflective of this issue.
5.5.1 Real Estate Institute of Australia Affordability Index
The Real Estate Institute of Australia (REIA) Housing Affordability Index is the ratio of median household income to average loan repayments, with the average determined by the average size of new loans for each quarter. An increase in the REIA index represents an increase in affordability.
125
Parliament of Australia, Home loan affordability—measurement and trends, 2006, Parliamentary Library, Research Note No.8
126 Productivity Commission, First home ownership, 2004, Inquiry Report No. 28
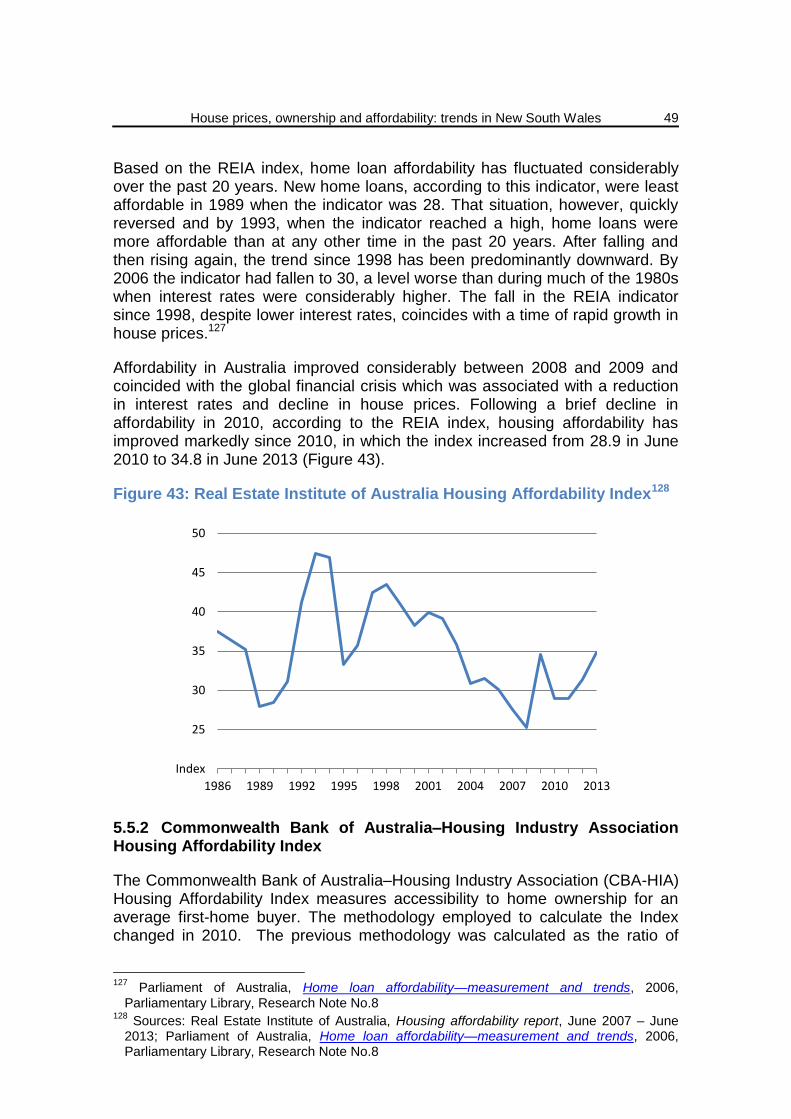
House prices, ownership and affordability: trends in New South Wales
49
Based on the REIA index, home loan affordability has fluctuated considerably over the past 20 years. New home loans, according to this indicator, were least affordable in 1989 when the indicator was 28. That situation, however, quickly reversed and by 1993, when the indicator reached a high, home loans were more affordable than at any other time in the past 20 years. After falling and then rising again, the trend since 1998 has been predominantly downward. By 2006 the indicator had fallen to 30, a level worse than during much of the 1980s when interest rates were considerably higher. The fall in the REIA indicator since 1998, despite lower interest rates, coincides with a time of rapid growth in house prices.127
Affordability in Australia improved considerably between 2008 and 2009 and coincided with the global financial crisis which was associated with a reduction in interest rates and decline in house prices. Following a brief decline in affordability in 2010, according to the REIA index, housing affordability has improved markedly since 2010, in which the index increased from 28.9 in June 2010 to 34.8 in June 2013 (Figure 43).
Figure 43: Real Estate Institute of Australia Housing Affordability Index128
5.5.2 Commonwealth Bank of Australia–Housing Industry Association Housing Affordability Index
The Commonwealth Bank of Australia–Housing Industry Association (CBA-HIA) Housing Affordability Index measures accessibility to home ownership for an average first-home buyer. The methodology employed to calculate the Index changed in 2010. The previous methodology was calculated as the ratio of
127
Parliament of Australia, Home loan affordability—measurement and trends, 2006, Parliamentary Library, Research Note No.8
128 Sources: Real Estate Institute of Australia, Housing affordability report, June 2007 – June 2013; Parliament of Australia, Home loan affordability—measurement and trends, 2006, Parliamentary Library, Research Note No.8
Index
25
30
35
40
45
50
1986 1989 1992 1995 1998 2001 2004 2007 2010 2013

NSW Parliamentary Research Service
50
average disposable income per household to the ‘qualifying’ income required to meet repayments on a 25-year loan, that is, for 80 per cent of the median price of an average established dwelling purchased by a first-home buyer. This index divided by 100 shows the number of times that average household disposable income exceeds the minimum income needed to meet repayments on an average established dwelling. As with the REIA indicator, an increase in the CBA–HIA index represents improved affordability.129
The previous CBA–HIA index, similar to that of REIA, shows home loan affordability was at a low in 1989 when the value of the index was 112. Affordability improved thereafter, with the index reaching a high of 176 in 1997. From 2001 the index declined, with its value falling to an all-time low of 108 in 2006 (Figure 44).
Figure 44: CBA-HIA Housing Affordability Index, Methodology 1130
The current CBA-HIA Housing Affordability Index is calculated by the ratio of the average full time wage of an individual to the income necessary to be able to meet repayments on a median priced dwelling. An increase in the ratio also represents an improvement in affordability.131 Figure 45 reveals that affordability experienced a considerable decline through early-2009 and mid-2010.
129
Parliament of Australia, Home loan affordability—measurement and trends, 2006, Parliamentary Library, Research Note No.8
130 Commonwealth Bank, HIA Housing Affordability Reports, 2009-2013; Parliament of Australia, Home loan affordability—measurement and trends, 2006, Parliamentary Library, Research Note No.8
131 For more information regarding the methodology follow this link.
Index
100
120
140
160
180
19
86
19
87
19
88
19
89
19
90
19
91
19
92
19
93
19
94
19
95
19
96
19
97
19
98
19
99
20
00
20
01
20
02
20
03
20
04
20
05
20
06
20
07
20
08

House prices, ownership and affordability: trends in New South Wales
51
Figure 45: CBA-HIA Housing Affordability Index, Methodology 2132
Affordability has, however, improved considerably since then, rising from 54 in December 2010 to 75.1 in September 2013. This improvement coincides with the latest interest rate easing cycle (Figure 45). This index represents national real estate prices and is not specific to NSW or the Sydney market. Recent price surges have been localised in specific markets and are not captured by a national or even a State index.
5.5.3 BIS Shrapnel Home Loan Affordability Index
The BIS Shrapnel Home Loan Affordability Index shows the proportion of full-time male average earnings needed to meet the mortgage repayments on a ‘typical’ housing loan. A typical housing loan is assumed to be a 25-year loan for 75 per cent of the median house price. A decrease in the BIS Shrapnel indicator represents improved affordability.
The BIS Shrapnel Index virtually mirrors the previous two Indexes in that affordability improved through the early and mid-1990s and declined significantly through the late-1990s and early-2000s. The index also shows a marked improvement in affordability since 2010 (Figure 46) in all four of the capital cities (including Sydney) resulting from a combination of lower prices or weak price growth and cuts to interest rates.
132
Commonwealth Bank, HIA Housing Affordability Reports, 2009-2013
Index
60
70
80M
ar-0
9
Jun
-09
Sep
-09
De
c-0
9
Mar
-10
Jun
-10
Sep
-10
De
c-1
0
Mar
-11
Jun
-11
Sep
-11
De
c-1
1
Mar
-12
Jun
-12
Sep
-12
De
c-1
2
Mar
-13
Jun
-13
Sep
-13

NSW Parliamentary Research Service
52
Figure 46: BIS Shrapnel Home Loan Affordability Index133
5.5.4 Demographia International Housing Affordability Survey
The Demographia International Housing Affordability Survey employs the “Median Multiple” (median house price divided by gross before tax annual median household income) to rate housing affordability. Housing affordability may be rated as either affordable (3.0 and under), moderately unaffordable (3.1 to 4.0), seriously unaffordable (4.1 to 5.0) or severely unaffordable (5.1 and over) based on this median multiple.
Figure 47, shows that affordability has deteriorated across all of the capital cities in Australia since the early 1980s. The most notable period of decline occurred in the early and mid-2000s which is consistent with the other three affordability indicators above (Figure 47). The median multiples of all the capital cities have improved since 2010 following interest rate declines and subdued or negative price growth across these cities. Sydney and Melbourne, which are the least affordable capital cities in Australia, are also ranked 3rd and 6th globally in terms of unaffordability.
133
BIS Shrapnel, Australian Housing Outlook 2013 – 2016, October 2013

House prices, ownership and affordability: trends in New South Wales
53
Figure 47: Demographia Median Multiple134
134
Demographia, 9th Annual International Housing Affordability Survey – Ratings for
Metropolitan Markets, 2013
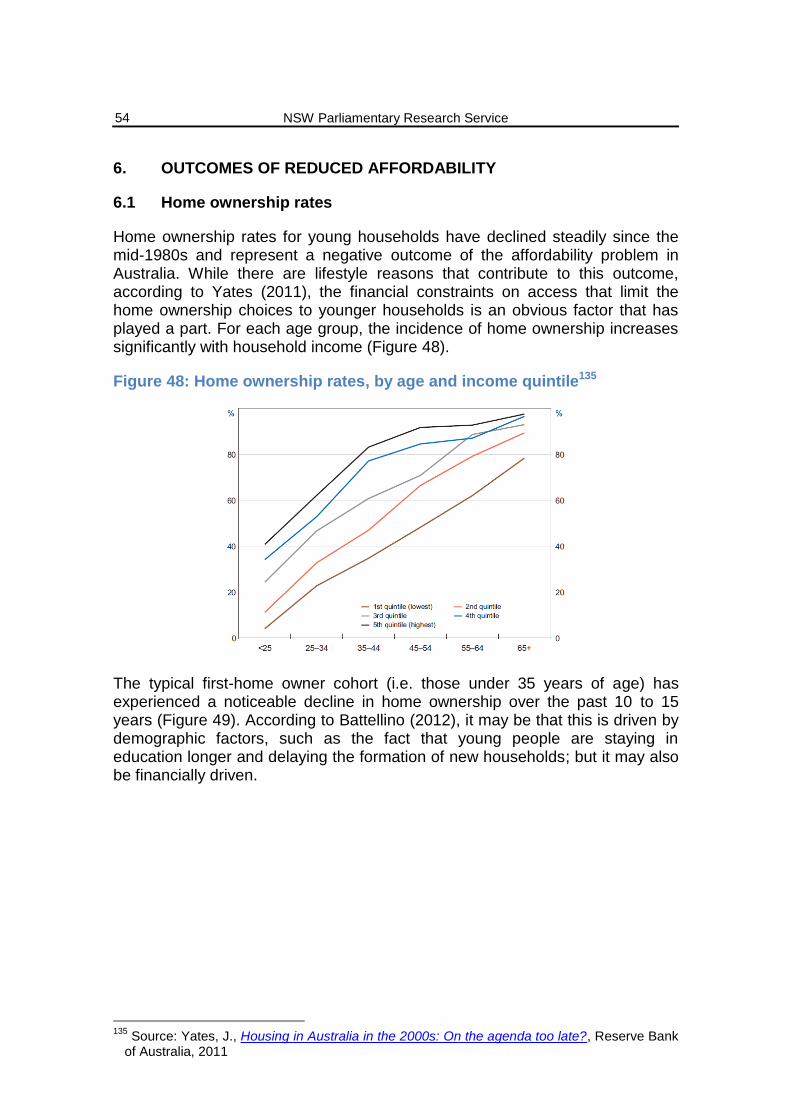
NSW Parliamentary Research Service
54
6. OUTCOMES OF REDUCED AFFORDABILITY
6.1 Home ownership rates
Home ownership rates for young households have declined steadily since the mid-1980s and represent a negative outcome of the affordability problem in Australia. While there are lifestyle reasons that contribute to this outcome, according to Yates (2011), the financial constraints on access that limit the home ownership choices to younger households is an obvious factor that has played a part. For each age group, the incidence of home ownership increases significantly with household income (Figure 48).
Figure 48: Home ownership rates, by age and income quintile135
The typical first-home owner cohort (i.e. those under 35 years of age) has experienced a noticeable decline in home ownership over the past 10 to 15 years (Figure 49). According to Battellino (2012), it may be that this is driven by demographic factors, such as the fact that young people are staying in education longer and delaying the formation of new households; but it may also be financially driven.
135
Source: Yates, J., Housing in Australia in the 2000s: On the agenda too late?, Reserve Bank of Australia, 2011
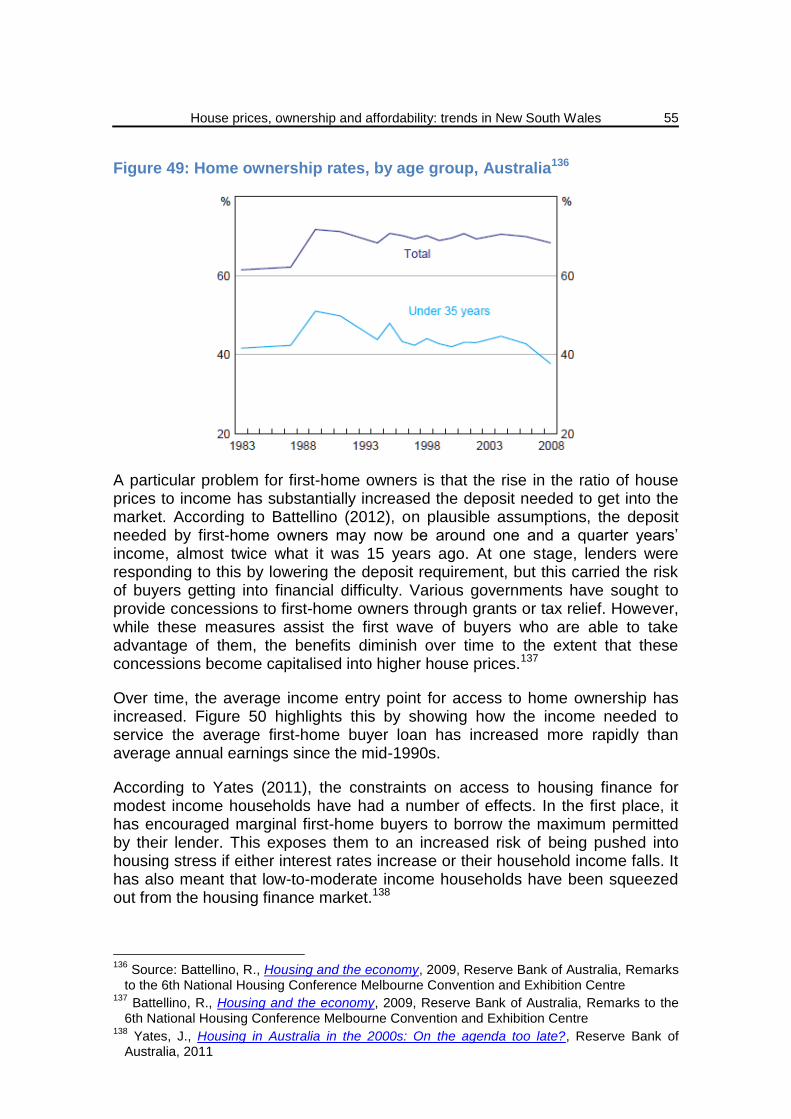
House prices, ownership and affordability: trends in New South Wales
55
Figure 49: Home ownership rates, by age group, Australia136
A particular problem for first-home owners is that the rise in the ratio of house prices to income has substantially increased the deposit needed to get into the market. According to Battellino (2012), on plausible assumptions, the deposit needed by first-home owners may now be around one and a quarter years’ income, almost twice what it was 15 years ago. At one stage, lenders were responding to this by lowering the deposit requirement, but this carried the risk of buyers getting into financial difficulty. Various governments have sought to provide concessions to first-home owners through grants or tax relief. However, while these measures assist the first wave of buyers who are able to take advantage of them, the benefits diminish over time to the extent that these concessions become capitalised into higher house prices.137
Over time, the average income entry point for access to home ownership has increased. Figure 50 highlights this by showing how the income needed to service the average first-home buyer loan has increased more rapidly than average annual earnings since the mid-1990s.
According to Yates (2011), the constraints on access to housing finance for modest income households have had a number of effects. In the first place, it has encouraged marginal first-home buyers to borrow the maximum permitted by their lender. This exposes them to an increased risk of being pushed into housing stress if either interest rates increase or their household income falls. It has also meant that low-to-moderate income households have been squeezed out from the housing finance market.138
136
Source: Battellino, R., Housing and the economy, 2009, Reserve Bank of Australia, Remarks to the 6th National Housing Conference Melbourne Convention and Exhibition Centre
137 Battellino, R., Housing and the economy, 2009, Reserve Bank of Australia, Remarks to the 6th National Housing Conference Melbourne Convention and Exhibition Centre
138 Yates, J., Housing in Australia in the 2000s: On the agenda too late?, Reserve Bank of Australia, 2011

NSW Parliamentary Research Service
56
Figure 50: Income required to service an average FHB loan, Australia139
6.2 Wealth distribution
There are wealth implications from not having affordable access to home ownership. Figure 51 shows that renters excluded from increases in housing wealth do not have other forms of wealth to compensate. Owner-occupiers not only own all of the owner-occupied housing wealth, they also own most of the wealth in investment housing and most non-housing wealth. Figure 51 also highlights the extent to which those baby boomer households (born from 1945 to 1960 and in middle age in 2005-06) who were able to become home owners (most likely in the 1970s or 1980s and no later than the 1990s) have the greatest holdings of all forms of wealth. Households who have not been able to gain access to home ownership have relatively little wealth of any sort.140
139
Source: Yates, J., Housing in Australia in the 2000s: On the agenda too late?, Reserve Bank of Australia, 2011
140 Yates, J., Housing in Australia in the 2000s: On the agenda too late?, Reserve Bank of Australia, 2011

House prices, ownership and affordability: trends in New South Wales
57
Figure 51: Net household worth by age and tenure141
Those who remained renters missed out on the increase in housing wealth that resulted from that boom. This is evident in Figure 52 which shows the change in wealth by home owner group between 2002 and 2010. Both outright and mortgaged home owners had a more than 40 per cent increase in wealth. Renters, on the other hand, only increased their wealth by just over 20 per cent over this period. In absolute terms, the difference is likely to be substantially higher as renters would have come off a lower base than owner-occupier households.
Figure 52: Change in wealth, by home owner group, 2002 to 2010142
141
Source: Yates, J., Housing in Australia in the 2000s: On the agenda too late?, Reserve Bank of Australia, 2011
142 Source: Reserve Bank of Australia, Distribution of household balance sheets, 2013, Statistical Table B22
%
10
20
30
40
50
Home owner -outright
Home owner -mortgage
Renter

NSW Parliamentary Research Service
58
Home ownership rates increase with age up until retirement, after which it falls slightly, with around 30 per cent of 15 to 24 year old household heads owning their own home, rising to a little over 80 per cent for those aged between 55 and 74, before dropping slightly for those aged 75 years and older. The discrepancies in ownership rates by age are also reflected in the change in wealth by age group. Those of the ‘baby-boomer’ generation experienced significantly higher wealth growth between 2002 and 2010 when compared with the younger age groups (Figure 53).
Figure 53: Change in wealth, by age group, 2002 to 2010143
143
Source: Reserve Bank of Australia, Distribution of household balance sheets, 2013, Statistical Table B22
%
20
40
60
80
15-24 25-34 35-44 45-54 55-64 65-74 75 andover
House prices, ownership and affordability: trends in New South Wales
59
7. CONCLUSION
Between 1995 and 2005, real house prices in Australia increased by more than 6 per cent annually.144 Prices in most capital cities stabilised toward the end of the late 2000s but record low interest rates have contributed to strong growth in housing prices over the last 12 months. This price growth has been most pronounced in Sydney where the median established house price has increased by around 15 per cent since December 2011.
While the recent growth has been driven primarily by monetary easing, the long-term growth in housing prices in NSW has been driven through a combination of underlying and structural supply and demand factors. On the demand-side, population, income and employment growth had been particularly strong through the 1990s and early 2000s. Financial deregulation was also a major source of stimulus to the high rate of real house price inflation during the 1990s. The move to a low-inflation environment saw interest rates fall and increased competition among housing lenders has made it easier for many borrowers to obtain loans. This was seen as a structural change that facilitated an increase in housing demand. Sluggish supply responses to these demand shocks are seen to have contributed to an overall housing shortage in NSW which has further exacerbated housing price rises.
The composition of housing demand has also changed significantly over the last two decades, which has resulted in greater competition in the housing market and placed upward pressure on prices. Prior to the late 1980s, housing demand was largely accounted for by owner occupiers. The rapid escalation of prices in the early 1990s, combined with structural tax changes and improved access to credit, saw residential real estate become a highly desirable form of investment. This resulted in unprecedented wealth accumulation and growth in ownership shares for investors through the 1990s and early 2000s. To illustrate, in 1985 investors accounted for only 13 per cent of total housing finance in Australia; as at November 2013, investors accounted for 38.5 per cent of total housing finance.
Prospective home owners are now also competing with foreign investors. Foreign investment in Australian residential real estate has more than tripled since the mid-1990s, increasing from $6.2 billion in 1995-96 to $19.7 billion in 2011-12. In the last two years alone, foreign investment in NSW residential real estate has increased from $2 billion in 2009-10 to $7 billion in 2011-12.
Increased competition from local and foreign investors and the subsequent house price growth in recent years has undermined the affordability of first home ownership in NSW. First home buyers now only account for around 7 per cent of all owner-occupier finance commitments in NSW, which is well below the national average of 14 per cent.
144
Yates, J., Housing in Australia in the 2000s: On the agenda too late?, Reserve Bank of Australia, 2011

NSW Parliamentary Research Service
60
While affordability problems can vary cyclically, house price and household income data suggest there is an underlying structural affordability problem in Australia.145 As evidence, between 1960 and 2006 real house prices increased at an average of 2.7 per cent annually, ahead of 1.9 per cent growth in per household real incomes.146 While various indexes suggest housing affordability improved nationally between 2010 and 2012 (following interest rate easing and stagnant price growth), they remain well down on those levels seen through the late 1980s and 1990s. However, the data and methodological limitations associated with these indexes prevent a complete and localised assessment of affordability. Also, these indexes are not entirely up to date. With interest rates at the bottom of the easing cycle and price growth expected to continue, the affordability problem is unlikely to improve significantly in the next few years.
Lower home ownership rates among younger households and imbalanced wealth distribution between older and younger generations are two of the detrimental outcomes from the sustained decline in affordability since the 1990s. If affordability deteriorates, these outcomes are likely to be even more pronounced in coming years.
The structural nature of the affordability problem means that effective long run solutions to housing affordability lie in addressing the underlying determinants of demand and supply. With continued pressures from population and household income growth, demand is likely to be reduced only by reducing the attractiveness of housing as an investment asset. Richards (2008) suggests that demand side subsidies, such as the untargeted first home owners grant are unlikely to be effective because the expenditure is usually capitalised into higher housing prices which then undermine prospects for future first home buyers once the scheme is removed. On the supply side, Richards (2008) argues that efforts to improve housing affordability should be focused on policies regarding land use and on improving efficiency in the supply of land and housing.147 This sentiment was reinforced by the Productivity Commission (2004):
…there is limited scope for governments to improve affordability for first (and other) home buyers in the short term…However, governments do have an important role to play in facilitating efficient housing outcomes. In particular, policy initiatives to address any structural factors that encourage excessive demand for housing, or that unnecessarily reduce the responsiveness of supply to increases in demand, will reduce “average” house prices over future cycles and could provide enduring affordability benefits to both home buyers and renters.148
145
Yates, J., Australia’s housing affordability crisis, 2011, The Australian Economic Review, Vol. 41, no. 2, pp.200-14
146 Soos, P., Bubbling over: the end of Australia’s $2 trillion housing party, 2011
147 Richards, A., Some observations on the cost of housing in Australia, 2008, Reserve Bank of Australia, Address to Economic and Social Outlook Conference The Melbourne Institute
148 Productivity Commission, First home ownership, 2004, Inquiry Report No. 28