homeland security grant program overview - san … homeland security grant program overview one of...
TRANSCRIPT
U . S . D E P A R T M E N T O F H O M E L A N D S E C U R I T Y
FY 2008 Overview:
Homeland Security Grant Program (HSGP) State Homeland Security Program Tribal (SHSP Tribal)
Nonprofit Security Grant Program (NSGP) Operation Stonegarden (OPSG)
Regional Catastrophic Preparedness Grant Program (RCPGP)
July 25, 2008
Grant Programs Directorate
2
Homeland Security Grant Program Overview
One of the core missions of the Department of Homeland Security (DHS) is to enhance the ability of state, local, and tribal governments to prevent, protect against, respond to, and recover from terrorist attacks and other disasters. FEMA’s comprehensive suite of grant programs are an important part of the administration’s larger, coordinated effort to strengthen homeland security preparedness. These programs implement objectives addressed in a series of post-9/11 laws, strategy documents, plans and Homeland Security Presidential Directives (HSPDs). Five preparedness programs within FEMA’s comprehensive grants portfolio are:
• Homeland Security Grant Program (HSGP) o State Homeland Security Program (SHSP) o Urban Areas Security Initiative (UASI) o Metropolitan Medical Response System o Citizen Corps Program (CCP)
SHSP Supplemental Guidance for Tribal Applicants Nonprofit Security Grant Program (NSGP) Operation Stonegarden Grant Program (OPSG) Regional Catastrophic Planning Grant Program (RCPGP)
Together, these grants may fund a wide range of preparedness activities, to include planning, organization, equipment purchase, training, exercises, and management and administration costs. These five programs support objectives outlined in the National Preparedness Guidelines and related national preparedness doctrine, such as the National Incident Management System, National Response Plan, and the National Infrastructure Protection Plan. All applicants had 90 days to complete the application process. DHS has also created multiple opportunities for applicants to consult with the department’s grant program office and subject matter experts during the review process and prior to the announcement of awards.
3
State Homeland Security Program (SHSP) Total Funding Awarded in FY 2008: $861,280,000 Purpose: This core assistance program provides funds to build capabilities at the state and local levels and to implement the goals and objectives included in state homeland security strategies and initiatives in the State Preparedness Report. Eligibility: Eligible entities for SHSP were all 50 states, the District of Columbia, Puerto Rico, American Samoa, Guam, Northern Mariana Islands, and the U.S. Virgin Islands. Awards: Funds were allocated based on risk analysis and the anticipated effectiveness of proposed investments by the applicants. Funding Minimum: Each state will receive a minimum allocation under SHSP using the thresholds established in the Implementing Recommendations of the 9/11 Act of 2007 (9/11 Act). All 50 states, the District of Columbia, and Puerto Rico will receive 0.375 percent of the total funds allocated for grants under Sections 2003 and 2004 of the Homeland Security Act of 2002 as amended by the 9/11 Act for SHSP and UASI programs. Four territories (American Samoa, Guam, Northern Mariana Islands, and the U.S. Virgin Islands) will receive a minimum allocation of 0.08 percent of the total funds allocated for grants under Sections 2003 and 2004 of the Homeland Security Act of 2002 as amended by the 9/11 Act for SHSP and UASI programs.
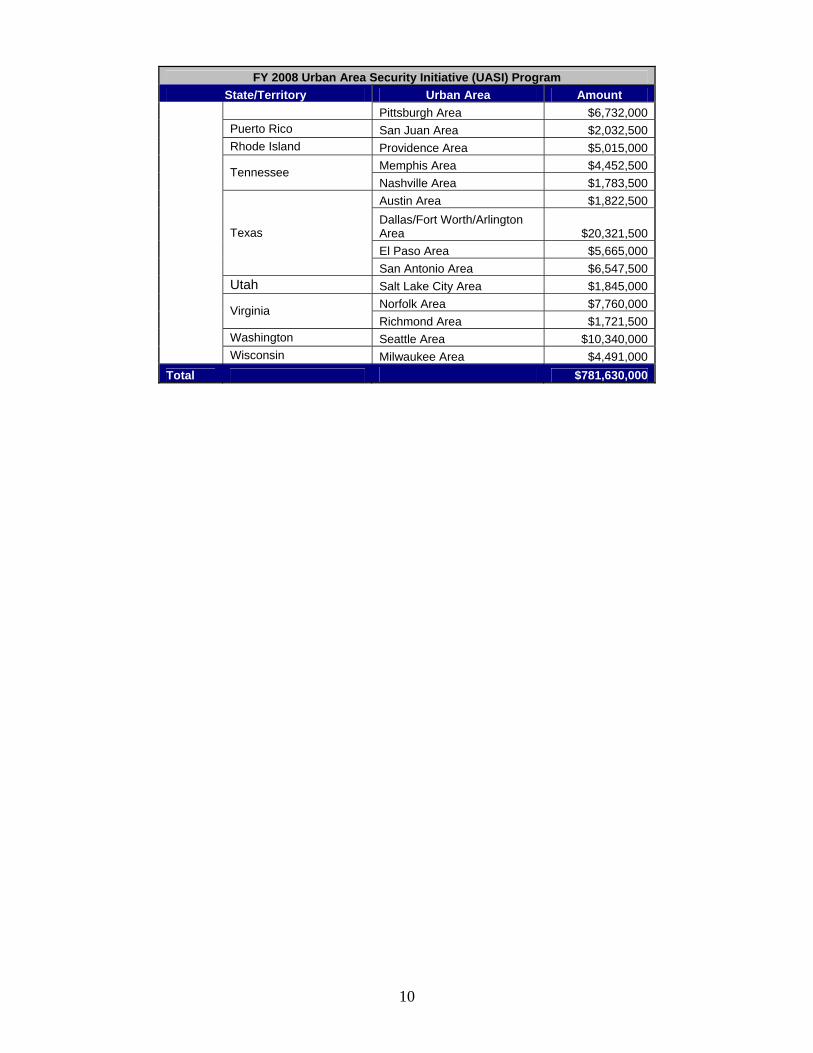
Urban Areas Security Initiative (UASI) Program
Total Funding Awarded in FY 2008: $781,630,000 Purpose: The UASI program focuses on enhancing regional preparedness in major metropolitan areas. The UASI program directly supports the national priority of expanding regional collaboration outlined in the National Preparedness Guidelines, and is intended to assist participating jurisdictions in developing integrated regional systems for emergency prevention, protection, response, and recovery. Eligibility: The sixty highest risk urban areas were eligible for funding under the FY 2008 UASI program. Tiers and Awards: The seven highest risk urban areas, designated Tier 1, competed for approximately $429 million or 55 percent of available funds. The remaining urban areas, designated Tier 2, competed for approximately $351 million or 45 percent of available funds. Funds were allocated based on risk analysis and the anticipated effectiveness of proposed investments by the applicants.
4
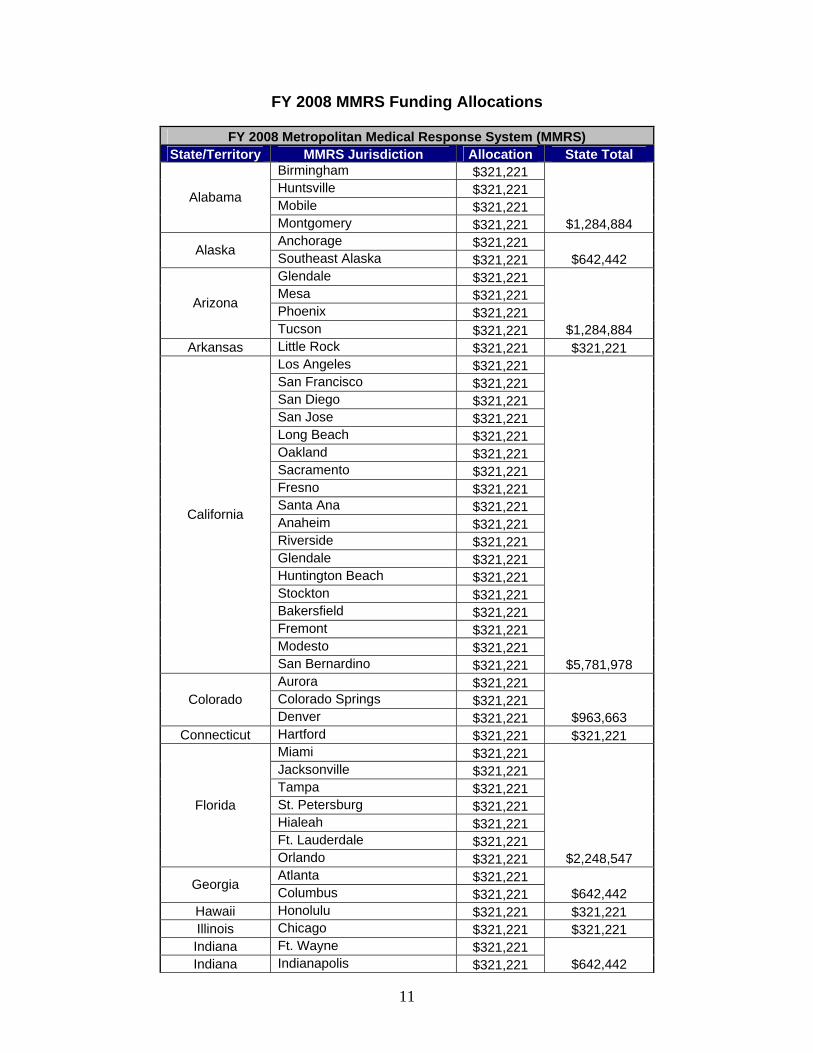
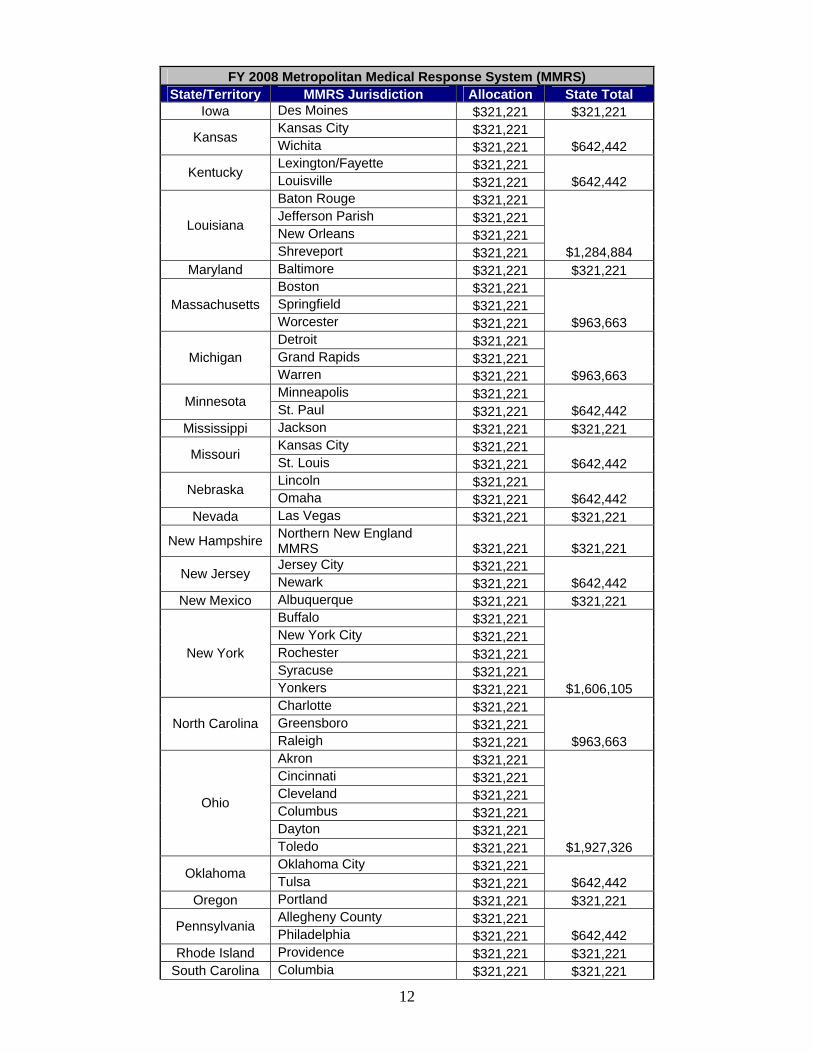
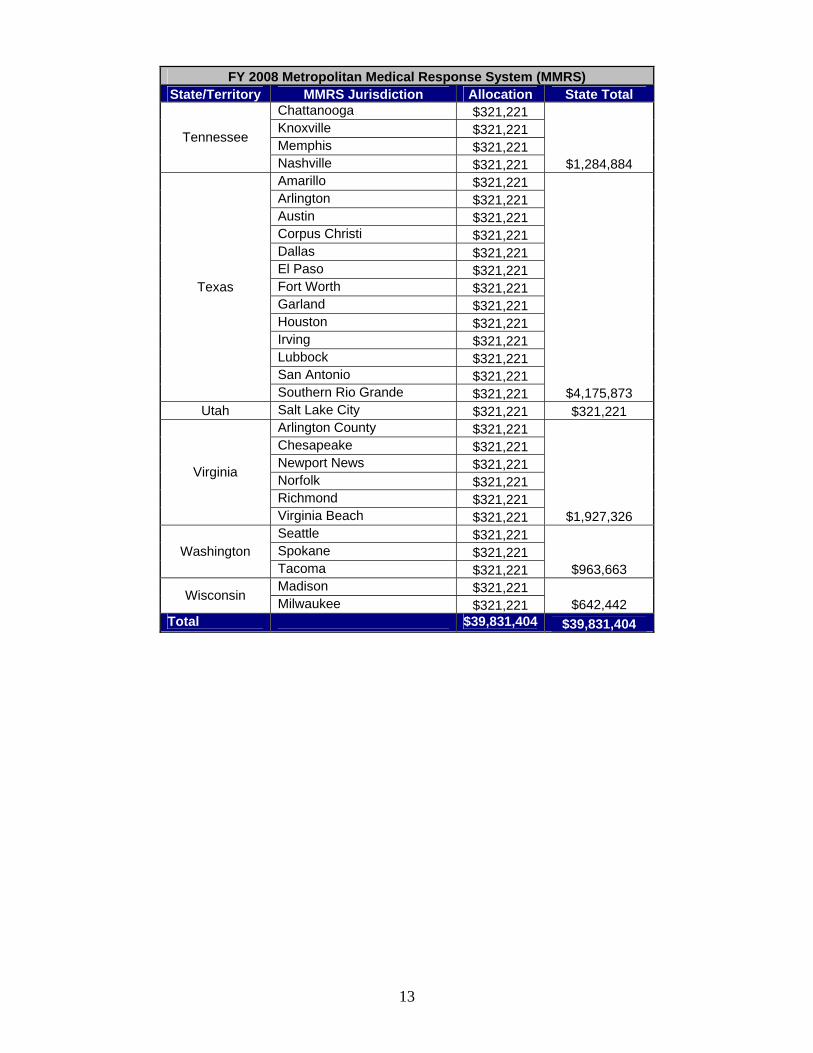
Metropolitan Medical Response System (MMRS) Program
Total Funding Awarded in FY 2008: $39,831,404 Purpose: MMRS funds enable jurisdictions to further enhance and sustain a comprehensive regional mass casualty incident response capability during the first crucial hours of an incident. The program prepares jurisdictions for response to all-hazards mass casualty incidents, including terrorism, naturally occurring events, and large-scale hazardous materials incidents. Eligibility: As with previous years, 124 cities were eligible for MMRS funding. Awards: Each of the 124 MMRS jurisdictions received $321,221 to establish or sustain local capabilities.
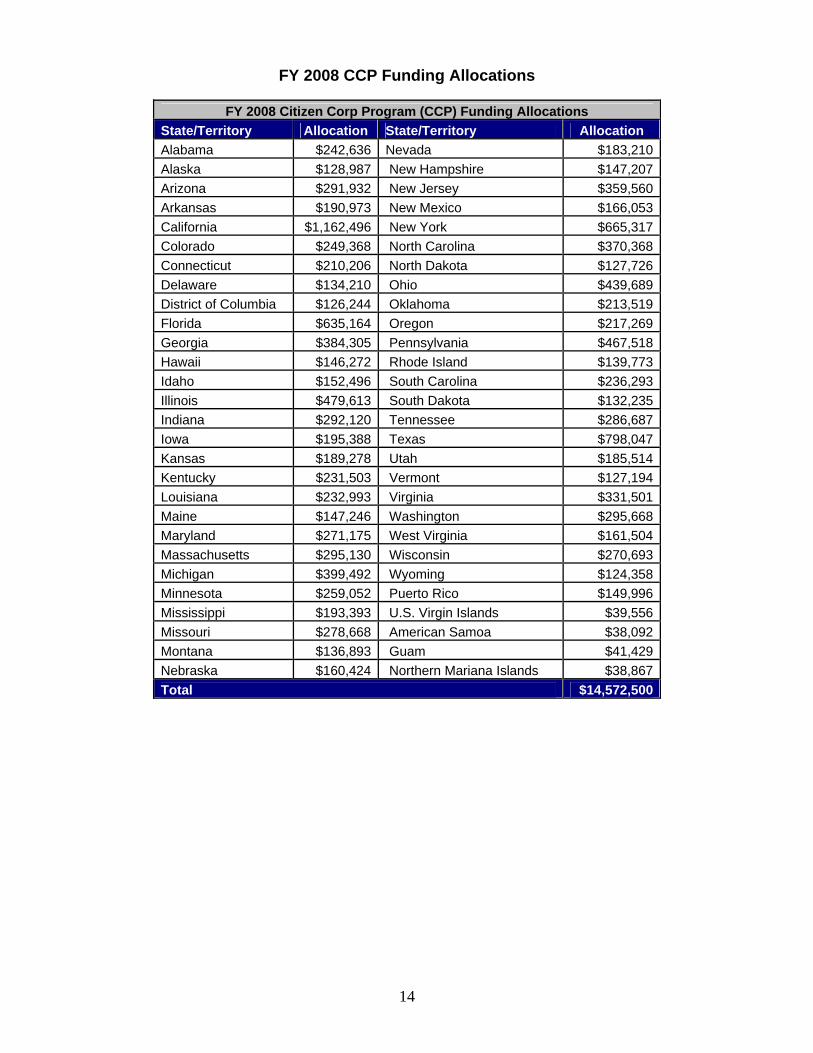
Citizen Corps Program (CCP)
Total Funding Awarded in FY 2008: $14,572,500 Purpose: The Citizen Corps mission is to bring community and government leaders together to coordinate community involvement in emergency preparedness, planning, mitigation, response and recovery. Eligibility: CCP eligibility mirrored that of SHSP: all 50 states, the District of Columbia, Puerto Rico, American Samoa, Guam, Northern Mariana Islands, and the U.S. Virgin Islands. Awards and Funding Minimum: CCP allocations were determined using the USA PATRIOT Act formula, which specifies that all 50 states, the District of Columbia, and Puerto Rico will receive a minimum of 0.75 percent of the total available grant funding, and that four territories (American Samoa, Guam, Northern Mariana Islands, and the U.S. Virgin Islands) will receive a minimum of 0.25 percent of the total available grant funding. The balance of CCP funds were distributed on a population-share basis. In addition to CCP allocations, states and urban areas are encouraged to fully leverage all HSGP resources to accomplish the Citizen Corps mission.
5
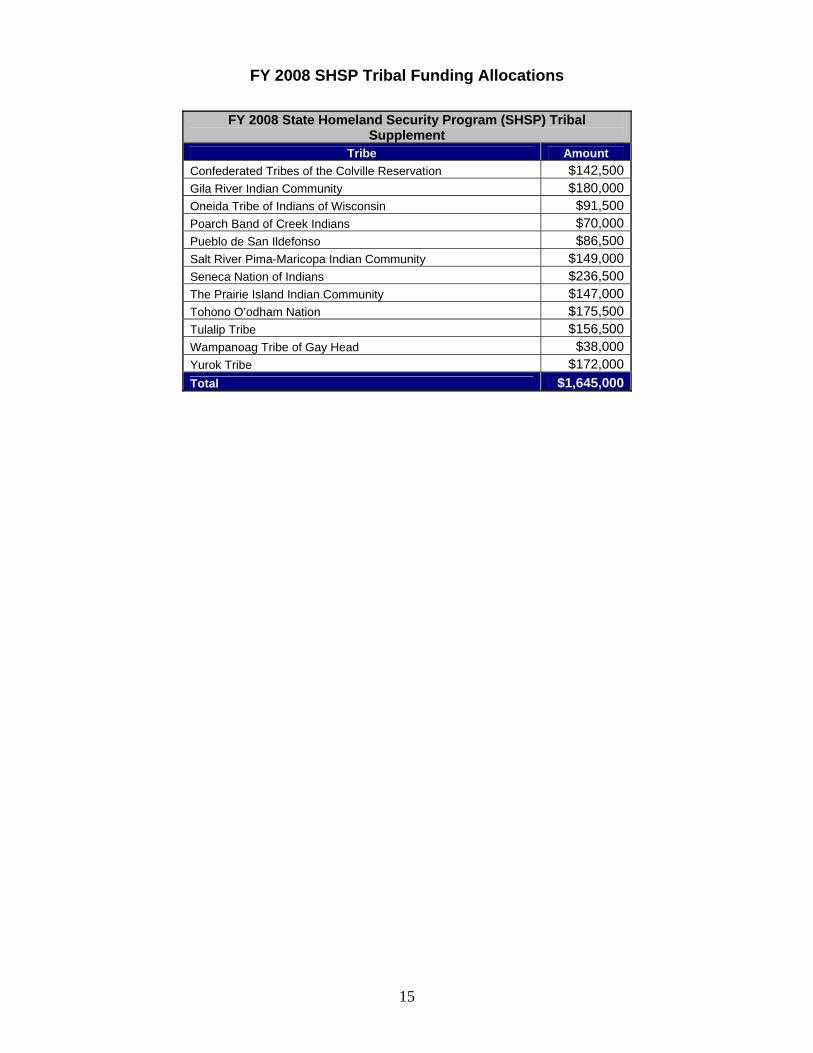
SHSP Supplemental Guidance for Tribal Applicants
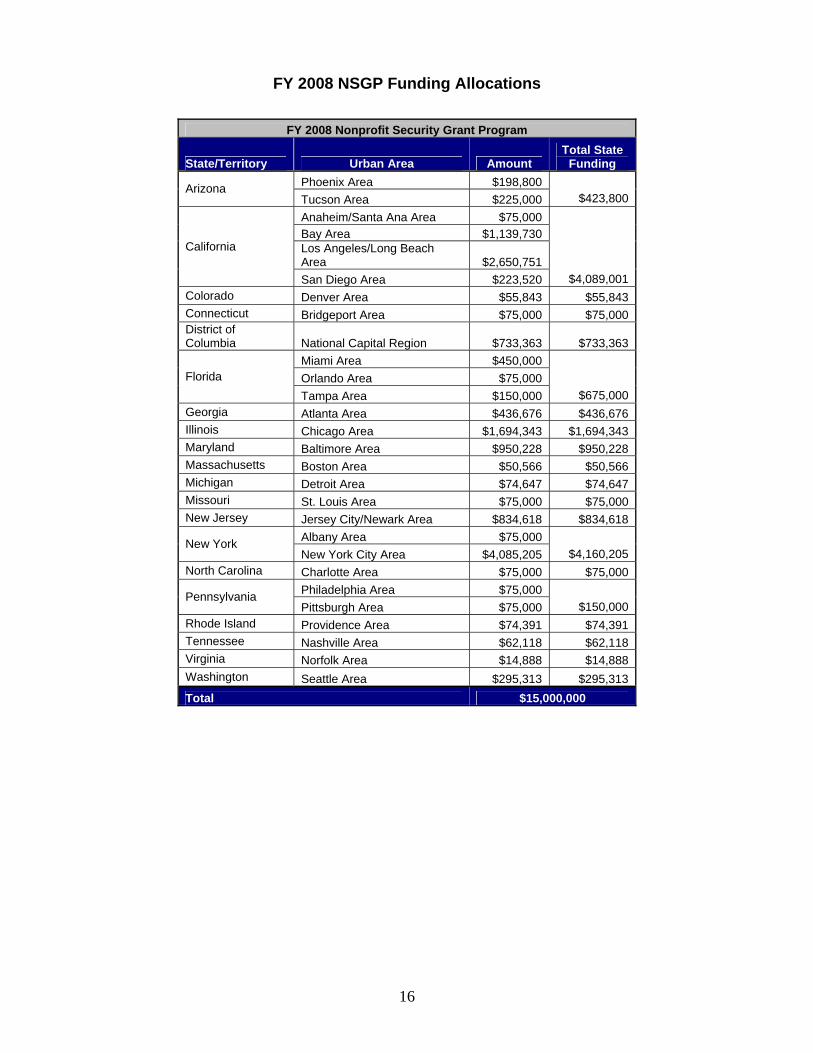
Total Funding Awarded in FY 2008: $1,645,000 Purpose: To provide supplemental funding to directly eligible tribes pursuant to the 9/11 Act, “a directly eligible tribe applying for a grant under section 2004 [SHSP] shall designate an individual to serve as a tribal liaison with [DHS] and other federal, state, local, and regional government officials concerning preventing, preparing for, protecting against, and responding to acts of terrorism.” Eligibility: A “directly eligible tribe” is defined as — ‘‘(A) any Indian tribe— ‘‘(i) that is located in the continental United States; ‘‘(ii) that operates a law enforcement or emergency response agency with the capacity to respond to calls for law enforcement or emergency services; ‘‘(iii)(I) that is located on or near an international border or a coastline bordering an ocean (including the Gulf of Mexico) or international waters; ‘‘(II) that is located within 10 miles of a system or asset included on the prioritized critical infrastructure list established under section 210E(a)(2) or has such a system or asset within its territory; ‘‘(III) that is located within or contiguous to 1 of the 50 most populous metropolitan statistical areas in the United States; or ‘‘(IV) the jurisdiction of which includes not less than 1,000 square miles of Indian country, as that term is defined in section 1151 of title 18, United States Code; and ‘‘(iv) that certifies to the Secretary that a state has not provided funds under section 2003 or 2004 to the Indian tribe or consortium of Indian tribes for the purpose for which direct funding is sought; and ‘‘(B) a consortium of Indian tribes, if each tribe satisfies the requirements of subparagraph (A). Awards: Funds were allocated based on risk analysis and the anticipated effectiveness of proposed investments by the applicants. Urban Areas Security Initiative (UASI) Nonprofit Security Grant Program (NSGP) Total Funding Awarded in FY 2008: $15,000,000 Purpose: UASI NSGP provides funding support for target-hardening activities to nonprofit organizations that are at high risk of international terrorist attack. Eligibility: Eligible nonprofit organizations (as described under section 501(c)(3) of the Internal Revenue Code of 1986 and exempt from tax under section 501(a) of such Code) that are at high risk of international terrorist attack and are located within one of the specific UASI-eligible urban areas. Applicants must also satisfy the eligibility requirements to apply for grants through their State Administrative Agency (SAA). Awards: Funds were allocated based on risk analysis, feasibility, and integration with broader state and local preparedness efforts.
6
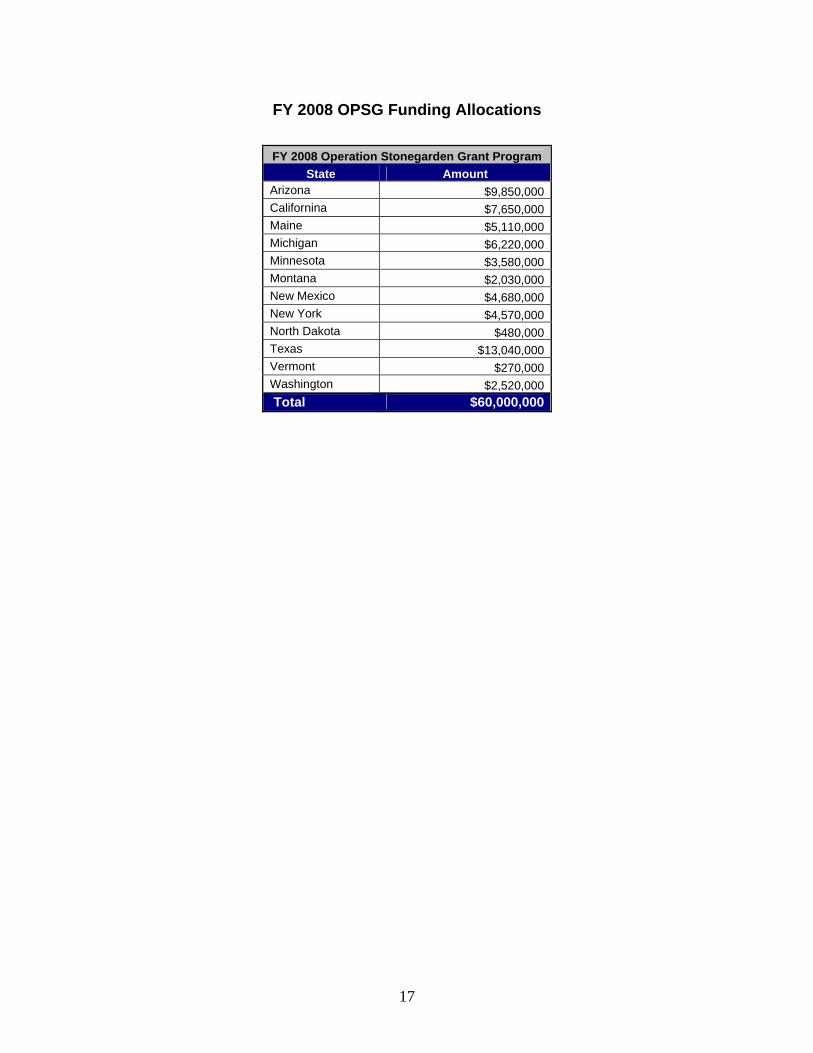
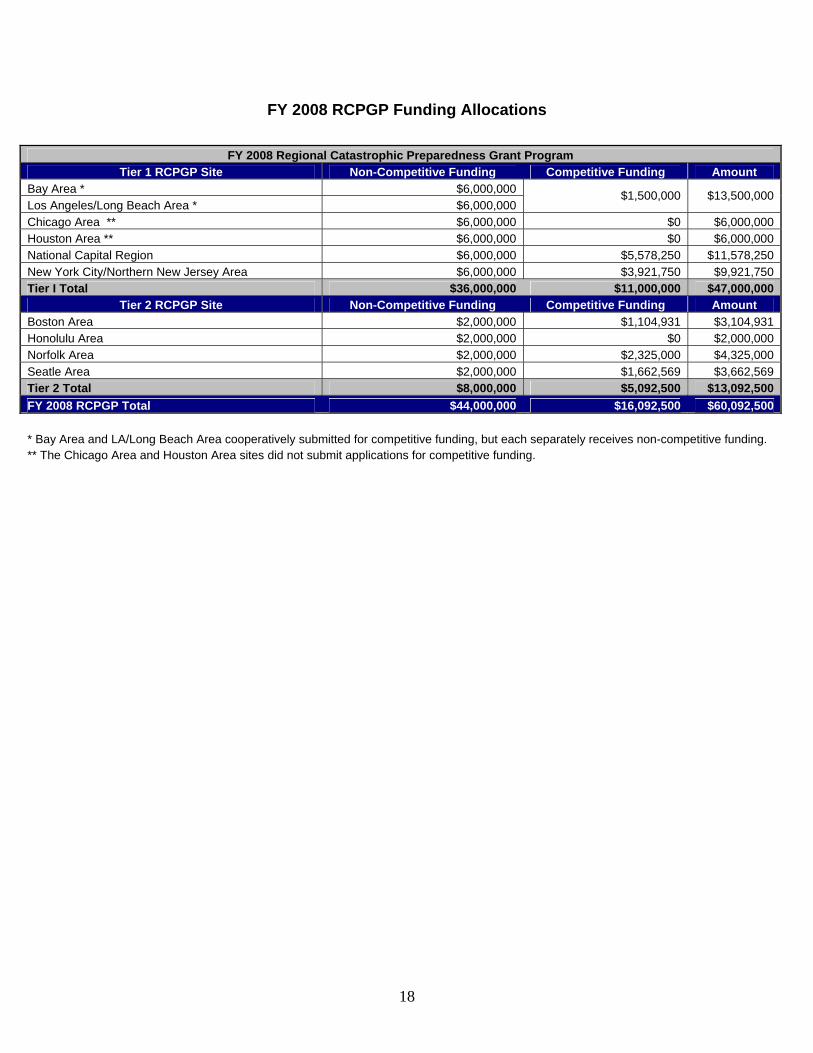
Operation Stonegarden (OPSG) Total Funding Awarded in FY 2008: $60,000,000 Purpose: The intent of OPSG is to enhance law enforcement preparedness and operational readiness along the land borders of the United States. Eligibility: OPSG provides funding to designated localities to enhance cooperation and coordination between local, state and federal law enforcement agencies in a joint mission to secure the nation’s land borders. Local units of government at the county level may apply for funding from DHS through the State Administrative Agency (SAA). Awards: Funds were allocated based on risk analysis and the anticipated feasibility and effectiveness of proposed investments by the applicants. Regional Catastrophic Preparedness Grant Program (RCPGP) Total Funding Awarded in FY 2008: $60,092,500 Purpose: RCPGP provides $60,092,500 to advance catastrophic incident preparedness in Tier 1 and selected Tier 2 UASI urban areas. RCPGP is intended to support coordination of regional all-hazard planning for catastrophic events, including the development of integrated planning communities, plans, protocols, and procedures to manage a catastrophic event. Eligibility: Pursuant to the Consolidated Appropriations Act of 2008 (P.L. 110-161), FY 2007 Tier 1 UASI urban areas were pre-designated as eligible for these allocations. Additionally, DHS selected four (4) Tier 2 UASI urban areas to be representative of the risks, hazards, and operational structures around the nation. These four (4) Tier 2 urban areas include the Boston, Seattle, Norfolk, and Honolulu areas, and were selected based on the criteria requirement of appropriations language to focus on all hazard and catastrophic events. Awards: Funds were allocated based on the risk of a catastrophic incident occurring in the region and the anticipated effectiveness upon completion of the application review process. A portion of the FY 2007 and FY 2008 RCPGP funds ($44 million) was non-competitively awarded, based on UASI Tier. Each of the six Tier 1 sites was awarded $6 million, and each of the four Tier 2 sites was awarded $2 million from the non-competitive grant allocation. A further $11 million was competitively awarded in Tier 1, and $5,092,500 was competitively awarded in Tier 2 based on anticipated effectiveness of the proposed planning projects.

7
FY 2008 SHSP Funding Allocations State Amount
Alabama $11,170,000 Alaska $6,170,000 American Samoa $1,850,000 Arizona $13,400,000 Arkansas $6,170,000 California $110,090,000 Colorado $11,880,000 Connecticut $10,380,000 Delaware $6,170,000 District of Columbia $11,320,000 Florida $37,090,000 Georgia $21,880,000 Guam $1,850,000 Hawaii $6,170,000 Idaho $6,170,000 Illinois $34,960,000 Indiana $12,650,000 Iowa $6,170,000 Kansas $7,530,000 Kentucky $9,590,000 Louisiana $16,110,000 Maine $6,170,000 Maryland $18,000,000 Massachusetts $17,210,000 Michigan $21,430,000 Minnesota $12,260,000 Mississippi $6,180,000 Missouri $11,950,000 Montana $6,170,000 Nebraska $6,170,000 Nevada $9,390,000 New Hampshire $6,170,000 New Jersey $27,780,000 New Mexico $6,170,000 New York $76,500,000 North Carolina $16,280,000 North Dakota $6,170,000 Northern Mariana Islands $1,850,000 Ohio $24,520,000 Oklahoma $7,690,000 Oregon $8,940,000 Pennsylvania $30,310,000 Puerto Rico $6,170,000 Rhode Island $6,170,000
FY 2008 Funding Tables
8
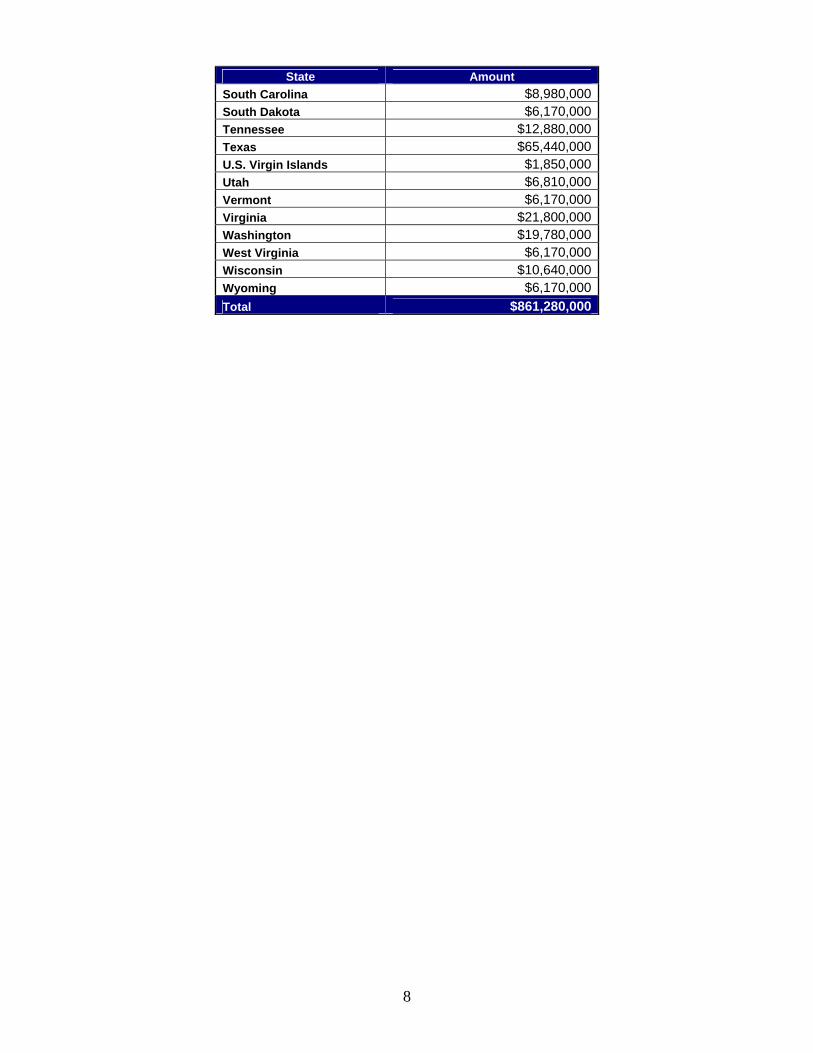
State Amount South Carolina $8,980,000 South Dakota $6,170,000 Tennessee $12,880,000 Texas $65,440,000 U.S. Virgin Islands $1,850,000 Utah $6,810,000 Vermont $6,170,000 Virginia $21,800,000 Washington $19,780,000 West Virginia $6,170,000 Wisconsin $10,640,000 Wyoming $6,170,000 Total $861,280,000
9
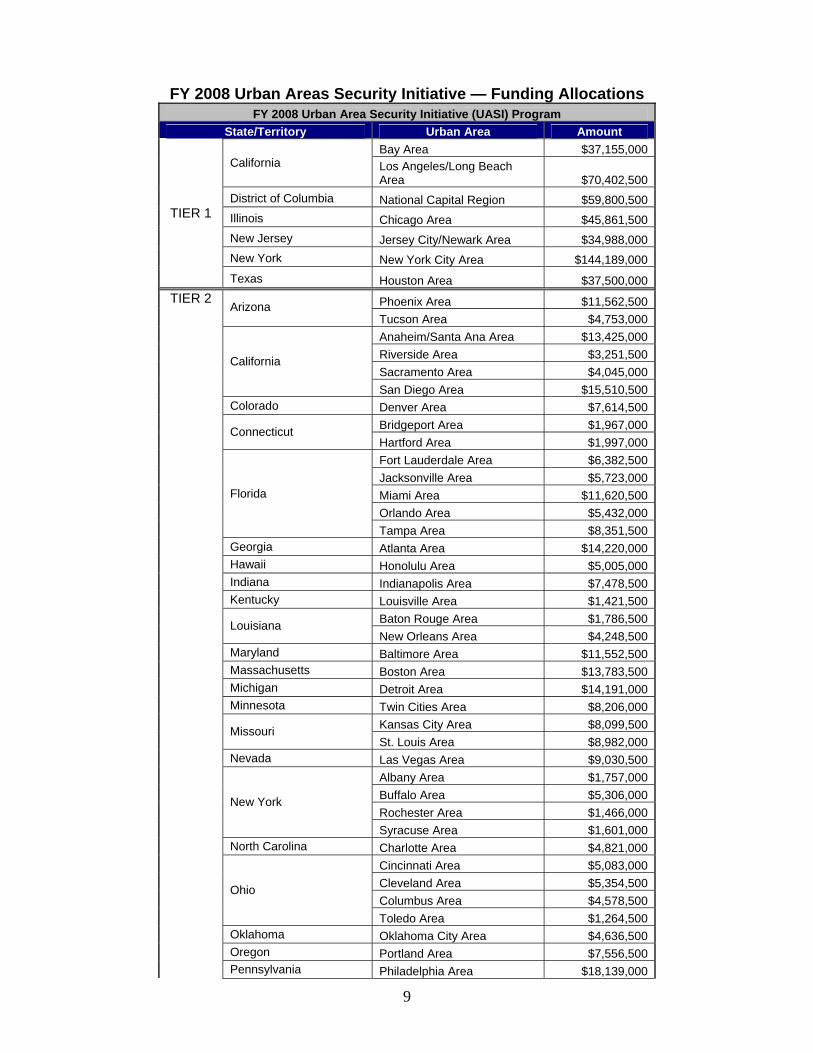
FY 2008 Urban Areas Security Initiative — Funding Allocations
FY 2008 Urban Area Security Initiative (UASI) Program State/Territory Urban Area Amount
Bay Area $37,155,000 California Los Angeles/Long Beach
Area $70,402,500 District of Columbia National Capital Region $59,800,500 Illinois Chicago Area $45,861,500 New Jersey Jersey City/Newark Area $34,988,000 New York New York City Area $144,189,000
TIER 1
Texas Houston Area $37,500,000
Phoenix Area $11,562,500 Arizona Tucson Area $4,753,000 Anaheim/Santa Ana Area $13,425,000 Riverside Area $3,251,500 Sacramento Area $4,045,000
California
San Diego Area $15,510,500 Colorado Denver Area $7,614,500
Bridgeport Area $1,967,000 Connecticut Hartford Area $1,997,000 Fort Lauderdale Area $6,382,500 Jacksonville Area $5,723,000 Miami Area $11,620,500 Orlando Area $5,432,000
Florida
Tampa Area $8,351,500 Georgia Atlanta Area $14,220,000 Hawaii Honolulu Area $5,005,000 Indiana Indianapolis Area $7,478,500 Kentucky Louisville Area $1,421,500
Baton Rouge Area $1,786,500 Louisiana New Orleans Area $4,248,500
Maryland Baltimore Area $11,552,500 Massachusetts Boston Area $13,783,500 Michigan Detroit Area $14,191,000 Minnesota Twin Cities Area $8,206,000
Kansas City Area $8,099,500 Missouri St. Louis Area $8,982,000
Nevada Las Vegas Area $9,030,500 Albany Area $1,757,000 Buffalo Area $5,306,000 Rochester Area $1,466,000
New York
Syracuse Area $1,601,000 North Carolina Charlotte Area $4,821,000
Cincinnati Area $5,083,000 Cleveland Area $5,354,500 Columbus Area $4,578,500
Ohio
Toledo Area $1,264,500 Oklahoma Oklahoma City Area $4,636,500 Oregon Portland Area $7,556,500
TIER 2
Pennsylvania Philadelphia Area $18,139,000
10
FY 2008 Urban Area Security Initiative (UASI) Program State/Territory Urban Area Amount
Pittsburgh Area $6,732,000 Puerto Rico San Juan Area $2,032,500 Rhode Island Providence Area $5,015,000
Memphis Area $4,452,500 Tennessee Nashville Area $1,783,500 Austin Area $1,822,500 Dallas/Fort Worth/Arlington Area $20,321,500 El Paso Area $5,665,000
Texas
San Antonio Area $6,547,500 Utah Salt Lake City Area $1,845,000
Norfolk Area $7,760,000 Virginia Richmond Area $1,721,500
Washington Seattle Area $10,340,000 Wisconsin Milwaukee Area $4,491,000
Total $781,630,000
11
FY 2008 MMRS Funding Allocations
FY 2008 Metropolitan Medical Response System (MMRS)
State/Territory MMRS Jurisdiction Allocation State Total Birmingham $321,221 Huntsville $321,221 Mobile $321,221
Alabama
Montgomery $321,221 $1,284,884 Anchorage $321,221 Alaska Southeast Alaska $321,221 $642,442 Glendale $321,221 Mesa $321,221 Phoenix $321,221
Arizona
Tucson $321,221 $1,284,884 Arkansas Little Rock $321,221 $321,221
Los Angeles $321,221 San Francisco $321,221 San Diego $321,221 San Jose $321,221 Long Beach $321,221 Oakland $321,221 Sacramento $321,221 Fresno $321,221 Santa Ana $321,221 Anaheim $321,221 Riverside $321,221 Glendale $321,221 Huntington Beach $321,221 Stockton $321,221 Bakersfield $321,221 Fremont $321,221 Modesto $321,221
California
San Bernardino $321,221 $5,781,978 Aurora $321,221 Colorado Springs $321,221 Colorado Denver $321,221 $963,663
Connecticut Hartford $321,221 $321,221 Miami $321,221 Jacksonville $321,221 Tampa $321,221 St. Petersburg $321,221 Hialeah $321,221 Ft. Lauderdale $321,221
Florida
Orlando $321,221 $2,248,547 Atlanta $321,221 Georgia Columbus $321,221 $642,442
Hawaii Honolulu $321,221 $321,221 Illinois Chicago $321,221 $321,221 Indiana Ft. Wayne $321,221 Indiana Indianapolis $321,221 $642,442
12
FY 2008 Metropolitan Medical Response System (MMRS) State/Territory MMRS Jurisdiction Allocation State Total
Iowa Des Moines $321,221 $321,221Kansas City $321,221 Kansas Wichita $321,221 $642,442 Lexington/Fayette $321,221 Kentucky Louisville $321,221 $642,442 Baton Rouge $321,221 Jefferson Parish $321,221 New Orleans $321,221
Louisiana
Shreveport $321,221 $1,284,884 Maryland Baltimore $321,221 $321,221
Boston $321,221 Springfield $321,221 Massachusetts Worcester $321,221 $963,663 Detroit $321,221 Grand Rapids $321,221 Michigan Warren $321,221 $963,663 Minneapolis $321,221 Minnesota St. Paul $321,221 $642,442
Mississippi Jackson $321,221 $321,221Kansas City $321,221 Missouri St. Louis $321,221 $642,442 Lincoln $321,221 Nebraska Omaha $321,221 $642,442
Nevada Las Vegas $321,221 $321,221
New Hampshire Northern New England MMRS $321,221 $321,221 Jersey City $321,221 New Jersey Newark $321,221 $642,442
New Mexico Albuquerque $321,221 $321,221Buffalo $321,221 New York City $321,221 Rochester $321,221 Syracuse $321,221
New York
Yonkers $321,221 $1,606,105 Charlotte $321,221 Greensboro $321,221 North Carolina Raleigh $321,221 $963,663 Akron $321,221 Cincinnati $321,221 Cleveland $321,221 Columbus $321,221 Dayton $321,221
Ohio
Toledo $321,221 $1,927,326 Oklahoma City $321,221 Oklahoma Tulsa $321,221 $642,442
Oregon Portland $321,221 $321,221Allegheny County $321,221 Pennsylvania Philadelphia $321,221 $642,442
Rhode Island Providence $321,221 $321,221South Carolina Columbia $321,221 $321,221
13
FY 2008 Metropolitan Medical Response System (MMRS) State/Territory MMRS Jurisdiction Allocation State Total
Chattanooga $321,221 Knoxville $321,221 Memphis $321,221
Tennessee
Nashville $321,221 $1,284,884 Amarillo $321,221 Arlington $321,221 Austin $321,221 Corpus Christi $321,221 Dallas $321,221 El Paso $321,221 Fort Worth $321,221 Garland $321,221 Houston $321,221 Irving $321,221 Lubbock $321,221 San Antonio $321,221
Texas
Southern Rio Grande $321,221 $4,175,873 Utah Salt Lake City $321,221 $321,221
Arlington County $321,221 Chesapeake $321,221 Newport News $321,221 Norfolk $321,221 Richmond $321,221
Virginia
Virginia Beach $321,221 $1,927,326 Seattle $321,221 Spokane $321,221 Washington Tacoma $321,221 $963,663 Madison $321,221 Wisconsin Milwaukee $321,221 $642,442
Total $39,831,404 $39,831,404
14
FY 2008 CCP Funding Allocations
FY 2008 Citizen Corp Program (CCP) Funding Allocations State/Territory Allocation State/Territory Allocation Alabama $242,636 Nevada $183,210 Alaska $128,987 New Hampshire $147,207 Arizona $291,932 New Jersey $359,560 Arkansas $190,973 New Mexico $166,053 California $1,162,496 New York $665,317 Colorado $249,368 North Carolina $370,368 Connecticut $210,206 North Dakota $127,726 Delaware $134,210 Ohio $439,689 District of Columbia $126,244 Oklahoma $213,519 Florida $635,164 Oregon $217,269 Georgia $384,305 Pennsylvania $467,518 Hawaii $146,272 Rhode Island $139,773 Idaho $152,496 South Carolina $236,293 Illinois $479,613 South Dakota $132,235 Indiana $292,120 Tennessee $286,687 Iowa $195,388 Texas $798,047 Kansas $189,278 Utah $185,514 Kentucky $231,503 Vermont $127,194 Louisiana $232,993 Virginia $331,501 Maine $147,246 Washington $295,668 Maryland $271,175 West Virginia $161,504 Massachusetts $295,130 Wisconsin $270,693 Michigan $399,492 Wyoming $124,358 Minnesota $259,052 Puerto Rico $149,996 Mississippi $193,393 U.S. Virgin Islands $39,556 Missouri $278,668 American Samoa $38,092 Montana $136,893 Guam $41,429 Nebraska $160,424 Northern Mariana Islands $38,867 Total $14,572,500
15
FY 2008 SHSP Tribal Funding Allocations
FY 2008 State Homeland Security Program (SHSP) Tribal Supplement
Tribe Amount Confederated Tribes of the Colville Reservation $142,500 Gila River Indian Community $180,000 Oneida Tribe of Indians of Wisconsin $91,500 Poarch Band of Creek Indians $70,000 Pueblo de San Ildefonso $86,500 Salt River Pima-Maricopa Indian Community $149,000 Seneca Nation of Indians $236,500 The Prairie Island Indian Community $147,000 Tohono O’odham Nation $175,500 Tulalip Tribe $156,500 Wampanoag Tribe of Gay Head $38,000 Yurok Tribe $172,000 Total $1,645,000
16
FY 2008 NSGP Funding Allocations
FY 2008 Nonprofit Security Grant Program
State/Territory Urban Area Amount Total State
Funding Phoenix Area $198,800 Arizona Tucson Area $225,000 $423,800 Anaheim/Santa Ana Area $75,000 Bay Area $1,139,730 Los Angeles/Long Beach Area $2,650,751
California
San Diego Area $223,520 $4,089,001 Colorado Denver Area $55,843 $55,843 Connecticut Bridgeport Area $75,000 $75,000 District of Columbia National Capital Region $733,363 $733,363
Miami Area $450,000 Orlando Area $75,000 Florida Tampa Area $150,000 $675,000
Georgia Atlanta Area $436,676 $436,676 Illinois Chicago Area $1,694,343 $1,694,343 Maryland Baltimore Area $950,228 $950,228 Massachusetts Boston Area $50,566 $50,566 Michigan Detroit Area $74,647 $74,647 Missouri St. Louis Area $75,000 $75,000 New Jersey Jersey City/Newark Area $834,618 $834,618
Albany Area $75,000 New York New York City Area $4,085,205 $4,160,205
North Carolina Charlotte Area $75,000 $75,000 Philadelphia Area $75,000 Pennsylvania Pittsburgh Area $75,000 $150,000
Rhode Island Providence Area $74,391 $74,391 Tennessee Nashville Area $62,118 $62,118 Virginia Norfolk Area $14,888 $14,888 Washington Seattle Area $295,313 $295,313 Total $15,000,000
17
FY 2008 OPSG Funding Allocations
FY 2008 Operation Stonegarden Grant Program State Amount
Arizona $9,850,000Californina $7,650,000Maine $5,110,000Michigan $6,220,000Minnesota $3,580,000Montana $2,030,000New Mexico $4,680,000New York $4,570,000North Dakota $480,000Texas $13,040,000Vermont $270,000Washington $2,520,000 Total $60,000,000
18
FY 2008 RCPGP Funding Allocations
FY 2008 Regional Catastrophic Preparedness Grant Program Tier 1 RCPGP Site Non-Competitive Funding Competitive Funding Amount
Bay Area * $6,000,000 Los Angeles/Long Beach Area * $6,000,000
$1,500,000 $13,500,000
Chicago Area ** $6,000,000 $0 $6,000,000Houston Area ** $6,000,000 $0 $6,000,000National Capital Region $6,000,000 $5,578,250 $11,578,250New York City/Northern New Jersey Area $6,000,000 $3,921,750 $9,921,750Tier I Total $36,000,000 $11,000,000 $47,000,000
Tier 2 RCPGP Site Non-Competitive Funding Competitive Funding Amount Boston Area $2,000,000 $1,104,931 $3,104,931Honolulu Area $2,000,000 $0 $2,000,000Norfolk Area $2,000,000 $2,325,000 $4,325,000Seatle Area $2,000,000 $1,662,569 $3,662,569Tier 2 Total $8,000,000 $5,092,500 $13,092,500FY 2008 RCPGP Total $44,000,000 $16,092,500 $60,092,500 * Bay Area and LA/Long Beach Area cooperatively submitted for competitive funding, but each separately receives non-competitive funding. ** The Chicago Area and Houston Area sites did not submit applications for competitive funding.