highly-sensitive organophosphorous pesticide biosensors based on nanostructured films of...
TRANSCRIPT
S
Hn
Za
b
a
ARRAA
KOPQEL
1
teuasdthl1tda
ctopa
(
0d
Biosensors and Bioelectronics 26 (2011) 3081–3085
Contents lists available at ScienceDirect
Biosensors and Bioelectronics
journa l homepage: www.e lsev ier .com/ locate /b ios
hort communication
ighly-sensitive organophosphorous pesticide biosensors based onanostructured films of acetylcholinesterase and CdTe quantum dots
haozhu Zhenga, Yunlong Zhoub, Xinyu Lia, Shaoqin Liua,∗, Zhiyong Tangb,∗
Key Laboratory of Microsystems and Microstructures Manufacturing, Ministry of Education, Harbin Institute of Technology, Harbin 150080, ChinaNational Center for Nanoscience and Technology, Beijing 100090, China
r t i c l e i n f o
rticle history:eceived 21 September 2010eceived in revised form 7 December 2010ccepted 12 December 2010vailable online 17 December 2010
a b s t r a c t
The optical transducer of CdTe semiconductor quantum dots (QDs) has been integrated with acetyl-cholinesterase enzyme (AChE) by the layer-by-layer (LbL) assembly technique, resulting in a highlysensitive biosensor for detection of organophosphorus pesticides (OPs) in vegetables and fruits based onenzyme inhibition mechanism. The detection limits of the proposed biosensors are as low as 1.05 × 10⁻¹¹
−12
eywords:ptical biosensoresticide detectionuantum dotsnzyme biosensor
M for paraoxon and 4.47 × 10 M for parathion, which are significantly better than those of the con-ventional GC/MS methods or amperometric biosensors (0.5 nM). These biosensors are used for quickdetermination of low concentrations of OPs in real vegetable and fruit samples and exhibit satisfactoryreproducibility and accuracy. Moreover, the stock stability of the biosensors are very good due to thestabilizing environment for the enzyme in the nanostructures made by LbL technique. Many advantagesprovided by these biosensors, like fluorescent change recognized by naked eyes and mass production
te fu
ayer-by-layer assembly with low cost, will facilita. Introduction
Organophosphorus pesticides (OPs) are the most popular insec-icides in use today due to their high efficiency for insectlimination, easy synthesis, and low cost. Due to the widespreadse of OPs, their residues have been frequently found in soil,tmosphere, groundwater, as well as agricultural products. Thetatistical data of the Pesticide Data Program published in 2005emonstrated that overall 73% of fresh fruits and vegetables con-ained the detectable residues (USDA, 2005). The residues areighly toxic substances that have been found to cause serious prob-
ems to human health even at very low concentrations (Heath,997). In order to avoid possible harm to humans and animals,here is an increasing need to develop fast and sensitive methods foretecting low concentrations of OPs in the daily-consumed foodsnd drinking water.
Currently, detection of OPs is performed under laboratoryonditions with the assistance of expensive instruments and
rained personnel. To circumvent these issues, simple meth-ds were proposed to realize quick and sensitive detection ofesticides by taking advantage of the inhibition mechanism ofcetylcholinesterase enzyme (AChE) using different configurations∗ Corresponding authors. Tel.: +86 451 86403493; fax: +86 451 86403483.E-mail addresses: [email protected], [email protected]
S. Liu), [email protected] (Z. Tang).
956-5663/$ – see front matter © 2010 Elsevier B.V. All rights reserved.oi:10.1016/j.bios.2010.12.021
ture development of rapid and high-throughput screening of OPs.© 2010 Elsevier B.V. All rights reserved.
and transduction technologies, such as electrochemistry (Kok andHasirci, 2004; Schulze et al., 2003; Joshi et al., 2005), field-effecttransistors (Ristori et al., 1996; Singh et al., 1999), fluorescence(Diaz and Peinado, 1997; Tsai and Doong, 2005; Vamvakaki andChaniotakis, 2007; Constantine et al., 2003; Ji et al., 2005; Li andQu, 2007) or colorimetric probes (Andreou and Clonis, 2002; Andresand Narayanaswamy, 1997; Wong et al., 2006; Xavier et al., 2000).All these methods proved to be sensitive, portable, easy to use,and capable of providing reliable analytical information, especiallywhen used in measurement of water samples. However, to the bestof our knowledge, until now there has been no report on detectionof OP in real food sample like fruits and vegetables using biosen-sors. It is easily understood that foods themselves contain manyinterferents, e.g., redox and chromatic substances, for both electri-cal and optical transduction. Hence, to apply the biosensors to OPs’determination in real fruits and vegetables remains a big challenge.
In this study, we report a highly sensitive optical biosensor forthe detection of OPs in foods and water. The biosensor is composedof nanostructured multilayers of the enzyme AChE and photolu-minescent (PL) CdTe QDs, and fabricated using the layer-by-layer(LbL) assembly technique (Scheme S1). The LbL technique is anenvironment-friendly method and ideal for cost efficient mass
production (Decher, 1997; Podsiadlo et al., 2007), being a veryattractive and powerful technology for development of biosen-sors (Li et al., 2009; Yu et al., 2005). Our results demonstrate thatthis proposed biosensor can be applied to determine low con-centrations of OPs in real vegetable and fruit samples, and the
3 Bioele
dn
2
2
(EipcppQi
Cwcsw(sei
2
PtodNw7bbepattOmaticatt
2
s8fssrci
082 Z. Zheng et al. / Biosensors and
emonstrated detection limits of the developed biosensors are sig-ificantly better than those of reported biosensor so far.
. Materials and methods
.1. Materials and methods
Cd(ClO4)2·6H2O, Al2Te3 powders, and mercaptopropionic acidMPA) were purchased from Alfa Aesar. AChE (EC 3.1.1.7 from. electricus, lyophilized, specific activity 435 U/mg), acetylth-ocholine, sodium polystyrenesulfonate (PSS, MW 70,000), andoly(allylamine hydrochloride) (PAH, MW 8000–11,000) were pur-hased from Sigma-Aldrich. The standard samples of paraoxon,arathion, dichlorvos, and omethoate (100 �g/mL in acetone) wereurchased from Weiyekechuang Keji CO. Negatively-charged CdTeDs with PL peaks at 585 nm and 592 nm were synthesized accord-
ng to our previous report (Li et al., 2009).The UV–vis absorption spectra were measured using a Varian
ary 4000 UV–vis spectrometer, and the PL spectra were recordedith a Cary Eclipse fluorescence spectrophotometer. If not specifi-
ally stated, the samples were excited at 380 nm, and the excitinglit and the emission slit were both 5 nm. Static water contact anglesere obtained with a contact angle and surface tension meter
CAM101, KSV). The gas chromatography in combination with masspectrometry (GC/MS) analysis was performed on an Agilent 7890Aquipped with a MSD 5975 mass spectrometer and a split/splitlessnjector.
.2. Fabrication of the proposed biosensors
Quartz or glass was used as the substrates and cleaned withiraha solution [Caution! Piraha solution is highly corrosive andoxic]. Scheme S1 showed a scheme of the fabrication processf biosensors: (1) The PAH/QD multilayers were alternativelyeposited from 1 mg/mL PAH aqueous solutions (pH 7.5, 0.5 MaCl) and as-prepared QD solution; (2) three bilayers of PAH/PSSere deposited from 1 mg/mL PAH and PSS aqueous solution (pH
.5, 0.5 M NaCl), each for 5 min. These three bilayers of PAH/PSSehaved like selective channels (Clark et al., 1997; Liu et al., 2002),ecause only small molecules rather than large molecules such asnzymes could transport in or out the underlying PAH/QD and avoidossible influences of the AChE-catalyzed hydrolysis reaction ofcetylthiocholine on the structures of PAH/QD multilayers; (3) athe end, capping PAH/AChE multilayers were deposited on top ofhe (PAH/CdTe)x(PAH/PSS)3, which would contact and react withPs and acetylthiocholine in solution. In order to enhance the per-eability to OPs and the substrate, the PAH solution without NaCl
nd 0.5 mg/mL AChE in 20 mM of PBS were used for fabrication ofhe capping multilayers. The pH of PBS solution was 8.0 and thesoelectric point of AChE was 4.5, so the enzyme was negativelyharged in PBS solution. The electrostatic interaction between PAHnd AChE provided a biocompatible nano-environment in the filmo encapsulate the water-soluble enzymes, which greatly improvedheir stability against unfolding, denaturation, and dilution effects.
.3. OP detection
The procedure for OP detection was as follows: (1) the biosen-or was first incubated with 3.0 mL of the PBS solution (20 mM, pH.0, 2 mM Mg2+) containing different concentrations of pesticideor 15 min; (2) 4 mM acetylthiocholine was added to above stirred
olution and the PL signal was monitored over time; (3) the mea-urements were repeated 6 times for each concentration, and theelationship between the percentage enzyme inhibition and the OPoncentration was plotted as a calibration curve, which was usedn detection of OP in the real vegetable samples.ctronics 26 (2011) 3081–3085
2.4. OP detection in real vegetable/fruit samples
The procedure for OP determination in vegetable samples wasas follows: (1) the vegetable/fruit sample was first chopped andextracted with 20 mL PBS; (2) the biosensor was incubated with theextracted solution at 38 ◦C for 15 min; (3) after being rinsed withPBS and dried under N2 flow, the PL spectrum of the biosensor wasmeasured in PBS solution; (4) finally, 4 mM acetylthiocholine wasinjected in the mixed solution and the kinetic measurements of PLat 592 nm were recorded. The decrease rates of PL after incubationwith fruit or vegetable samples were compared with the calibrationcurve, and the OP concentration in the real sample was obtained.
The accuracy of the proposed biosensor in this study was com-pared with GC/MS. GC/MS measurement followed the procedurefor the modified AOAC Official Method 985.22 (see Part S1 inSupporting Information).
3. Results and discussion
3.1. Fabrication of PAH/CdTe QDs/AChE nanostructured film withgood response to acetylthiocholine
The PAH/CdTe QDs/AChE nanostructured film was fabricated byLbL technique. The LbL assembly process of PAH and QDs was moni-tored by the signal increase in both UV–vis absorption spectroscopy(not shown) and PL spectroscopy (Fig. S1 in Supporting Informa-tion). Both the absorbance shoulder at 530 nm and PL intensity at585 nm of (PAH/CdTe QDs)x multilayers increase linearly with thenumber of bilayers, x, which confirm irreversible adsorption andregular layer growth of PAH and QDs on the substrate. The devia-tion from linear behavior for the initial bilayers can be explainedby incomplete coverage of QDs and partial filling of the polyelec-trolyte into the empty space between QDs during the early stage ofLbL deposition (Jiang et al., 2004).
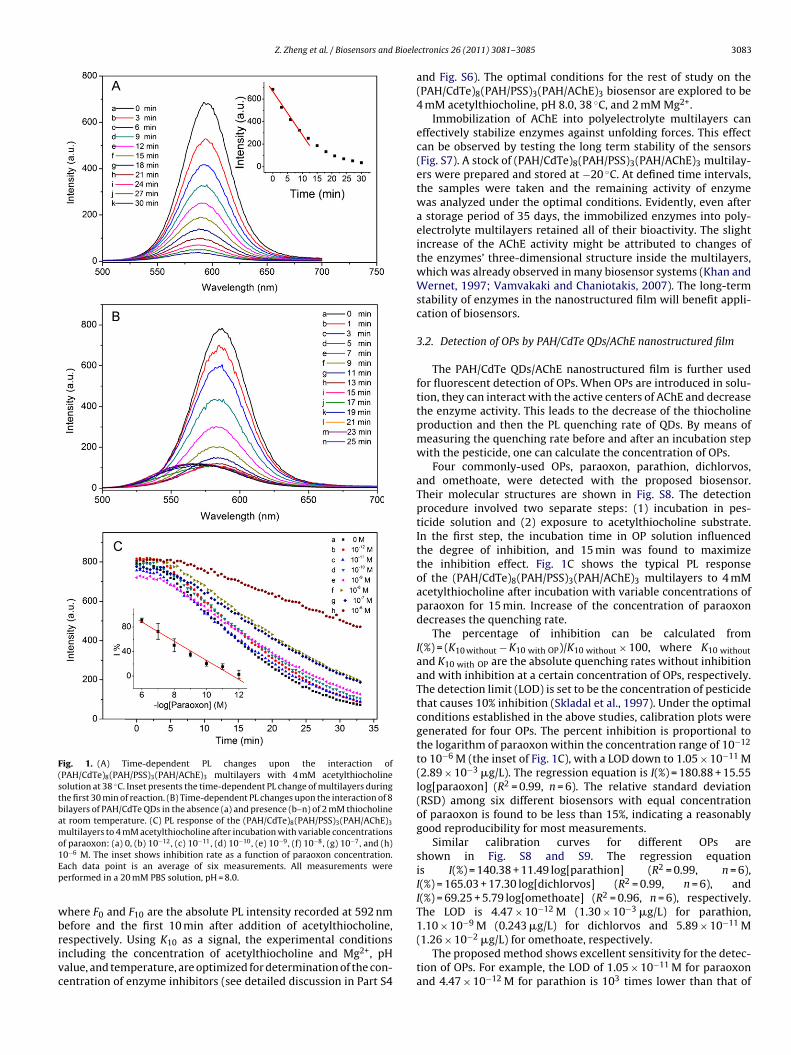
Fig. 1A depicts the PL spectra of (PAH/CdTe)8(PAH/PSS)3(PAH/AChE)3 multilayers before (curve a) and afterexposure to 4 mM acetylthiocholine (curves b–k). Before additionof acetylthiocholine, the PAH/CdTe QDs multilayer has a strong PLpeak at 592 nm. It is noticed that the PL signal of the PAH/CdTeQDs multilayer in PBS solution increases to almost 3 times thatin air (Fig. S2). The increase of the PL signal of the PAH/CdTeQDs multilayer in PBS solution is possibly due to the adsorbedwater molecules on the surface of QDs, which act to passivatesurface traps and increase the luminescence efficiency (Corderoet al., 2000). After addition of acetylthiocholine, the PL intensityat 592 nm initially decreases linearly with time (inset in Fig. 1A).When a certain period of time (ca. 10 min) has elapsed, the rateof decrease gradually becomes smaller and finally reaches zero.Control experiments reveal that addition of acetylthiocholine doesnot yield any obvious PL change in the (PAH/CdTe)8(PAH/PSS)3multilayer (Fig. S3). As comparison, thiocholine can quench PLof (PAH/CdTe)8(PAH/PSS)3 multilayer (Fig. 1B). The PL intensitydecrease is accompanying with blue-shift of the peak maxima withtime, which is believed to originate from preferential PL quenchingof CdTe QDs with large sizes (see detailed discussion in Part S4).Moreover, the quenching rate of thiocholine is enhanced withincubation temperature increased to 38 ◦C and with increasingthiocholine concentration (Fig. S4). Thus, the quenching of PLof the PAH/CdTe QDs/AChE nanostructured film is attributed tothe AChE-catalyzed hydrolysis of acetylthiocholine to acetateand thiocholine. The latter product acts as donors for the holes
generated in the valence band of CdTe QDs upon photoexcitation(Pardo-Yissar et al., 2003; Willner et al., 2007), and thus quenchesPL of QDs (Fig. S5).We use the absolute quenching rate (K10) of the biosensor forthe first 10 min as a signal for detection of OP, K10 = (F0 − F10)/10,
Z. Zheng et al. / Biosensors and Bioele
Fig. 1. (A) Time-dependent PL changes upon the interaction of(PAH/CdTe)8(PAH/PSS)3(PAH/AChE)3 multilayers with 4 mM acetylthiocholinesolution at 38 ◦C. Inset presents the time-dependent PL change of multilayers duringthe first 30 min of reaction. (B) Time-dependent PL changes upon the interaction of 8bilayers of PAH/CdTe QDs in the absence (a) and presence (b–n) of 2 mM thiocholineat room temperature. (C) PL response of the (PAH/CdTe)8(PAH/PSS)3(PAH/AChE)3
multilayers to 4 mM acetylthiocholine after incubation with variable concentrationso −12 −11 −10 −9 −8 −7
1Ep
wbrivc
−9 −11
f paraoxon: (a) 0, (b) 10 , (c) 10 , (d) 10 , (e) 10 , (f) 10 , (g) 10 , and (h)0−6 M. The inset shows inhibition rate as a function of paraoxon concentration.ach data point is an average of six measurements. All measurements wereerformed in a 20 mM PBS solution, pH = 8.0.
here F0 and F10 are the absolute PL intensity recorded at 592 nm
efore and the first 10 min after addition of acetylthiocholine,espectively. Using K10 as a signal, the experimental conditionsncluding the concentration of acetylthiocholine and Mg2+, pHalue, and temperature, are optimized for determination of the con-entration of enzyme inhibitors (see detailed discussion in Part S4ctronics 26 (2011) 3081–3085 3083
and Fig. S6). The optimal conditions for the rest of study on the(PAH/CdTe)8(PAH/PSS)3(PAH/AChE)3 biosensor are explored to be4 mM acetylthiocholine, pH 8.0, 38 ◦C, and 2 mM Mg2+.
Immobilization of AChE into polyelectrolyte multilayers caneffectively stabilize enzymes against unfolding forces. This effectcan be observed by testing the long term stability of the sensors(Fig. S7). A stock of (PAH/CdTe)8(PAH/PSS)3(PAH/AChE)3 multilay-ers were prepared and stored at −20 ◦C. At defined time intervals,the samples were taken and the remaining activity of enzymewas analyzed under the optimal conditions. Evidently, even aftera storage period of 35 days, the immobilized enzymes into poly-electrolyte multilayers retained all of their bioactivity. The slightincrease of the AChE activity might be attributed to changes ofthe enzymes’ three-dimensional structure inside the multilayers,which was already observed in many biosensor systems (Khan andWernet, 1997; Vamvakaki and Chaniotakis, 2007). The long-termstability of enzymes in the nanostructured film will benefit appli-cation of biosensors.
3.2. Detection of OPs by PAH/CdTe QDs/AChE nanostructured film
The PAH/CdTe QDs/AChE nanostructured film is further usedfor fluorescent detection of OPs. When OPs are introduced in solu-tion, they can interact with the active centers of AChE and decreasethe enzyme activity. This leads to the decrease of the thiocholineproduction and then the PL quenching rate of QDs. By means ofmeasuring the quenching rate before and after an incubation stepwith the pesticide, one can calculate the concentration of OPs.
Four commonly-used OPs, paraoxon, parathion, dichlorvos,and omethoate, were detected with the proposed biosensor.Their molecular structures are shown in Fig. S8. The detectionprocedure involved two separate steps: (1) incubation in pes-ticide solution and (2) exposure to acetylthiocholine substrate.In the first step, the incubation time in OP solution influencedthe degree of inhibition, and 15 min was found to maximizethe inhibition effect. Fig. 1C shows the typical PL responseof the (PAH/CdTe)8(PAH/PSS)3(PAH/AChE)3 multilayers to 4 mMacetylthiocholine after incubation with variable concentrations ofparaoxon for 15 min. Increase of the concentration of paraoxondecreases the quenching rate.
The percentage of inhibition can be calculated fromI(%) = (K10 without − K10 with OP)/K10 without × 100, where K10 withoutand K10 with OP are the absolute quenching rates without inhibitionand with inhibition at a certain concentration of OPs, respectively.The detection limit (LOD) is set to be the concentration of pesticidethat causes 10% inhibition (Skladal et al., 1997). Under the optimalconditions established in the above studies, calibration plots weregenerated for four OPs. The percent inhibition is proportional tothe logarithm of paraoxon within the concentration range of 10−12
to 10−6 M (the inset of Fig. 1C), with a LOD down to 1.05 × 10⁻¹¹ M(2.89 × 10⁻³ �g/L). The regression equation is I(%) = 180.88 + 15.55log[paraoxon] (R2 = 0.99, n = 6). The relative standard deviation(RSD) among six different biosensors with equal concentrationof paraoxon is found to be less than 15%, indicating a reasonablygood reproducibility for most measurements.
Similar calibration curves for different OPs areshown in Fig. S8 and S9. The regression equationis I(%) = 140.38 + 11.49 log[parathion] (R2 = 0.99, n = 6),I(%) = 165.03 + 17.30 log[dichlorvos] (R2 = 0.99, n = 6), andI(%) = 69.25 + 5.79 log[omethoate] (R2 = 0.96, n = 6), respectively.The LOD is 4.47 × 10⁻¹² M (1.30 × 10⁻³ �g/L) for parathion,
1.10 × 10 M (0.243 �g/L) for dichlorvos and 5.89 × 10 M(1.26 × 10⁻² �g/L) for omethoate, respectively.The proposed method shows excellent sensitivity for the detec-tion of OPs. For example, the LOD of 1.05 × 10⁻¹¹ M for paraoxonand 4.47 × 10⁻¹² M for parathion is 103 times lower than that of
3084 Z. Zheng et al. / Biosensors and Bioelectronics 26 (2011) 3081–3085
Table 1A correlation of the concentrations of total OP content determined directly by the proposed biosensor with that determined by GC/MS.
Sample The proposed biosensor GC/MS
Measuredvalue (I%)
Average value(�g/mL)
Relativerecovery
Average value(�g/mL)
Relativerecovery
Paraoxona 21.92 ± 2.14(RSD = 9.76%)
110.0 17.88 ± 0.37(RSD = 2.0%)
89.4
Apple sample,2.19 × 10−2�g/mLparaoxon added
70.71 ± 69 2.28 ±0.23(RSD = 10.2%, n = 6)
104.6 N/Ac (n = 3)
Apple sample,2.29 × 10−3�g/mLparaoxon added
56.12 ± 0.54 2.4 ± 0.67(RSD = 8.15%, n = 6)
115.0 N/Ac (n = 3)
Apple 8.32 ± 2.80 N/Ab (n = 6) N/Ac(n = 3)Bean 1.00 ± 0.96 N/Ab (n = 6) N/Ac(n = 3)Tap water 3.76 ± 2.53 N/Ab (n = 6) N/Ac(n = 3)
103 tid
d.f dete
tmbf(a(iibaOppif2
icaoorac
F(s
a Since the limit of detection by the proposed optical biosensor is approximatelyiluted before detection with the proposed biosensors.b Since the inhibition rate is lower than 10%, we assume that OPs are not detectec Total OP content in natural vegetable and fruit samples is lower than the limit o
he GC/MS method (1 �g/L) (Amendola et al., 2002), 3 orders ofagnitude lower than that from the fiber-optic AChE-inhibition
iosensor (Mulchandani et al., 1999), 2 orders lower than thatrom a reagentless bioactive paper-based solid-phase biosensorHossain et al., 2009), and 400 times lower than that with themperometric biosensor based on chemically modified electrodeJoshi et al., 2005). Since the enzyme loading of the biosensornfluences the upper and lower limits of detection, further exper-ments with tunable enzyme loadings can provide an inhibitoriosensor with even better detection limits. Moreover, both LODnd RSD of the nanostructured biosensors for all the four types ofPs are enough to satisfy current detection requirement with highrecision (According to the pesticide residue standard of the Euro-ean Union (EC 149-2008), the detectable pesticide concentration
n imported fruits and vegetables should be lower than 20 �g/Lor paraoxon, 50 �g/L for parathion, 100 �g/L for dichlorvos, and00 �g/L for omethoate, respectively).
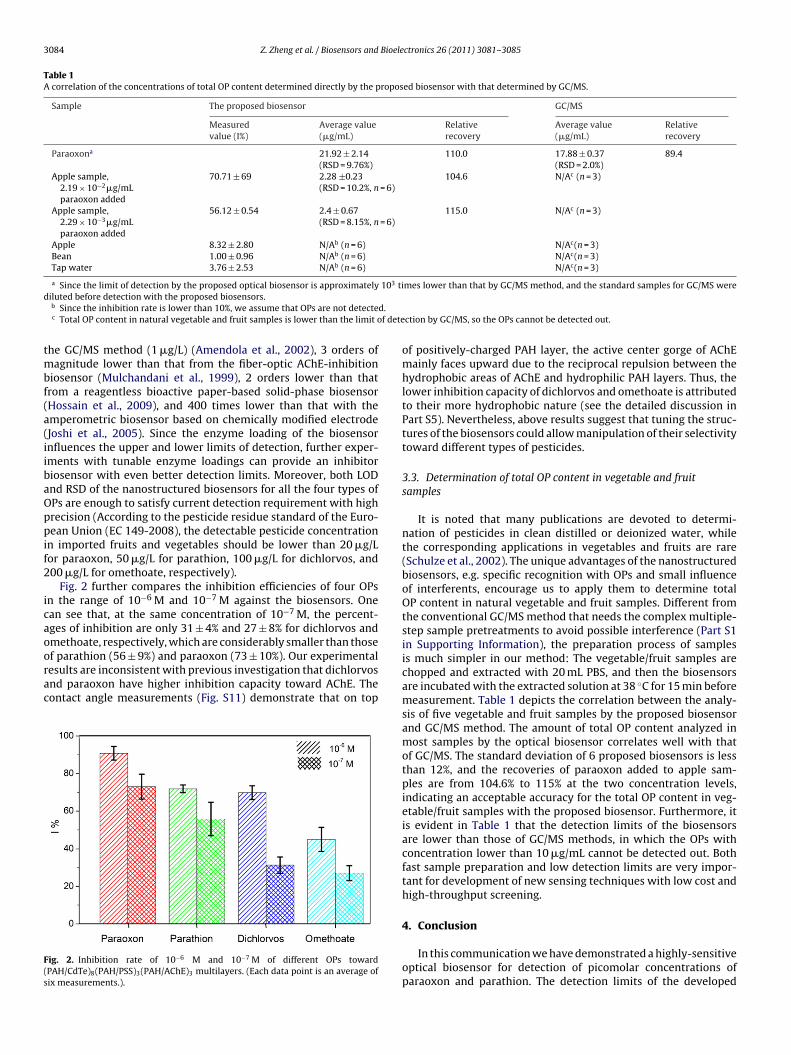
Fig. 2 further compares the inhibition efficiencies of four OPsn the range of 10−6 M and 10−7 M against the biosensors. Onean see that, at the same concentration of 10−7 M, the percent-ges of inhibition are only 31 ± 4% and 27 ± 8% for dichlorvos andmethoate, respectively, which are considerably smaller than those
f parathion (56 ± 9%) and paraoxon (73 ± 10%). Our experimentalesults are inconsistent with previous investigation that dichlorvosnd paraoxon have higher inhibition capacity toward AChE. Theontact angle measurements (Fig. S11) demonstrate that on topig. 2. Inhibition rate of 10−6 M and 10−7 M of different OPs towardPAH/CdTe)8(PAH/PSS)3(PAH/AChE)3 multilayers. (Each data point is an average ofix measurements.).
mes lower than that by GC/MS method, and the standard samples for GC/MS were
ction by GC/MS, so the OPs cannot be detected out.
of positively-charged PAH layer, the active center gorge of AChEmainly faces upward due to the reciprocal repulsion between thehydrophobic areas of AChE and hydrophilic PAH layers. Thus, thelower inhibition capacity of dichlorvos and omethoate is attributedto their more hydrophobic nature (see the detailed discussion inPart S5). Nevertheless, above results suggest that tuning the struc-tures of the biosensors could allow manipulation of their selectivitytoward different types of pesticides.
3.3. Determination of total OP content in vegetable and fruitsamples
It is noted that many publications are devoted to determi-nation of pesticides in clean distilled or deionized water, whilethe corresponding applications in vegetables and fruits are rare(Schulze et al., 2002). The unique advantages of the nanostructuredbiosensors, e.g. specific recognition with OPs and small influenceof interferents, encourage us to apply them to determine totalOP content in natural vegetable and fruit samples. Different fromthe conventional GC/MS method that needs the complex multiple-step sample pretreatments to avoid possible interference (Part S1in Supporting Information), the preparation process of samplesis much simpler in our method: The vegetable/fruit samples arechopped and extracted with 20 mL PBS, and then the biosensorsare incubated with the extracted solution at 38 ◦C for 15 min beforemeasurement. Table 1 depicts the correlation between the analy-sis of five vegetable and fruit samples by the proposed biosensorand GC/MS method. The amount of total OP content analyzed inmost samples by the optical biosensor correlates well with thatof GC/MS. The standard deviation of 6 proposed biosensors is lessthan 12%, and the recoveries of paraoxon added to apple sam-ples are from 104.6% to 115% at the two concentration levels,indicating an acceptable accuracy for the total OP content in veg-etable/fruit samples with the proposed biosensor. Furthermore, itis evident in Table 1 that the detection limits of the biosensorsare lower than those of GC/MS methods, in which the OPs withconcentration lower than 10 �g/mL cannot be detected out. Bothfast sample preparation and low detection limits are very impor-tant for development of new sensing techniques with low cost andhigh-throughput screening.
4. Conclusion
In this communication we have demonstrated a highly-sensitiveoptical biosensor for detection of picomolar concentrations ofparaoxon and parathion. The detection limits of the developed
Bioele
botitdfToresesesdh
A
(gSfi
A
t
R
A
A
Z. Zheng et al. / Biosensors and
iosensors are much lower than that of reported detection meth-ds. With the developed biosensor we successfully detect OPs inhe real samples of vegetables and fruits. To our knowledge thiss the first report on employing the biosensors to detect OPs inhe real samples of vegetables and fruits with satisfactory repro-ucibility and accuracy. The proposed method could also be usedor visual monitoring of OPs (see the detailed discussion in Part S6).he possible disadvantages of this biosensor are: (1) the quenchingf QD multilayers is not fully reversed and its fluorescence partlyecovers (about 60% of the original fluorescence intensity is recov-red by keeping it overnight under ambient condition), and theensor is designed for one-time use. (2) The sensors show differ-nt response characteristics in presence of different types of OPs,o the measurement may be not accurate in the mixture of differ-nt OPs. Nevertheless, many advantages provide by the sensors,uch as easy sample pretreatment, high sensitivity, and mass pro-uction with low cost, could facilitate future development of rapid,igh-throughput screening of OP residues.
cknowledgements
The authors thank National Science Foundation of China20975028), National High-Tech Research and Development Pro-ram (2007AA03Z302), 100-talent program of Chinese Academy ofciences, and start-up funding of Harbin Institute of Technology fornancial support of this research.
ppendix A. Supplementary data
Supplementary data associated with this article can be found, inhe online version, at doi:10.1016/j.bios.2010.12.021.
eferences
mendola, L., Botre, F., Carollo, A.S., Longo, D., Zoccolillo, L., 2002. Anal. Chim. Acta461 (1), 97–108.
ndreou, V.G., Clonis, Y.D., 2002. Biosens. Bioelectron. 17 (1-2), 61–69.
ctronics 26 (2011) 3081–3085 3085
Andres, R.T., Narayanaswamy, R., 1997. Talanta 44 (8), 1335–1352.Clark, S.L., Montague, M.F., Hammond, P.T., 1997. Macromolecules 30 (23),
7237–7244.Constantine, C.A., Gattas-Asfura, K.M., Mello, S.V., Crespo, G., Rastogi, V., Cheng, T.C.,
DeFrank, J.J., Leblanc, R.M., 2003. Langmuir 19 (23), 9863–9867.Cordero, S.R., Carson, P.J., Estabrook, R.A., Strouse, G.F., Buratto, S.K., 2000. J. Phys.
Chem. B 104 (51), 12137–12142.Decher, G., 1997. Science 277 (5330), 1232–1237.Diaz, A.N., Peinado, M.C.R., 1997. Sensor Actuators B: Chem. 39 (1-3), 426–431.Heath, C.W., 1997. Cancer 80 (10), 1887–1888.Hossain, S.M.Z., Luckham, R.E., McFadden, M.J., Brennan, J.D., 2009. Anal. Chem. 81
(21), 9055–9064.Jiang, C.Y., Markutsya, S., Tsukruk, V.V., 2004. Langmuir 20 (3), 882–890.Ji, X.J., Zheng, J.Y., Xu, J.M., Rastogi, V.K., Cheng, T.C., DeFrank, J.J., Leblanc, R.M., 2005.
J. Phys. Chem. B 109 (9), 3793–3799.Joshi, K., Tang, J., Haddon, R., Wang, J., Chen, W., Mulchandani, A., 2005. Electroanal-
ysis 17 (1), 54–58.Khan, G.F., Wernet, W., 1997. Anal. Chem. 69 (14), 2682–2687.Kok, F.N., Hasirci, V., 2004. Biosens. Bioelectron. 19 (7), 661–665.Li, H.B., Qu, F.G., 2007. Chem. Mater. 19 (17), 4148–4154.Liu, S.Q., Kurth, D.G., Bredenkotter, B., Volkmer, D., 2002. J. Am. Chem. Soc. 124 (41),
12279–12287.Li, X.Y., Zhou, Y.L., Zheng, Z.Z., Yue, X.L., Dai, Z.F., Liu, S.Q., Tang, Z.Y., 2009. Langmuir
25 (11), 6580–6586.Mulchandani, A., Pan, S., Chen, W., 1999. Biotechnol. Prog. 15 (1), 130–134.Pardo-Yissar, V., Katz, E., Wasserman, J., Willner, I., 2003. J. Am. Chem. Soc. 125 (3),
622–623.Podsiadlo, P., Kaushik, A.K., Arruda, E.M., Waas, A.M., Shim, B.S., Xu, J.D., Nandivada,
H., Pumplin, B.G., Lahann, J., Ramamoorthy, A., Kotov, N.A., 2007. Science 318(5847), 80–83.
Ristori, C., DelCarlo, C., Martini, M., Barbaro, A., Ancarani, A., 1996. Anal. Chim. Acta325 (3), 151–160.
Schulze, H., Scherbaum, E., Anastassiades, M., Vorlova, S., Schmid, R.D., Bachmann,T.T., 2002. Biosens. Bioelectron. 17 (11–12), 1095–1105.
Schulze, H., Vorlova, S., Villatte, F., Bachmann, T.T., Schmid, R.D., 2003. Biosens.Bioelectron. 18 (2-3), 201–209.
Singh, A.K., Flounders, A.W., Volponi, J.V., Ashley, C.S., Wally, K., Schoeniger, J.S.,1999. Biosens. Bioelectron. 14 (8-9), 703–713.
Skladal, P., Nunes, G.S., Yamanaka, H., Ribeiro, M.L., 1997. Electroanalysis 9 (14),1083–1087.
Tsai, H.C., Doong, R.A., 2005. Biosens. Bioelectron. 20 (9), 1796–1804.United States Department of Agriculture (USDA), 2005. Washington, DC, pp. 4–5.
Vamvakaki, V., Chaniotakis, N.A., 2007. Biosens. Bioelectron. 22 (12), 2848–2853.Willner, I., Willner, B., Katz, E., 2007. Bioelectrochemistry 70 (1), 2–11.Wong, F.C.M., Ahmad, M., Heng, L.Y., Peng, L.B., 2006. Talanta 69 (4), 888–893.Xavier, M.P., Vallejo, B., Marazuela, M.D., Moreno-Bondi, M.C., Baldini, F., Falai, A.,2000. Biosens. Bioelectron. 14 (12), 895–905.Yu, A.M., Liang, Z.J., Caruso, F., 2005. Chem. Mater. 17 (1), 171–175.