highlights - storm resources ltd
TRANSCRIPT
(1) Excludes gains and losses on risk management contracts. (2) Certain financial amounts shown above are non-GAAP measurements. See discussion of Non-GAAP Measurements on page 22 of the attached
Management’s Discussion and Analysis. CROCE and ROCE are presented on a 12-month trailing basis. (3) Excludes the fair value of risk management contracts, decommissioning liability and lease liability. (4) Includes a non-cash unrealized loss on risk management contracts of $8.7 million for the three months ended March 31, 2021 (March 31, 2020
- unrealized gain of $10.5 million.)
Thousands of Cdn$, except volumetric and per-share amounts
Three Months Ended March 31, 2021
Three Months Ended March 31, 2020
FINANCIAL
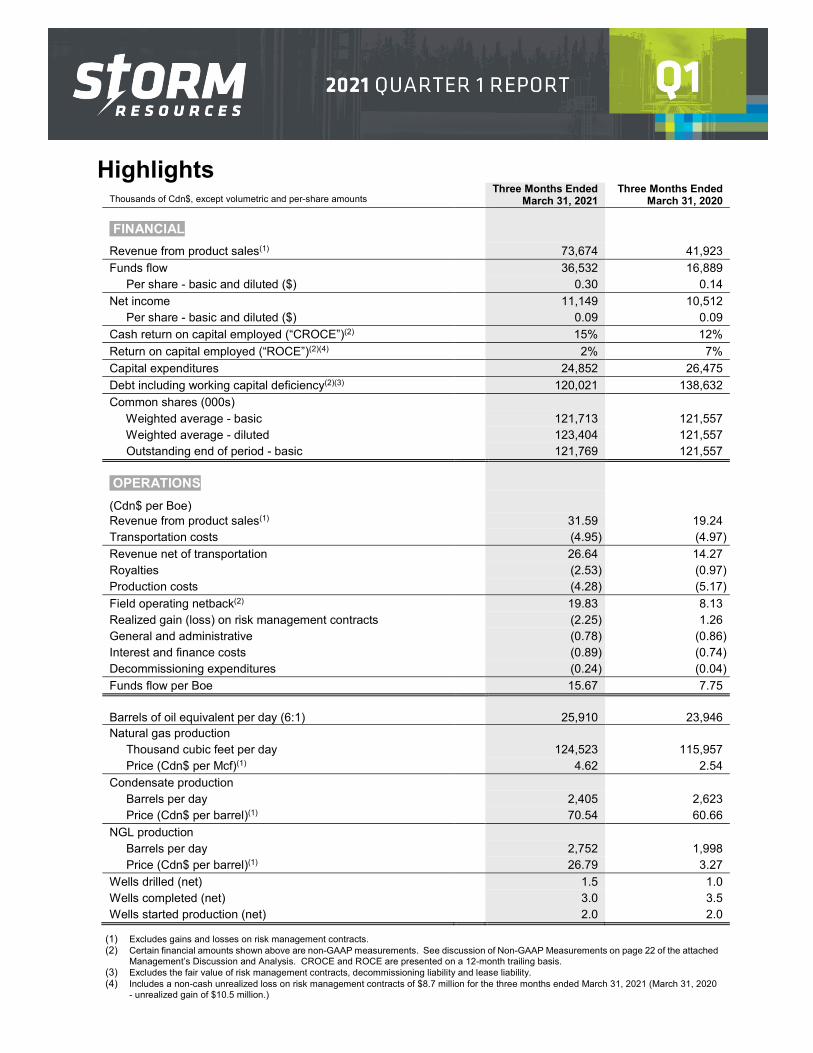
Revenue from product sales(1) 73,674 41,923 Funds flow 36,532 16,889 Per share - basic and diluted ($) 0.30 0.14 Net income 11,149 10,512 Per share - basic and diluted ($) 0.09 0.09 Cash return on capital employed (“CROCE”)(2) 15% 12% Return on capital employed (“ROCE”)(2)(4) 2% 7% Capital expenditures 24,852 26,475 Debt including working capital deficiency(2)(3) 120,021 138,632 Common shares (000s) Weighted average - basic 121,713 121,557 Weighted average - diluted 123,404 121,557 Outstanding end of period - basic 121,769 121,557
OPERATIONS
(Cdn$ per Boe) Revenue from product sales(1) 31.59 19.24 Transportation costs (4.95) (4.97) Revenue net of transportation 26.64 14.27 Royalties (2.53) (0.97) Production costs (4.28) (5.17) Field operating netback(2) 19.83 8.13 Realized gain (loss) on risk management contracts (2.25) 1.26 General and administrative (0.78) (0.86) Interest and finance costs (0.89) (0.74) Decommissioning expenditures (0.24) (0.04) Funds flow per Boe 15.67 7.75 Barrels of oil equivalent per day (6:1) 25,910 23,946 Natural gas production Thousand cubic feet per day 124,523 115,957 Price (Cdn$ per Mcf)(1) 4.62 2.54 Condensate production Barrels per day 2,405 2,623 Price (Cdn$ per barrel)(1) 70.54 60.66 NGL production Barrels per day 2,752 1,998 Price (Cdn$ per barrel)(1) 26.79 3.27 Wells drilled (net) 1.5 1.0 Wells completed (net) 3.0 3.5 Wells started production (net) 2.0 2.0
Highlights

2
Quarterly funds flow was a record high mainly as a result of production growth and a significant improvement in the natural gas price which was $4.62 per Mcf (82% increase from last year). The natural gas price benefitted from higher pricing in all markets with Chicago daily pricing seeing the largest increase as a result of extreme cold experienced across North America in February. • Production was 25,910 Boe per day, an 8% increase year over year and unchanged from the previous quarter.
This was consistent with guidance for an average of 25,000 to 27,000 Boe per day. • Liquids production (condensate plus NGL) totaled 5,157 barrels per day which was 20% of total production and
30% of total revenue. Notably, NGL production increased 38% from last year largely as a result of higher recoveries realized at the Nig Creek Gas Plant which started operations in February 2020.
• During the quarter, three horizontal wells were completed at Umbach with two wells starting production in late March that are averaging approximately 7.4 MMcf per day raw over the last 20 days (rates were restricted for most of April due to downtime at the facility).
• Revenue net of transportation was $26.64 per Boe, an 87% increase from last year as a result of higher commodity
prices. Higher natural gas prices at all sales points was the largest contributor to higher revenue. • Production, general and administrative, and interest and finance costs totaled $5.95 per Boe, a year-over-year
reduction of 12%. This was mainly driven by lower production costs resulting from the start-up of the Nig Creek Gas Plant in February 2020 which reduced third-party processing fees.
• Realized hedging loss was $5.3 million, or $2.25 per Boe, and resulted from the continuing recovery in commodity prices since mid-2020.
• Funds flow was a record $36.5 million, or $0.30 per share, an increase of 116% from last year. This was largely
the result of higher production, higher commodity prices and lower production costs which were partially offset by the $5.3 million hedging loss and by abandonment and reclamation costs totaling $0.6 million.
• Net income was $11.1 million, or $0.09 per share, and was reduced by non-cash charges including $8.7 million for
an unrealized hedging loss (change in the mark-to-market valuation of future hedging contracts) and $4.1 million for deferred income tax expense.
• Cash return on capital employed (CROCE) was 15% and return on capital employed (ROCE) was 2%. ROCE
includes the effect of non-cash hedging gains or losses which can make it less meaningful as a way to measure return on capital.
• Capital investment was $24.9 million (versus guidance for $25 million). At Fireweed, $12.4 million net was invested
to drill three horizontal wells (1.5 net), build 19 kilometres of pipeline, and for equipment deposits for the facility. At Umbach, $12.5 million was invested which included the completion and tie-in of a three-well pad.
• Total debt including working capital deficiency was $120 million which is a reduction of $12 million from the previous
quarter and represents 0.8X annualized quarterly funds flow.
• Commodity price hedges for the remainder of 2021 protect revenue on approximately 47% of current production. At quarter end, the financial liability for future hedging contracts totaled $17 million.
• Carbon taxes paid to the BC government, which are included in production costs, totaled $1.4 million (direct and
indirect), a decrease of $0.3 million from last year as a result of the start-up of the Nig Creek Gas Plant which has a lower emissions intensity versus alternative third-party gas processing plants.
2021 FIRST QUARTER HIGHLIGHTS
PRESIDENT’S MESSAGE

3
Umbach, Nig Creek and Fireweed Areas, Northeast British Columbia Storm's land position is prospective for liquids-rich natural gas from the Montney formation and totals approximately 120,000 net acres (189 gross sections, 170 net sections) with 90 horizontal wells (83.4 net) drilled to the end of the first quarter. Field activity in the first quarter at Umbach included the completion and tie-in of three wells (3.0 net) and, at Fireweed, included drilling three wells (1.5 net) plus constructing 19 kilometres of large diameter gathering and sales pipelines. Expected field activity in the second quarter will include drilling a lower Montney well (1.0 net) at Nig Creek, delivery of the inlet compressor for the Nig Creek Gas Plant which will be installed in early July, and finishing pipeline construction at Fireweed. At the end of the first quarter, there were eight Montney horizontal wells (5.0 net) that had not started producing which included two wells (2.0 net) at Umbach and six wells (3.0 net) at Fireweed. At Umbach, produced raw natural gas contains 1.2% H2S, field compression capacity totals 150 Mmcf raw per day, and firm processing commitments total 80 Mmcf raw per day. First quarter gross raw gas averaged 85 Mmcf per day (Storm working interest approximately 98%) while net sales were 15,020 Boe per day (73.6 Mmcf per day, 1,365 barrels per day condensate, 1,380 barrels per day NGL). Activity in the remainder of 2021 is expected to include drilling and completing the remaining three wells (3.0 net) on a six-well pad. At Nig Creek (100% working interest), produced raw natural gas contains up to 0.5% H2S and is directed to Storm’s 100% working interest sour gas plant. Gas plant inlet volumes in the first quarter averaged 54 Mmcf per day raw, sales were 10,530 Boe per day (48.8 Mmcf per day, 1,030 barrels per day condensate, 1,365 barrels per day NGL), and the production cost was $1.35 per Boe. Capacity of the gas plant is estimated to be 70 Mmcf per day at current average H2S of 0.3% (versus design capacity of 50 Mmcf per day at 0.5% H2S). Activity in the remainder of 2021 will be focused on filling the gas plant which will come from adding inlet compression in July and drilling and completing four wells (4.0 net) this summer in the lower Montney where H2S is below 0.1% based on results to date. Recent wells at Nig Creek and Umbach continue to meet or exceed expectations: • the four most recent wells at Nig Creek started producing in late October 2020 from the upper Montney with the
IP180 averaging 9.5 Mmcf per day raw which is approximately 1,950 Boe per day sales (8.9 Mmcf per day, 230 barrels per day condensate, 240 barrels per day NGL).
• the two most recent wells at Umbach started producing in late March 2021 from the upper Montney, were restricted until late-April due to downtime at the facility, and have averaged 7.4 Mmcf per day raw over the last 20 days which is approximately 1,400 Boe per day sales (6.5 Mmcf per day, 200 barrels per day condensate, 120 barrels per day NGL).
At Fireweed (50% working interest), activity in the remainder of 2021 is expected to include construction of a 50 Mmcf raw per day field compression facility, completion and testing of the recently installed 19 kilometres of gathering and sales pipelines, drilling two wells (1.0 net), and completing three wells (1.5 net). First production is expected in the fourth quarter of 2021 from five wells (2.5 net).
OPERATIONS REVIEW

4
The objective of the commodity price hedging program is to support longer-term growth by protecting revenue on up to 50% of current production for the next 18 months and up to 25% for 19 to 36 months forward. The current hedge position is shown below (excludes price differential contracts which are shown in the financial statements). Future production growth is not hedged.
Q2 – Q4 2021 2022 Natural Gas Hedges % Current Nat Gas Production(1) 48% 31%
Collars 2,800 Mcf/d(2) 6,400 Mcf/d(2) Floor Cdn$4.00 per Mcf(3) Floor Cdn$3.75 per Mcf(3) Ceiling Cdn$4.68 per Mcf(3) Ceiling Cdn$4.69 per Mcf(3)
Fixed Price 57,100 Mcf/d(2) 32,300 Mcf/d(2) Cdn$3.14 per Mcf(3) Cdn$3.27 per Mcf(3)
Crude Oil Hedges % Current Liquids Production(1) 44% 24%
Collars 1,100 Bpd 1,100 Bpd Floor WTI Cdn$52.82 per barrel(3) Floor WTI Cdn$61.31 per barrel(3) Ceiling WTI Cdn$63.21 per barrel(3) Ceiling WTI Cdn$74.66 per barrel(3)
Fixed Price
750 Bpd 150 Bpd WTI Cdn$53.68 per barrel WTI Cdn$64.81 per barrel(3) 400 Bpd Propane Cdn$50.03 per barrel(3)
(1) Using Q1 2021 actual production. (2) Using corporate average heat content 1.22 GJ per Mcf and 1.16 Mmbtu per Mcf. (3) Hedges in US$ are converted using an exchange rate of Cdn$1.26 per US$1.
Production in the second quarter of 2021 is forecast to average 25,000 to 27,000 Boe per day (production to date in the quarter has averaged approximately 26,000 Boe per day). Capital investment in the quarter is forecast to be $14 million which includes $5 million for the inlet compressor at the Nig Creek Gas Plant plus $7 million ($3.5 million net) for equipment deposits for the Fireweed facility. Updated guidance for 2021 is provided below. Forecast pricing was updated to reflect actual prices to date with prices for the remainder of the year being unchanged from previous guidance except for the WTI price which was increased to US$55 per barrel from US$50. 2021 Guidance
Previous March 2, 2021
Current May 12, 2021
Cdn$/US$ exchange rate 0.79 0.79 Chicago daily natural gas - US$/Mmbtu(1) $3.50 $3.50 AECO daily natural gas - Cdn$/GJ(1) $2.60 $2.60 BC Station 2 daily natural gas - Cdn$/GJ $2.55 $2.55 WTI - US$/Bbl $51 $57 Edmonton condensate diff - US$/Bbl ($2.25) ($1.30) Est transportation cost - $/Boe $4.50 - $4.75 $4.50 - $4.75
HEDGING
OUTLOOK

5
2021 Guidance
Previous March 2, 2021
Current May 12, 2021
Est revenue net of transport (excl hedges) - $/Boe $19.50 - $20.50 $20.50 - $21.50 Est royalty rate (% revenue net transportation) 8% - 9% 8% - 9% Est production cost - $/Boe $4.00 - $4.50 $4.00 - $4.50 Est mid-point field operating netback - $/Boe(2) $14.05 $14.95 Est realized hedging gains or (losses) - $ million ($10.0 - $12.0) ($15.0 - $17.0) Est cash G&A - $ million $6.0 - $7.0 $6.0 - $7.0 Est interest expense - $ million $6.0 - $7.0 $6.0 - $7.0 Est capital investment (excluding A&D) - $ million $85 - $90 $85 - $90 Forecast fourth quarter Boe/d Forecast fourth quarter liquids Bbls/d
30,000 - 32,000 6,800 - 7,300
30,000 - 32,000 6,800 - 7,300
Forecast annual Boe/d Forecast annual liquids Bbls/d
26,000 - 28,000 5,600 - 6,000
26,000 - 28,000 5,600 - 6,000
Est annual funds flow - $ million(3) $109 - $120 $112 - $122 Horizontal wells drilled - gross Horizontal wells completed - gross Horizontal wells starting production - gross
11 - 12 (8.5 - 9.5 net) 11 - 12 (10.5 - 11.5 net) 14 - 15 (11.5 - 12.5 net)
11 - 12 (9.0 - 9.5 net) 13 (11.5 net)
14 - 15 (11.5 - 12.5 net)
(1) Approximately 50% of natural gas sales are at the daily or spot price and 50% at the monthly index price. (2) Based on the mid-point for each of revenue net of transportation, royalty rate and production costs. (3) Based on the range for forecast annual production and using the mid-points for the estimated field operating
netback, estimated cash G&A, estimated hedging gain or loss and estimated interest expense.
2021 Guidance History
Chicago
Daily (US$/Mmbtu)
BC Station 2
Daily (Cdn$/GJ)
WTI (US$/Bbl)
Capital
Investment ($ million)
Forecast Annual
Funds Flow ($ million)
Forecast Annual
Production (Boe/d)
Nov 10, 2020 $2.65 $2.50 $40 $85 - $90 $90 - $99 26,000 - 28,000 Mar 2, 2021 $3.50 $2.55 $51 $85 - $90 $109 - $120 26,000 - 28,000 May 12, 2021 $3.50 $2.55 $57 $85 - $90 $112 - $122 26,000 - 28,000
2021 Investment and Activity by Area
Capital Investment ($million)
% for Infrastructure
Net Wells Drilled
Net Wells Completed
Net Wells Starting Production
Fireweed $30 - $35 58% 2.0 - 2.5 1.5 2.5 Nig Creek $28 25% 4.0 4.0 3.0 - 4.0 Umbach $27 3.0 6.0 6.0 Total $85 - $90
‘Free cash flow’ in 2021 is estimated to be approximately $83 million using the mid-point for estimated annual funds flow and based on investment to maintain production of approximately $33 million to drill, complete and tie-in 6.0 net wells. ‘Free cash flow’ is being directed to development at Fireweed, growth from Nig Creek and debt reduction. As always, capital investment will remain flexible and may be adjusted up or down depending on commodity prices.

6
Transportation costs are expected to decline in 2021 given that natural gas sales into Canadian markets where pipeline tariffs are lower will increase to 54% of total sales from 38% in 2020. The natural gas sales split in 2021 is expected to be 46% at Chicago, 36% at BC Station 2, 11% at AECO and 7% at Alliance ATP. The marketing strategy for natural gas continues to be based on diversifying physical sales to mitigate the effect of regional price differences that are difficult to predict in terms of timing and duration. Development at Fireweed continues to progress with the majority of large diameter gathering and sales pipelines having been constructed while initial equipment deliveries to the site will start in July. First production of approximately 2,500 Boe per day net remains on track for the fourth quarter of 2021. The focus of the business plan is on growing asset value and funds flow per share and, in 2021, this will come from:
1) Filling the Nig Creek Gas Plant which reduces production cost and increases the proportion of liquids; 2) Advancing Fireweed development where condensate is forecast to be a higher proportion of production; and 3) Reducing debt which increases future financial flexibility to pursue acquisitions, accelerate organic growth or
return capital to shareholders. With the material improvement in commodity prices over the last six months, an increase to capital investment in the second half of 2021 is currently being evaluated. Additional activity would be focused on increasing asset value and accessing underutilized facility capacity which is expected to result in attractive rates of return at current forward strip commodity prices. A number of opportunities are being reviewed including step-out wells at Umbach that would test the mid and/or lower Montney and accelerating development at Fireweed to fill the facility sooner. Production guidance for 2021 is not expected to change as any incremental wells would start producing in late 2021 or early 2022. Further details will be provided when second quarter results are released on August 11, 2021 with any increase to capital investment being contingent on continued strength in commodity prices and achieving minimum debt reduction of $10 to $15 million in 2021 relative to year end 2020. Respectfully,
Brian Lavergne, President and Chief Executive Officer May 12, 2021 Boe Presentation – For the purpose of calculating unit revenues and costs, natural gas is converted to a barrel of oil equivalent (“Boe”) using six thousand cubic feet (“Mcf”) of natural gas equal to one barrel of oil unless otherwise stated. Boe may be misleading, particularly if used in isolation. A Boe conversion ratio of six Mcf to one barrel (“Bbl”) is based on an energy equivalency conversion method primarily applicable at the burner tip and does not represent a value equivalency at the wellhead. All Boe measurements and conversions in this report are derived by converting natural gas to oil in the ratio of six thousand cubic feet of gas to one barrel of oil. Mboe means 1,000 Boe. Initial Production Rates - References to initial production rates (“IP”), and other short-term production rates are useful in confirming the presence of hydrocarbons, however such rates are not determinative of the rates at which such wells will commence production and decline thereafter and are not indicative of long-term performance or of ultimate recovery. Additionally, such rates may also include recovered "load oil" fluids used in well completion stimulation. Readers are cautioned not to place reliance on such rates in calculating the aggregate production for the Company. A pressure transient analysis or well-test interpretation has not been carried out in respect of all wells. Accordingly, the Company cautions that the test results should be considered to be preliminary. Forward-Looking Statements – Such statements made in this report are subject to the limitations set out in Storm’s Management’s Discussion and Analysis dated May 12, 2021 for the three months ended March 31, 2021.

7
Set out below is management’s discussion and analysis ("MD&A") of financial and operating results for Storm Resources Ltd. (“Storm” or the “Company”) for the three months ended March 31, 2021. It should be read in conjunction with (i) the Company’s unaudited condensed interim consolidated financial statements for the three months ended March 31, 2021, (ii) the Company’s MD&A and audited consolidated financial statements for the year ended December 31, 2020, and (iii) the press release issued by the Company on May 12, 2021, and other operating and financial information included in this report. All of these documents as well as the Company’s Annual Information Form dated March 31, 2021 are filed on SEDAR (www.sedar.com) and appear on the Company’s website (www.stormresourcesltd.com.) The Company trades on the Toronto Stock Exchange (“TSX”) under the symbol “SRX”. This MD&A is dated May 12, 2021. See discussion related to “Forward-Looking Statements”, “Boe Presentation” and “Non-GAAP Measurements” on pages 20 to 23.
Financial data presented below have largely been derived from the Company’s unaudited condensed interim consolidated financial statements (the “financial statements”) for the three months ended March 31, 2021, prepared in accordance with International Accounting Standard (“IAS”) 34 “Interim Financial Reporting” using accounting policies consistent with International Financial Reporting Standards (“IFRS”). Accounting policies adopted by the Company are referred to in Note 3 to the audited consolidated financial statements for the year ended December 31, 2020. The reporting and the functional currency is the Canadian dollar. Unless otherwise indicated, tabular financial amounts, other than per-share amounts, are in thousands. Comparative information is provided for the immediately prior three month period ended December 31, 2020 and for the three month period ended March 31, 2020.
Overview Storm entered the first quarter in a position of strength with production buoyed from a recently completed four-well pad at Nig Creek that was placed on stream at the end of October 2020. This allowed the Company to capitalize on a significantly improved commodity price environment that saw WTI crude oil rally over US$15.00 per barrel from December 2020 to March 2021 due to demand recovery, while natural gas prices benefitted from higher demand due to a polar vortex that brought severe cold to the majority of Canada and the United States in February. Production of 25,910 Boe per day and capital expenditures of $25 million were in line with previously announced guidance, while Storm posted record funds flow of approximately $37 million in the quarter due to the material improvement in commodity prices. While demand for crude oil continues to improve and WTI prices have stabilized around the US$60.00 per barrel level, the economic situation remains highly volatile with a third wave of COVID-19 underway across the globe. As previously stated, predicting the extent to which the ongoing presence of COVID-19 may affect the Company remains difficult; however, depending on the severity and duration of the pandemic, it is possible that COVID-19 may have further adverse effects on commodity prices, the Company’s business, results of operations and financial condition. While Storm entered these challenging times in a position of strength, both from an operational and liquidity standpoint, management will continue to monitor this rapidly changing situation to determine what, if any, additional measures need to be taken.
INTRODUCTION
BASIS OF PRESENTATION
OPERATIONAL AND FINANCIAL RESULTS
MANAGEMENT’S DISCUSSION & ANALYSIS

8
As at March 31, 2021, the Company had an extendible revolving credit facility in the amount of $190 million based on a bank determined borrowing base related to the Company’s producing reserves. Subsequent to quarter end, the annual review process was completed with the credit facility reconfirmed at $190 million and the term extended until May 27, 2022. The credit facility was approximately 69% drawn at the end of the first quarter (including $14 million for outstanding letters of credit). With funds flow for the remainder of the year expected to be in excess of capital expenditures, low maintenance capital, a balanced hedge portfolio, and unused credit capacity, Storm maintains adequate financial liquidity to continue executing on its capital program with a focus on growing asset value and funds flow per share. Production and Revenue Average Daily Production
Three Months to March 31, 2021
Three Months to March 31, 2020
Quarter-Over- Quarter Change
Three Months to December 31, 2020
Natural gas (Mcf/d) 124,523 115,957 7% 124,927 Condensate (Bbls/d) 2,405 2,623 (8%) 2,502 NGL (Bbls/d) 2,752 1,998 38% 2,662 Total (Boe/d) 25,910 23,946 8% 25,985 Natural gas weighting 80% 81% 80% Condensate weighting 9% 11% 10% NGL weighting 11% 8% 10%
Production for natural gas, condensate and NGL in the first quarter of 2021 was 8% higher than the first quarter of 2020 primarily due to incremental production from new wells brought on production. Furthermore, the first quarter of 2021 benefitted from a full quarter of operation of the Nig Creek Gas Plant (incremental production from higher NGL recovery and reduced gas shrinkage) relative to the same period in 2020 as the gas plant was commissioned in February 2020. The Company started production from two new 100% interest horizontal wells during the first quarter of 2021.
-
35,000
70,000
105,000
140,000
-
1,500
3,000
4,500
6,000
Average Daily Production
Condensate (Bbls/d) NGL (Bbls/d) Natural Gas (Mcf/d)
Bbls
/d
Mcf
/d

9
Revenue from Product Sales(1)
Three Months Ended March 31, 2021
Three Months Ended March 31, 2020
Three Months Ended December 31, 2020
Natural gas $ 51,771 $ 26,850 $ 36,945 Condensate 15,268 14,478 11,978 NGL 6,635 595 4,018 Total $ 73,674 $ 41,923 $ 52,941 % of Total Revenue by Product Type Natural gas 70% 64% 70% Condensate and NGL 30% 36% 30% Total 100% 100% 100%
(1) Before realized gains and losses on risk management contracts and including natural gas purchased and sold to meet marketing commitments during outages.
Revenue from product sales for the first quarter of 2021 increased by 76% when compared to the first quarter of 2020 as a result of the Company’s average realized price increasing by 64% combined with an 8% increase in production volumes. Compared to the prior quarter, revenue from product sales increased by 39% due the Company’s average realized price increasing by 43%. Average Selling Prices(1)
Three Months Ended March 31, 2021
Three Months Ended March 31, 2020
Three Months Ended December 31, 2020
Natural gas - Mcf $ 4.62 $ 2.54 $ 3.21 Condensate - Bbl $ 70.54 $ 60.66 $ 52.04 NGL - Bbl $ 26.79 $ 3.27 $ 16.41 Per Boe $ 31.59 $ 19.24 $ 22.15
(1) Before realized gains and losses on risk management contracts. On a per-Boe basis, the Company’s average realized price for the three months ended March 31, 2021 increased compared to the same period of 2020 due to higher natural gas, condensate and NGL pricing. The increase in natural gas pricing is primarily due to a significant increase in Chicago daily pricing, specifically in February 2021, when extreme cold temperatures were experienced across North America. The higher condensate pricing aligns to an increase in WTI pricing from demand recovery, which was partially offset by strengthening of the Canadian dollar relative to the U.S. dollar. The Company’s NGL price for the first quarter of 2021 was 37% of WTI, higher than guidance of 30% of WTI, due to higher benchmark pricing for propane.
5,000
10,000
15,000
20,000
25,000
30,000
90
120
150
180
210
240
Production Per Share
Production Volumes (Boe/d) Volumes per MM Shares O/S
Volu
me
PerM
M S
hare
s O/S
Boe/
d
10
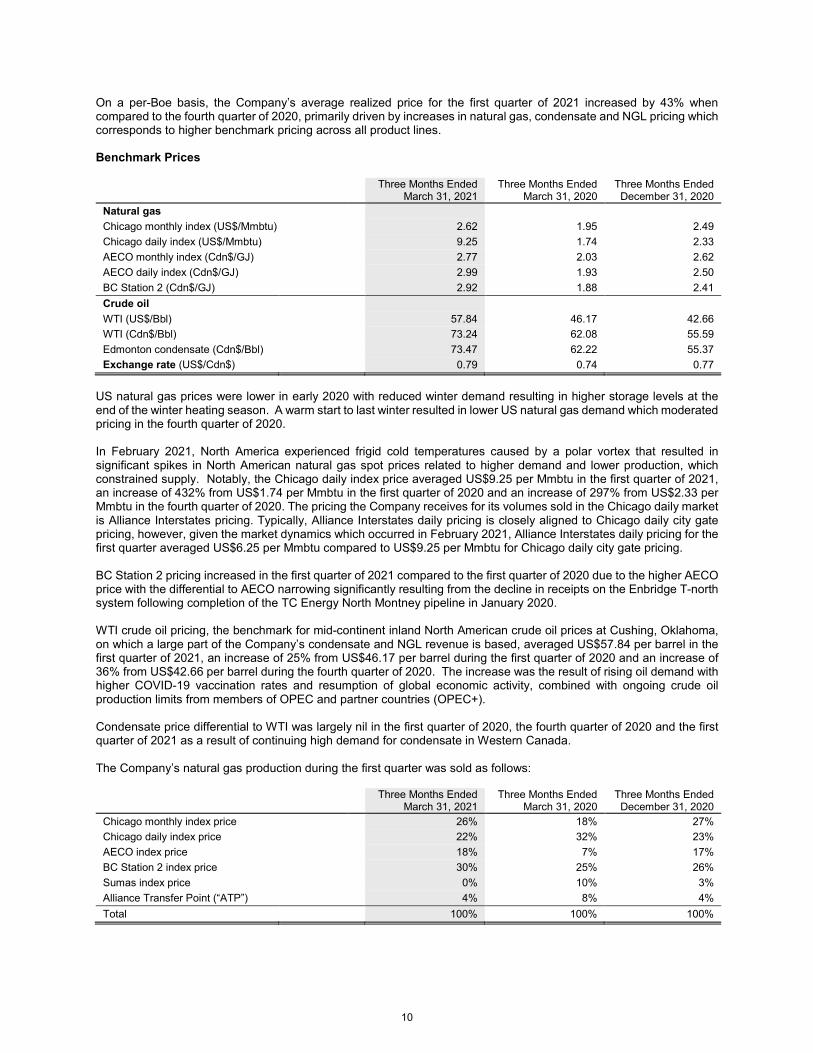
On a per-Boe basis, the Company’s average realized price for the first quarter of 2021 increased by 43% when compared to the fourth quarter of 2020, primarily driven by increases in natural gas, condensate and NGL pricing which corresponds to higher benchmark pricing across all product lines. Benchmark Prices
Three Months Ended March 31, 2021
Three Months Ended March 31, 2020
Three Months Ended December 31, 2020
Natural gas Chicago monthly index (US$/Mmbtu) 2.62 1.95 2.49 Chicago daily index (US$/Mmbtu) 9.25 1.74 2.33 AECO monthly index (Cdn$/GJ) 2.77 2.03 2.62 AECO daily index (Cdn$/GJ) 2.99 1.93 2.50 BC Station 2 (Cdn$/GJ) 2.92 1.88 2.41 Crude oil WTI (US$/Bbl) 57.84 46.17 42.66 WTI (Cdn$/Bbl) 73.24 62.08 55.59 Edmonton condensate (Cdn$/Bbl) 73.47 62.22 55.37 Exchange rate (US$/Cdn$) 0.79 0.74 0.77
US natural gas prices were lower in early 2020 with reduced winter demand resulting in higher storage levels at the end of the winter heating season. A warm start to last winter resulted in lower US natural gas demand which moderated pricing in the fourth quarter of 2020. In February 2021, North America experienced frigid cold temperatures caused by a polar vortex that resulted in significant spikes in North American natural gas spot prices related to higher demand and lower production, which constrained supply. Notably, the Chicago daily index price averaged US$9.25 per Mmbtu in the first quarter of 2021, an increase of 432% from US$1.74 per Mmbtu in the first quarter of 2020 and an increase of 297% from US$2.33 per Mmbtu in the fourth quarter of 2020. The pricing the Company receives for its volumes sold in the Chicago daily market is Alliance Interstates pricing. Typically, Alliance Interstates daily pricing is closely aligned to Chicago daily city gate pricing, however, given the market dynamics which occurred in February 2021, Alliance Interstates daily pricing for the first quarter averaged US$6.25 per Mmbtu compared to US$9.25 per Mmbtu for Chicago daily city gate pricing. BC Station 2 pricing increased in the first quarter of 2021 compared to the first quarter of 2020 due to the higher AECO price with the differential to AECO narrowing significantly resulting from the decline in receipts on the Enbridge T-north system following completion of the TC Energy North Montney pipeline in January 2020. WTI crude oil pricing, the benchmark for mid-continent inland North American crude oil prices at Cushing, Oklahoma, on which a large part of the Company’s condensate and NGL revenue is based, averaged US$57.84 per barrel in the first quarter of 2021, an increase of 25% from US$46.17 per barrel during the first quarter of 2020 and an increase of 36% from US$42.66 per barrel during the fourth quarter of 2020. The increase was the result of rising oil demand with higher COVID-19 vaccination rates and resumption of global economic activity, combined with ongoing crude oil production limits from members of OPEC and partner countries (OPEC+). Condensate price differential to WTI was largely nil in the first quarter of 2020, the fourth quarter of 2020 and the first quarter of 2021 as a result of continuing high demand for condensate in Western Canada. The Company’s natural gas production during the first quarter was sold as follows:
Three Months Ended March 31, 2021
Three Months Ended March 31, 2020
Three Months Ended December 31, 2020
Chicago monthly index price 26% 18% 27% Chicago daily index price 22% 32% 23% AECO index price 18% 7% 17% BC Station 2 index price 30% 25% 26% Sumas index price 0% 10% 3% Alliance Transfer Point (“ATP”) 4% 8% 4% Total 100% 100% 100%

11
In the first quarter of 2021, Storm’s realized natural gas price increased 82% from the first quarter of 2020. The Company’s natural gas sales price partially tracks Chicago pricing given that 26% of first quarter sales were at Chicago monthly index prices and 22% of first quarter sales were at Chicago daily index prices. Commencing in the fourth quarter of 2020, the Company had increased exposure to BC Station 2 pricing with the expiry of the Sumas marketing arrangement in October 2020, thereby increasing the Company’s exposure to Western Canadian gas pricing (AECO and BC Station 2). Approximately 48% of the Company’s production is sold at AECO and BC Station 2 pricing. Daily pricing at AECO and BC Station 2 increased approximately 55% in the first quarter of 2021 compared to the first quarter of 2020.
Storm’s realized condensate price of $70.54 per barrel for the first quarter of 2021 increased by 16% from the first quarter of 2020 and increased by 36% from the fourth quarter of 2020, primarily as a result of an increase in the WTI price.
$0.00
$1.00
$2.00
$3.00
$4.00
$5.00
$6.00
$7.00
$8.00
$9.00
$10.00
Q2/19 Q3/19 Q4/19 Q1/20 Q2/20 Q3/20 Q4/20 Q1/21
Storm Realized Natural Gas Price vs. Benchmark
Storm Realized Nat Gas Price ($/Mcf) Station 2 ($/GJ)
AECO Daily ($/GJ) Chicago Monthly (Cdn$/Mmbtu)
Chicago Daily (Cdn$/Mmbtu)
$15.00
$25.00
$35.00
$45.00
$55.00
$65.00
$75.00
$85.00
Q2/19 Q3/19 Q4/19 Q1/20 Q2/20 Q3/20 Q4/20 Q1/21
Storm Condensate Price vs. Benchmark
Storm Condensate Price WTI Cdn$
Cdn$
/Bbl

12
In the first quarter of 2021, Storm’s realized price for NGL, excluding condensate, increased by 719% relative to the same period of 2020 primarily due to higher contracted prices with marketers from a more balanced NGL market and higher WTI and propane pricing. When comparing the first quarter of 2021 to the fourth quarter of 2020, the realized price for NGL, excluding condensate, increased by 63% quarter over quarter. The increase in the realized price for NGL from the prior quarter is due to an increase in WTI pricing and higher benchmark pricing for propane. Storm’s NGL price net of transportation is anticipated to be approximately 20% to 25% of WTI in Canadian dollar terms for the contract period that commences in April 2021 and ends in March 2022. Realized Gain (Loss) on Risk Management
Three Months Ended March 31, 2021
Three Months Ended March 31, 2020
Three Months Ended December 31, 2020
Natural gas $ (1,787) $ 1,724 $ (2,659) Liquids(1) (3,469) 1,013 53 Realized gain (loss) on risk management contracts $ (5,256) $ 2,737 $ (2,606) Per Boe $ (2.25) $ 1.26 $ (1.09)
(1) Liquids includes field condensate, plant pentanes, butane and propane. Although the Company has no crude oil production, condensate and approximately half of the NGL stream is priced with reference to WTI and, as a result, the Company enters into WTI crude oil risk management contracts to hedge liquids prices. The realized gains and losses on risk management contracts consists of the portion of contracts that have settled during the reporting period. The realized loss for the three months ended March 31, 2021 is primarily due to higher WTI crude oil pricing and higher BC Station 2 pricing compared to the Company’s financial risk management contracted prices on swaps and costless collars. Royalties
Three Months Ended March 31, 2021
Three Months Ended March 31, 2020
Three Months Ended December 31, 2020
Charge for period $ 5,907 $ 2,107 $ 2,190 Percentage of revenue from product sales 8.0% 5.0% 4.1% Per Boe $ 2.53 $ 0.97 $ 0.92
0%
10%
20%
30%
40%
50%
$0.00
$10.00
$20.00
$30.00
$40.00
$50.00
$60.00
$70.00
Q2/19 Q3/19 Q4/19 Q1/20 Q2/20 Q3/20 Q4/20 Q1/21
Storm NGL Price vs. Benchmark
Storm NGL Price Conway PropaneArgus Far East Index Propane Storm NGL Price (% of WTI)
Cdn$
/Bbl
% o
f WTI
Cdn
$
13
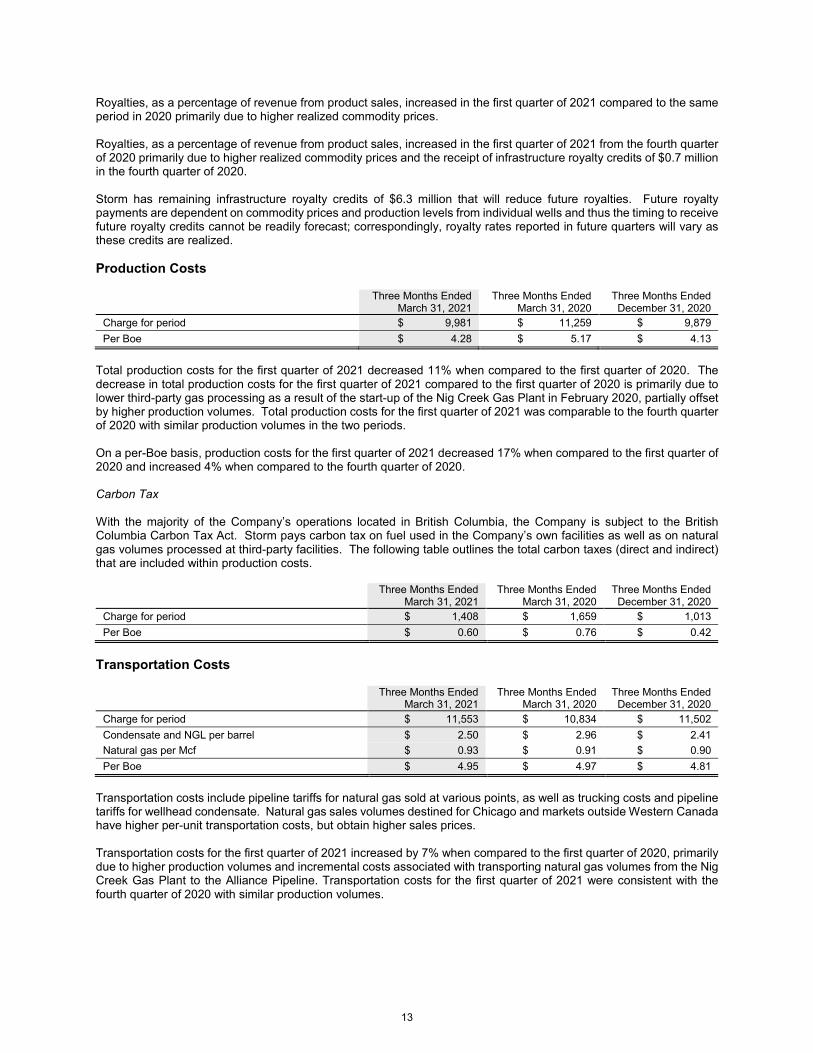
Royalties, as a percentage of revenue from product sales, increased in the first quarter of 2021 compared to the same period in 2020 primarily due to higher realized commodity prices. Royalties, as a percentage of revenue from product sales, increased in the first quarter of 2021 from the fourth quarter of 2020 primarily due to higher realized commodity prices and the receipt of infrastructure royalty credits of $0.7 million in the fourth quarter of 2020. Storm has remaining infrastructure royalty credits of $6.3 million that will reduce future royalties. Future royalty payments are dependent on commodity prices and production levels from individual wells and thus the timing to receive future royalty credits cannot be readily forecast; correspondingly, royalty rates reported in future quarters will vary as these credits are realized. Production Costs
Three Months Ended March 31, 2021
Three Months Ended March 31, 2020
Three Months Ended December 31, 2020
Charge for period $ 9,981 $ 11,259 $ 9,879 Per Boe $ 4.28 $ 5.17 $ 4.13
Total production costs for the first quarter of 2021 decreased 11% when compared to the first quarter of 2020. The decrease in total production costs for the first quarter of 2021 compared to the first quarter of 2020 is primarily due to lower third-party gas processing as a result of the start-up of the Nig Creek Gas Plant in February 2020, partially offset by higher production volumes. Total production costs for the first quarter of 2021 was comparable to the fourth quarter of 2020 with similar production volumes in the two periods. On a per-Boe basis, production costs for the first quarter of 2021 decreased 17% when compared to the first quarter of 2020 and increased 4% when compared to the fourth quarter of 2020. Carbon Tax With the majority of the Company’s operations located in British Columbia, the Company is subject to the British Columbia Carbon Tax Act. Storm pays carbon tax on fuel used in the Company’s own facilities as well as on natural gas volumes processed at third-party facilities. The following table outlines the total carbon taxes (direct and indirect) that are included within production costs.
Three Months Ended March 31, 2021
Three Months Ended March 31, 2020
Three Months Ended December 31, 2020
Charge for period $ 1,408 $ 1,659 $ 1,013 Per Boe $ 0.60 $ 0.76 $ 0.42
Transportation Costs
Three Months Ended March 31, 2021
Three Months Ended March 31, 2020
Three Months Ended December 31, 2020
Charge for period $ 11,553 $ 10,834 $ 11,502 Condensate and NGL per barrel $ 2.50 $ 2.96 $ 2.41 Natural gas per Mcf $ 0.93 $ 0.91 $ 0.90 Per Boe $ 4.95 $ 4.97 $ 4.81
Transportation costs include pipeline tariffs for natural gas sold at various points, as well as trucking costs and pipeline tariffs for wellhead condensate. Natural gas sales volumes destined for Chicago and markets outside Western Canada have higher per-unit transportation costs, but obtain higher sales prices. Transportation costs for the first quarter of 2021 increased by 7% when compared to the first quarter of 2020, primarily due to higher production volumes and incremental costs associated with transporting natural gas volumes from the Nig Creek Gas Plant to the Alliance Pipeline. Transportation costs for the first quarter of 2021 were consistent with the fourth quarter of 2020 with similar production volumes.

14
Field Operating Netbacks Details of field operating netbacks are as follows:
($/Boe)
Three Months Ended March 31, 2021
Three Months Ended March 31, 2020
Three Months Ended December 31, 2020
Revenue from product sales 31.59 19.24 22.15 Royalties (2.53) (0.97) (0.92) Production costs (4.28) (5.17) (4.13) Transportation costs (4.95) (4.97) (4.81) Field operating netback 19.83 8.13 12.29 Realized gain (loss) on risk management contracts (2.25) 1.26 (1.09) Field operating netback including hedging 17.58 9.39 11.20
The field operating netback for the first quarter of 2021 increased by 87% after hedging compared to the first quarter of 2020.
$9.39
$17.58
$12.35 $0.91($1.56) ($3.51)
$-
$5.00
$10.00
$15.00
$20.00
$25.00
Q1 2020 Revenue Royalties Prod. & Transp.Costs
Realized Hedging Q1 2021
Change in Quarterly Field Operating Netback Including Hedging: Q1/20 vs. Q1/21

15
The field operating netback for the first quarter of 2021 increased by 57% after hedging compared to the fourth quarter of 2020.
General and Administrative Costs
Three Months Ended March 31, 2021
Three Months Ended March 31, 2020
Three Months Ended December 31, 2020
Charge for period – before recoveries $ 2,997 $ 2,567 $ 2,144 Overhead recoveries (1,181) (700) (533) Charge for period – net of recoveries $ 1,816 $ 1,867 $ 1,611 Per Boe $ 0.78 $ 0.86 $ 0.67
General and administrative costs before recoveries for the first quarter of 2021 increased by 17% when compared to the first quarter of 2020 and increased by 40% when compared to the fourth quarter of 2020. The increase in general and administrative costs for the first quarter of 2021 compared to the immediately preceding quarter is primarily due to the payout of the annual employee performance bonus. Fluctuations in overhead recoveries are in response to the amount and type of field capital expenditures incurred. The increase in overhead recoveries in the first quarter of 2021 compared to the first quarter of 2020 is due to higher recoveries from third parties and lower recoveries realized in 2020 relating to the construction of the Nig Creek Gas Plant. The increase in overhead recoveries in the first quarter of 2021 compared to the fourth quarter of 2020 is due to an increase in capital expenditures in 2021 and higher recoveries from third parties. Net general and administrative costs on a per-Boe measure for the first quarter of 2021 were lower compared to the first quarter of 2020 due to higher production volumes. Net general and administrative costs on a per-Boe measure for the first quarter of 2021 were higher compared to the fourth quarter of 2020 due to the payout of the annual employee performance bonus. Generally, the Company’s general and administrative cost structure is predictable year to year and variability in per-Boe metrics is due to changes in production volumes. Interest and Finance Costs
Three Months Ended March 31, 2021
Three Months Ended March 31, 2020
Three Months Ended December 31, 2020
Charge for period(1) $ 2,099 $ 1,646 $ 2,310 Average interest rate(2) 6.3% 5.2% 6.5% Per Boe $ 0.90 $ 0.76 $ 0.97
(1) Includes lease interest. (2) Includes financing and standby fees; excludes lease interest.
$11.20
$17.58
$9.44 ($1.61)($0.29) ($1.16)
$-
$5.00
$10.00
$15.00
$20.00
$25.00
Q4 2020 Revenue Royalties Prod. & Transp.Costs
Realized Hedging Q1 2021
Change in Quarterly Field Operating Netback Including Hedging: Q4/20 vs. Q1/21

16
The interest rate on the Company’s bank facility is based on bankers’ acceptance rates plus a stamping fee which is amended each quarter in response to changes in the Company’s debt-to-funds-flow ratio. Interest costs for the first quarter of 2021 increased by 28% compared to the same quarter of 2020 as a result of higher average bank borrowings combined with a higher effective interest rate due to tightening of credit markets as a result of the COVID-19 pandemic. The effective interest rate for the first quarter of 2021 increased from the first quarter of 2020 due to higher fees from tightening of credit markets and a short-term increase in the Company’s debt-to-funds-flow ratio due to lower commodity prices and lower production in the third quarter of 2020 from a McMahon Gas Plant turnaround. Interest costs for the first quarter of 2021 decreased 9% compared to the fourth quarter of 2020 as a result of lower average bank borrowings due to funds flow for the first quarter of 2021 exceeding capital expenditures. With an improved commodity price outlook for the remainder of 2021, the expected increase in funds flow should result in stamping fees and interest expense being reduced. Funds Flow
Three Months Ended March 31, 2021
Three Months Ended March 31, 2020
Three Months Ended December 31, 2020
Per diluted share
Per diluted share
Per diluted
share Funds flow $36,532 $0.30 $16,889 $0.14 $22,350 $0.18
Funds flow, a measure that is not defined under IFRS, is cash generated from operating activities before changes in non-cash working capital, as presented on the statement of cash flows. The measurement of funds flow is used to benchmark operations against prior and future periods and peer group companies and is used by lenders to establish interest rates applied to credit facilities.
(1) Includes general and administrative cost, interest and finance costs and decommissioning expenditures and excludes lease
interest. Higher realized commodity prices were the predominant factor in the 116% increase in funds flow in the first quarter of 2021 versus the first quarter of 2020.
$16,889
$36,532
$535
$31,216 $1,278
($3,800)($719) ($7,993)
($874)
$-
$10,000
$20,000
$30,000
$40,000
$50,000
Q1 2020 Revenue -Volume
Revenue -Price
Royalties Prod. Costs Transp. RealizedHedging
Other (1) Q1 2021
Change in Quarterly Funds Flow ($M): Q1/20 vs. Q1/21

17
The cash return on capital employed (“CROCE”) over the last 12 months, which is a measurement of the Company’s cash profitability as a proportion of the funding utilized to generate it (shareholders’ equity plus debt including working capital deficiency), was 15% in the first quarter of 2021 compared to 12% in the first quarter of 2020.
(1) Includes general and administrative cost, interest and finance costs and decommissioning expenditures and excludes lease
interest. Funds flow for the first quarter of 2021 increased by 63% from the fourth quarter of 2020 primarily due to stronger realized prices across all products. Share-Based Compensation
Three Months Ended March 31, 2021
Three Months Ended March 31, 2020
Three Months Ended December 31, 2020
Charge for period $ 626 $ 476 $ 430 Per Boe $ 0.27 $ 0.22 $ 0.18
Share-based compensation is a non-cash charge which reflects the estimated value of stock options issued to Storm’s directors, officers and employees. Share-based compensation increased by 32% in the first quarter of 2021 compared to the first quarter of 2020 and by 46% when compared to the fourth quarter of 2020. The increase in share-based compensation in both periods is primarily attributable to higher value stock options and performance awards that were issued at the end of 2020. Depletion and Depreciation
Three Months Ended March 31, 2021
Three Months Ended March 31, 2020
Three Months Ended December 31, 2020
Depletion $ 9,337 $ 9,779 $ 9,564 Depreciation 2,729 2,226 2,663 Charge for period $ 12,066 $ 12,005 $ 12,227 Per Boe $ 5.17 $ 5.51 $ 5.12
Depletion and depreciation in the first quarter of 2021 was comparable to the same quarter of 2020 and to the fourth quarter of 2020. Depreciation expense increased 23% in the first quarter of 2021 compared to the first quarter of 2020 primarily due to the start-up of the Nig Creek Gas Plant in February 2020. On a per-Boe basis, the decrease in depletion
$22,350
$36,532
$22,322
($1,589)
($3,717)
($153) ($2,650)($31)
$-
$10,000
$20,000
$30,000
$40,000
$50,000
Q4 2020 Revenue -Volume
Revenue -Price
Royalties Prod. &Transp. Costs
RealizedHedging
Other (1) Q1 2021
Change in Quarterly Funds Flow ($M): Q4/20 vs. Q1/21

18
and depreciation in the first quarter of 2021 when compared to the first quarter of 2020 is due to lower finding and development costs incurred in 2020. Unrealized Gain (Loss) on Risk Management
Three Months Ended March 31, 2021
Three Months Ended March 31, 2020
Three Months Ended December 31, 2020
Natural gas $ (3,370) $ (622) $ 18,144 Liquids(1) (5,521) 12,273 (3,458) Interest rate 238 (1,174) 165 Unrealized gain (loss) on risk management contracts $ (8,653) $ 10,477 $ 14,851 Per Boe $ (3.71) $ 4.81 $ 6.21
(1) Liquids includes field condensate, plant pentanes, butane and propane. The unrealized gain (loss) on risk management contracts is a non-cash charge representing the change in the mark-to-market position on remaining unexpired contracts at the end of the period. Income Taxes The Company did not incur any cash tax expense in the three months ended March 31, 2021, nor does it expect to pay any cash tax for the remainder of 2021 or in 2022 based on current commodity prices, forecast taxable income, existing tax pools and planned capital expenditures. Deferred income taxes arise from differences between the accounting and tax bases of the Company’s assets and liabilities. For the three months ended March 31, 2021, the Company recognized a deferred income tax expense of $4.1 million as a result of $15.3 million of net income before taxes. As at March 31, 2021, the Company had a deferred income tax liability of $15.0 million. Net Income The mark-to-market valuation of risk management contracts resulted in a distortion on reported net income for both the first quarter of 2021 relative to the same period in 2020 and to the fourth quarter of 2020. For the first quarter of 2021, the unrealized loss on risk management contracts amounted to $8.7 million compared to an unrealized gain in the first quarter of 2020 of $10.5 million and an unrealized gain of $14.9 million in the fourth quarter of 2020. The return on capital employed (“ROCE”) over the last 12 months, which is a measurement of the Company’s income profitability as a proportion of the funding utilized to generate it (shareholders’ equity plus debt including working capital deficiency), was 2% in the first quarter of 2021 compared to 7% in the first quarter of 2020, although as mentioned above is distorted by unrealized gains and losses on the Company’s risk management contracts.
Three Months Ended March 31, 2021
Three Months Ended March 31, 2020
Three Months Ended December 31, 2020
Net income $ 11,149 $ 10,512 $ 17,873
Per basic and diluted share $ 0.09 $ 0.09 $ 0.15
Financial Resources and Liquidity As at March 31, 2021, the Company had an extendible revolving credit facility in the amount of $190 million (December 31, 2020 - $190 million) based on a bank determined borrowing base related to the Company’s proved developed producing reserves. Subsequent to quarter end, the annual review process was completed with the credit facility reconfirmed at $190 million and the term extended until May 27, 2022. In the ordinary course of business the Company will have the option to extend the facility for an additional year. If the credit facility is not extended, the facility moves into a term phase whereby the outstanding loan amount is to be repaid in full one year later. In the event that the lenders reduce the borrowing base below the amount drawn, the Company would have 90 days to eliminate any borrowing base shortfall by repaying the amount drawn in excess of the re-determined borrowing base or by providing additional security or other consideration satisfactory to the lenders. Repayments of principal are not required provided
INVESTMENT AND FINANCING

19
that the borrowings under the credit facility do not exceed the authorized borrowing amount. Interest is paid on the utilized portion of the credit facility at bankers’ acceptance rates, plus a stamping fee. Collateral comprises a floating charge demand debenture on the assets of the Company. At March 31, 2021, debt including working capital deficiency amounted to $120.0 million. Bank debt including outstanding letters of credit represented approximately 69% utilization of the available credit facility. As at March 31, 2021, the Company had issued letters of credit in the amount of $13.9 million (December 31, 2020 - $13.7 million) in support of future natural gas transportation and processing obligations. Availability under the Company’s credit facility is reduced by a like amount. In quarters of high field activity, Storm operates with a working capital deficit, which will be reduced in quarters of lower field activity. The Company's capital expenditure budget is set by management at the beginning of the calendar year and approved by the Board of Directors. It is updated regularly with changes subject to approval by the Board of Directors. Management is accountable to the Board of Directors for the execution of the business plan represented by the budget and updates the Board on progress at least four times a year. Capital Expenditures In the first quarter of 2021, the Company incurred capital expenditures of $24.9 million compared to $26.5 million in the first quarter of 2020 and $16.2 million in the fourth quarter of 2020. Capital expenditures in the first quarter of 2021 were primarily related to costs incurred for drilling three horizontal wells (1.5 net) at Fireweed and completing three horizontal wells (3.0 net) at Umbach. In addition, $8.0 million (net) was incurred in the first quarter of 2021 related to construction costs associated with the field compression facility and related pipeline infrastructure at Fireweed.
Three Months Ended March 31, 2021
Three Months Ended March 31, 2020
Three Months Ended December 31, 2020
Land and seismic $ 244 $ 233 $ 199 Drilling 4,214 3,679 6,172 Completions 7,565 9,676 6,317 Facilities 3,997 11,209 1,819 Equipping and pipelines 7,967 1,553 1,004 Recompletions and workovers 863 87 640 Property acquisition and administrative assets 2 38 12 Total capital expenditures $ 24,852 $ 26,475 $ 16,163
Net capital investment was allocated as follows:
Three Months Ended March 31, 2021
Three Months Ended March 31, 2020
Three Months Ended December 31, 2020
Exploration and evaluation $ 244 $ 233 $ 200 Property and equipment 24,608 26,242 15,963 Total capital expenditures $ 24,852 $ 26,475 $ 16,163
Accounts Payable and Accrued Liabilities Accounts payable and accrued liabilities include operating, general and administrative and capital costs payable. When appropriate, net payables in respect of cash calls issued to partners regarding capital projects and estimates of amounts owing but not yet invoiced to the Company are included in accounts payable. The level of accounts payable and accrued liabilities at March 31, 2021 corresponds to the Company’s field capital expenditure program. Decommissioning Liability The Company’s decommissioning liability of $29.3 million (December 31, 2020 - $32.9 million) represents the present value of estimated future costs to be incurred to abandon and reclaim wells and facilities drilled, constructed or purchased by Storm. The undiscounted and inflated amount of the liability at March 31, 2021 was $42.7 million (December 31, 2020 - $40.5 million), with $1.4 million expected to be incurred in the next 12 months. The liability for currently inactive wells and facilities is approximately $9 million with approximately 72% of this expected to be incurred by 2025.

20
In the course of its business, Storm enters into various contractual obligations, including the following:
• purchase of services; • royalty agreements; • operating agreements; • processing and transportation agreements; • right of way agreements; • lease obligations for office space and field equipment; • rental obligations for accommodation, office equipment and automotive equipment; • banking agreements; and • risk management contracts.
All such contractual obligations reflect market conditions at the time of contract and do not involve related parties. In the first quarter of 2018, the Company entered into an office lease agreement commencing on October 1, 2018. The remaining aggregate office lease commitment approximates $3.9 million over five years. In addition, as at the date of this report, the Company has transportation and processing commitments valued at a total of approximately $372 million.
2021 2020 2019 ($000s unless otherwise stated)
Q1
Q4
Q3
Q2
Q1
Q4
Q3
Q2
Revenue from product sales 73,674 52,941 30,010 30,191 41,923 48,671 31,417 37,568 Funds flow 36,532 22,350 6,681 10,904 16,889 18,469 11,973 12,590 Per share – basic and diluted ($) 0.30 0.18 0.05 0.09 0.14 0.15 0.10 0.10 Net income (loss) 11,149 17,873 (16,934) (11,665) 10,512 2,906 (64) 7,864 Per share – basic and diluted ($) 0.09 0.15 (0.14) (0.10) 0.09 0.02 (0.00) 0.06 Net capital expenditures 24,852 16,163 14,219 2,394 26,475 23,913 32,841 23,145 Average daily production (Boe) 25,910 25,985 19,027 23,935 23,946 22,375 18,596 19,923 Debt including working capital deficiency(1)
120,021
131,705
137,983
130,317
138,632
128,901
123,342
102,268
(1) A non-GAAP measure as defined in the non-GAAP measurements section of this MD&A.
Forward-Looking Statements – Certain information and statements are set forth in this document, including management's assessment of Storm's future plans and operations specifically in relation to 2021, and contain forward-looking information within the meaning of applicable Canadian securities legislation. Such statements or information are generally identifiable by words such as "anticipate", "believe", "intend", "plan", "expect", "schedule", "indicate", "focus", "outlook", "propose", "target", "objective", "priority", "strategy", "estimate", "budget", "forecast", "would", "could", "will", "may", "future" or other similar words or expressions and include statements relating to or associated with individual wells, facilities, regions or projects as well as timing of any future event which may have an effect on the Company's operations and financial position. All statements and information concerning expectations or projections about the future and statements and information regarding the future business plan or strategy, timing or scheduling, production volumes with splits by commodity, production declines, expected and future activities and capital expenditures, commodity prices, costs, royalties, schedules, operating or financial results, future financing requirements, and the expected effect of future commitments are forward-looking statements. Forward-looking statements include references to:
• future production volumes in 2021, production volumes by commodity and production declines;
CONTRACTUAL OBLIGATIONS
QUARTERLY RESULTS
LIMITATIONS

21
• planned capital expenditures in 2021 totaling $85 million to $90 million, timing, allocations to specific areas, and the availability of financial resources to fund which includes funds flow and availability of committed credit facilities;
• expected treatment under government regulatory regimes; • business plans and/or strategy; • future guidance for 2021 including forecast commodity prices, exchange rates, transportation costs, royalties,
production costs, cash G&A and interest expense; • Q2 2021 production of 25,000 to 27,000 Boe per day with capital investment of $14 million; • the expectation that the Company’s NGL price will be approximately 20% to 25% of WTI in Canadian dollar
terms for April 2021 to March 2022; • the near-term growth plan for 2021 and 2022 which is expected to increase liquids as a proportion of total
production and decrease per-Boe production costs and includes the estimated start date of production from the Fireweed area based on timing for completion of the field compression facility and timing for the drilling and completion of wells;
• ‘Free cash flow’ in 2021 of approximately $83 million based on the mid-point for estimated annual funds flow in guidance and assuming capital investment of $33 million is required to maintain production;
• existing or future contractual obligations including agreements pertaining to processing capacity, transportation and marketing of natural gas, condensate and NGL; and
• future tax liabilities and future use of tax pools and losses.
Forward-looking statements are based on expectations, forecasts, and assumptions made by the Company using information available at the time of the statement and historical trends which includes expectations and assumptions concerning:
• the accuracy of reserve estimates and valuations; • performance characteristics of producing properties; • access to third-party infrastructure; • government policies and regulation; • future production rates; • accuracy of estimated capital expenditures; • availability and cost of labour and services and owned or third-party infrastructure; • royalties; • development and execution of projects; • the satisfaction by third parties of their obligations to the Company; and • the receipt and timing for approvals from regulators and third parties.
The forward-looking statements are subject to known and unknown risks and uncertainties and other factors which may cause actual results, levels of activity and achievements to differ materially from those expressed or implied by such statements. Such factors include, but are not limited to:
• changes in general, market and business conditions including commodity prices, price differentials, interest rates and currency exchange;
• changes in supply and demand for the Company's products; • a global public health crisis including the recent outbreak of the novel coronavirus (COVID-19) which causes
volatility and disruptions in the supply, demand and pricing for natural gas, crude oil and NGL, global supply chains and financial markets, as well as declining trade and market sentiment and reduced mobility of people;
• the ability to obtain regulatory, stakeholder and third-party approvals and satisfy any associated conditions that are not within the Company’s control;
• risks associated with exploration, development and production; • risk that projects and opportunities may not achieve the expected results in the time anticipated or at all; • operational risks and uncertainties associated with crude oil and natural gas activities including reservoir
performance, fires, blow-outs, equipment failures and other accidents, uncontrollable flows of natural gas and wellbore fluids, pollution and other environmental risks;
• changes in costs including transportation, production, royalty, general and administrative, and finance; • adverse weather conditions which could disrupt production and affect drilling and completions resulting in
increased costs and/or delay adding production; • actions by government authorities including changes to laws and regulations, tax laws and policies, fees,
royalties, duties and government-imposed compliance costs; • counter-party risk with third parties to perform their obligations with whom the Company has material
relationships;

22
• unplanned facility maintenance or outages or unavailability of third-party infrastructure which could reduce production or prevent the transportation of products to processing plants and sales markets;
• unexpected events such as fires (including wildfires) or equipment failures or similar events that would affect the Company's facilities or third-party infrastructure used by the Company;
• environmental risks (including climate change) and the cost of compliance with current and future environmental laws, including climate change laws along with risks relating to increased activism and opposition to fossil fuels;
• ability to access capital from internal and external sources to finance planned activities (including the credit facility);
• the potential for security breaches of the Company's information technology systems by malicious persons or entities, and the unavailability or failure of such systems to perform as anticipated as a result of such breaches;
• risks with transactions including property acquisitions or dispositions and the failure to realize anticipated benefits from any transaction;
• finding new crude oil and gas reserves that can be developed economically to replace reserves depleted by production;
• risk associated with commodity price hedging activities using derivatives and other financial instruments; • risk with First Nations land claims and consultation requirements; • risk that the Company may be subject to litigation; • inability to secure labour, services or equipment on a timely basis or on favourable terms; • increased competition from other industry participants for, among other things, capital, acquisitions of assets
or undeveloped lands, and skilled personnel; and • increased competition from companies that provide alternative sources of energy.
Statements relating to “reserves” or “resources” are forward-looking statements, including financial measurements such as net present value, as they involve the assessment, based on estimates and assumptions, that the reserves and resources described exist in the quantities predicted or estimated, and can be profitably produced in the future. Readers are advised that the assumptions used in the preparation of such information, although considered reasonable at the time of preparation, may prove to be imprecise and, as such, undue reliance should not be placed on forward-looking statements. Storm disclaims any intention or obligation to publicly update or revise any forward-looking statements, whether as a result of new information, future events or otherwise, except as required under securities law. Readers are cautioned that the foregoing list of factors is not exhaustive. The forward-looking statements contained herein are expressly qualified by this cautionary statement. Boe Presentation - Natural gas is converted to a barrel of oil equivalent (“Boe”) using six thousand cubic feet (“Mcf”) of natural gas equal to one barrel of oil unless otherwise stated. Boe may be misleading, particularly if used in isolation. A Boe conversion ratio of six Mcf to one barrel (“Bbl”) is based on an energy equivalency conversion method primarily applicable at the burner tip and does not represent a value equivalency at the wellhead. All Boe measurements and conversions in this report are derived by converting natural gas to crude oil in the ratio of six thousand cubic feet of natural gas to one barrel of crude oil. Non-GAAP Measurements - Within this MD&A, references are made to terms which are not recognized under Generally Accepted Accounting Principles (“GAAP”). Specifically, “debt including working capital deficiency”, “field operating netbacks”, “field operating netbacks including hedging”, “CROCE”, “ROCE” and measurements “per commodity unit” and “per Boe” do not have any standardized meaning as prescribed by GAAP and are regarded as non-GAAP measures. These non-GAAP measures may not be comparable to the calculation of similar amounts for other entities and readers are cautioned that use of such measures to compare enterprises may not be valid. Non-GAAP terms are used to benchmark operations against prior periods and peer group companies and are widely used by investors, lenders, analysts and other parties. Field Operating Netbacks Field operating netbacks and field operating netbacks including hedging are common non-GAAP measurements applied in the crude oil and natural gas industry and are used by management to assess operational performance of assets. Field operating netbacks are calculated by deducting royalties, production and transportation expenses from revenue from product sales and are presented on a per-Boe basis.

23
Debt Including Working Capital Deficiency Debt including working capital deficiency is defined as bank indebtedness plus working capital deficiency excluding the mark-to-market value of risk management contracts, decommissioning liability and lease liability. Management believes this is a key measure to assess the Company’s liquidity and is used by the Company’s lenders to set corporate interest rates.
($000s unless otherwise stated)
As at March 31, 2021
As at March 31, 2020
As at March 31, 2019
Accounts receivable 27,330 20,494 23,221 Prepaids and deposits 2,570 561 588 Less: Accounts payable and accrued liabilities (33,312) (34,863) (25,788) Working capital deficiency 3,412 13,808 1,979 Bank indebtedness 116,609 124,824 89,606 Debt including working capital deficiency 120,021 138,632 91,585
CROCE & ROCE CROCE is a non-GAAP financial measure and does not have a standardized meaning under IFRS. CROCE is determined by taking funds flow plus interest and finance costs on a 12-month trailing basis, and dividing it by the average capital employed (shareholders’ equity plus debt including working capital deficiency) as presented in the following table.
($000s unless otherwise stated)
Twelve Months Ended March 31, 2021
Twelve Months Ended March 31, 2020
Average debt including working capital deficiency(1) 129,327 115,109 Average shareholders’ equity(1) 434,069 420,915 Average capital employed 563,396 536,024
Funds flow 76,467 59,921 Interest and finance costs 7,856 5,686 Funds flow plus interest and finance costs 84,323 65,607 CROCE 15% 12%
(1) The average debt including working capital deficiency and shareholders’ equity represent the average of the opening and ending balances as presented on the statement of financial position for the respective period.
ROCE is a non-GAAP financial measure and does not have a standardized meaning under IFRS. ROCE is determined by taking net income plus interest and finance costs and deferred income tax expense on a 12-month trailing basis, and dividing it by the average capital employed (shareholders’ equity plus debt including working capital deficiency) as presented in the following table.
($000s unless otherwise stated)
Twelve Months Ended March 31, 2021
Twelve Months Ended March 31, 2020
Average debt including working capital deficiency(1) 129,327 115,109 Average shareholders’ equity(1) 434,069 420,915 Average capital employed 563,396 536,024
Net income 423 21,218 Interest and finance costs 7,856 5,686 Deferred income tax expense 1,750 8,205 10,029 35,109 ROCE 2% 7%
(1) The average debt including working capital deficiency and shareholders’ equity represent the average of the opening and ending balances as presented on the statement of financial position for the respective period.
The CROCE and ROCE measures allow management and others to evaluate the Company’s capital efficiency and ability to generate profitable returns by measuring the Company's earnings (funds flow and net income) relative to the capital employed in the business.
24
There are a number of risks facing participants in the Canadian crude oil and natural gas industry. Some risks are common to all businesses while others are specific to the industry. Information with respect to such risks is set out in Storm’s Annual Information Form dated March 31, 2021 for the year ended December 31, 2020 under the heading “Risk Factors” and in Storm’s MD&A for the period ended December 31, 2020 under the heading “Business Risks”. Crude Oil and Natural Gas Prices and General Economic Conditions The Company’s financial results are largely dependent on the prevailing prices of crude oil and natural gas. Crude oil and natural gas prices are subject to fluctuations in supply, demand, market uncertainty and other factors that are beyond the Company’s control. This can include but is not limited to: the global and domestic supply of and demand for crude oil and natural gas; global and North American economic conditions; the actions of OPEC or individual producing nations; government regulation; political stability; the ability to transport commodities to markets; developments related to the market for liquefied natural gas; the availability and prices of alternate fuel sources; and weather conditions. In addition, significant growth in crude oil and natural gas production in Western Canada and the United States has resulted in pressure on transportation and pipeline capacity which contributes to fluctuations in prices. All of these factors are beyond the Company’s control and can result in a high degree of price volatility. Fluctuations in currency exchange rates further compound this volatility when commodity prices, which are generally set in U.S. dollars, are stated in Canadian dollars. The Company’s financial performance also depends on revenues from the sale of commodities which differ in quality and location from underlying commodity prices quoted on financial exchanges. Unexpected developments in financial markets, regulatory environments, or consumer behaviour may also have adverse effects on the Company’s results, business, financial condition or liquidity, for a substantial period of time. Fluctuations in the price of commodities and associated price differentials affect the value of the Company’s assets and the Company’s ability to pursue its business objectives. Prolonged periods of low commodity prices and volatility may also affect the Company’s ability to meet guidance targets and its financial obligations as they come due. Any substantial and extended decline in the price of crude oil and natural gas could have an adverse effect on the Company’s reserves, borrowing capacity, revenues, profitability and funds flow and may have a material adverse effect on the Company’s business, financial condition, results of operations, prospects and the level of expenditures for the development of crude oil and natural gas reserves. This may include delay or cancellation of existing or future drilling or development programs or curtailment in production as the economics of producing from some wells may become impaired. In addition, bank borrowings available to the Company are, in part, determined by the value of the Company’s assets. A sustained material decline in commodity prices from historical average prices could reduce the value of the Company’s assets, therefore reducing the bank credit available to the Company which could require that a portion, or all, of the Company’s bank debt be repaid, as well as curtailment of the Company’s investment programs. The Company conducts regular assessments of the carrying amount of its assets in accordance with IFRS. If crude oil and natural gas prices decline significantly and remain at low levels for an extended period of time, the carrying amount of the Company’s assets may be subject to impairment. Market conditions which include global crude oil and natural gas supply and demand and global events including actions taken by OPEC, Russia’s withdrawal from OPEC, sanctions against Iran and Venezuela, slowing growth in China and emerging economies, weakening global relationships, isolationist and punitive trade policies, shale production in the United States, sovereign debt levels and political upheavals in various countries including growing anti-fossil fuel sentiment and the outbreak of COVID-19 have caused significant volatility in commodity prices. In addition, continued hostilities in the Middle East and the occurrence or threat of terrorist attacks, including attacks on crude oil infrastructure in crude oil producing nations, in the United States or other countries could adversely affect the economies of Canada, the United States and other countries. These events and conditions have caused a significant reduction in the valuation of crude oil and natural gas companies and a decrease in confidence in the future of the crude oil and natural gas industry. In addition, the difficulties encountered by midstream proponents in Western Canada to obtain the necessary approvals on a timely basis to build pipelines, LNG plants and other facilities to provide better access to markets for the crude oil and natural gas industry have led to additional downward pressure on crude oil and natural gas prices which has further reduced confidence in the crude oil and natural gas industry in Western Canada.
BUSINESS RISKS

25
Global Health Crises The Company’s business, operations and financial condition could be materially adversely affected by the outbreak of epidemics or pandemics or other health crises (directly or indirectly). In December 2019, COVID-19 was reported to have surfaced; on January 30, 2020, the World Health Organization (“WHO”) declared the outbreak a global health emergency; and on March 11, 2020 the WHO declared the outbreak of COVID-19 a global pandemic. The spread of COVID-19 has led governments and companies to impose quarantines, travel restrictions and other public health safety measures. COVID-19 vaccinations are expected to ramp up in 2021 which could restore economic activity; however, the timing remains uncertain. Global economies, financial markets and interest rates have been affected. The COVID-19 pandemic has caused business closures and resulted in ratings downgrades, credit deterioration and bankruptcies. It remains uncertain how the macroeconomic environment and societal and business norms will continue to be affected following the COVID-19 pandemic. Public health crises can result in volatility and disruptions in the supply, demand and pricing for crude oil and natural gas, global supply chains and financial markets, as well as declining trade and market sentiment and reduced mobility of people, all of which could affect commodity prices, interest rates, credit ratings, credit risk and inflation. In particular, crude oil prices sustained a steep initial decline in response to the outbreak of COVID-19. The risks to the Company of such public health crises also include risks to employee health and safety and a slowdown or temporary suspension of operations in geographic locations affected by an outbreak. This could include the Company’s wells and facilities and/or third-party facilities and pipelines used by the Company. While there has been little to no disruption to date on the Company’s operations, the extent to which COVID-19 may affect the Company in the future is uncertain. Subsequent waves and variants of concern may cause further adverse effects on the economy, commodity prices and the Company’s operations and financial condition.
Disclosure Controls and Internal Controls Over Financial Reporting The Company has designed disclosure controls and procedures (“DCP”) to provide reasonable assurance that: (i) material information relating to the Company is made known to the Company's Chief Executive Officer and Chief Financial Officer by others, particularly during the period in which the annual and interim filings are being prepared; and (ii) information required to be disclosed by the Company in its annual filings, interim filings or other reports filed or submitted by it under securities legislation is recorded, processed, summarized and reported within the time period specified in securities legislation. The Company has designed internal controls over financial reporting ("ICFR") to provide reasonable assurance regarding the reliability of financial reporting and the preparation of financial statements for external purposes in accordance with IFRS. The Company is required to disclose herein any change in the Company's ICFR that occurred during the recent fiscal period that has materially affected, or is reasonably likely to materially affect, the Company’s ICFR. No material changes in the Company's DCP and its ICFR were identified during the quarter ended March 31, 2021 that have materially affected, or are reasonably likely to materially affect, the Company's ICFR. It should be noted that a control system, including the Company's disclosure and internal controls and procedures, no matter how well conceived, can provide only reasonable, but not absolute assurance that the objectives of the control system will be met and it should not be expected that the disclosure and internal controls and procedures will prevent all errors or fraud.
Additional information relating to the Company can be viewed at www.sedar.com or on the Company’s website at www.stormresourcesltd.com. Information can also be obtained by contacting the Company at Storm Resources Ltd., Suite 600, 215 – 2nd Street S.W., Calgary, Alberta T2P 1M4.
FINANCIAL REPORTING UPDATE
ADDITIONAL INFORMATION

26
(1) Excludes gains and losses on risk management contracts. (2) Certain financial amounts shown above are non-GAAP measurements. See discussion of Non-GAAP Measurements on page 22 of the attached
Management’s Discussion and Analysis. CROCE and ROCE are presented on a 12-month trailing basis. (3) Excludes the fair value of risk management contracts, decommissioning liability and lease liability. (4) Includes a non-cash unrealized loss on risk management contracts of $8.7 million for the quarter ended March 31, 2021 (March 31, 2020 -
unrealized gain of $10.5 million).
Thousands of Cdn$, except volumetric and per-share amounts
Q1 2021
Q4 2020
Q3 2020
Q2 2020
Q1 2020
Q4 2019
Q3 2019
Q2 2019
FINANCIAL
Revenue from product sales(1) 73,674 52,941 30,010 30,191 41,923 48,671 31,417 37,568 Funds flow 36,532 22,350 6,681 10,904 16,889 18,469 11,973 12,590 Per share - basic and diluted ($) 0.30 0.18 0.05 0.09 0.14 0.15 0.10 0.10 Net income (loss) 11,149 17,873 (16,934) (11,665) 10,512 2,906 (64) 7,864 Per share - basic and diluted ($) 0.09 0.15 (0.14) (0.10) 0.09 0.02 (0.00) 0.06 Cash return on capital employed (“CROCE”)(2) 15% 12% 11% 12% 12% 12% 15% 18% Return on capital employed (“ROCE”)(2)(4) 2% 2% (2%) 2% 7% 4% 9% 11% Capital expenditures 24,852 16,163 14,219 2,394 26,475 23,913 32,841 23,145 Debt including working capital deficiency(2)(3) 120,021 131,705 137,983 130,317 138,632 128,901 123,342 102,268 Common shares (000s) Weighted average - basic 121,713 121,581 121,557 121,557 121,557 121,557 121,557 121,557 Weighted average - diluted 123,404 121,536 121,557 121,557 121,557 121,557 121,557 121,557 Outstanding end of period - basic 121,769 121,689 121,557 121,557 121,557 121,557 121,557 121,557
OPERATIONS
(Cdn$ per Boe)
Revenue from product sales(1) 31.59 22.15 17.14 13.86 19.24 23.64 18.36 20.72 Transportation costs (4.95) (4.81) (6.43) (5.50) (4.97) (5.20) (5.83) (5.96) Revenue net of transportation 26.64 17.34 10.71 8.36 14.27 18.44 12.53 14.76 Royalties (2.53) (0.92) (0.77) (0.44) (0.97) (1.59) 0.19 (0.32) Production costs (4.28) (4.13) (4.84) (4.50) (5.17) (5.67) (5.88) (5.89) Field operating netback(2) 19.83 12.29 5.10 3.42 8.13 11.18 6.84 8.55 Realized gain (loss) on risk management contracts (2.25)
(1.09)
0.51
2.99
1.26
(0.80)
1.64
(0.22) General and administrative (0.78) (0.67) (0.72) (0.72) (0.86) (0.70) (0.79) (0.68) Interest and finance costs (0.89) (0.96) (1.08) (0.68) (0.74) (0.71) (0.69) (0.71) Decommissioning expenditures (0.24) (0.22) - (0.01) (0.04) - - - Funds flow per Boe 15.67 9.35 3.81 5.00 7.75 8.97 7.00 6.94 Barrels of oil equivalent per day (6:1) 25,910 25,985 19,027 23,935 23,946 22,375 18,596 19,923 Natural gas production Thousand cubic feet per day 124,523 124,927 91,526 114,772 115,957 108,679 91,053 97,510 Price (Cdn$ per Mcf)(1) 4.62 3.21 2.47 2.23 2.54 3.28 2.42 2.64 Condensate production Barrels per day 2,405 2,502 1,637 2,305 2,623 2,416 1,856 2,081 Price (Cdn$ per barrel)(1) 70.54 52.04 46.79 25.92 60.66 66.56 63.45 71.12 NGL production Barrels per day 2,752 2,662 2,136 2,501 1,998 1,846 1,564 1,591 Price (Cdn$ per barrel)(1) 26.79 16.41 10.95 6.23 3.27 6.11 2.29 4.87 Wells drilled (net) 1.5 3.0 4.0 - 1.0 - 1.0 - Wells completed (net) 3.0 4.0 - - 3.5 - 5.0 -
QUARTERY SUMMARIES

27
Condensed Interim Consolidated Statements of Financial Position
(Canadian $000s) (unaudited) Notes March 31, 2021 December 31, 2020
ASSETS Current Accounts receivable 12 $ 27,330 $ 19,283 Prepaids and deposits 2,570 1,124 29,900 20,407 Risk management contracts 12 - 233 Exploration and evaluation 3 98,719 98,886 Property and equipment 4 518,206 508,524 Right-of-use asset 7 2,111 2,220 $ 648,936 $ 630,270
LIABILITIES AND SHAREHOLDERS' EQUITY Current Accounts payable and accrued liabilities $ 33,312 $ 17,721 Current portion of decommissioning liability 8 1,435 1,939 Current portion of lease liability 7 514 512 Risk management contracts 12 16,454 8,483 51,715 28,655 Bank indebtedness 5 116,609 134,391 Risk management contracts 12 550 101 Lease liability 7 1,749 1,850 Decommissioning liability 8 27,903 30,915 Deferred income taxes 14,968 10,823 $ 213,494 $ 206,735 Shareholders' equity Share capital 9 391,933 391,752 Contributed surplus 10 19,915 19,338 Retained earnings 23,594 12,445 $ 435,442 $ 423,535 Commitments 14 $ 648,936 $ 630,270
See accompanying notes to the condensed interim consolidated financial statements. On behalf of the Board:
Director
Director
CONDENSED INTERIM CONSOLIDATED FINANCIAL STATEMENTS

28
Condensed Interim Consolidated Statements of Income and Comprehensive Income
(Canadian $000s except per-share amounts) (unaudited) Notes
Three Months Ended March 31, 2021
Three Months Ended March 31, 2020
Revenue
Revenue from product sales 6 $ 73,674 $ 41,923
Royalties (5,907) (2,107) 67,767 39,816
Realized gain (loss) on risk management contracts 12 (5,256) 2,737
$ 62,511 $ 42,553
Expenses
Production 9,981 11,259
Transportation 11,553 10,834
General and administrative 1,816 1,867
Share-based compensation 10 626 476
Depletion and depreciation 4, 7 12,066 12,005
Exploration and evaluation costs expensed 3 331 450
Accretion 8 92 105
Interest and finance costs 2,099 1,646
Unrealized (gain) loss on risk management contracts 12 8,653 (10,477)
Unrealized revaluation loss on investment - 18 47,217 28,183 Net income and comprehensive income before income taxes 15,294 14,370 Deferred income tax expense 4,145 3,858
Net income and comprehensive income $ 11,149 $ 10,512
Net income per share - Basic and diluted 11 $ 0.09 $ 0.09
See accompanying notes to the condensed interim consolidated financial statements.

29
Condensed Interim Consolidated Statements of Changes in Shareholders’ Equity
(Canadian $000s) (unaudited) Three Months Ended March 31, 2021
Notes Share Capital Contributed
Surplus Retained Earnings Total Equity
Balance, beginning of period $ 391,752 $ 19,338 $ 12,445 $ 423,535 Net income for the period - - 11,149 11,149 Issue of common shares 9 132 - - 132 Share-based compensation 10 - 626 - 626 Share-based compensation on stock options exercised 9 49 (49) - - Balance, end of period $ 391,933 $ 19,915 $ 23,594 $ 435,442
(Canadian $000s) (unaudited) Three Months Ended March 31, 2020
Notes Share Capital Contributed
Surplus Retained Earnings Total Equity
Balance, beginning of period $ 391,444 $ 17,605 $ 12,659 $ 421,708 Net income for the period - - 10,512 10,512 Share-based compensation 10 - 476 - 476 Balance, end of period $ 391,444 $ 18,081 $ 23,171 $ 432,696
See accompanying notes to the condensed interim consolidated financial statements.

30
Condensed Interim Consolidated Statements of Cash Flows
(Canadian $000s) (unaudited)
Notes
Three Months Ended March 31, 2021
Three Months Ended March 31, 2020
Operating activities
Net income for the period $ 11,149 $ 10,512 Non-cash items: Unrealized (gain) loss on risk management 12 8,653 (10,477) Depletion, depreciation and accretion 4, 7, 8 12,158 12,110 Share-based compensation 10 626 476 Lease interest 7 29 34 Exploration and evaluation costs expensed 3 331 450 Unrealized revaluation loss on investment - 18 Deferred income tax expense 4,145 3,858 Decommissioning expenditures 8 (559) (92) Funds flow 36,532 16,889 Net change in non-cash working capital items 13 1,897 (472) 38,429 16,417 Financing activities Payment on lease liability 7 (128) (127) Proceeds from issue of common shares 9 132 - Increase (decrease) in bank indebtedness (17,782) 3,216 (17,778) 3,089 Investing activities
Additions to property and equipment 4 (24,608) (26,242) Additions to exploration and evaluation assets 3 (244) (233) Net change in non-cash working capital items 13 4,201 6,969 (20,651) (19,506) Change in cash during the period - - Cash, beginning of period - - Cash, end of period $ - $ -
See accompanying notes to the condensed interim consolidated financial statements.

31
As at March 31, 2021 and December 31, 2020 and for the three months ended March 31, 2021 and 2020 Tabular amounts in thousands of Canadian dollars, except per-share amounts (unaudited) 1. REPORTING ENTITY Storm Resources Ltd. (the “Company” or "Storm"), is a crude oil and natural gas exploration and development company incorporated in the province of Alberta, Canada on June 8, 2010 and is listed on the TSX under the symbol “SRX”. The Company operates primarily in the province of British Columbia and its head office is located at Suite 600, 215 – 2nd Street S.W., Calgary, Alberta T2P 1M4. The Company became a reporting issuer in August 2010. These unaudited condensed interim consolidated financial statements (the “financial statements”) include the accounts of Storm and its wholly owned subsidiary, Storm Gas Resource Corp. All inter-entity transactions have been eliminated upon consolidation. Storm’s operations are viewed as a single operating segment by the chief decision maker of the Company for the purpose of resource allocation and assessing asset performance. 2. BASIS OF PRESENTATION Statement of Compliance The financial statements have been prepared in accordance with International Accounting Standard (“IAS”) 34 “Interim Financial Reporting” using accounting policies consistent with International Financial Reporting Standards (“IFRS”) as issued by the International Accounting Standards Board (“IASB”). Certain information and disclosures normally included in the notes to the consolidated financial statements have been condensed or have been disclosed on an annual basis only. Accordingly, these condensed interim consolidated financial statements should be read in conjunction with the Company’s audited consolidated financial statements as at and for the year ended December 31, 2020. All financial information is reported in thousands of Canadian dollars, which is the functional currency of the Company. These financial statements were authorized for issue by the Board of Directors on May 12, 2021. Basis of Measurement The Company’s financial statements have been prepared on a going concern basis consistent with prior years, and follow the historical cost convention, except for certain financial assets and financial liabilities, which are measured at fair value, as explained in Note 12. Significant Accounting Judgments, Estimates and Assumptions The preparation of the financial statements in accordance with IFRS requires management to make judgments, estimates and assumptions that affect the reported amounts of assets, liabilities, shareholders' equity, revenue and expenses. Actual results may differ from these estimates. Estimates and underlying assumptions are continuously reviewed with the financial statement effect being recognized in the reporting period that the changes to estimates are made. Critical judgments applied by management to accounting policies that have the most significant effect on the amounts in the financial statements are described in Note 4 to the Company’s audited consolidated financial statements for the year ended December 31, 2020. The continued global impact of the COVID-19 pandemic contributes to economic uncertainty, with more volatile commodity prices, currency exchange rates and interest rates. The duration and severity of the business disruptions and continued reduction in consumer activity internationally and the resulting financial effect is difficult to reliably estimate. The results of the economic downturn and any potential resulting direct or indirect effect on the Company has been considered in management’s estimates at period end. However, there could be further prospective material effects in future periods.
NOTES TO THE CONDENSED INTERIM CONSOLIDATED FINANCIAL STATEMENTS
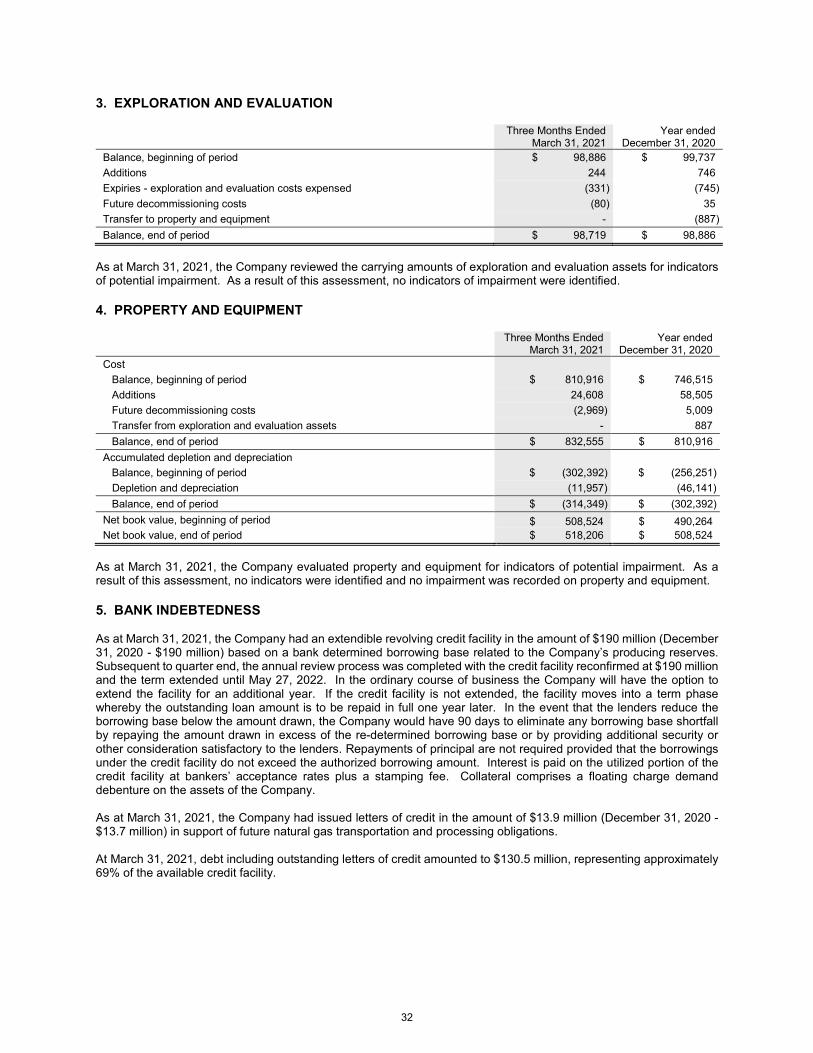
32
3. EXPLORATION AND EVALUATION
Three Months Ended March 31, 2021
Year ended December 31, 2020
Balance, beginning of period $ 98,886 $ 99,737 Additions 244 746 Expiries - exploration and evaluation costs expensed (331) (745) Future decommissioning costs (80) 35 Transfer to property and equipment - (887) Balance, end of period $ 98,719 $ 98,886
As at March 31, 2021, the Company reviewed the carrying amounts of exploration and evaluation assets for indicators of potential impairment. As a result of this assessment, no indicators of impairment were identified. 4. PROPERTY AND EQUIPMENT
Three Months Ended March 31, 2021
Year ended December 31, 2020
Cost Balance, beginning of period $ 810,916 $ 746,515 Additions 24,608 58,505 Future decommissioning costs (2,969) 5,009 Transfer from exploration and evaluation assets - 887 Balance, end of period $ 832,555 $ 810,916 Accumulated depletion and depreciation Balance, beginning of period $ (302,392) $ (256,251) Depletion and depreciation (11,957) (46,141) Balance, end of period $ (314,349) $ (302,392) Net book value, beginning of period $ 508,524 $ 490,264 Net book value, end of period $ 518,206 $ 508,524
As at March 31, 2021, the Company evaluated property and equipment for indicators of potential impairment. As a result of this assessment, no indicators were identified and no impairment was recorded on property and equipment. 5. BANK INDEBTEDNESS As at March 31, 2021, the Company had an extendible revolving credit facility in the amount of $190 million (December 31, 2020 - $190 million) based on a bank determined borrowing base related to the Company’s producing reserves. Subsequent to quarter end, the annual review process was completed with the credit facility reconfirmed at $190 million and the term extended until May 27, 2022. In the ordinary course of business the Company will have the option to extend the facility for an additional year. If the credit facility is not extended, the facility moves into a term phase whereby the outstanding loan amount is to be repaid in full one year later. In the event that the lenders reduce the borrowing base below the amount drawn, the Company would have 90 days to eliminate any borrowing base shortfall by repaying the amount drawn in excess of the re-determined borrowing base or by providing additional security or other consideration satisfactory to the lenders. Repayments of principal are not required provided that the borrowings under the credit facility do not exceed the authorized borrowing amount. Interest is paid on the utilized portion of the credit facility at bankers’ acceptance rates plus a stamping fee. Collateral comprises a floating charge demand debenture on the assets of the Company. As at March 31, 2021, the Company had issued letters of credit in the amount of $13.9 million (December 31, 2020 - $13.7 million) in support of future natural gas transportation and processing obligations. At March 31, 2021, debt including outstanding letters of credit amounted to $130.5 million, representing approximately 69% of the available credit facility.

33
6. REVENUE FROM PRODUCT SALES The following table presents the Company’s revenue from product sales disaggregated by revenue source:
Three Months Ended March 31, 2021
Three Months Ended March 31, 2020
Natural gas $ 51,771 $ 26,850 Condensate 15,268 14,478 NGL 6,635 595 Total $ 73,674 $ 41,923
Storm’s revenue was generated mostly in British Columbia where production was sold primarily to three major energy customers with investment grade credit ratings which accounted for 88% of the Company’s total revenue from product sales for the three months ended March 31, 2021 (March 31, 2020 - 98%). The majority of revenue is derived from variable price contracts based on index prices at each sales point. Of total natural gas revenue for the three months ended March 31, 2021, 48% received Chicago pricing, 30% received BC Station 2 pricing, 18% received AECO pricing and the remaining 4% received ATP pricing. 7. RIGHT-OF-USE ASSET AND LEASE LIABILITY Right-of-Use Asset The following table provides a reconciliation of the carrying amount of the right-of-use asset pertaining to the Company’s corporate office lease in Calgary:
Three Months Ended March 31, 2021
Year ended December 31, 2020
Cost Balance, beginning of period $ 3,094 $ 3,094 Additions - - Balance, end of period $ 3,094 $ 3,094 Accumulated depreciation Balance, beginning of period $ (874) $ (437) Depreciation (109) (437) Balance, end of period $ (983) $ (874) Net book value, beginning of period $ 2,220 $ 2,657 Net book value, end of period $ 2,111 $ 2,220
As at March 31, 2021, the net book value of the right-of-use asset for the Company’s corporate office lease in Calgary is $2.1 million (December 31, 2020 - $2.2 million) with a remaining lease term to the year 2026. Lease Liability The following table provides a reconciliation of the carrying amount of the liability pertaining to the Company’s corporate office lease in Calgary:
Three Months Ended
March 31, 2021 Year Ended
December 31, 2020 Balance, beginning of period $ 2,362 $ 2,741 Lease payments (128) (507) Lease interest 29 128 Balance, end of period $ 2,263 $ 2,362 Less current portion 514 512 Long-term portion $ 1,749 $ 1,850
The lease liability was measured at the present value of the remaining lease payments discounted at the Company’s weighted average incremental borrowing rate of 5%. As at March 31, 2021, the total undiscounted amount of the estimated future cash flows to settle the Company’s lease liability over the remaining lease term is $2.6 million.

34
Short-term leases are leases with a lease term of twelve months or less. During the three months ended March 31, 2021, short-term lease costs of approximately $0.5 million (March 31, 2020 - $0.5 million) were incurred primarily relating to the lease of drilling equipment which was captured within property and equipment costs. 8. DECOMMISSIONING LIABILITY The Company provides for the future cost of decommissioning crude oil and natural gas production assets, including well sites, gathering systems and facilities. The total decommissioning liability is estimated based on the Company’s net ownership interest in wells and facilities, the estimated costs to abandon and reclaim the wells, gathering systems and facilities and the estimated timing of future costs. The total estimated inflated and undiscounted liability required to settle the Company’s decommissioning obligation is approximately $42.7 million (December 31, 2020 - $40.5 million), with the majority of payments being made in the years 2034 to 2054. A risk-free discount rate of 2.0% (December 31, 2020 - 1.2%) and an inflation rate of 1.7% (December 31, 2020 - 1.5%) was used to calculate the present value of the decommissioning obligation, amounting to $29.3 million at March 31, 2021. The following table provides a reconciliation of the carrying amount of the obligation:
Three Months Ended
March 31, 2021 Year Ended
December 31, 2020 Balance, beginning of period $ 32,854 $ 28,115 Obligations incurred 210 1,282 Obligations settled (559) (643) Change in estimates(1) (3,259) 3,762 Accretion expense 92 338 Balance, end of period $ 29,338 $ 32,854 Less current portion 1,435 1,939 Long-term portion $ 27,903 $ 30,915
(1) Relates to changes in risk-free discount rates, inflation rates and estimated settlement dates.
9. SHARE CAPITAL Authorized An unlimited number of voting common shares without nominal or par value An unlimited number of first preferred shares without nominal or par value Issued
Number of Common Shares Consideration Balance as at December 31, 2020 121,688,812 $ 391,752,485 Shares issued on stock option exercises 80,500 180,490 Balance as at March 31, 2021 121,769,312 $ 391,932,975
During the first quarter of 2021, 80,500 common shares were issued upon the exercise of stock options for proceeds of $131,800 and related prior period share-based compensation of $48,690 was transferred to share capital from contributed surplus. For the period from April 1, 2021 to May 12, 2021, the date of this report, there were 29,500 common shares issued upon the exercise of stock options for proceeds of $43,660. 10. SHARE-BASED COMPENSATION Stock Options The Company has a stock option plan under which it may grant, at the Company’s discretion, options to purchase common shares to directors, officers and employees. Options are granted at the volume weighted average price of the shares on the TSX for the five trading days immediately preceding the date of grant, have a four-year term and vest in one-third tranches over three years. Under the stock option plan, at March 31, 2021, a total of 12,176,931 common

35
shares were available for issuance, options in respect of 9,977,830 common shares were issued and outstanding and options in respect of 2,199,101 common shares were available for future issue. At May 12, 2021, the date of this quarterly report, options in respect of 9,843,330 common shares were issued and outstanding and options in respect of 2,336,551 common shares are available for future issue. Details of the options outstanding at March 31, 2021 are as follows:
Number of Options
Weighted Average Exercise Price
Outstanding at December 31, 2020 10,192,330 $ 2.09 Granted during the period 99,000 $ 2.20 Exercised during the period (80,500) $ 1.64 Cancelled/forfeited during the period (88,000) $ 2.86 Expired during the period (145,000) $ 4.46 Outstanding at March 31, 2021 9,977,830 $ 2.05 Number exercisable at March 31, 2021 4,792,896 $ 2.32
Range of Exercise Price Outstanding Options Exercisable Options
Number of Options
Outstanding
Weighted Average
Remaining Life (years)
Weighted Average Exercise
Price
Number of
Options Outstanding
Weighted Average Exercise
Price $1.11 - $1.70 2,904,200 2.7 $ 1.47 871,063 $ 1.49 $1.71 - $2.13 4,497,230 2.7 $ 1.94 1,492,733 $ 1.81 $2.14 - $4.15 2,576,400 0.9 $ 2.90 2,429,100 $ 2.92 Total 9,977,830 2.2 $ 2.05 4,792,896 $ 2.32
The fair value of employee stock options is measured using the Black-Scholes option pricing model. Measurement inputs include the share price on measurement date, exercise price of the instrument, expected volatility, forfeiture rate, weighted average expected life of the instruments (based on historical experience and general option holder behaviour), expected dividends and the risk-free interest rate (based on government bonds). The weighted average inputs used in the Black-Scholes pricing model to determine the fair value of the options granted during the three months ended March 31, 2021 of $0.78 per share include the following:
2021 Share price $2.13 - $2.35 Exercise price $2.13 - $2.35 Volatility 48% Forfeiture rate 2% Expected option life (years) 3.7 Risk-free interest rate 0.2% - 0.3%
Performance Awards and Director Share Awards The Company has a performance award incentive plan which authorizes the Board of Directors to grant performance awards to officers, employees, consultants or other service providers. Each performance award entitles the holder to an award value equal to the number of shares designated in the performance award grant, multiplied by a payout multiplier ranging from 0 to 1.5X which is dependent on the performance of the Company relative to predefined corporate performance measures for a particular period. The Company also has a director share award plan where each director share award entitles an eligible director to receive an award value equal to the number of shares designated in the director award grant. Performance awards and director share awards vest one-half on the second anniversary of the grant date and the remaining one-half on the third anniversary of the grant date. The Company, at its sole and absolute discretion, shall have the option of settling vested awards with common shares acquired in the market or by payment of the award value in cash, or by a combination thereof. The value of performance awards and director share awards is determined at the grant date based on the volume weighted average price of the shares on the TSX for the five trading days immediately preceding the date of grant.
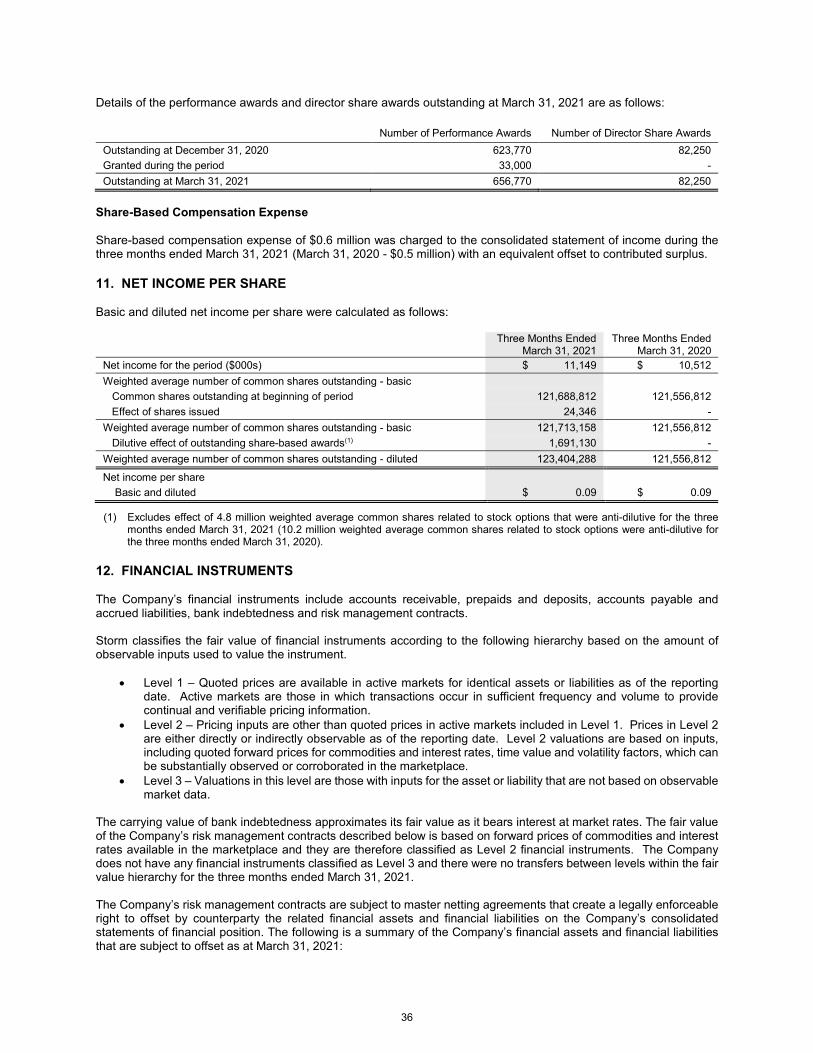
36
Details of the performance awards and director share awards outstanding at March 31, 2021 are as follows:
Number of Performance Awards Number of Director Share Awards Outstanding at December 31, 2020 623,770 82,250 Granted during the period 33,000 - Outstanding at March 31, 2021 656,770 82,250
Share-Based Compensation Expense Share-based compensation expense of $0.6 million was charged to the consolidated statement of income during the three months ended March 31, 2021 (March 31, 2020 - $0.5 million) with an equivalent offset to contributed surplus. 11. NET INCOME PER SHARE Basic and diluted net income per share were calculated as follows:
Three Months Ended March 31, 2021
Three Months Ended March 31, 2020
Net income for the period ($000s) $ 11,149 $ 10,512 Weighted average number of common shares outstanding - basic Common shares outstanding at beginning of period 121,688,812 121,556,812 Effect of shares issued 24,346 - Weighted average number of common shares outstanding - basic 121,713,158 121,556,812 Dilutive effect of outstanding share-based awards(1) 1,691,130 - Weighted average number of common shares outstanding - diluted 123,404,288 121,556,812
Net income per share Basic and diluted $ 0.09 $ 0.09
(1) Excludes effect of 4.8 million weighted average common shares related to stock options that were anti-dilutive for the three months ended March 31, 2021 (10.2 million weighted average common shares related to stock options were anti-dilutive for the three months ended March 31, 2020).
12. FINANCIAL INSTRUMENTS The Company’s financial instruments include accounts receivable, prepaids and deposits, accounts payable and accrued liabilities, bank indebtedness and risk management contracts. Storm classifies the fair value of financial instruments according to the following hierarchy based on the amount of observable inputs used to value the instrument.
• Level 1 – Quoted prices are available in active markets for identical assets or liabilities as of the reporting
date. Active markets are those in which transactions occur in sufficient frequency and volume to provide continual and verifiable pricing information.
• Level 2 – Pricing inputs are other than quoted prices in active markets included in Level 1. Prices in Level 2 are either directly or indirectly observable as of the reporting date. Level 2 valuations are based on inputs, including quoted forward prices for commodities and interest rates, time value and volatility factors, which can be substantially observed or corroborated in the marketplace.
• Level 3 – Valuations in this level are those with inputs for the asset or liability that are not based on observable market data.
The carrying value of bank indebtedness approximates its fair value as it bears interest at market rates. The fair value of the Company’s risk management contracts described below is based on forward prices of commodities and interest rates available in the marketplace and they are therefore classified as Level 2 financial instruments. The Company does not have any financial instruments classified as Level 3 and there were no transfers between levels within the fair value hierarchy for the three months ended March 31, 2021. The Company’s risk management contracts are subject to master netting agreements that create a legally enforceable right to offset by counterparty the related financial assets and financial liabilities on the Company’s consolidated statements of financial position. The following is a summary of the Company’s financial assets and financial liabilities that are subject to offset as at March 31, 2021:

37
Gross Amounts Recognized as Financial
Assets (Liabilities)
Gross Amounts of Financial Assets
(Liabilities) Offset
Net Amounts Recognized as Financial
Assets (Liabilities) Risk management contracts Current asset $ 2,833 $ (2,833) $ - Long-term asset 668 (668) - Current liability (19,287) 2,833 (16,454) Long-term liability (1,218) 668 (550) Net position $ (17,004) $ - $ (17,004)
The following is a summary of the Company’s financial assets and financial liabilities that were subject to offset as at December 31, 2020:
Gross Amounts Recognized as Financial
Assets (Liabilities)
Gross Amounts of Financial Assets
(Liabilities) Offset
Net Amounts Recognized as Financial
Assets (Liabilities) Risk management contracts Current asset $ 3,518 $ (3,518) $ - Long-term asset 1,511 (1,278) 233 Current liability (12,001) 3,518 (8,483) Long-term liability (1,379) 1,278 (101) Net position $ (8,351) $ - $ (8,351)
Accounts Receivable The Company’s accounts receivable tend to be concentrated with a limited number of marketers of the Company’s production as well as joint operation partners and are subject to normal industry credit risk. Receivables from crude oil and natural gas marketers are typically collected on or about the 25th of the following month. The Company's production is sold to organizations whose credit worthiness is in part assessable from publicly available information. As at March 31, 2021, the Company’s three major energy customers with investment grade credit ratings, accounted for $18.1 million of total receivables (March 31, 2020 - $10.4 million) and 88% of total revenues (March 31, 2020 - 98%). Where operations involve partners in a joint operation, the Company attempts to mitigate the risk from joint operation receivables by obtaining pre-approval from its partners in advance of significant capital expenditures. Receivables from joint operations are typically collected within one to three months of the joint operator bill being issued. As at March 31, 2021, there were no receivables outstanding for more than 60 days. No material default on outstanding receivables is anticipated as none of the Company’s outstanding receivables are considered past due at March 31, 2021. The maximum exposure to credit risk at March 31, 2021 was the carrying amount of accounts receivable of $27.3 million. No receivables were impaired at March 31, 2021. Commodity Price Risk The Company uses risk management contracts to manage its exposure to fluctuations in commodity prices by fixing prices of future deliveries of crude oil and natural gas and thus providing stability of funds flow. Although the Company had no crude oil production at March 31, 2021, part of its condensate and NGL stream is sold at a price based on crude oil. Accordingly, a financial investment based on crude oil is used as a proxy for the Company’s condensate and NGL stream. Fair values for risk management contracts are based on quotes received from financial institution counterparties and are calculated using current market rates and prices and option pricing models using forward pricing curves and implied volatility. At the date of this report, the Company had entered into the following outstanding financial risk management contracts in place to manage commodity price risk:
As at May 12, 2021 2021 2022 2023 Natural Gas NYMEX swap Mmbtu/d
US$/Mmbtu 3,165 $2.53
- -
- -
NYMEX swap Mmbtu/d Cdn$/Mmbtu
8,225 $3.33
- -
- -

38
As at May 12, 2021 2021 2022 2023 NYMEX collar Mmbtu/d
US$/Mmbtu 1,109
$2.72 - $3.30 3,425
$2.71 - $3.42 1,233
$2.50 - $3.15
NYMEX collar Mmbtu/d Cdn$/Mmbtu
1,775 $3.54 - $4.04
2,219 $3.53 - $4.14
- -
Chicago swap Mmbtu/d US$/Mmbtu
998 $3.11
16,829 $2.49
- -
Chicago swap Mmbtu/d Cdn$/Mmbtu
19,507 $3.10
2,282 $3.29
- -
AECO swap GJ/d Cdn$/GJ
10,451 $2.24
986 $2.91
- -
AECO collar GJ/d Cdn$/GJ
444 $2.70 - $3.25
1,981 $2.32 - $3.14
- -
BC Station 2 swap GJ/d Cdn$/GJ
26,215 $2.04
18,667 $2.27
- -
Natural Gas Differential Swaps NYMEX:Chicago Mmbtu/d
US$/Mmbtu 12,944 ($0.24)
3,425 $0.05
1,233 $0.11
NYMEX:Chicago Mmbtu/d Cdn$/Mmbtu
1,331 $0.07
2,219 $0.05
- -
AECO:BC Station 2 GJ/d Cdn$/GJ
1,996 ($0.09)
1,488 ($0.01)
- -
Crude Oil WTI swap Bbls/d
US$/Bbl - -
150 $51.43
- -
WTI swap Bbls/d Cdn$/Bbl
750 $53.68
- -
- -
WTI collar Bbls/d Cdn$/Bbl
1,000 $52.47 - $62.52
572 $60.46 - $73.27
- -
WTI collar Bbls/d US$/Bbl
134 $44.00 - $54.23
524 $49.38 - $60.45
- -
Crude Oil Differential Swaps WTI:C5 Bbls/d
Cdn$/Bbl 1,100
($3.76) 545
($1.92) - -
Propane Conway swap Bbls/d
Cdn$/Bbl 156
$36.96 - -
- -
Argus Far East Index swap Bbld/d Cdn$/Bbl
117 $46.31
- -
- -
Argus Far East Index swap Bbls/d US$/Bbl
117 $37.91
- -
- -
Physical Delivery Sales Contracts The Company also enters into physical delivery sales contracts from time to time to manage commodity price risk. These contracts are considered normal executory contracts and are not recognized in the consolidated statement of income and comprehensive income until volumes are delivered.
Daily Volume Contract Price Natural Gas Apr 2021 - Oct 2021 5,000 GJ at BC Station 2 AECO 7A less Cdn$0.125/GJ Apr 2021 - Oct 2021 6,000 GJ at ATP AECO 7A plus Cdn$0.00/GJ Nov 2021 - Oct 2022 6,000 GJ at ATP AECO 7A plus Cdn$0.115/GJ

39
Interest Rate Risk The Company may enter into interest rate swap contracts to manage the uncertainty of variable interest rates by fixing the variable component of a portion of the interest paid on the Company’s revolving bank facility. As at March 31, 2021, the Company had the following outstanding financial risk management contracts in place to manage interest rate risk:
Index Effective Date Notional Principal Remaining Term
Fixed Contract Rate
One-month bankers’ acceptance - CDOR(1) May 2019 $25 million Apr 2021 - May 2022 1.949% One-month bankers’ acceptance - CDOR(1) Jan 2020 $10 million Apr 2021 - Jan 2023 1.943% One-month bankers’ acceptance - CDOR(1) Jan 2021 $15 million Apr 2021 - Jan 2024 0.660%
(1) Canadian Dollar Offered Rate. Risk Management Risk management contracts may be used by the Company to manage exposure to market risks related to commodity prices, exchange rates and interest rates. The use of financial risk management contracts is governed by Storm’s Board of Directors and follows guidelines and limits approved by the Board. Storm does not use derivative contracts for speculative purposes. All derivative contracts are classified at fair value through profit and loss and measured at fair value, with gains and losses on re-measurement included as a component of unrealized risk management contracts in the period in which they arise. The fair market value of these risk management contracts at March 31, 2021 was a net liability position of $17.0 million (December 31, 2020 – net liability position of $8.4 million) and is included in current and non-current assets or current and non-current liabilities based on the contractual terms specific to the instruments. For the three months ended March 31, 2021, this resulted in an unrealized mark-to-market loss of $8.7 million (March 31, 2020 - unrealized mark-to-market gain of $10.5 million) when measured against the fair market value at the end of the preceding reporting period. These amounts are recognized in the consolidated statement of income and comprehensive income. The Company realized a loss from risk management price contracts in place in the amount of $5.3 million for the three months ended March 31, 2021 (March 31, 2020 - realized gain of $2.7 million). Sensitivities The following table summarizes the effects of movement in commodity prices and interest rates on net income due to changes in the fair value of risk management contracts in place at March 31, 2021. Changes in the fair value generally cannot be extrapolated because the relationship of a change in an assumption to the change in fair value may not be linear.
Three Months Ended March 31, 2021 Factor Gain/(Loss) Increase of US$5.00/Bbl in the price of WTI(1) $ (4,118) Decrease of US$5.00/Bbl in the price of WTI(1) $ 4,118 Increase of US$0.10/Mmbtu in the price of NYMEX natural gas $ (3,247) Decrease of US$0.10/Mmbtu in the price of NYMEX natural gas $ 3,247 Increase of 100 basis points (1%) in interest rates $ 901 Decrease of 100 basis points (1%) in interest rates $ (901)
(1) A portion of the Company’s condensate and NGL production is sold at a price based on WTI.

40
13. SUPPLEMENTAL CASH FLOW INFORMATION Changes in non-cash working capital
Three Months Ended March 31, 2021
Three Months Ended March 31, 2020
Accounts receivable $ (8,047) $ 1,449 Prepaids and deposits (1,446) 203 Accounts payable and accrued liabilities 15,591 4,845 Change in non-cash working capital $ 6,098 $ 6,497
Relating to: Operating activities $ 1,897 $ (472) Investing activities 4,201 6,969 Change in non-cash working capital $ 6,098 $ 6,497
Interest paid during the period $ 1,884 $ 1,569
Income taxes paid during the period $ - $ -
14. COMMITMENTS At March 31, 2021, the Company has the following long-term commitments over the next five years and thereafter:
2021 2022 2023 2024 2025 Thereafter Total Transportation and processing commitments
$ 48,323
$ 60,116
$ 28,064
$ 28,187
$ 27,905
$ 179,155
$ 371,750
Office lease(1) 267 356 356 356 356 30 1,721 Total $ 48,590 $ 60,472 $ 28,420 $ 28,543 $ 28,261 $ 179,185 $ 373,471
(1) Office lease commitment includes the operating cost component of the office lease costs.

41
Officers Brian Lavergne President & Chief Executive Officer Robert S. Tiberio Chief Operating Officer Michael J. Hearn Chief Financial Officer Emily Wignes Vice President, Finance
Jamie P. Conboy Vice President, Geology H. Darren Evans Vice President, Exploitation Bret A. Kimpton Vice President, Production
Directors Matthew J. Brister (2)(3) John A. Brussa Mark A. Butler (1)(3) Stuart G. Clark (1) Chairman Brian Lavergne President & Chief Executive Officer
Sheila A. Leggett (2) Gregory G. Turnbull (2) P. Grant Wierzba (2)(3) James K. Wilson (1)
(1) Member, Audit Committee (2) Member, Reserves, Environment, Health and Safety Committee (3) Member, Compensation, Governance and Nomination Committee Stock Exchange Listing Toronto Stock Exchange Trading Symbol “SRX” Solicitors Stikeman Elliott LLP Burnet Duckworth & Palmer LLP Calgary, Alberta Auditors Ernst & Young LLP Calgary, Alberta
Registrar & Transfer Agent Alliance Trust Company Calgary, Alberta Bankers ATB Financial Canadian Imperial Bank of Commerce Royal Bank of Canada Canadian Western Bank Calgary, Alberta Executive Offices Suite 600, 215 – 2nd Street S.W. Calgary, Alberta, T2P 1M4 Canada Tel: (403) 817-6145 Fax: (403) 817-6146 www.stormresourcesltd.com
CORPORATE INFORMATION

42
Abbreviations ATP Alliance Transfer Point Bbls Barrels of oil or natural gas liquids Bbls/d Barrels per day Bcf Billions of cubic feet Boe Barrels of oil equivalent Boe/d Barrels of oil equivalent per day Bopd Barrels of oil per day Btu British thermal unit Cdn$ Canadian dollar CGU Cash generating unit DPIIP Discovered Petroleum Initially in Place GJ Gigajoules GJ/d Gigajoules per day kPa Kilopascal LNG Liquefied natural gas
Mbbl Thousands of barrels Mboe Thousands of barrels of oil equivalent Mcf Thousands of cubic feet Mcf/d Thousands of cubic feet per day Mmbtu Millions of British Thermal Units Mmbtu/d Millions of British Thermal Units per day Mmcf Millions of cubic feet Mmcf/d Millions of cubic feet per day NGL Natural gas liquids NYMEX New York Mercantile Exchange OPEC Organization of Petroleum Exporting Countries PDP Proved developed producing (reserves) TSX Toronto Stock Exchange US United States US$ United States dollar WTI West Texas Intermediate

Storm Resources Ltd. Suite 600, 215 – 2nd Street S.W., Calgary, Alberta T2P 1M4 Phone: (403)817-6145 Fax: (403)817-6146 www.stormresourcesltd.com