budget 2008 21 february minister of finance. 2 budget highlights overall theme: –weathering the...
TRANSCRIPT

Budget 2008
21 FebruaryMinister of Finance

2
Budget highlights
• Overall theme:– Weathering the storm– Investing for growth
• Bullish macroeconomic outlook:– Downward revision in GDP growth– Confidence on underlying growth potential
• Strong spending growth with significant additions for:– Infrastructure and social services– Provision for support to Eskom
• Tax relief for individuals, companies and small businesses• Fiscal surplus that contributes towards:
– Increased savings– Cushioning the economy in the light of current account and
inflationary pressures
• Reforms that signal shift from exchange controls to prudential regulations

3
GDP and inflation forecasts
0
1
2
3
4
5
6
7
8
2004 2005 2006 2007 2008 2009 2010
Real GDP
CPIX inflation
Ann
ual c
hang
e
4
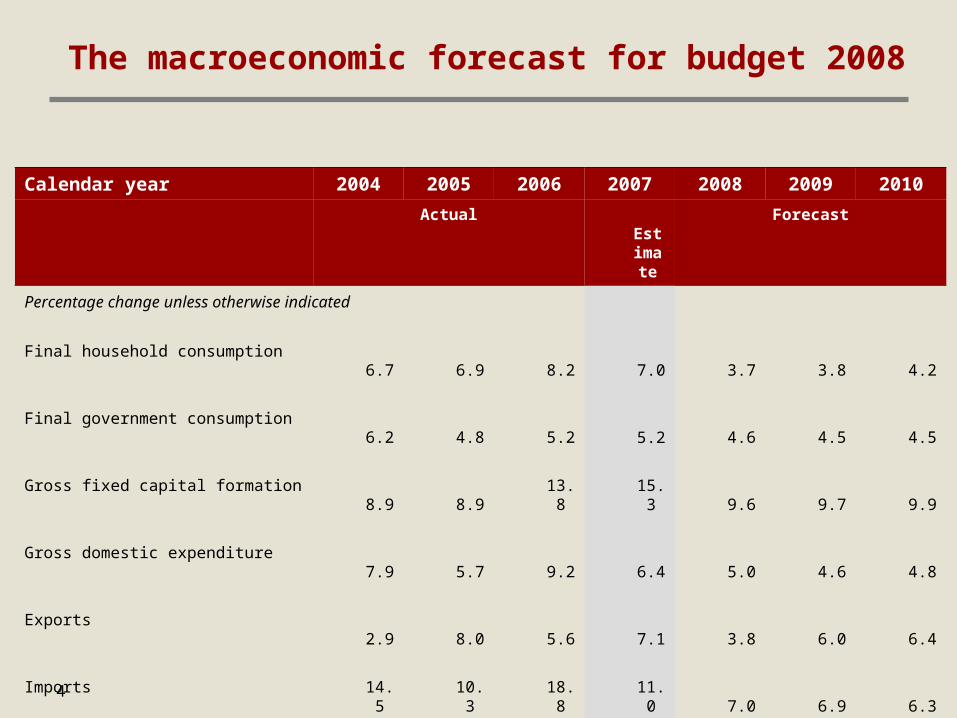
The macroeconomic forecast for budget 2008
Calendar year 2004 2005 2006 2007 2008 2009 2010
Actual Estimate Forecast
Percentage change unless otherwise indicated
Final household consumption 6.7 6.9 8.2 7.0 3.7 3.8 4.2
Final government consumption 6.2 4.8 5.2 5.2 4.6 4.5 4.5
Gross fixed capital formation 8.9 8.9 13.8 15.3 9.6 9.7 9.9
Gross domestic expenditure 7.9 5.7 9.2 6.4 5.0 4.6 4.8
Exports 2.9 8.0 5.6 7.1 3.8 6.0 6.4
Imports 14.5 10.3 18.8 11.0 7.0 6.9 6.3
Real GDP growth 4.9 5.0 5.4 5.0 4.0 4.2 4.6
GDP inflation 5.5 5.2 7.2 8.6 7.9 5.5 5.0
GDP at current prices (R billion) 1 395.4 1 541.1 1 741.1 1 986.1 2 229.8 2 449.1 2 691.2
CPIX inflation 4.3 3.9 4.6 6.5 7.1 4.9 4.7
Current account balance(percentage of GDP)
-3.2 -4.0 -6.5 -7.2 -7.3 -7.8 -8.0

5
GDP revisions from MTBPS
• GDP revisions driven by– Impact of electricity shortages on domestic industry– Slower global growth (assumption for G7 growth lowered by 0.4%)– Higher than expected inflation due to food and petrol
• Overall growth remains supported by– High commodity prices (assumptions upped by nearly 30%) and – Strong growth in real fixed capital formation (10% average over MTEF)
• Major impacts on the GDP growth revision can be summarised as follow:– Net loss due to electricity shortfall -0.48%– Impact of higher commodity prices +0.36%– Impact of slower global growth -0.25%– Other factors* -0.12%– Net impact on GDP growth -0.50%
* When compared to the MTBPS forecast, this includes the net impact of higher food and oil prices, GDP revisions by Stats SA and a marginally weaker exchange rate
• A more competitive rand may provide additional stimuli

6
Impact of electricity supply shock on the economy
• Peak electricity shortfall estimated at 6.3%, assuming– Eskom’s planned expansions– Flat electricity demand– Operating capacity of 85%
• Estimated impact about 1.46% of GDP in 2008
• But, this size of shortage is only applicable in winter for 3 months of year
• Adjusting for lower summer peak demand and January shutdowns, estimated GDP impact is -0.48%
• Overall impact depends on:– Success of demand management policies, and – Eskom’s ability to manage short and long-term supply constraints

7
Outlook for global growth has deteriorated
0
1
2
3
4
5
6
1995 1996 1997 1998 1999 2000 2001 2002 2003 2004 2005 2006 2007 2008
Per c
ent
World growthSA growth (NT estimates)

8
Inflation driven by food and oil shocks
• CPIX has been outside the inflation target range since April 2007
• Supply-side price pressures include
– High global prices for agricultural commodities
– Oil prices at record high levels
– High capacity utilisation in many sectors of the economy
– Average wage settlements above 8%
Major contributors to CPIX inflation
-1
2
4
6
8
10
12
14
2000 2001 2002 2003 2004 2005 2006 2007
Per
cen
t
Transport
Other
Food

9
Commodity prices support the terms of trade
• Unprecedented rise in commodity prices• Supply response has been very slow
• Over time prices must revert to long term average cost of production
• High prices cushion SA against disruptions to supply due to electricity outages
100
150
200
250
300
350
400
450
500
550
2002 2003 2004 2005 2006 2007 2008
Inde
x Ja
n 20
02 =
100
Crude oil priceGold pricePlatinum price

10
Investment remains a key driver of growth over MTEF
-5
0
5
10
15
20
25
30
35
2001 2002 2003 2004 2005 2006 2007
Ann
ual g
row
th ra
tes
General Government
Public corporations
Private business
General government
Public corporations
Private business
2001 -0.6 -0.4 4.72002 0.8 1.2 1.82003 1.3 2.2 5.72004 0.4 0.7 8.02005 -0.1 1.3 7.92006 1.9 1.8 10.12007 1.8 4.1 10.2
Weighted growth rates
**First nine months of 2007, weighted by sector’s share in total GDFI

11
Rising investment ratio requires higher domestic savings
-3
-2
-1
0
1
2
3
4
5
6
7
8
1980 1983 1986 1989 1992 1995 1998 2001 2004 2007*
Per c
ent
8
10
12
14
16
18
20
22
24
26
28
Per c
ent
GDP growth
Fixed investment to GDP (right axis)
* Estimate

12
Investment savings imbalance
10%
12%
14%
16%
18%
20%
22%
24%
26%
28%
30%
1981
Q1
1983
Q1
1985
Q1
1987
Q1
1989
Q1
1991
Q1
1993
Q1
1995
Q1
1997
Q1
1999
Q1
2001
Q1
2003
Q1
2005
Q1
2007
Q1
% o
f G
DP
Savings as a percentage of GDP
Investment as a percentage of GDP
Either we increase savings or we settle for lower investment/growth

13
High current account deficit is a vulnerability
Red bars reflect countries with similar credit rating to SA
-8.5
-7.2
-7.1
-6.0
-5.5
-5.4
-4.5
-3.6
-1.9
-1.3
-1.2
-0.6
0.5
1.0
3.4
3.8
4.7
6.8
9.2
10.5
-10 -5 0 5 10 15
New Zealand
South Africa (BBB+)
Turkey
Australia
Hungary (BBB+)
United States
Slovak Republic
Colombia
India
Developed markets
Mexico (BBB+)
Emerging Europe
Brazil
Latin America
Argentina
Emerging markets
Chile
Em Asia
Venezuela
China
per cent of GDP (2007 estimates)

14
Achieving and sustaining growth above 6%
Pattern of growth…
capacity + skills constraints = larger CA deficit and inflation
• Electricity shortage and global slowdown delays 6% growth target
• Imbalances must be addressed to position SA for global rebound– Fiscal space to ensure long-term financing of public investment– Investment to ease capacity constraints and improve exports– Reserve accumulation to reduce external vulnerability – IT to lower inflation and improve competitiveness– Microeconomic reforms (lower business costs, increased efficiency, market
failures, government services, trade reform)– Step up efforts in human capital formation
Important to be ambitious and realistic…
The BOP constraint… required intensified focus on export development via industrial
diversification and overall improvement in domestic savings.

15
From exchange controls to prudential regulation
• Prudential framework for institutional investors• Banks
– Prudential regulations for banks refined
– Macro-prudential limit set equal to 40% of banks liabilities
• Companies– Diversification supported through inward listing and rand currency
futures
– Pre approval removed for FDI up to R50 million per year
• Name change for Exchange Control Department to Financial Surveillance Department

16
Fiscal policy to sustain growth and employment
• Sustainable fiscal policy ensures:– Reduced pressure on inflation and the cost of capital
– Higher savings protect jobs and investment
– Efficient and effective spending… value for money & implementation
• Fiscal stance balances macro- and microeconomic objectives– Sustainable growth
– Development
– Employment creation
– Poverty reduction
– Reduced inequality
• Cyclical revenue factors

17
Fiscal stance remains prudent
• Consolidated national budget surplus moves from 0.8% of GDP (2008/09) to 0.6% (2009/10), and back to 0.7% (2010/11)
• Real growth in consolidated government expenditure averages 6.1% a year (real GDP growth 4.3%)
• Total resources available over BR 2007 baseline = R115.6 billion
Consolidated national government balance, 2006/07 – 2010/11
2006/07 2007/08 2008/09 2009/10 2010/11
R million / per cent Estimate Projections
Consolidated national budget
Revenue 501,636 580,417 650,026 720,134 788,980
percentage of GDP 27.8% 28.4% 28.4% 28.7% 28.6%
Expenditure 484,216 560,086 631,540 704,116 768,454
percentage of GDP 26.8% 27.4% 27.6% 28.1% 27.9%
Budget balance 17,420 20,331 18,486 16,018 20,526
percentage of GDP 1.0% 1.0% 0.8% 0.6% 0.7%
Gross domestic product 1,807,316 2,045,533 2,286,906 2,506,870 2,758,552

18
Main budget and structural budget balances
-2.5
-2.0
-1.5
-1.0
-0.5
0.0
0.5
1.0
2000
/01
2001
/02
2002
/03
2003
/04
2004
/05
2005
/06
2006
/07
2007
/08
2008
/09
2009
/10
2010
/11
Per c
ent G
DP
Actual balance Structural balance
Cyclical adjustment
* **
* forecast

19
Lower borrowing makes room for SOE borrowing
-20
-10
0
10
20
30
40
50
60
2003
/04
2004
/05
2005
/06
2006
/07
2007
/08
2008
/09
2009
/10
2010
/11
R b
illio
n
-20
-10
0
10
20
30
40
50
60
R b
illio
n
Non-financial public enterprises
Government
Government net domestic bond issuances (Right axis)

20
Revenue trends and tax proposals
• Tax revenue still buoyant, but growth slowing• Revenue for 2007/08 estimated to be R15 billion above
estimate and 15.2% over 2006/07 outcome• Growth in 2007/08 has been mainly in PIT (20% growth)• Main tax proposals (net effect R10.5 billion)
– R7.7 billion in personal income tax relief – Reduction in corporate income tax rate to 28%– 2nd phase of STC reforms– Reforms to small business taxes– Electricity sales tax of 2 cents per kWh– R5 billion in tax subsidies to support industrial incentives

21
Contribution to growth in tax revenue
•Total revenue up 15.2 per cent
•Revenue growth driven by CIT, VAT and PIT
0
1
2
3
4
5
6
7
Companies VAT
Individuals
Customs d
uties
STC
Genera
l fuel
levy
Specific
excis
e dutie
sOther
cont
ribut
ion
to g
row
th in
tax
reve
nue
2007
/08

22
Tax relief for individuals
R7.7 billion total tax relief for individuals:
• PIT relief – adjustments to tax brackets and tax rebate thresholds
• Individuals younger than 65 yrs earning < R46 000 p.a. pay no income tax
• Individuals 65 yrs and older earning < R74 000 p.a. pay no income tax
• Tax free interest income increased to:– R19 000 for individuals below 65 yrs of age– R27 500 for individuals above 65 yrs of age
• Tax free medical scheme contribution limits increased to R570 and R345
• Reforms to retirements saving contributions and the taxation of withdrawals from retirement funds.

23
Tax relief for businesses
Tax relief of R7.4 billion in 2008/09:
• Headline corporate income tax rate reduced to 28 per cent
• STC regime reformed to a dividend withholding tax system
• R5.0 billion over 3 years to support the government’s industrial strategy
• Simplified (turnover-based) presumptive tax system for very small businesses with an annual turnover below R1.0 million
• Compulsory VAT registration threshold raised from R300 000 to R1 million
• Extension of the UDZ tax incentive to March 2014
• Enhanced skills training (learnership) tax allowance for apprenticeships
• Enhanced incentives for low cost housing (ownership and rental)
• Enhanced bursary incentives to dependants of low income workers

24
Environmental protection
• Tax relief for protecting bio-diversity • Taking forward the work on Environmental Fiscal Reform
– Exploring the introduction of emission charges and taxes– Exploring tax incentive for cleaner production technologies– Review vehicle purchase taxes to consider environmental
criteria
• Introduction of a 2 cent per kWh electricity levy on electricity generated from non-renewable resources (e.g. coal , nuclear, gas & diesel)
• The levy will also support other demand side interventions to promote energy efficiency and reduce the energy intensity of the economy

25
Key spending areas
• Increased social spending, specifically in education and health
• Stepping up anti-poverty initiatives– Broadening social security
• Enhancing job creation and productive capacity of the economy
• Speeding up the pace of land and agrarian reform• Further investment in infrastructure• Enhancing state machinery for improved civic &
immigration services & to address crime
* Following slides deal with additional allocations

26
Additional allocations per cluster
Central gov administration
5%
Financial and admin services
6%
Justice and protection services
18%
Economic services and infrastructure
34%Social services
37%

27
Social security reforms
• Child Support Grant extended from 14 up to 15 years; conditionalities being considered
• Qualifying age for old age grant - phasing down of the qualifying age for men to 60 over the MTEF period:
– Age 63-64 April 2008 – Age 61-62 April 2009– Age 60 April 2010
• Raising of means tests (disability, old age grants) under consideration
• Above inflation grant increases– R70 to R940 a month for OAG and disability (8%)– R10 in April and R10 in October to R220 a month for CSG (7.5%)
• These changes budget to cost an additional R12 billion over 3 years
• SASSA administrative reforms under way
• Broader social security reforms entering design phase

28
Infrastructure, economic and admin services
• Infrastructure and economic services– Municipal infrastructure - R3.8 billion, provincial infrastructure - R2.7
billion
– Investments in buses, taxi recapitalisation, roads and rail - R3.9 billion
– Public transport infrastructure and systems - R2 billion
– Digital television & internet infrastructure - R984 million
– Industrial development – R2.3 billion
– Expanded Public Works – R1 billion
– Land restitution and distribution R1.9 billion and agric support R500m
– Human capital development and R&D – R760 million
– PBMR – R3.5 billion
– R60 billion provision to support Eskom over five years
• Admin services– Military skills development and defence infrastructure - R1.4 billion
– Home Affairs turn around strategy – R1.5 billion
– R1.2 billion for SARS - customs and systems improvements
– R717 million for the construction of Pan African Parliament building
29
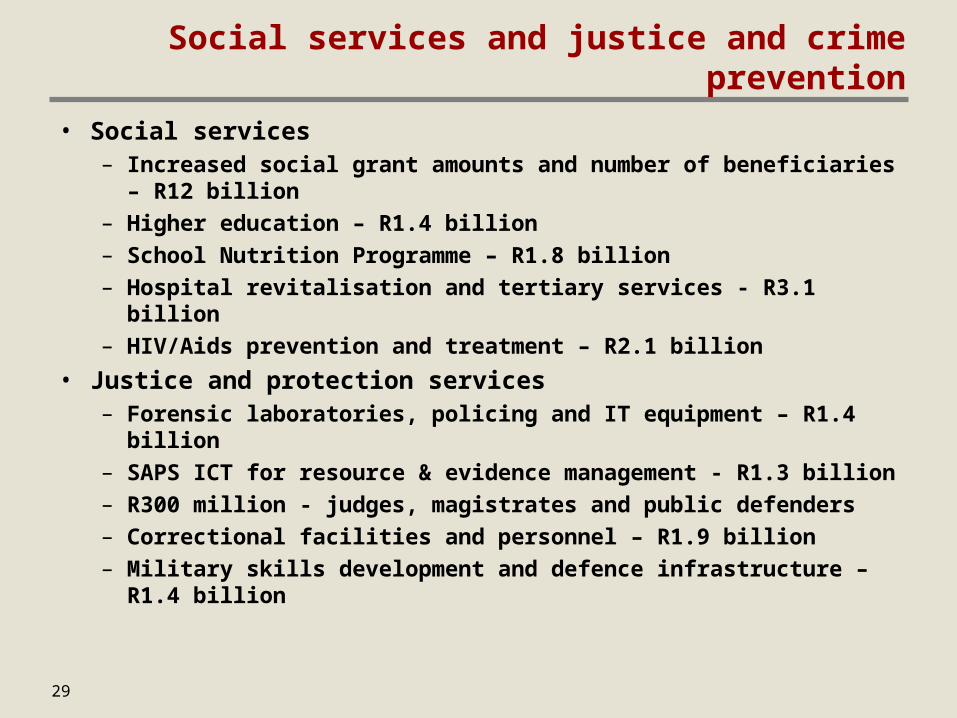
Social services and justice and crime prevention
• Social services– Increased social grant amounts and number of beneficiaries –
R12 billion– Higher education – R1.4 billion– School Nutrition Programme – R1.8 billion– Hospital revitalisation and tertiary services - R3.1 billion– HIV/Aids prevention and treatment – R2.1 billion
• Justice and protection services– Forensic laboratories, policing and IT equipment – R1.4 billion– SAPS ICT for resource & evidence management - R1.3 billion – R300 million - judges, magistrates and public defenders– Correctional facilities and personnel – R1.9 billion– Military skills development and defence infrastructure –
R1.4 billion

30
Provincial priorities
• R45.7 billion added to provincial share– R33.2 billion to the equitable share and R12.5 billion to conditional grants
• Personnel adjustments– Interventions to recruit and retain social services personnel– 2007 wage agreement, including OSD for educators, health professionals, social workers
• In education– Grade R and ECD– Learners with special needs (inclusive education)– Learner support materials for grades 10 to 12 (NSM)– Education infrastructure needs
• In health– General baseline adjustment to stabilise the public health system– TB (MDR and XDR)– Comprehensive HIV and Aids strategy (preventative, HBC and ARVs)– Hospital revitalisation
• In social development– ECD (in collaboration with education)– Secure care services for children in conflict with the law– Access home and community based care
• Roads, agriculture and SMME development• Housing and human settlements
31
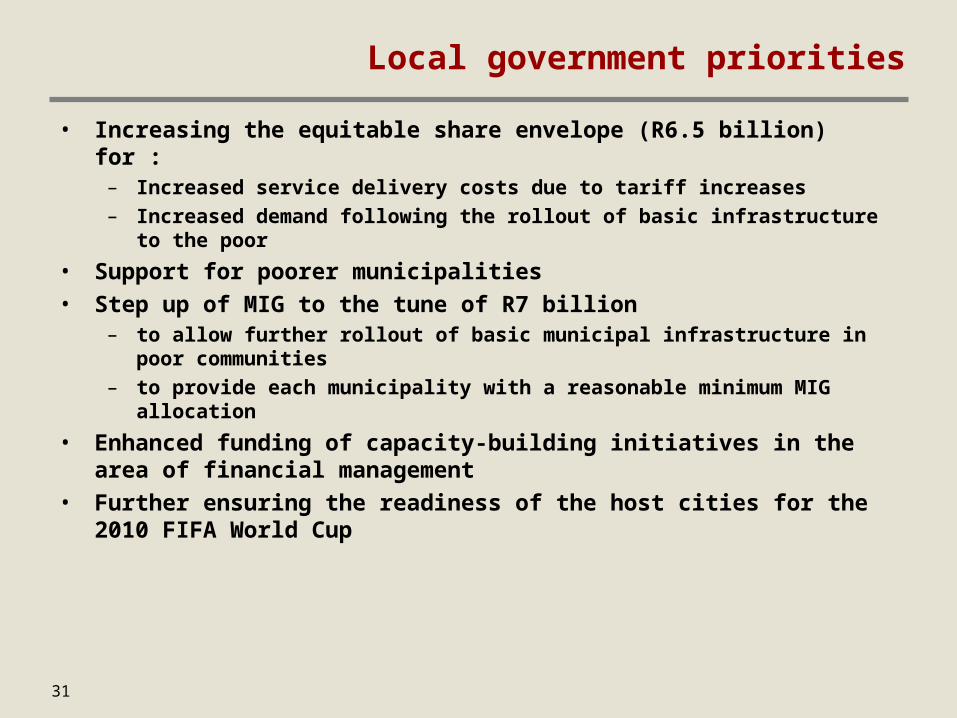
Local government priorities
• Increasing the equitable share envelope (R6.5 billion) for : – Increased service delivery costs due to tariff increases– Increased demand following the rollout of basic infrastructure to the poor
• Support for poorer municipalities
• Step up of MIG to the tune of R7 billion– to allow further rollout of basic municipal infrastructure in poor communities– to provide each municipality with a reasonable minimum MIG allocation
• Enhanced funding of capacity-building initiatives in the area of financial management
• Further ensuring the readiness of the host cities for the 2010 FIFA World Cup

32
Conclusion
• Budget focuses on investing to raise long term growth
• We’re protected from the storm, growth will slow but no chance of recession
• Economic foundation strong• Spending growth slows but still healthy, mainly on
infrastructure and social services• Fiscal balance in surplus, providing cushioning
effect against inflation and current account deficit• Tax measures support investment, growth and
jobs