highlights - konten.telkom.co.id · largest revenue contributor, ... non-controlling interest...
TRANSCRIPT
F I R S T Q U A R T E R O F 2 0 1 8 R E S U L T S ( U N A U D I T E D )
TICKERS:
IDX : TLKM
NYSE : TLK
SHAREHOLDER COMPOSITION:
Government of Indonesia : 52.1%
Public : 47.9%
Excl. Treasury stock : 1,737,779,800 shares.
Investor Relations
PT Telkom Indonesia (Persero) Tbk
Telkom Landmark Tower, 39th Floor
Jl. Gatot Subroto Kav. 52, Jakarta 12710
Phone : 62 21 5215109
Fax : 62 21 5220500
Email : [email protected]
Website : www.telkom.co.id
DISCLAIMER
This document contains financial conditions and result of operation, and may also contain certain projections, plans, strategies,
and objectives of the Company, which would be treated as forward-looking statements within the meaning of applicable law.
Forward looking statements, by their nature, involve risk and uncertainty that could cause actual results and development to differ
materially from those expressed or implied in these statements. Telkom Indonesia does not guarantee that any action, which may
have been taken in reliance on this document, will bring specific results as expected.
Highlights
Telkom Indonesia recorded 4.3% growth in revenue amidst tight competition in telco industry.
Data, Internet & IT Services segment remained the growth driver and largest revenue contributor, increased by 23.3% YoY and representing 49.2% of total revenue.
Telkomsel remained focus on growing its digital business and providing excellent customer experience, by installing 6,944 new BTSs during 1Q18, all were 4G BTS.
Financial Highlights
Operational Highlights
*The figure does not represent the official registered numbers
FINANCIAL PERFORMANCE
Revenue
(in Rp. Bn)
TLKM Share Performance YTD 2018
Share Price (30 Apr, 2018):
Rp3,830 (IDX) & USD27.18 (NYSE)
Market Capitalization (30 Apr, 2018):
Rp386.1 Tn (USD27.4 Bn)
Average Daily Trading Volume 2018:
96.4 Mn Shares (IDX) & 404,952 DR (NYSE)
Average Daily Trading Value 2018:
Rp379.4 Bn (IDX) & USD11.7 Mn (NYSE)
Source: Bloomberg
Key Indicators (Rp. Bn)
YoY
1Q18 1Q17 Growth (%)
Revenues 32,343 31,022 4.3
Expenses 21,465 18,531 15.8
Operating Profit 10,878 12,491 (12.9)
EBITDA 16,116 16,809 (4.1)
EBITDA Margin (%) 49.8 54.2 (4.4ppt)
Net Income 5,734 6,688 (14.3)
Net Income Margin (%) 17.7 21.6 (3.9ppt)
Subscribers (000) YoY
1Q18 1Q17 Growth (%)
Broadband
Fixed Broadband 5,740 4,399 30.5
IndiHome 3,501 1,778 97.0
Mobile Data User 108,733 89,640 21.3
Cellular
Postpaid 5,074 4,205 20.7
Prepaid 187,678 165,163 13.6
Total 192,752* 169,368 13.8

2
FIRST QUARTER OF 2018 (UNAUDITED)
PT TELKOM INDONESIA (PERSERO) Tbk FIRST QUARTER OF 2018 (UNAUDITED)
The following analysis and discussion is based on our Indonesian GAAP financial statements for the first quarter ended March 31, 2018 and 2017. The reports have been submitted to Indonesia Financial Services Authority (OJK).
Revenues
Key Indicators (Rp.Bn)
YoY
1Q18 1Q17 Growth (%)
Data, Internet & IT Service 15,921 12,917 23.3
Cellular Voice and SMS 10,709 12,995 (17.6)
Fixed Line Voice 1,546 1,866 (17.1)
Interconnection 1,173 1,270 (7.6)
Network and Other Telco Services 2,994 1,974 51.7
Total 32,343 31,022 4.3
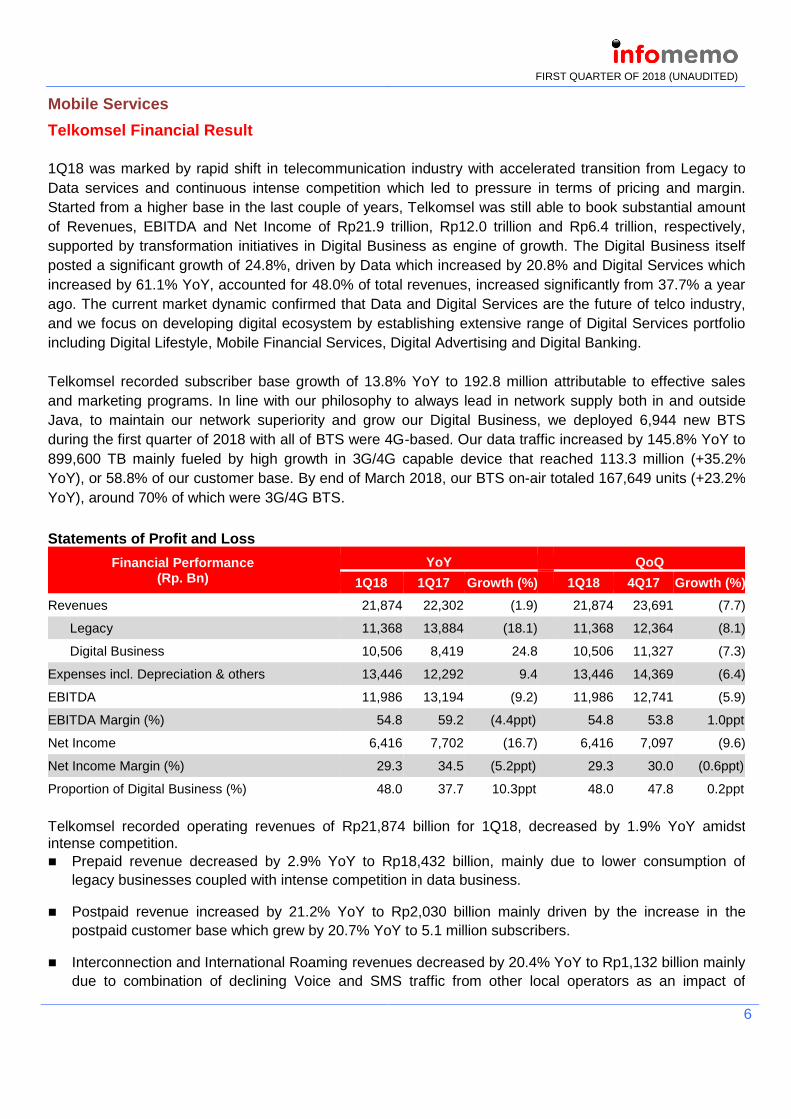
Telkom recorded total revenue of Rp32.3 trillion in the first quarter of 2018, an increase of 4.3% YoY with Data, Internet & IT Services as the growth driver. The details are as follows:
Data, Internet & IT Services revenues increased significantly by 23.3% YoY primarily attributable to strong mobile and fixed broadband services. Mobile data traffic (payload) increased more than double, while IndiHome customers nearly doubled.
Cellular Voice and SMS revenues decreased by 17.6% YoY. The decline in legacy businesses was a result of traffic decline in both voice and SMS due to cannibalization from instant messaging (OTT) applications.
Fixed Line Voice revenues declined by 17.1% YoY due to cannibalization from mobile services that resulted in declining fixed line traffic.
Interconnection revenues decreased by 7.6% YoY mainly due to lower incoming voice and SMS from other operators.
Network and Other Telecommunication Services revenues grew by 51.7% YoY mainly due to higher business volume in managed services.

3
FIRST QUARTER OF 2018 (UNAUDITED)
Expenses
Key Indicators (Rp.Bn)
YoY
1Q18 1Q17 Growth (%)
Operation, Maintenance & Telecommunication Services 10,244 8,298 23.5
Personnel 3,035 2,977 1.9
Interconnection 828 727 13.9
Marketing 870 985 (11.7)
General & Administrative 1,250 1,226 2.0
Depreciation & Amortization 5,373 4,773 12.6
Loss on Forex – net 5 50 (90.0)
Others – net (140) (505) (72.3)
Total 21,465 18,531 15.8
Total Expenses increased by 15.8% YoY, with Operating Expenses rose by 14.2% YoY. Details of Expenses are as follows:
Operation & Maintenance (“O&M”) expenses increased by 23.5% YoY as we continued to develop broadband infrastructure aggressively in an effort to grow digital business both in cellular and fixed-line services.
Personnel expenses increased slightly by 1.9% YoY in line with annual salary increase and company’s performance.
Interconnection expenses rose by 13.9% YoY mainly attributable to higher outgoing off-net traffic.
Marketing expenses declined by 11.7% YoY primarily due to more efficient and targeted promotional and advertising activities during the period.
General & Administrative expenses increased by 2.0% YoY in line with increasing business volume.
Depreciation & Amortization expenses grew by 12.6% YoY in line with the network infrastructure development both in mobile and fixed businesses.
We recorded small Net Forex Loss of Rp5 billion reflecting that Telkom is less exposed to foreign currency fluctuation.
Others – net recorded an income of Rp140 billion, decreased by 72.3% from lower non-operating income during the period.
EBITDA and Net Income
Our EBITDA and Net Income declined by 4.1% YoY and 14.3% YoY respectively as we continued to
deploy broadband infrastructure that resulted in significant growth in O&M charges.

4
FIRST QUARTER OF 2018 (UNAUDITED)
Financial Position
Key Indicators (Rp.Bn)
YoY
1Q18 FY17 Growth (%)
Assets 206,600 198,484 4.1
Liabilities 86,459 86,354 0.1
Non-controlling Interests 21,648 19,417 11.5
Equity attributable to owners of the company 98,493 92,713 6.2
Total assets as of 31 March 2018 was Rp206.6 trillion, increased by 4.1% YoY mainly due to increase in
cash and cash equivalents, receivables, and advanced payment.
Total liabilities at end of March 2018, was flat of Rp86.5 trillion.
Non-controlling interest increased by 11.5% YoY as a result of healthy subsidiary’s performance.
Our equity increased by 6.2% YoY due to higher retained earnings from the company’s performance.
Cash Flows
Key Indicators (Rp. Bn) YoY
1Q18 1Q17 Growth (%)
Cash Flow from Operating Activities 9,566 13,070 (26.8)
Cash Flow used in Investing Activities (6,406) (6,540) (2.0)
Cash Flow from/(used) in Financing Activities 625 (2,570) (124.3)
Net Increase in Cash & Cash Equivalents 3,785 3,960 (4.4)
Effect of Exchange Rate Changes on Cash & Cash Equivalents 38 (28) (235.7)
Cash & Cash Equivalents at Beginning of Year 25,145 29,767 (15.5)
Cash & Cash Equivalents at End of Period 28,968 33,699 (14.0)
Net cash provided by operating activities decreased by 26.8% YoY from higher payment of expenses during the period.
Net cash used in investing activities decreased slightly by 2.0% YoY from lower cash payment for fixed assets acquisition during the period.
Net cash used in financing activities declined by 124.3% YoY due to higher bank loan withdrawal.
Debts
Currencies (Rp.Bn)
YoY Portion (%)
1Q18 FY17 Growth (%) 1Q18 FY17
IDR/Rupiah 30,738 29,817 3.1 94.4 94.2
USD/US Dollar 970 1,029 (5.7) 3.0 3.3
JPY/Japanese Yen 694 648 7.1 2.1 2.0
MYR/Malaysian Ringgit 169 174 (2.9) 0.5 0.5
Total 32,571 31,668 2.9 100.0 100.0

5
FIRST QUARTER OF 2018 (UNAUDITED)
At the end of March 2018, total debts amounting to Rp32.6 trillion, increased by 2.9% compared to the end of 2017. Around 94.4% of our debt was in Rupiah currency, 3.0% was in US Dollar currency and the remaining balance was in Japanese Yen and Malaysian Ringgit, consisting of short and long-term Bank Loans, Bonds and Two-Step Loans. Our debt to equity ratio (“DER”) was still relatively low at 33.1%.
Gearing Ratio
Key Indicators YoY
1Q18 FY17 Growth (ppt)
Net Debt to Equity (%) 3.7 7.0 (3.3)
Debt to Equity (%) 33.1 34.2 (1.1)
Debt to EBITDA (Times) 0.5 0.5 0.0
Debt Service Ratio (Times) 5.9 6.8 (0.9)
Financial Ratios
Ratios (%)
YoY
1Q18 1Q17 Growth (ppt)
EBIT Margin 33.6 40.3 (6.7)
EBITDA Margin 49.8 54.2 (4.4)
Net Income Margin 17.7 21.6 (3.9)
Current Ratio 117.8 133.3 (15.5)
Total Liabilities to Equity 87.8 82.5 5.3
Return on Assets 11.1 14.3 (3.2)
Return on Equity 23.3 29.4 (6.1)
Return on Invested Capital 17.5 22.5 (5.0)
Capital Expenditure
In the first quarter of 2018, Telkom Group spent Rp6.1 trillion in Capital Expenditure (Capex). In mobile services, Capex was mainly utilized for radio access network (BTS) development. While in fixed businesses, Capex was primarily utilized to develop access and backbone infrastructure, including satellite and submarine cable systems to support fixed as well as mobile broadband businesses. Some portion of Capex were also utilized for other projects such as tower.
6
FIRST QUARTER OF 2018 (UNAUDITED)
Mobile Services
Telkomsel Financial Result
1Q18 was marked by rapid shift in telecommunication industry with accelerated transition from Legacy to
Data services and continuous intense competition which led to pressure in terms of pricing and margin.
Started from a higher base in the last couple of years, Telkomsel was still able to book substantial amount
of Revenues, EBITDA and Net Income of Rp21.9 trillion, Rp12.0 trillion and Rp6.4 trillion, respectively,
supported by transformation initiatives in Digital Business as engine of growth. The Digital Business itself
posted a significant growth of 24.8%, driven by Data which increased by 20.8% and Digital Services which
increased by 61.1% YoY, accounted for 48.0% of total revenues, increased significantly from 37.7% a year
ago. The current market dynamic confirmed that Data and Digital Services are the future of telco industry,
and we focus on developing digital ecosystem by establishing extensive range of Digital Services portfolio
including Digital Lifestyle, Mobile Financial Services, Digital Advertising and Digital Banking.
Telkomsel recorded subscriber base growth of 13.8% YoY to 192.8 million attributable to effective sales
and marketing programs. In line with our philosophy to always lead in network supply both in and outside
Java, to maintain our network superiority and grow our Digital Business, we deployed 6,944 new BTS
during the first quarter of 2018 with all of BTS were 4G-based. Our data traffic increased by 145.8% YoY to
899,600 TB mainly fueled by high growth in 3G/4G capable device that reached 113.3 million (+35.2%
YoY), or 58.8% of our customer base. By end of March 2018, our BTS on-air totaled 167,649 units (+23.2%
YoY), around 70% of which were 3G/4G BTS.
Statements of Profit and Loss
Financial Performance (Rp. Bn)
YoY QoQ
1Q18 1Q17 Growth (%)
1Q18 4Q17 Growth (%)
Revenues 21,874 22,302 (1.9) 21,874 23,691 (7.7)
Legacy 11,368 13,884 (18.1) 11,368 12,364 (8.1)
Digital Business 10,506 8,419 24.8 10,506 11,327 (7.3)
Expenses incl. Depreciation & others 13,446 12,292 9.4 13,446 14,369 (6.4)
EBITDA 11,986 13,194 (9.2) 11,986 12,741 (5.9)
EBITDA Margin (%) 54.8 59.2 (4.4ppt) 54.8 53.8 1.0ppt
Net Income 6,416 7,702 (16.7) 6,416 7,097 (9.6)
Net Income Margin (%) 29.3 34.5 (5.2ppt) 29.3 30.0 (0.6ppt)
Proportion of Digital Business (%) 48.0 37.7 10.3ppt 48.0 47.8 0.2ppt
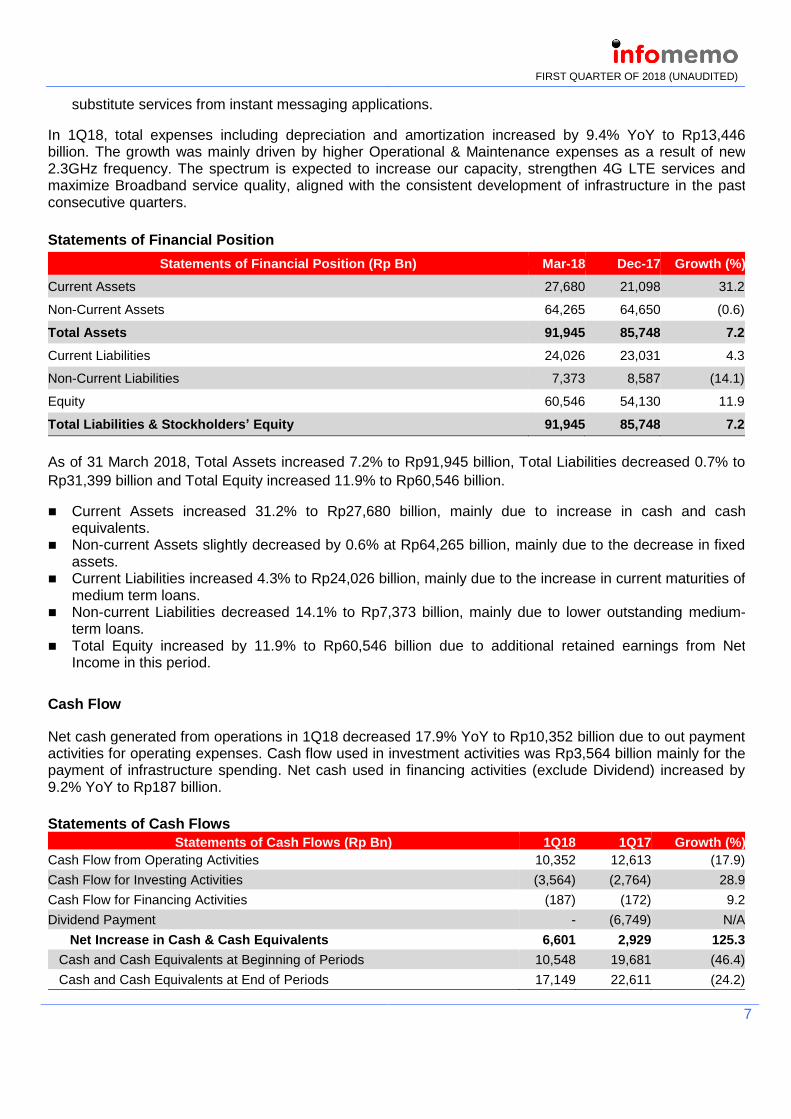
Telkomsel recorded operating revenues of Rp21,874 billion for 1Q18, decreased by 1.9% YoY amidst intense competition. Prepaid revenue decreased by 2.9% YoY to Rp18,432 billion, mainly due to lower consumption of
legacy businesses coupled with intense competition in data business.
Postpaid revenue increased by 21.2% YoY to Rp2,030 billion mainly driven by the increase in the
postpaid customer base which grew by 20.7% YoY to 5.1 million subscribers.
Interconnection and International Roaming revenues decreased by 20.4% YoY to Rp1,132 billion mainly
due to combination of declining Voice and SMS traffic from other local operators as an impact of
7
FIRST QUARTER OF 2018 (UNAUDITED)
substitute services from instant messaging applications.
In 1Q18, total expenses including depreciation and amortization increased by 9.4% YoY to Rp13,446 billion. The growth was mainly driven by higher Operational & Maintenance expenses as a result of new 2.3GHz frequency. The spectrum is expected to increase our capacity, strengthen 4G LTE services and maximize Broadband service quality, aligned with the consistent development of infrastructure in the past consecutive quarters.
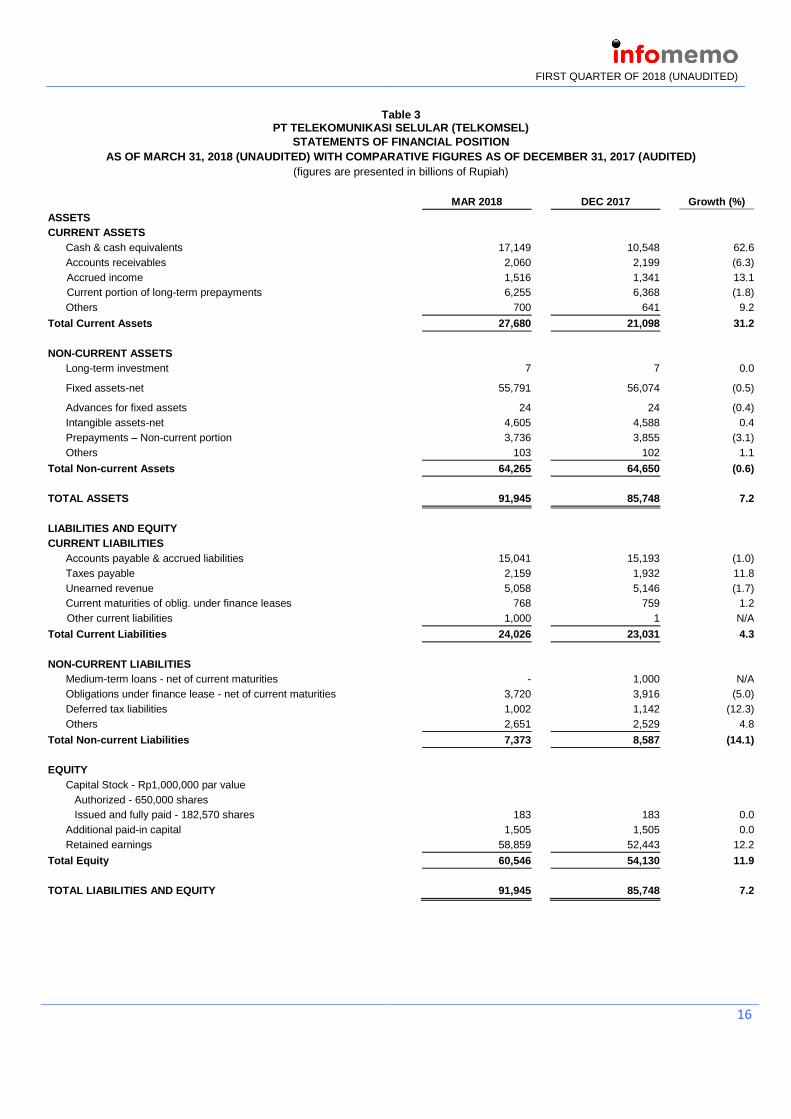
Statements of Financial Position
Statements of Financial Position (Rp Bn) Mar-18 Dec-17 Growth (%)
Current Assets 27,680 21,098 31.2
Non-Current Assets 64,265 64,650 (0.6)
Total Assets 91,945 85,748 7.2
Current Liabilities 24,026 23,031 4.3
Non-Current Liabilities 7,373 8,587 (14.1)
Equity 60,546 54,130 11.9
Total Liabilities & Stockholders’ Equity 91,945 85,748 7.2
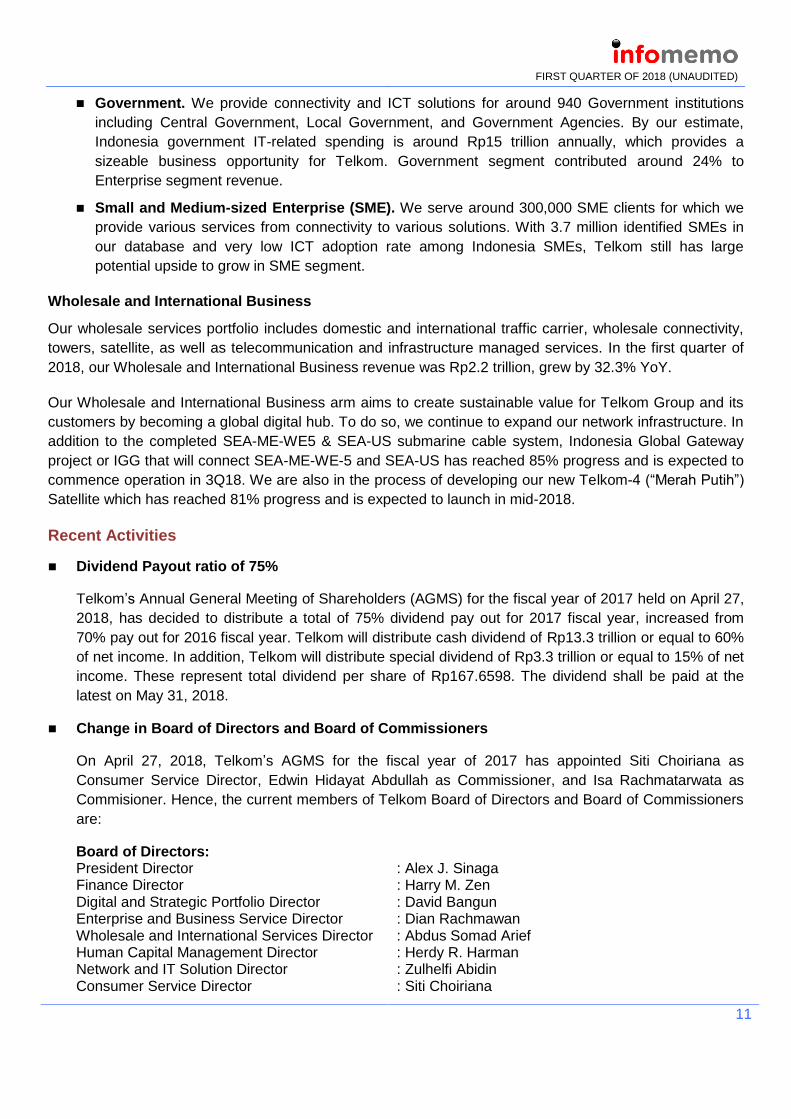
As of 31 March 2018, Total Assets increased 7.2% to Rp91,945 billion, Total Liabilities decreased 0.7% to
Rp31,399 billion and Total Equity increased 11.9% to Rp60,546 billion.
Current Assets increased 31.2% to Rp27,680 billion, mainly due to increase in cash and cash equivalents.
Non-current Assets slightly decreased by 0.6% at Rp64,265 billion, mainly due to the decrease in fixed assets.
Current Liabilities increased 4.3% to Rp24,026 billion, mainly due to the increase in current maturities of medium term loans.
Non-current Liabilities decreased 14.1% to Rp7,373 billion, mainly due to lower outstanding medium-term loans.
Total Equity increased by 11.9% to Rp60,546 billion due to additional retained earnings from Net Income in this period.
Cash Flow
Net cash generated from operations in 1Q18 decreased 17.9% YoY to Rp10,352 billion due to out payment activities for operating expenses. Cash flow used in investment activities was Rp3,564 billion mainly for the payment of infrastructure spending. Net cash used in financing activities (exclude Dividend) increased by 9.2% YoY to Rp187 billion.
Statements of Cash Flows
Statements of Cash Flows (Rp Bn) 1Q18 1Q17 Growth (%)
Cash Flow from Operating Activities 10,352 12,613 (17.9)
Cash Flow for Investing Activities (3,564) (2,764) 28.9
Cash Flow for Financing Activities (187) (172) 9.2
Dividend Payment - (6,749) N/A
Net Increase in Cash & Cash Equivalents 6,601 2,929 125.3
Cash and Cash Equivalents at Beginning of Periods 10,548 19,681 (46.4)
Cash and Cash Equivalents at End of Periods 17,149 22,611 (24.2)

8
FIRST QUARTER OF 2018 (UNAUDITED)
Debt Profile
As of 31 March 2018, Telkomsel’s outstanding loans amounted to Rp1,000 billion will due in 2019 and obligations under finance lease of Rp4,488 billion. As of 31 March 2018, Telkomsel Debt to Equity Ratio (DER) was 9.1%.
Several financial covenants related to its loans/debts as follows:
Covenants to be Maintained Required Actual
EBITDA to Debt Service ≥1.25 28.19
Debt to Tangible Net Worth ≤2.00 0.02
RESULTS BY SERVICE
Celullar Services
Voice and SMS
Telkomsel had been successful in maintaining healthy Voice revenue growth over the past few years due to
dynamic cluster based pricing and successful migration of customers from Pay As You Use (PAYU) to
packages. Along transition phase of Legacy toward Data, Telkomsel’s Legacy business was slowing down
with Voice revenue decreased by 13.8% YoY to Rp8,672 billion and Voice traffic declined by 1.3% YoY.
This trend also applied to SMS where its revenue declined by 31.8% YoY to Rp1,938 billion as the impact
of OTT services cannibalization resulting SMS traffic declined by 39.3% YoY.
Digital Business
Digital business remained the engine of growth with focus on leading network supply in 3G and 4G
infrastructure. This segment recorded strong performance with 24.8% YoY growth to Rp10,506 billion and
increased its contribution to total revenue substantially to 48.0% from 37.7% last year.
Revenue from Data grew by 20.8% YoY to Rp9,160 billion, driven by healthy growth in 3G/4G capable
device adoption (+35.2% YoY to 113.3 million users), successful migration of PAYU to Flash packages, as
well as continued strong growth in Data payload, which increased by 145.8% YoY to 899,600 TB. As of 31
March 2018, 55.1 million of our customers that have LTE devices have swapped to USIM to utilize 4G
services.
Digital Services also grew strongly by 61.1% YoY to Rp1,346 billion, becoming the main driver of
Telkomsel’s transformation from a telco company to a digital telco company. A number of investments and
key initiatives have been established to accelerate the growth of Digital Services, in line with Telkomsel
mission to build a digital Indonesia with key products and services within this segment include Digital
Lifestyle, Mobile Financial Services, Digital Advertising and Digital Banking:
▪ Digital Lifestyle continued to focus on providing excellent mobile entertainment experience for
customers. By targeting different segments through various services, Telkomsel aims to become the
leading mobile entertainment provider in the country through VAS, Music, Video, Games & Market
Place, etc.

9
FIRST QUARTER OF 2018 (UNAUDITED)
▪ In Mobile Financial Services, Telkomsel’s flagship product TCASH made strides towards fulfilling its
vision to realize financial inclusion and the creation of a cashless society in Indonesia which had
expanded its user base to around 20 million registered users as of March 2018. Telkomsel has also
built a strong foundation to support scalable growth by adding its TCASH servicing channels
consisting of traditional outlets, modern retail outlets and agents (Bang TCASH), and by introducing
new use cases for both the banked segment and unbanked segments.
▪ Through Digital Advertising business, Telkomsel aims to become a dominant media owner in
Indonesia’s Mobile Advertising industry by leveraging more than 192.8 million subscribers and
offering an extensive range of Digital Advertising services, ranging from conventional text
messaging to timely advertising for mobile coupons, display advertising in mobile applications, and
much more.
▪ Digital Banking business continued to grow, enabling more financial institutions to provide mobile
banking services and helping Indonesian citizens to enjoy broader access to financial transactions
in general, towards achieving the government’s target creation of a cashless society.
Going forward, Telkomsel will continue to scale up the business and develop its digital ecosystem in order
to expand its reach and to support an increasing variety of Digital Services. Establishment of this digital
ecosystem is a key foundation for Telkomsel to become a successful digital telco company and build a
digital Indonesia.
Customer Base
As of 31 March 2018, Telkomsel served 192.8 million subscribers nationwide, an increase of 13.8% YoY.
Out of the total base, 108.7 million were data users which grew strongly by 21.3% YoY.
ARPU
As we are shifting from Legacy business to Digital Business, our Digital ARPU grew double digit due to
increase in 3G/4G capable device penetration along with strong growth in data traffic.
Network Deployment
Our focus on Digital Business was reflected from our network deployment. We continued to accelerate our
network development with aggressive 3G/4G BTS deployment to support Digital Business as Data traffic
jumped 145.8% YoY. Our 4G LTE deployment is on-demand basis, take into account 4G handset
penetration and level of demand in Broadband cities. We have deployed 35,110 4G BTS to date. The
network roll out brought total BTS on air to 167,649 units at end of March 2018, or increased by 23.2%
YoY, of which 117,332 units were 3G/4G BTS (+35.9% YoY).

10
FIRST QUARTER OF 2018 (UNAUDITED)
The following table presents performance of our cellular business:
Fixed Line Services
Fixed Broadband IndiHome
IndiHome continued to show strong result. During 1Q18, we successfully added around 536 thousand new
subscribers. Total IndiHome subscribers has reached 3.5 million, grew by 97.0% YoY, with IndiHome Triple
Play representing 60% of total customers. While IndiHome Dual Play continued to show strong traction.
Around 73% of the new customers in 1Q18 were on Dual Play.
In terms of revenue, IndiHome business recorded Rp2.3 trillion of revenue, strongly increased by 48.4%
YoY. ARPU of IndiHome in 1Q18 was Rp251 thousand, declined from Rp285 thousand in the previous
quarter as a result of higher contribution from Dual Play customers and promotional package. We will keep
accelerating IndiHome customer growth and encouraging customers to purchase various add-ons and mini
pack, upgrade to Triple Play or higher speed services.
Enterprise Business
In Enterprise market, Telkom remains focused on provision of ICT solutions with various smart enabler
platforms. There is increasing trend for Indonesian corporations to focus on their core businesses and
outsource their ICT solution needs to reliable third-party providers. This represents huge opportunity for
Telkom to expand its Enterprise business in the future. In 1Q18, Telkom Enterprise business recorded
Rp5.9 trillion (normalized) in revenue, grew by 17.7% YoY.
We serve three customers segments under our Enterprise business:
Corporate. We serve around 1,450 corporate clients from various industries such as consumer
goods, insurance, pharmaceutical, and banking, which contributed around 61% to Enterprise
segment revenue. Corporate customers now demand more integrated ICT solutions on top of
connectivity such as smart enablers, data center and cloud, platforms and applications, as well as
business process outsourcing. With low penetration of integrated ICT services among Indonesian
corporate, coupled with the rising trend of business process digitization, Telkom is in the leading
position to grow its Corporate segment.
Operational Indicators YoY QoQ
1Q18 1Q17 Growth (%)
1Q18 4Q17 Growth (%)
Customer Base (000) 192,752 169,368 13.8 192,752 196,322 (1.8)
Net Adds (000) (3,570) (4,552) (21.6) (3,570) 5,960 (159.9)
3G/4G Capable Device (000) 113,286 83,793 35.2 113,286 108,196 4.7
ARPU (000) 35 43 (18.7) 35 41 (14.8)
BTS on Air (units) 167,649 136,093 23.2 167,649 160,705 4.3
Total Employees 5,453 5,149 5.9 5,453 5,461 (0.1)
MoU (In billion minutes) 51.7 52.4 (1.3) 51.7 54.6 (5.2)
SMS (In billion units) 23.2 38.2 (39.3) 23.2 28.4 (18.4)
Data Payload (TB) 899,600 365,959 145.8 899,600 743,218 21.0
11
FIRST QUARTER OF 2018 (UNAUDITED)
Government. We provide connectivity and ICT solutions for around 940 Government institutions
including Central Government, Local Government, and Government Agencies. By our estimate,
Indonesia government IT-related spending is around Rp15 trillion annually, which provides a
sizeable business opportunity for Telkom. Government segment contributed around 24% to
Enterprise segment revenue.
Small and Medium-sized Enterprise (SME). We serve around 300,000 SME clients for which we
provide various services from connectivity to various solutions. With 3.7 million identified SMEs in
our database and very low ICT adoption rate among Indonesia SMEs, Telkom still has large
potential upside to grow in SME segment.
Wholesale and International Business
Our wholesale services portfolio includes domestic and international traffic carrier, wholesale connectivity,
towers, satellite, as well as telecommunication and infrastructure managed services. In the first quarter of
2018, our Wholesale and International Business revenue was Rp2.2 trillion, grew by 32.3% YoY.
Our Wholesale and International Business arm aims to create sustainable value for Telkom Group and its
customers by becoming a global digital hub. To do so, we continue to expand our network infrastructure. In
addition to the completed SEA-ME-WE5 & SEA-US submarine cable system, Indonesia Global Gateway
project or IGG that will connect SEA-ME-WE-5 and SEA-US has reached 85% progress and is expected to
commence operation in 3Q18. We are also in the process of developing our new Telkom-4 (“Merah Putih”)
Satellite which has reached 81% progress and is expected to launch in mid-2018.
Recent Activities
Dividend Payout ratio of 75%
Telkom’s Annual General Meeting of Shareholders (AGMS) for the fiscal year of 2017 held on April 27,
2018, has decided to distribute a total of 75% dividend pay out for 2017 fiscal year, increased from
70% pay out for 2016 fiscal year. Telkom will distribute cash dividend of Rp13.3 trillion or equal to 60%
of net income. In addition, Telkom will distribute special dividend of Rp3.3 trillion or equal to 15% of net
income. These represent total dividend per share of Rp167.6598. The dividend shall be paid at the
latest on May 31, 2018.
Change in Board of Directors and Board of Commissioners
On April 27, 2018, Telkom’s AGMS for the fiscal year of 2017 has appointed Siti Choiriana as
Consumer Service Director, Edwin Hidayat Abdullah as Commissioner, and Isa Rachmatarwata as
Commisioner. Hence, the current members of Telkom Board of Directors and Board of Commissioners
are:
Board of Directors: President Director : Alex J. Sinaga Finance Director : Harry M. Zen Digital and Strategic Portfolio Director : David Bangun Enterprise and Business Service Director : Dian Rachmawan Wholesale and International Services Director : Abdus Somad Arief Human Capital Management Director : Herdy R. Harman Network and IT Solution Director : Zulhelfi Abidin Consumer Service Director : Siti Choiriana

12
FIRST QUARTER OF 2018 (UNAUDITED)
Board of Commissioners: President Commissioner : Hendri Saparini Independent Commissioner : Margiyono Darsasumarja Independent Commissioner : Dolfie Othniel Fredric Palit Independent Commissioner : Pamijati Pamela Johanna Waluyo Independent Commissioner : Cahyana Ahmadjayadi Commissioner : Edwin Hidayat Abdullah Commissioner : Rinaldi Firmansyah Commissioner : Isa Rachmatarwata
Acquisitions
On April 2, 2018, we acquired 51% ownership of PT Swadharma Sarana Informatika, a company
engaged in ATM managed service and related businesses. We expect this acquisition to strengthen
Telkom’s business ecosystem and increase Telkom’s ICT solution competence in financial, banking
and insurance sector, in line with our vision to be a digital telco company.
Product and Marketing Activities
Fixed Line & Enterprise
IndiHome released IndiHome Chinese New Year (“Imlek”) Package discounted from normal price with 100
minutes free call to fixed line, UseeTV Entry package, plus contents with price starting from Rp360
thousand for 20Mbps internet speed. This promotion applies until April 30, 2018.
Mobile
▪ Legacy business and Data penetration program
In order to increase more Data usage, #SURPRISE DEAL and Internet Vaganza program were
launched as attractive Data offering: (1) #SURPRISE DEAL as Data package for prepaid customers
consist of 25GB Data quota for all networks priced at Rp100K; (2) Internet Vaganza which offers
attractive core Data package consist of 12GB for all networks starting from Rp95K.
▪ Acceleration on 3G/4G Device Adoption
To encourage mass adoption of smartphone device in efficient and effective way, Telkomsel Android
United (TAU) and Halo Kick! Program were launched with variety of device bundling: (1) Samsung
Galaxy S9 & S9+ bundled with Halo Kick! consist of Data Quota up to 24GB, 100 minutes and 200 SMS
per month within 12 months.
ADDITIONAL INFORMATION
Awards & Recognition
During 1Q18, we have been awarded by several institutions for our achievements, among others:
Top Brand Award for IndiHome in Internet Service Provider Fixed category for Outstanding Achievement in Building the Top Brand from Frontier Consulting Group and Marketing Magazine.
Indonesia CSR Award II for Telkom for achieving Platinum award (99.25 score) for public company which conducts CSR principles from Economic Review and Indonesia Asia Institute.

13
FIRST QUARTER OF 2018 (UNAUDITED)
The 13th Sustainability Reporting Award 2017 for Telkom as First Rank in Infrastructure category from the National Center for Sustainability Reporting and SWA.
Indonesia Corporate Secretary & Corporate Communication Award 2018 for Telkom as First Rank (Platinum Award) in Public Listed Company category from Economic Review.
Best CEO Obsession Award 2018 for Mr. Alex J. Sinaga as Best Achiever in CEO State Owned Enterprise and for Telkom as Best Achiever Company from Obsession Media Group.
Most Innovative Business Award 2018 for Telkom as Excellent Company for Product and Marketing Innovation in Telecommunication Sector from Warta Ekonomi.
Public Relations Indonesia Award 2018 for Telkom in the Most Popular in Media, Corporate PR and Marketing PR category from PR Indonesia Magazine.
WSIS Prize 2018 for Telkomsel as 2nd Best Champion WSIS - Baktiku Negeriku from WSIS Forum.
Indonesia WOW Brand 2018 for Telkomsel as Gold Champion Cellular Operator and Top 50 Indonesia WOW Brand 2018 from MarkPlus Inc.
Wajib Pajak 2018 Awards for Telkomsel as the Biggest Tax Contribution from DJP Pajak Kementerian.
PR Indonesia Award 2018 for Telkomsel as Best Private Company “Platinum Awards”, Best Crisis Handling, and Most Popular in Media, MyTelkomsel as “Gold Winner” mobile application category, The NextDev as “Gold Winner” Corporate PR category, Internet Baik as “Gold Winner” Sustainability Business category, and Popcorn as “Bronze Winner” E-Magazine category from Serikat Perusahaan Pers (SPS).
TOP Digital PR Award 2018 for Telkomsel as Top Digital PR Award in Kartu Provider category from Trash N CO Research.
Inhouse Magazine Award 2018 for Telkomsel as Best E-Magazine in Private National Company category from Serikat Perusahaan Pers (SPS).
Indonesia Prestige Brand Awards 2018 for Telkomsel as Top 5 Brand used most often in Mobile Provider Category from Warta Ekonomi.
Indonesia Branding Campaign Award 2018 for The NextDev Campaign as best PR Program “Gold Champion” and best Below The line Program “Below The Line” from MarkPlus Inc.
Indonesia Netizen Brand Choice 2018 for TCASH as Top 5 Netizen Choice in Digital Payments Category from Warta Ekonomi.

14
FIRST QUARTER OF 2018 (UNAUDITED)
Table 1 PERUSAHAAN PERSEROAN (PERSERO)
PT TELEKOMUNIKASI INDONESIA Tbk AND SUBSIDIARIES CONSOLIDATED STATEMENT OF FINANCIAL POSITION
As of March 31, 2018 (unaudited) and December 31, 2017 (audited) (Figures in tables are expressed in billions of Rupiah, unless otherwise stated)
March 31, 2018
December 31, 2017
Growth (%)
ASSETS
CURRENT ASSETS Cash and cash equivalents 28,968 25,145 15.2 Other current financial assets 1,661 2,173 (23.6) Trade receivables – net of provision for impairment of receivables
Related parties 2,241 1,545 45.0 Third parties 9,876 7,677 28.6
Other receivables – net of provision for impairment of receivables 334 342 (2.3) Inventories – net of provision for obsolescence 630 631 (0.2) Assets held for sale 119 10 1,090.0 Prepaid taxes 2,395 1,947 23.0 Claim for tax refund 313 908 (65.5) Other current assets 8,414 7,183 17.1 Total current assets 54,951 47,561 15.5 NON-CURRENT ASSETS Long-term investments 2,189 2,148 1.9 Property and equipment – net of accumulated depreciation 130,801 130,171 0.5 Intangible assets – net of accumulated amortization 3,692 3,530 4.6 Deferred tax assets – net 2,683 2,804 (4.3) Other non-current assets 12,284 12,270 0.1 Total non-current assets 151,649 150,923 0.5 TOTAL ASSETS 206,600 198,484 4.1
LIABILITIES AND EQUITY CURRENT LIABILITIES Trade payables
Related parties 802 896 (10.5) Third parties 14,155 14,678 (3.6)
Other payables 173 217 (20.3) Taxes payable 3,006 2,790 7.7 Accrued expenses 13,296 12,630 5.3 Unearned income 5,046 5,427 (7.0) Advances from customers 1,085 1,240 (12.5) Short-term bank loans 2,719 2,289 18.8 Current maturities of long-term borrowings 6,359 5,209 22.1 Total current liabilities 46,641 45,376 2.8 NON-CURRENT LIABILITIES Deferred tax liabilities – net 791 933 (15.2) Unearned income 588 524 12.2 Long service award provisions 776 758 2.4 Pension benefits and other post-employment benefits obligations 10,447 10,195 2.5 Long-term borrowings – net of current maturities 27,191 27,974 (2.8) Other liabilities 25 594 (95.8)
Total non-current liabilities 39,818 40,978 (2.8)
TOTAL LIABILITIES 86,459 86,354 0.1
EQUITY Capital stock 5,040 5,040 - Additional paid-in capital 4,931 4,931 - Treasury stock (2,541) (2,541) - Other equity 433 387 11.9 Retained earnings Appropriated 15,337 15,337 - Unappropriated 75,293 69,559 8.2
Net equity attributable to: Owners of the parent company 98,493 92,713 6.2 Non-controlling interests 21,648 19,417 11.5
TOTAL EQUITY 120,141 112,130 7.1
TOTAL LIABILITIES AND EQUITY 206,600 198,484 4.1

15
FIRST QUARTER OF 2018 (UNAUDITED)
Table 2
PERUSAHAAN PERSEROAN (PERSERO)
PT TELEKOMUNIKASI INDONESIA Tbk AND SUBSIDIARIES
CONSOLIDATED STATEMENT OF PROFIT OR LOSS AND OTHER COMPREHENSIVE INCOME
For the Three Months Period Ended March 31, 2018 and 2017 (unaudited)
(Figures in tables are expressed in billions of Rupiah, unless otherwise stated)
2018
2017 Growth (%)
REVENUES 32,343 31,022 4.3
Operations, maintenance and telecommunication service expenses (10,244) (8,298) 23.5
Depreciation and amortization expenses (5,373) (4,773) 12.6
Personnel expenses (3,035) (2,977) 1.9
Interconnection expenses (828) (727) 13.9
General and administrative expenses (1,250) (1,226) 2.0
Marketing expenses (870) (985) (11.7)
Gain (loss) on foreign exchange – net (5) (50) (90.0)
Other income 303 500 (39.4)
Other expenses (163) 5 (3,360.0)
OPERATING PROFIT 10,878 12,491 (12.9)
Finance income 318 432 (26.4)
Finance costs (678) (616) 10.1
Share of profit of associated companies 14 17 (17.6)
PROFIT BEFORE INCOME TAX 10,532 12,324 (14.5)
INCOME TAX (EXPENSE) BENEFIT
Current (2,571) (2,991) (14.0)
Deferred 17 43 (60.5)
(2,554) (2,948) (13.4)
PROFIT FOR THE PERIOD 7,978 9,376 (14.9)
OTHER COMPREHENSIVE INCOME
Other comprehensive income to be reclassified
to profit or loss in subsequent periods:
Foreign currency translation 47 (10) (570.0)
Change in fair value of available-for-sale financial assets (1) 15 (106.7)
Share of other comprehensive income of associated companies 0 - 0.0
Other comprehensive income not to be reclassified to profit or loss in subsequent periods:
Defined benefit plan actuarial loss – net - - -
Other comprehensive income – net 46 5 820.0
TOTAL COMPREHENSIVE INCOME FOR THE PERIOD 8,024 9,381 (14.5)
Profit for the year attributable to:
Owners of the parent company 5,734 6,688 (14.3)
Non-controlling interests 2,244 2,688 (16.5)
7,978 9,376 (14.9)
Total comprehensive income for the year attributable to:
Owners of the parent company 5,780 6,693 (13.6)
Non-controlling interests 2,244 2,688 (16.5)
8,024 9,381 (14.5)
BASIC EARNINGS PER SHARE (in full amount)
Net income per share 57.88 67.51 (14.3)
Net income per ADS (100 Series B shares per ADS) 5,788.28 6,751.31 (14.3)
16
FIRST QUARTER OF 2018 (UNAUDITED)
Table 3
PT TELEKOMUNIKASI SELULAR (TELKOMSEL)
STATEMENTS OF FINANCIAL POSITION
AS OF MARCH 31, 2018 (UNAUDITED) WITH COMPARATIVE FIGURES AS OF DECEMBER 31, 2017 (AUDITED)
(figures are presented in billions of Rupiah)
MAR 2018 DEC 2017 Growth (%)
ASSETS
CURRENT ASSETS
Cash & cash equivalents 17,149 10,548 62.6
Accounts receivables 2,060 2,199 (6.3)
Accrued income 1,516 1,341 13.1
Current portion of long-term prepayments 6,255 6,368 (1.8)
Others 700 641 9.2
Total Current Assets 27,680 21,098 31.2
NON-CURRENT ASSETS
Long-term investment 7 7 0.0
Fixed assets-net 55,791 56,074
(0.5)
Advances for fixed assets 24 24 (0.4)
Intangible assets-net 4,605 4,588 0.4
Prepayments – Non-current portion 3,736 3,855 (3.1)
Others 103 102 1.1
Total Non-current Assets 64,265 64,650 (0.6)
TOTAL ASSETS 91,945 85,748 7.2
LIABILITIES AND EQUITY
CURRENT LIABILITIES
Accounts payable & accrued liabilities 15,041 15,193 (1.0)
Taxes payable 2,159 1,932 11.8
Unearned revenue 5,058 5,146 (1.7)
Current maturities of oblig. under finance leases 768 759 1.2
Other current liabilities 1,000 1 N/A
Total Current Liabilities 24,026 23,031 4.3
NON-CURRENT LIABILITIES
Medium-term loans - net of current maturities - 1,000 N/A
Obligations under finance lease - net of current maturities 3,720 3,916 (5.0)
Deferred tax liabilities 1,002 1,142 (12.3)
Others 2,651 2,529 4.8
Total Non-current Liabilities 7,373 8,587 (14.1)
EQUITY
Capital Stock - Rp1,000,000 par value
Authorized - 650,000 shares
Issued and fully paid - 182,570 shares 183 183 0.0
Additional paid-in capital 1,505 1,505 0.0
Retained earnings 58,859 52,443 12.2
Total Equity 60,546 54,130 11.9
TOTAL LIABILITIES AND EQUITY 91,945 85,748 7.2

17
FIRST QUARTER OF 2018 (UNAUDITED)
Table 4
PT TELEKOMUNIKASI SELULAR (TELKOMSEL)
STATEMENTS OF PROFIT AND LOSS
FOR THREE MONTHS ENDED MARCH 31, 2018 AND 2017 (UNAUDITED)
(figures in tables are presented in billions of Rupiah)
MAR 2018 MAR 2017 Growth (%)
REVENUES
Postpaid 2,030 1,675 21.2
Prepaid 18,432 18,984 (2.9)
Interconnection & international roaming 1,132 1,422 (20.4)
Others 280 221 26.7
Total Revenues 21,874 22,302 (1.9)
EXPENSES
Operation & maintenance 6,053 5,638 7.4
Depreciation & amortization 3,588 3,305 8.5
Cost of services 1,115 762 46.3
Interconnection & international roaming 736 664 11.0
Personnel 886 927 (4.4)
General & administration 346 372 (6.8)
Marketing 751 746 0.7
Others - net (30) (121) (75.5)
Total Expenses 13,446 12,292 9.4
Finance income - net 58 163 (64.2)
INCOME BEFORE TAX 8,487 10,173 (16.6)
INCOME TAX EXPENSE (2,071) (2,471) (16.2)
NET INCOME 6,416 7,702 (16.7)
EBITDA 11,986 13,194 (9.2)
EBITDA Margin- over revenues 54.8% 59.2% (4.4ppt)
ROA 31.5% 31.4% 0.1ppt
ROE 48.3% 49.7% (1.4ppt)