high-temperature structural evolution of caesium and ... · j. phys. chem. sol. 69 (2008) 2025. 2...
TRANSCRIPT
1
High-temperature structural evolution of caesium and rubidium triiodoplumbates
D. M. Trots1,*, S. V. Myagkota2,3
1 HASYLAB at DESY, Notkestraße 85, 22607 Hamburg, Germany
2 Physics Department, Ivan Franko National University of Lviv, 8 Kyryla i Mefodiya
Str., 79005 Lviv, Ukraine
3 Lviv State Agrarian University, 1 Volodymyra Velykogo Str., 80381 Dublyany-Lviv,
Ukraine
Abstract
CsPbI3 and RbPbI3 were investigated by in situ powder diffraction within
temperature ranges of 298—687 K and 298—714 K, respectively. Both compounds
crystallize in orthorhombic Pnma symmetry and expand isotropically upon a heating,
revealing almost the same relative change of the lattice parameters. A pronounced
difference in the structural evolution close to 600 K was observed, namely, CsPbI3
undergoes first order reversible phase transformation Pnma K563 Pnma + Pm3 m
K602 Pm 3 m, whereas no transitions (except of the sample’s melting) in RbPbI3 were
detected. An attempt to clarify the relation between the existence/absence of a phase
transition and bulging out of the iodine environment around alkaline ions was
undertaken.
Keywords: C. X-ray diffraction, D. crystal structure, D. phase transitions, D. thermal
expansion
* CORRESPONDING AUTHOR. Tel. +49-40-8998-2918, Fax: +49-40-8998-2787,
e-mail: [email protected]
doi:10.1016/j.jpcs.2008.05.007
D.M. Trots et al
J. Phys. Chem. Sol. 69 (2008) 2025
2
Introduction
Optical properties of caesium and rubidium triiodoplumbates have been extensively
studied [1, 2] since their implementation as scintillators is of considerable interest [3].
The structure of caesium triiodoplumbate was originally determined by Møller [4].
However, the accuracy of his work was limited by the experimental technique available
at that time. The structure of rubidium triiodoplumbate at room temperature was
precisely determined by single crystal diffraction [5]: RbPbI3 crystallizes in the
orthorhombic symmetry Pnam with a = 10.274(1) Å , b = 17.381(2) Å , c = 4.773(1) Å , Z
= 4 and is isomorphous with CsPbI3. The Pb2+ ions are surrounded octahedrally by I- in
this structure. The PbI6-octahedra are arranged in the double chains along the c-axis that
are held together by alkaline ions [5]. CsPbI3 and RbPbI3 belong to the structure type of
NH4CdCl3/Sn2S3.
To our knowledge, there are no data on the high-temperature structural evolution of
CsPbI3 and RbPbI3 in the literature. The analysis of the results presented in [4] shows
that more accurate structural studies of caesium triiodoplumbate are of interest. This
requires a more accurate determination of the interatomic distances in the CsPbI3
structure which is the experimental basis for further understanding the correlation
between optical and structural properties. Therefore, in the present work we report the
results of powder diffraction studies on CsPbI3 and RbPbI3 within temperature ranges of
298—687 K and 298—714 K, respectively.
Experimental
The samples were grown by the Bridgman technique in Lviv [2]. In situ diffraction
studies at high temperatures were performed at the synchrotron facility Hasylab/DESY
(Hamburg, Germany) with the powder diffractometer at beam-line B2 [6]. The 0.3×80
mm quartz capillaries were completely filled with powder samples in air and sealed.
Subsequently, the capillaries were mounted in Debye-Scherrer geometry inside a STOE
furnace which is equipped with a EUROTHERM temperature controller and a capillary
spinner. The furnace temperature was measured by a Pt10%Rh/Pt-thermocouple
calibrated using the thermal expansion of NaCl. The wavelength of 0.49328 Å was
selected from the direct white synchrotron radiation beam using a Si(111) double flat-
crystal monochromator and determined from 8 reflection positions of LaB6 reference
material (NIST SRM 660a). The beam size of 0.4×3 mm at the sample position was cut
doi:10.1016/j.jpcs.2008.05.007
3
by the slits. All diffraction patterns have been collected at stabilized temperatures
during the heating cycle using an image-plate detector [7] (2θ range 4-45o). Additional
check patterns were taken after the thermal treatment when the samples were cooled
down to 298 K. The data evaluation was performed using the "WinPLOTR" [8]
software package.
Results
The series of measurements was initially carried out for caesium triiodoplumbate in
the 298-770 K temperature range. A change of the sample colour from yellow to dark
yellow was observed at the end of thermal treatment during the in-situ diffraction study.
This can be considered as an evidence for the sample decomposition at high
temperatures in air. In order to avoid the sample decomposition, the upper temperature
limit was reduced down to 687 K. The additional diffraction check-pattern was
collected after the sample was cooled down to 298 K. The colour changes were not
revealed for CsPbI3 after its heating up to 687 K, and no difference was observed in the
cell volume of CsPbI3 before (892.660(43) Å 3) and after (892.701(49) Å 3) such heat
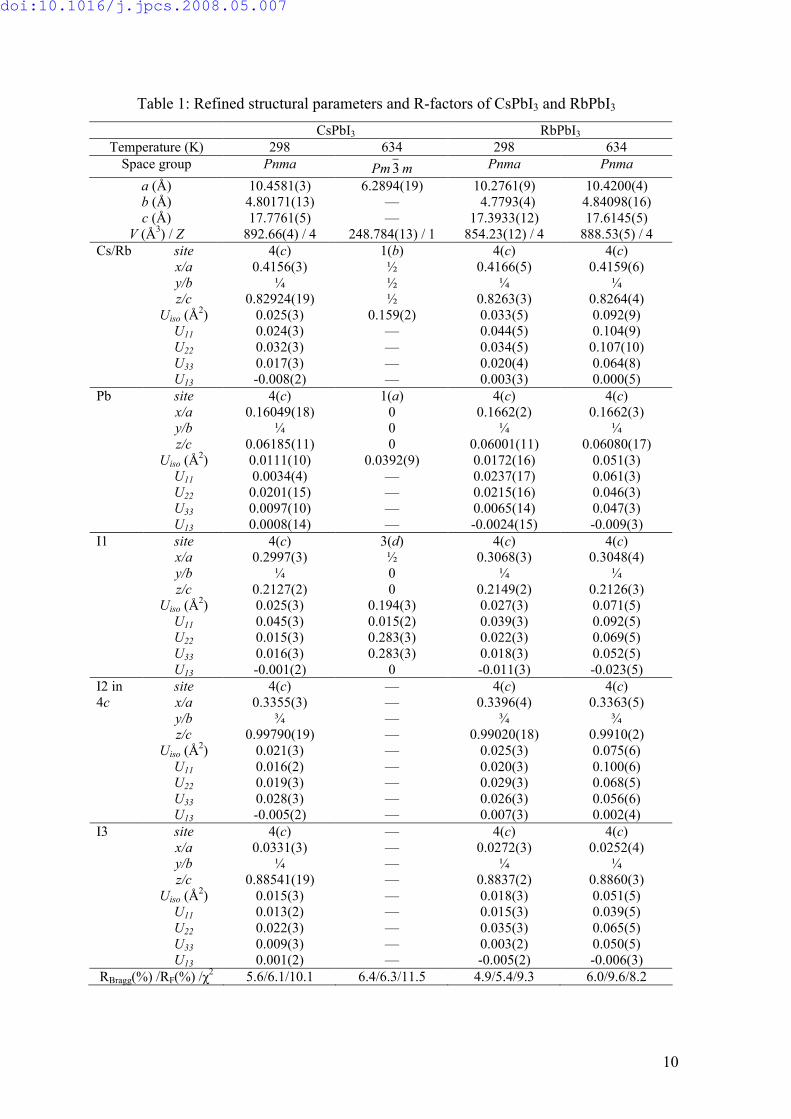
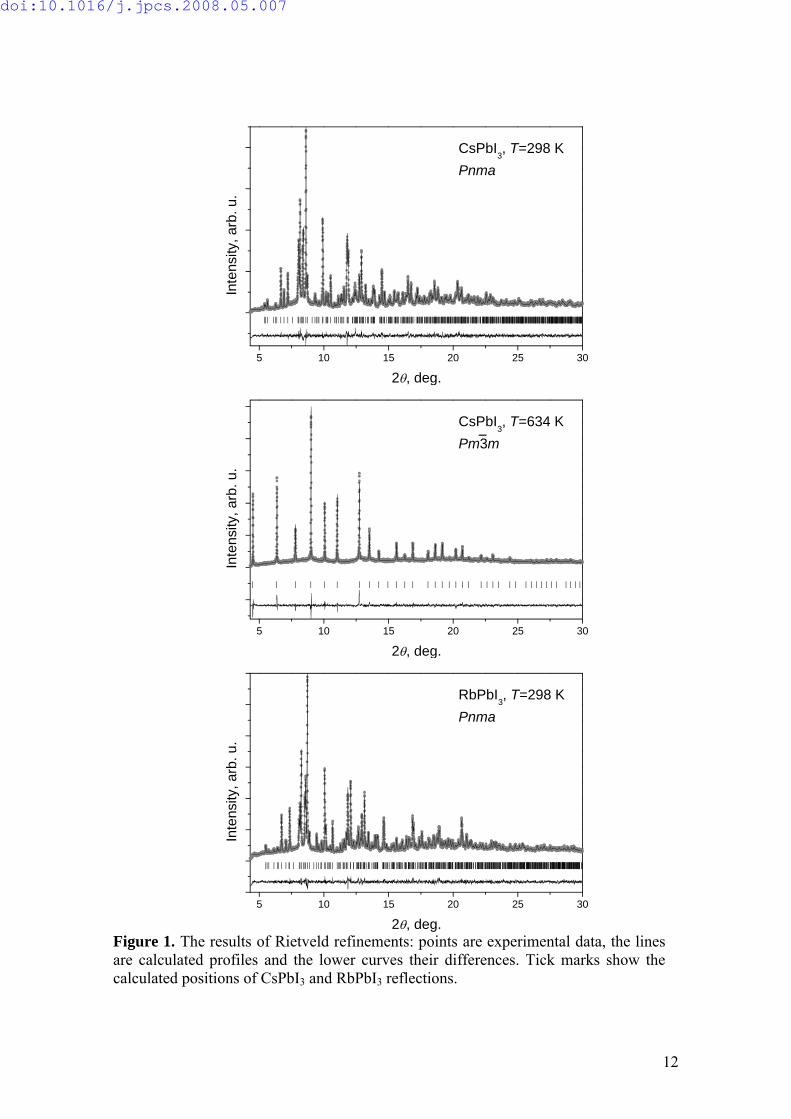
treatment. The Rietveld refinement for CsPbI3 at 298 K was based on the structure
model for a RbPbI3 single crystal [5]. The Rietveld refinement results are presented in
figure 1 and the respective values for the structural parameters are summarized in the
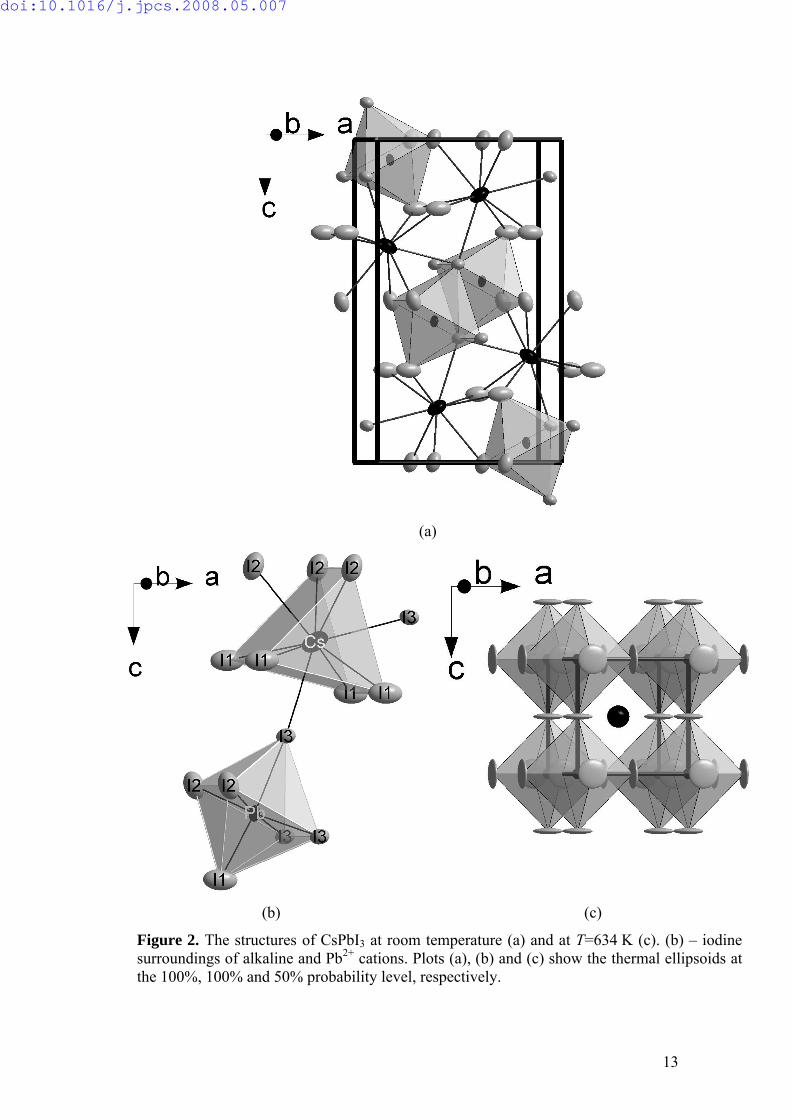
table 1. The structure is illustrated in figure 2a. The Pb2+ ions are located inside the
distorted iodine octahedra exhibiting two pairs of equatorial Pb-I distances (3.2259(25)
and 3.2775(25) Å ) and two apical ones (3.0513(40) and 3.4076(39) Å ). The alkaline ion
possesses more irregular 9-fold iodine environment, namely, the three pair of iodine at
the distances 3.8832(37), 3.8968(35), 3.9312(38) Å and three single iodine atoms at
distances 4.0086(47), 4.0271(46), 4.1230(45) Å (figure 2b).
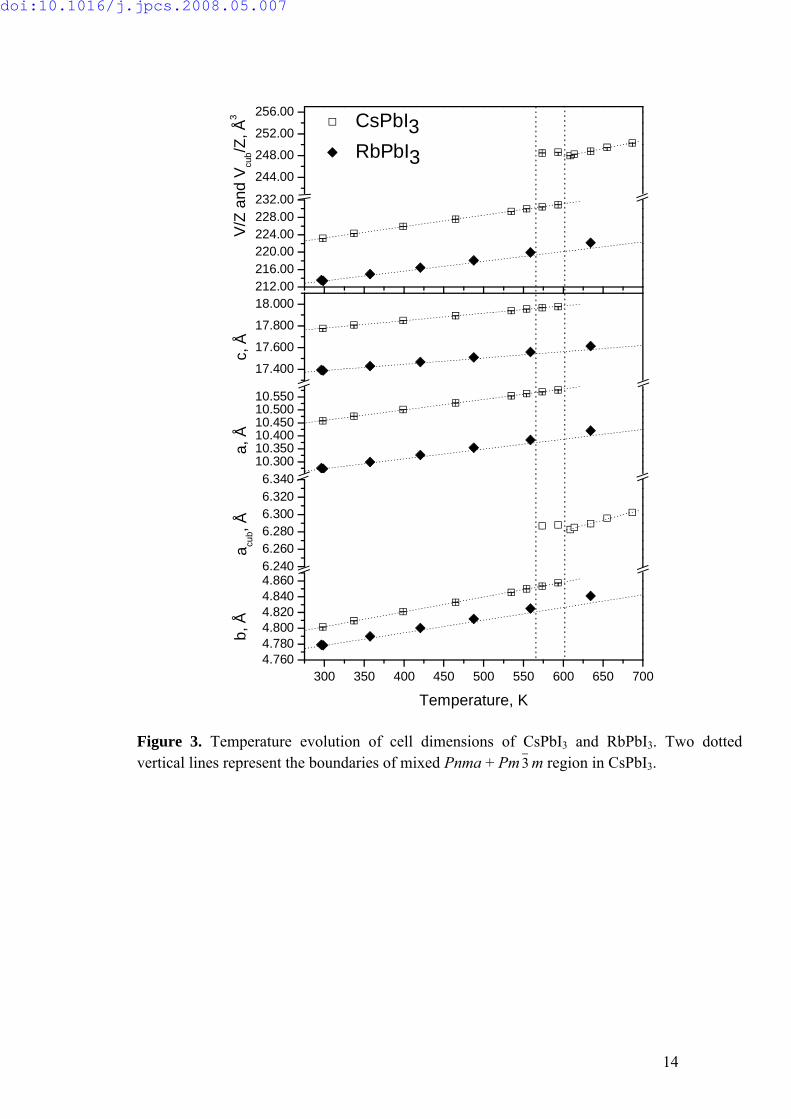
Besides the reflections from the orthorhombic CsPbI3 phase, additional Bragg peaks
arise in the diffraction patterns of CsPbI3 at temperatures above 563 K. The phase
transition has been found to occur within a temperature range of 563-602 K (figure 3)
where the reflections from different structure modifications are present in the CsPbI3
diffraction patterns. The reflections only from the high-temperature modification of
CsPbI3 are present in the pattern at 609 K. The analysis of the reflection indices in the
high resolution synchrotron diffraction data sets collected above 602 K clearly shows
that this new high temperature phase exhibits cubic symmetry (space group Pm 3 m, Z=1
doi:10.1016/j.jpcs.2008.05.007
4
and a=6.28940(19) Å at 634 K). Thereafter, the structural parameters of the high-
temperature modification of CsPbI3 were refined on the basis of the ideal perovskite
structural model (see figure 1 and table 1). In the ideal perovskite structure of the high-
temperature modification of CsPbI3, twelve equal Cs–I (4.4473 Å at 634 K) and six Pb–
I (3.1447 Å at 634 K) distances are observed. The PbI6 octahedra are regular, and
octahedral axes are parallel to the four-fold [0 0 1]p axes of the cubic perovskite cell.
The structure of the high-temperature CsPbI3 modification is illustrated in figure 2c.
It reveals a large-amplitude anisotropic thermal vibration of the iodine atoms in the
(100) planes. This finding possibly indicates a disorder of iodine in the Cs+—I- planes.
In order to achieve the best fit possible we also performed a structure refinement which
additionally took the disordered iodine into account. The iodine atoms in 3(d) at (½ , ½ ,
½ ) sites were distributed along the <100> directions over the 12(h) at (½ , x, 0) with
x≈0.09 sites in Cs+—I- plane. Although the convergence of the refinement was attained
for this model, the resulting residuals were RB=7.5%, RF=7.2% and χ2=11.4, compared
to RB =6.43%, RF =6.28% and χ2=11.5 for the refinement with single-site I- ions.
Therefore, the preference was given for the model with single-site I- ions, since it gives
a better structural description of CsPbI3 than the disordered model. We suggest that
single-crystal measurements of the high-temperature polymorphous modification of
CsPbI3 and subsequent structure refinement including anharmonic terms in the
structural model would provide more information about the nature of unusual thermal
vibrations of iodine. Any ‘single-crystal’ studies are, however, practically impossible
(or at least extremely difficult) even if single crystals are available, since the first order
orthorhombic ↔ cubic phase transition in CsPbI3 will lead to fracture (the large volume
change of about 6.9% was observed upon this transition). Caesium atoms exhibit large
isotropic vibrations in the high-temperature structure of CsPbI3. The similar large
amplitudes of isotropic thermal vibrations for the Cs+ cation and the very unusual
thermal vibrations of the halogen ion in the Cs+—X- plane were discussed for the cubic
perovskite phases of CsPbCl3 and CsPbBr3 [9].
The calculated and experimental diffraction patterns for RbPbI3 are presented in
figure 1. The Rietveld refinement was based on the model from reference [5]. The
analysis of the structural evolution of RbPbI3 above 298 K does not reveal any phase
transition up to 634 K. Further heating up to 714 K leads to the escape of Bragg peaks
from the diffraction pattern, i.e., the melting of RbPbI3 sample occurs between 634 and
714 K. The cell volume of 854.261(85) Å 3 has been determined at room temperature for
doi:10.1016/j.jpcs.2008.05.007
5
RbPbI3 recrystallized during the in situ diffraction experiment. This value agrees with
the initial RbPbI3 cell volume of 854.23(12) Å 3. The refined structural parameters of
RbPbI3 at 298 and 634 K are summarized in table 1. The coordinations of alkaline and
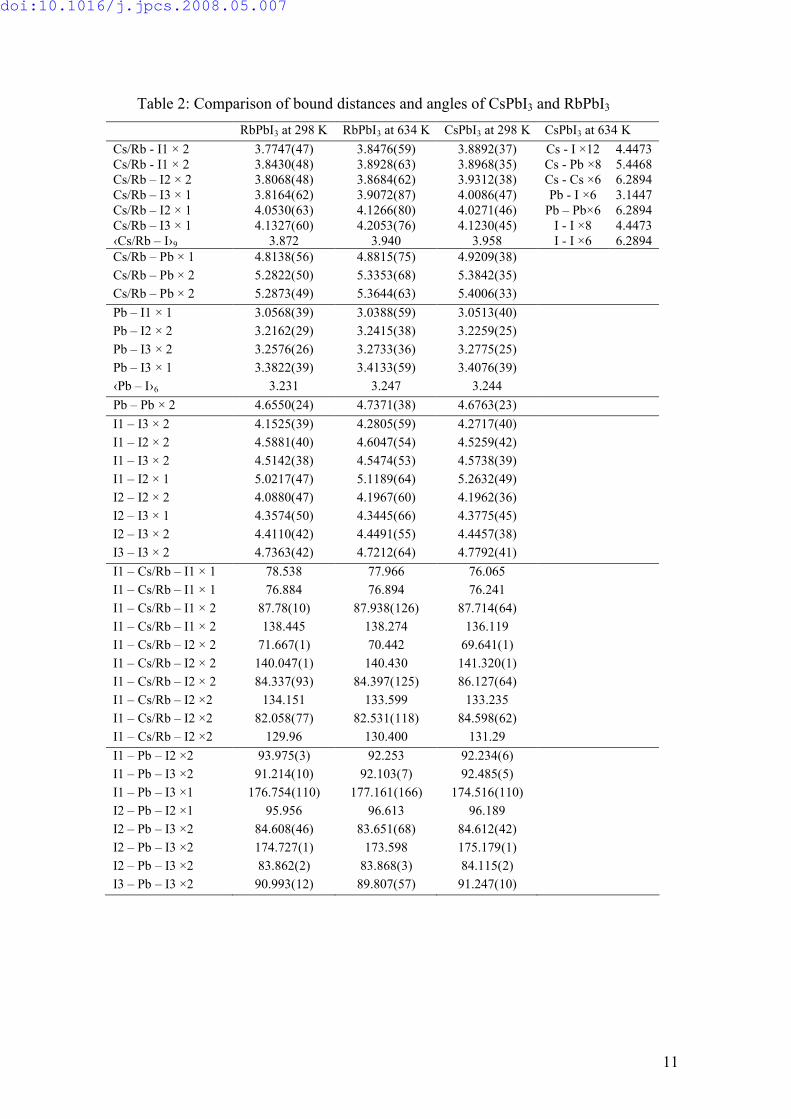
Pb2+ ions in orthorhombic structures are illustrated in figure 2b. Bond distances and
angles of RbPbI3 and both polymorphous of CsPbI3 are presented in table 2.
The temperature dependencies of the CsPbI3 and RbPbI3 cell parameters are
presented in figure 3. The values of the lattice parameters increase linearly without any
anomalous deviation for both CsPbI3 and RbPbI3 while the temperature changes within
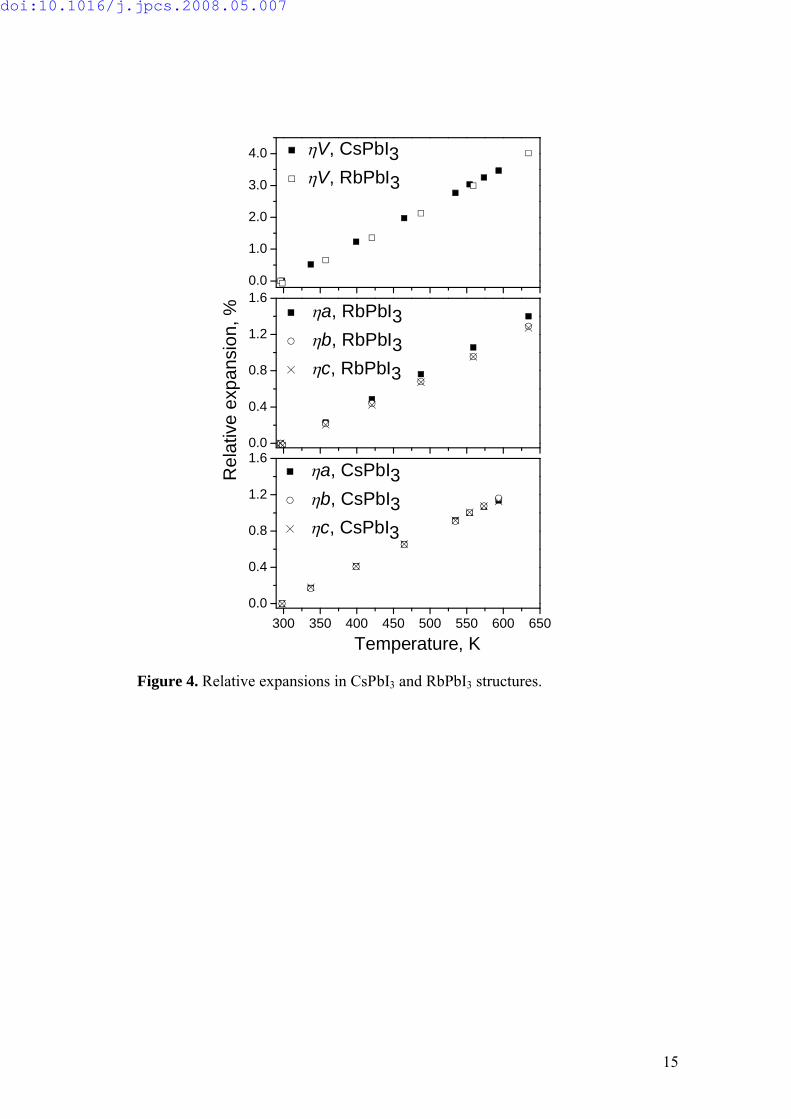
298-687 K range. The relative changes of the cell parameters and volumes in the
orthorhombic triiodoplumbates (figure 4) have been calculated in the respective
temperature ranges as ηx(T) = 100% × (x(T) − x(298 K))/x(298 K), where x corresponds
to a, b, c and V parameters. Both CsPbI3 and RbPbI3 samples show the linear isotropic
thermal expansion within orthorhombic phases. Furthermore, the volumetric relative
expansion is almost the same for caesium and rubidium triiodoplumbates. The volume
thermal expansion coefficients were calculated from the temperature dependences of the
unit cell volume as (1/V0)×(dV/dT), where (dV/dT) is the change of the volume in the
corresponding temperature interval and V0 is the volume at the reference temperature T0
(T0 = 298 K in the case of orthorhombic CsPbI3 and RbPbI3 and T0 = 609 K for cubic
CsPbI3). In this way, the volume thermal expansion coefficients of 11.8×10⁻⁵, 11.8×10⁻⁵
and 11.9×10⁻⁵ K-1 have been calculated for orthorhombic CsPbI3, cubic CsPbI3 and
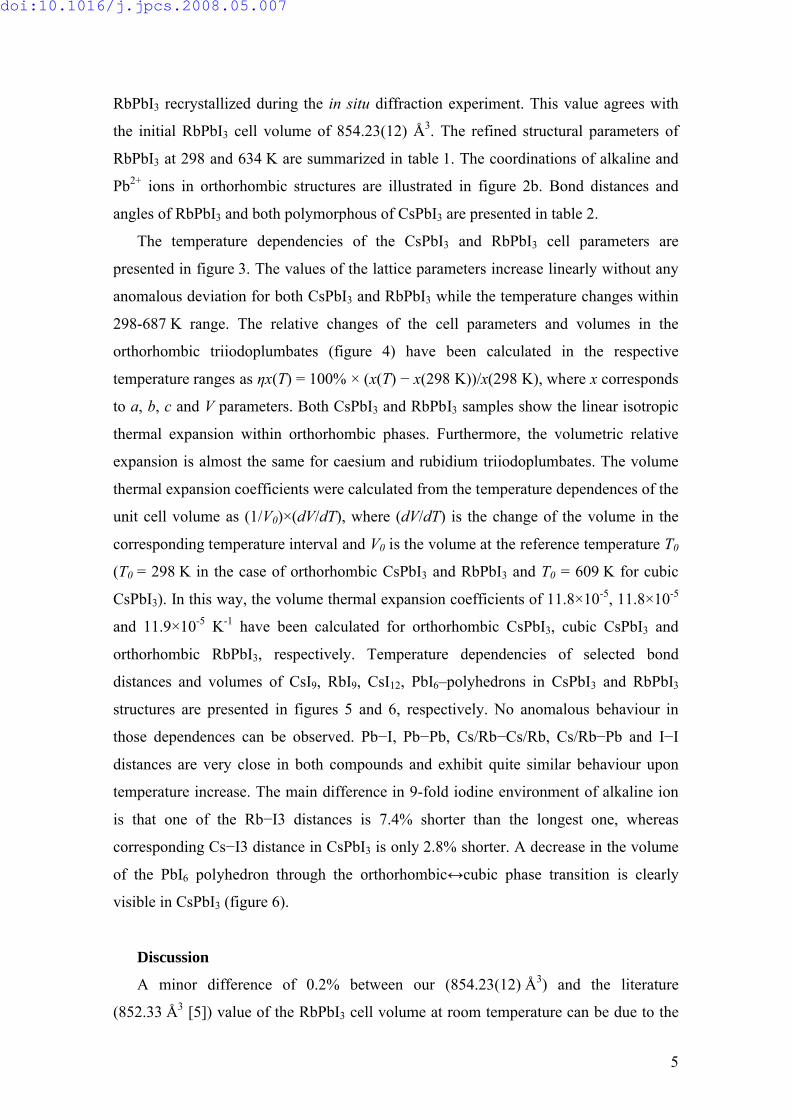
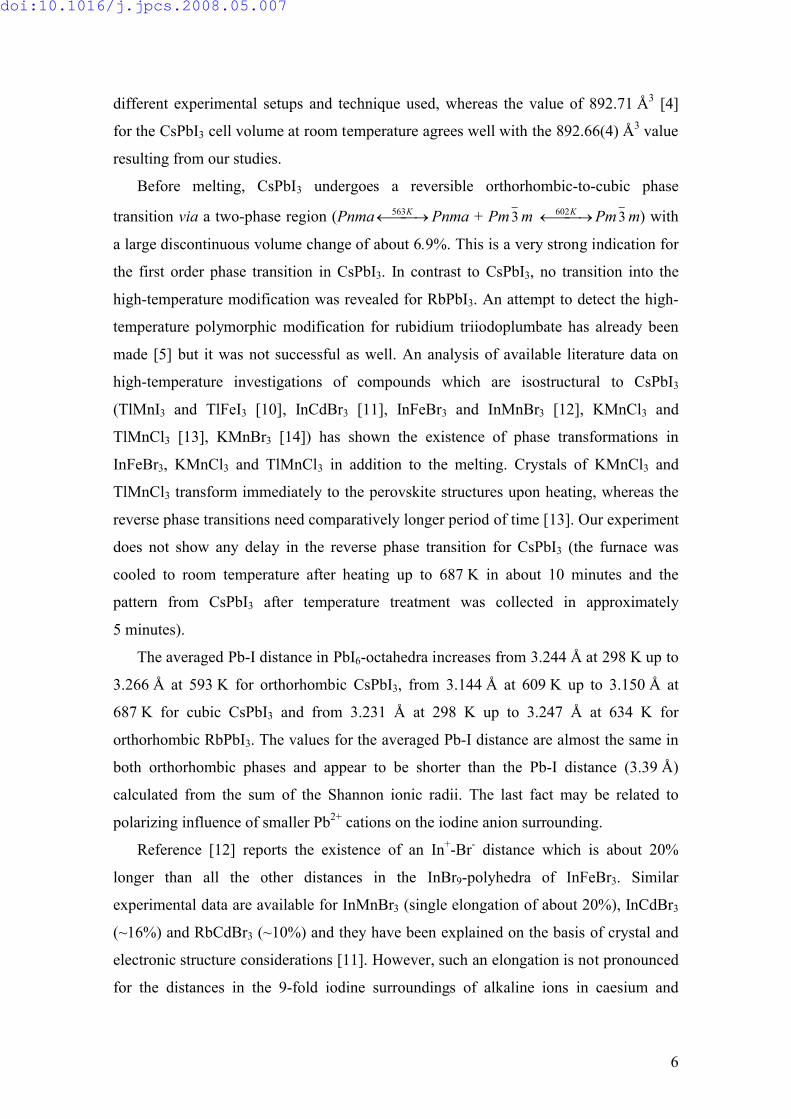
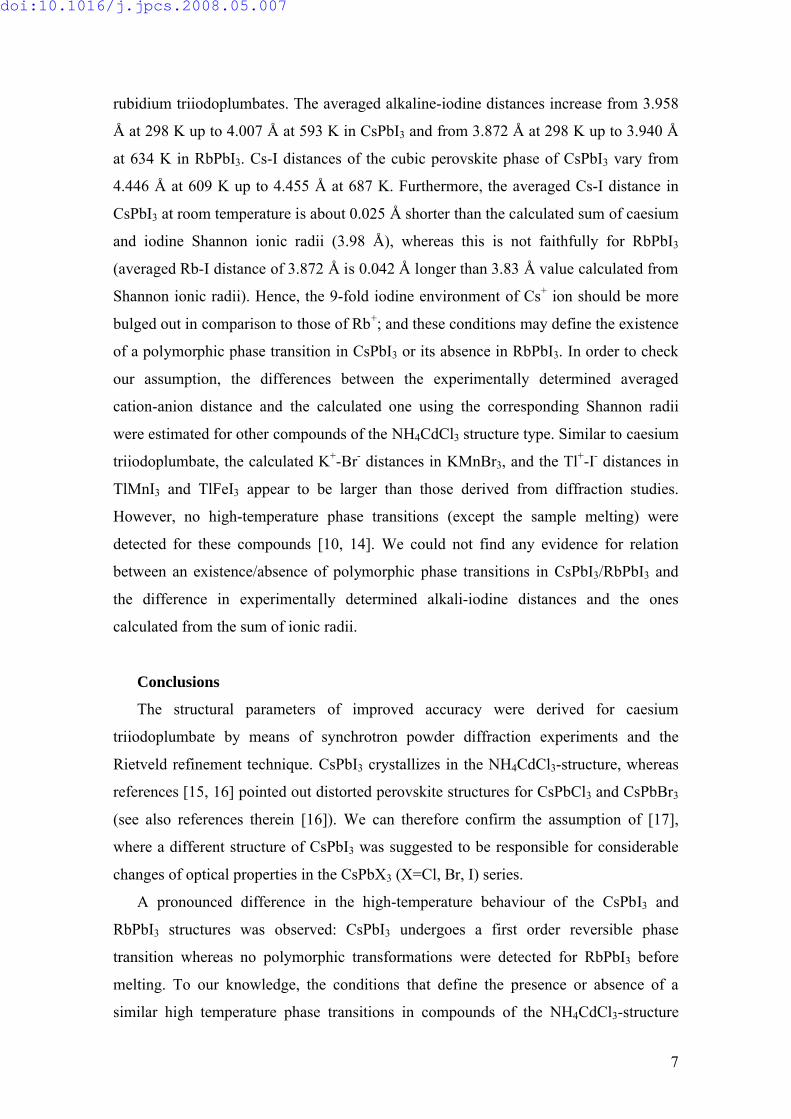
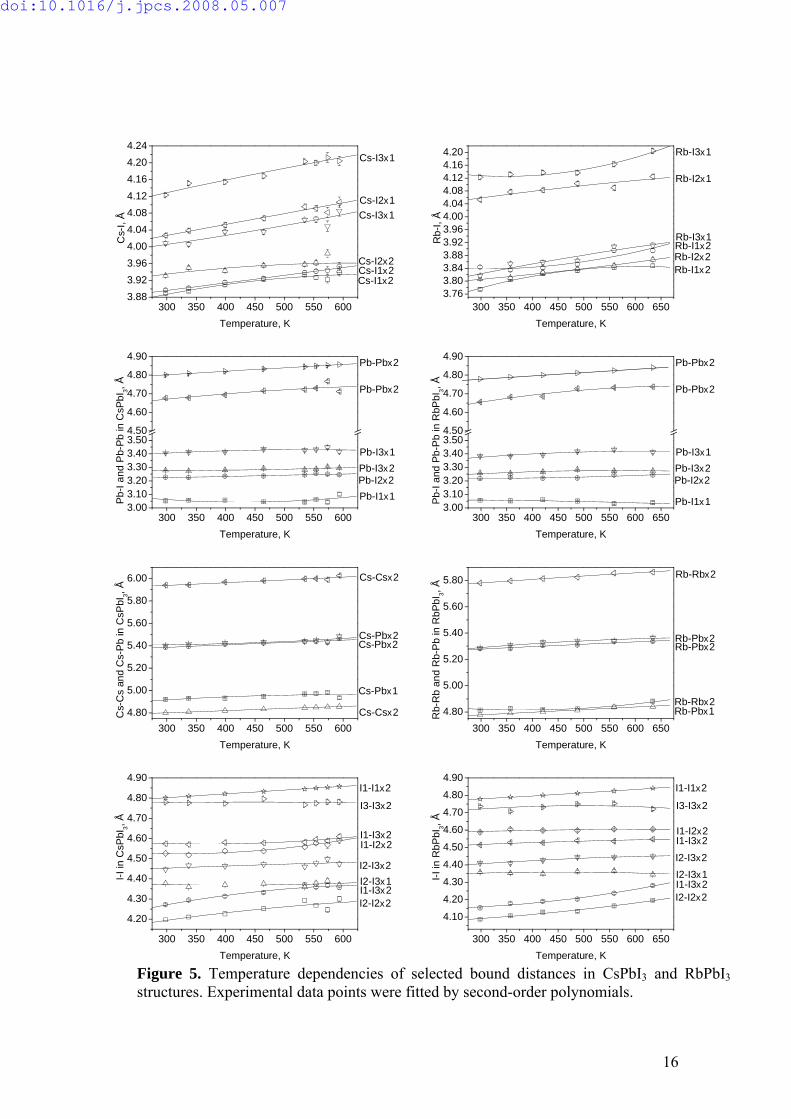
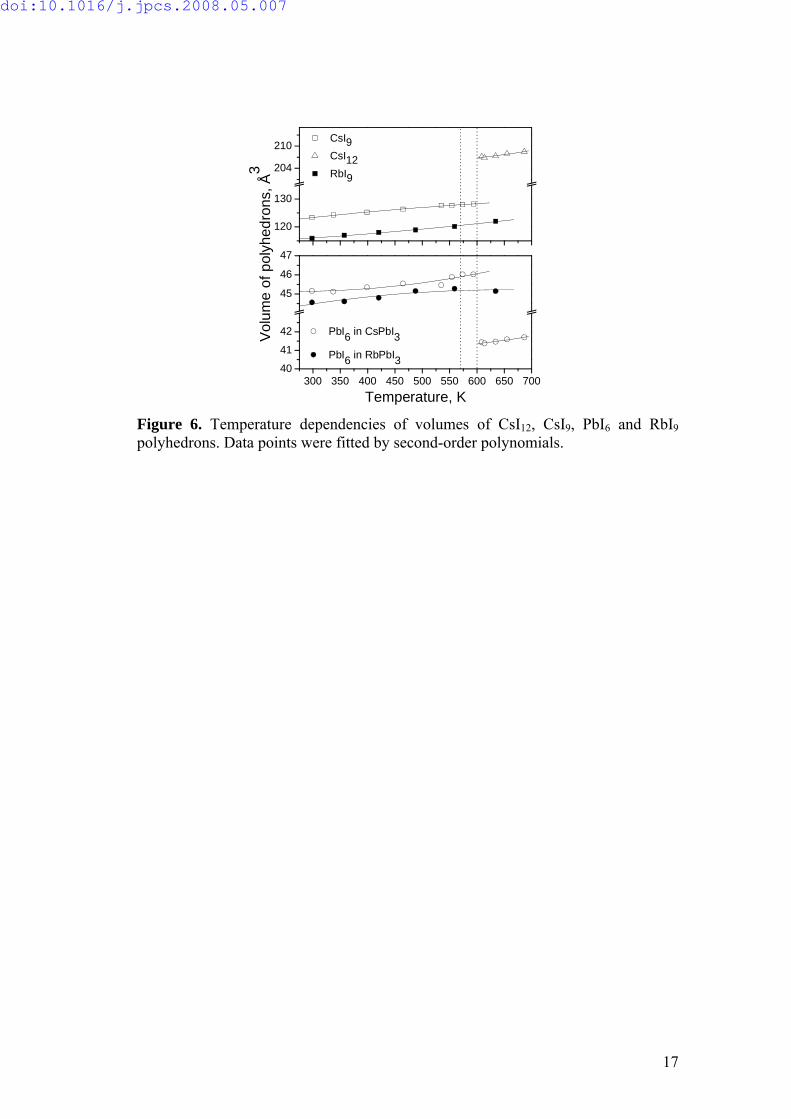
orthorhombic RbPbI3, respectively. Temperature dependencies of selected bond
distances and volumes of CsI9, RbI9, CsI12, PbI6–polyhedrons in CsPbI3 and RbPbI3
structures are presented in figures 5 and 6, respectively. No anomalous behaviour in
those dependences can be observed. Pb−I, Pb−Pb, Cs/Rb−Cs/Rb, Cs/Rb−Pb and I−I
distances are very close in both compounds and exhibit quite similar behaviour upon
temperature increase. The main difference in 9-fold iodine environment of alkaline ion
is that one of the Rb−I3 distances is 7.4% shorter than the longest one, whereas
corresponding Cs−I3 distance in CsPbI3 is only 2.8% shorter. A decrease in the volume
of the PbI6 polyhedron through the orthorhombic↔cubic phase transition is clearly
visible in CsPbI3 (figure 6).
Discussion
A minor difference of 0.2% between our (854.23(12) Å 3) and the literature
(852.33 Å 3 [5]) value of the RbPbI3 cell volume at room temperature can be due to the
doi:10.1016/j.jpcs.2008.05.007
6
different experimental setups and technique used, whereas the value of 892.71 Å 3 [4]
for the CsPbI3 cell volume at room temperature agrees well with the 892.66(4) Å 3 value
resulting from our studies.
Before melting, CsPbI3 undergoes a reversible orthorhombic-to-cubic phase
transition via a two-phase region (Pnma K563 Pnma + Pm 3 m K602 Pm 3 m) with
a large discontinuous volume change of about 6.9%. This is a very strong indication for
the first order phase transition in CsPbI3. In contrast to CsPbI3, no transition into the
high-temperature modification was revealed for RbPbI3. An attempt to detect the high-
temperature polymorphic modification for rubidium triiodoplumbate has already been
made [5] but it was not successful as well. An analysis of available literature data on
high-temperature investigations of compounds which are isostructural to CsPbI3
(TlMnI3 and TlFeI3 [10], InCdBr3 [11], InFeBr3 and InMnBr3 [12], KMnCl3 and
TlMnCl3 [13], KMnBr3 [14]) has shown the existence of phase transformations in
InFeBr3, KMnCl3 and TlMnCl3 in addition to the melting. Crystals of KMnCl3 and
TlMnCl3 transform immediately to the perovskite structures upon heating, whereas the
reverse phase transitions need comparatively longer period of time [13]. Our experiment
does not show any delay in the reverse phase transition for CsPbI3 (the furnace was
cooled to room temperature after heating up to 687 K in about 10 minutes and the
pattern from CsPbI3 after temperature treatment was collected in approximately
5 minutes).
The averaged Pb-I distance in PbI6-octahedra increases from 3.244 Å at 298 K up to
3.266 Å at 593 K for orthorhombic CsPbI3, from 3.144 Å at 609 K up to 3.150 Å at
687 K for cubic CsPbI3 and from 3.231 Å at 298 K up to 3.247 Å at 634 K for
orthorhombic RbPbI3. The values for the averaged Pb-I distance are almost the same in
both orthorhombic phases and appear to be shorter than the Pb-I distance (3.39 Å)
calculated from the sum of the Shannon ionic radii. The last fact may be related to
polarizing influence of smaller Pb2+ cations on the iodine anion surrounding.
Reference [12] reports the existence of an In+-Br- distance which is about 20%
longer than all the other distances in the InBr9-polyhedra of InFeBr3. Similar
experimental data are available for InMnBr3 (single elongation of about 20%), InCdBr3
(~16%) and RbCdBr3 (~10%) and they have been explained on the basis of crystal and
electronic structure considerations [11]. However, such an elongation is not pronounced
for the distances in the 9-fold iodine surroundings of alkaline ions in caesium and
doi:10.1016/j.jpcs.2008.05.007
7
rubidium triiodoplumbates. The averaged alkaline-iodine distances increase from 3.958
Å at 298 K up to 4.007 Å at 593 K in CsPbI3 and from 3.872 Å at 298 K up to 3.940 Å
at 634 K in RbPbI3. Cs-I distances of the cubic perovskite phase of CsPbI3 vary from
4.446 Å at 609 K up to 4.455 Å at 687 K. Furthermore, the averaged Cs-I distance in
CsPbI3 at room temperature is about 0.025 Å shorter than the calculated sum of caesium
and iodine Shannon ionic radii (3.98 Å), whereas this is not faithfully for RbPbI3
(averaged Rb-I distance of 3.872 Å is 0.042 Å longer than 3.83 Å value calculated from
Shannon ionic radii). Hence, the 9-fold iodine environment of Cs+ ion should be more
bulged out in comparison to those of Rb+; and these conditions may define the existence
of a polymorphic phase transition in CsPbI3 or its absence in RbPbI3. In order to check
our assumption, the differences between the experimentally determined averaged
cation-anion distance and the calculated one using the corresponding Shannon radii
were estimated for other compounds of the NH4CdCl3 structure type. Similar to caesium
triiodoplumbate, the calculated K+-Br- distances in KMnBr3, and the Tl+-I- distances in
TlMnI3 and TlFeI3 appear to be larger than those derived from diffraction studies.
However, no high-temperature phase transitions (except the sample melting) were
detected for these compounds [10, 14]. We could not find any evidence for relation
between an existence/absence of polymorphic phase transitions in CsPbI3/RbPbI3 and
the difference in experimentally determined alkali-iodine distances and the ones
calculated from the sum of ionic radii.
Conclusions
The structural parameters of improved accuracy were derived for caesium
triiodoplumbate by means of synchrotron powder diffraction experiments and the
Rietveld refinement technique. CsPbI3 crystallizes in the NH4CdCl3-structure, whereas
references [15, 16] pointed out distorted perovskite structures for CsPbCl3 and CsPbBr3
(see also references therein [16]). We can therefore confirm the assumption of [17],
where a different structure of CsPbI3 was suggested to be responsible for considerable
changes of optical properties in the CsPbX3 (X=Cl, Br, I) series.
A pronounced difference in the high-temperature behaviour of the CsPbI3 and
RbPbI3 structures was observed: CsPbI3 undergoes a first order reversible phase
transition whereas no polymorphic transformations were detected for RbPbI3 before
melting. To our knowledge, the conditions that define the presence or absence of a
similar high temperature phase transitions in compounds of the NH4CdCl3-structure
doi:10.1016/j.jpcs.2008.05.007
8
type are not yet clear. However, further systematic high temperature investigations on
CsxRb1-xPbI3, InMnxFe1-xBr3 and InCdxFe1-xBr3 solid solutions, which are envisaged in
the near future, could probably contribute to a better understanding of the relationships
between structure parameters and the occurrence/absence of phase transitions in this
structure type.
Acknowledgments
The authors are indebt to Dr. G. Stryganyuk (HASYLAB/DESY) and Dr. A. Senyshyn
(TU Darmstadt/TU Munich, FRM-II) for the critical manuscript reading as well as to
Prof. L. Vasylechko (Lviv Polytechnic National University, Ukraine). We are also
grateful to Dr. Th. Vad (TU Dresden) for assisting in the preparation of the manuscript.
The HASYLAB/DESY support of Powder Diffractometer at beamline B2 and financial
support from the Helmholtz Association of National Research Centres (grant number
VH-VI 102) are gratefully acknowledged.
References
[1] A. S. Voloshinovsky, S. V. Myagkota, N. S. Pidzyrailo, Z. A. Khapko, Ukr. Fiz.
Zh.+ 32 (1987) 685–687 (in Russian).
[2] S. V. Myagkota, Opt. Spectrosc.+ 87 (1999) 290–294.
[3] S. Zazubovich, Radiat. Meas. 33 (2001) 699–704.
[4] C. K. Møller, Mat. Fys. Medd. Dan. Vid. 32 (1959) 1–18.
[5] H. J. Haupt, F. Huber and H. Preut, Z. anorg. allg. Chem. 408 (1974) 209–213.
[6] M. Knapp, C. Baehtz, H. Ehrenberg, H. Fuess, J. Synchrotron Radiat. 11 (2004)
328–334.
[7] M. Knapp, V. Joco, C. Baehtz, H. Brecht, A. Berghaeuser, H. Ehrenberg, H. von
Seggern and H. Fuess, Nucl. Instrum. Meth. A 521 (2004) 565–570.
[8] T. Roisnel, J. Rodriguez-Carvajal, Mater. Sci. Forum 378–381 (2001)
118–123.
[9] J. Hutton, R. J. Nelmes, G. M. Meyer, V. R. Eiriksson, J. Phys. C Solid State 12
(1979) 5393–5410; M. Sakata, T. Nishiwaki, J. Harada, J. Phys. Soc. Jpn. 47 (1979)
232–233.
[10] H.W. Zandbegren, J. Solid State Chem. 37 (1981) 189–203.
[11] R. Dronskowski, J. Solid State Chem. 116 (1995) 45–52.
doi:10.1016/j.jpcs.2008.05.007
9
[12] R. Dronskowski, Inorg. Chem. 33 (1994) 5927–5933.
[13] A. Horowitz, M. Amit, J. Makovsky, L. Ben Dor, Z. H. Kalman, J. Solid State
Chem. 43 (1982) 107–125.
[14] H.-J. Seifert, E. Dau, Z. anorg. allg. Chem. 391 (1972) 302–312.
[15] Y. Fujii, S. Hoshino, Y. Yamada, G. Shirane, Phys. Rev. B 9 (1974) 4549-4559.
[16] K. Nitsch, V. Hamplova, M. Nikl, K. Polak, M. Rodova, Chem. Phys. Lett. 258
(1996) 518-522.
[17] F. Somma, M. Nikl, K. Nitsch, P. Fabeni, G.P. Pazzi, J. Lumin. 94-95 (2001) 169-
172.
doi:10.1016/j.jpcs.2008.05.007
10
Table 1: Refined structural parameters and R-factors of CsPbI3 and RbPbI3
CsPbI3 RbPbI3
Temperature (K) 298 634 298 634Space group Pnma Pm 3 m Pnma Pnma
a (Å) 10.4581(3) 6.2894(19) 10.2761(9) 10.4200(4)b (Å) 4.80171(13) — 4.7793(4) 4.84098(16)c (Å) 17.7761(5) — 17.3933(12) 17.6145(5)
V (Å 3) / Z 892.66(4) / 4 248.784(13) / 1 854.23(12) / 4 888.53(5) / 4site 4(c) 1(b) 4(c) 4(c)x/a 0.4156(3) ½ 0.4166(5) 0.4159(6) y/b ¼ ½ ¼ ¼ z/c 0.82924(19) ½ 0.8263(3) 0.8264(4)
Uiso (Å2) 0.025(3) 0.159(2) 0.033(5) 0.092(9) U11 0.024(3) — 0.044(5) 0.104(9) U22 0.032(3) — 0.034(5) 0.107(10) U33 0.017(3) — 0.020(4) 0.064(8)
Cs/Rb
U13 -0.008(2) — 0.003(3) 0.000(5) site 4(c) 1(a) 4(c) 4(c)x/a 0.16049(18) 0 0.1662(2) 0.1662(3) y/b ¼ 0 ¼ ¼ z/c 0.06185(11) 0 0.06001(11) 0.06080(17)
Uiso (Å2) 0.0111(10) 0.0392(9) 0.0172(16) 0.051(3) U11 0.0034(4) — 0.0237(17) 0.061(3) U22 0.0201(15) — 0.0215(16) 0.046(3) U33 0.0097(10) — 0.0065(14) 0.047(3)
Pb
U13 0.0008(14) — -0.0024(15) -0.009(3) site 4(c) 3(d) 4(c) 4(c)x/a 0.2997(3) ½ 0.3068(3) 0.3048(4) y/b ¼ 0 ¼ ¼ z/c 0.2127(2) 0 0.2149(2) 0.2126(3)
Uiso (Å2) 0.025(3) 0.194(3) 0.027(3) 0.071(5) U11 0.045(3) 0.015(2) 0.039(3) 0.092(5) U22 0.015(3) 0.283(3) 0.022(3) 0.069(5) U33 0.016(3) 0.283(3) 0.018(3) 0.052(5)
I1
U13 -0.001(2) 0 -0.011(3) -0.023(5) site 4(c) — 4(c) 4(c)x/a 0.3355(3) — 0.3396(4) 0.3363(5) y/b ¾ — ¾ ¾ z/c 0.99790(19) — 0.99020(18) 0.9910(2)
Uiso (Å2) 0.021(3) — 0.025(3) 0.075(6) U11 0.016(2) — 0.020(3) 0.100(6) U22 0.019(3) — 0.029(3) 0.068(5) U33 0.028(3) — 0.026(3) 0.056(6)
I2 in 4c
U13 -0.005(2) — 0.007(3) 0.002(4) site 4(c) — 4(c) 4(c)x/a 0.0331(3) — 0.0272(3) 0.0252(4) y/b ¼ — ¼ ¼ z/c 0.88541(19) — 0.8837(2) 0.8860(3)
Uiso (Å2) 0.015(3) — 0.018(3) 0.051(5) U11 0.013(2) — 0.015(3) 0.039(5) U22 0.022(3) — 0.035(3) 0.065(5) U33 0.009(3) — 0.003(2) 0.050(5)
I3
U13 0.001(2) — -0.005(2) -0.006(3) RBragg(%) /RF(%) /χ2 5.6/6.1/10.1 6.4/6.3/11.5 4.9/5.4/9.3 6.0/9.6/8.2
doi:10.1016/j.jpcs.2008.05.007
11
Table 2: Comparison of bound distances and angles of CsPbI3 and RbPbI3
RbPbI3 at 298 K RbPbI3 at 634 K CsPbI3 at 298 K CsPbI3 at 634 K
Cs/Rb - I1 × 2 3.7747(47) 3.8476(59) 3.8892(37) Cs - I ×12 4.4473Cs/Rb - I1 × 2 3.8430(48) 3.8928(63) 3.8968(35) Cs - Pb ×8 5.4468Cs/Rb – I2 × 2 3.8068(48) 3.8684(62) 3.9312(38) Cs - Cs ×6 6.2894Cs/Rb – I3 × 1 3.8164(62) 3.9072(87) 4.0086(47) Pb - I ×6 3.1447Cs/Rb – I2 × 1 4.0530(63) 4.1266(80) 4.0271(46) Pb – Pb×6 6.2894Cs/Rb – I3 × 1 4.1327(60) 4.2053(76) 4.1230(45) I - I ×8 4.4473‹Cs/Rb – I›9 3.872 3.940 3.958 I - I ×6 6.2894Cs/Rb – Pb × 1 4.8138(56) 4.8815(75) 4.9209(38)
Cs/Rb – Pb × 2 5.2822(50) 5.3353(68) 5.3842(35)
Cs/Rb – Pb × 2 5.2873(49) 5.3644(63) 5.4006(33)
Pb – I1 × 1 3.0568(39) 3.0388(59) 3.0513(40)
Pb – I2 × 2 3.2162(29) 3.2415(38) 3.2259(25)
Pb – I3 × 2 3.2576(26) 3.2733(36) 3.2775(25)
Pb – I3 × 1 3.3822(39) 3.4133(59) 3.4076(39)
‹Pb – I›6 3.231 3.247 3.244
Pb – Pb × 2 4.6550(24) 4.7371(38) 4.6763(23)
I1 – I3 × 2 4.1525(39) 4.2805(59) 4.2717(40)
I1 – I2 × 2 4.5881(40) 4.6047(54) 4.5259(42)
I1 – I3 × 2 4.5142(38) 4.5474(53) 4.5738(39)
I1 – I2 × 1 5.0217(47) 5.1189(64) 5.2632(49)
I2 – I2 × 2 4.0880(47) 4.1967(60) 4.1962(36)
I2 – I3 × 1 4.3574(50) 4.3445(66) 4.3775(45)
I2 – I3 × 2 4.4110(42) 4.4491(55) 4.4457(38)
I3 – I3 × 2 4.7363(42) 4.7212(64) 4.7792(41)
I1 – Cs/Rb – I1 × 1 78.538 77.966 76.065
I1 – Cs/Rb – I1 × 1 76.884 76.894 76.241
I1 – Cs/Rb – I1 × 2 87.78(10) 87.938(126) 87.714(64)
I1 – Cs/Rb – I1 × 2 138.445 138.274 136.119
I1 – Cs/Rb – I2 × 2 71.667(1) 70.442 69.641(1)
I1 – Cs/Rb – I2 × 2 140.047(1) 140.430 141.320(1)
I1 – Cs/Rb – I2 × 2 84.337(93) 84.397(125) 86.127(64)
I1 – Cs/Rb – I2 ×2 134.151 133.599 133.235
I1 – Cs/Rb – I2 ×2 82.058(77) 82.531(118) 84.598(62)
I1 – Cs/Rb – I2 ×2 129.96 130.400 131.29
I1 – Pb – I2 ×2 93.975(3) 92.253 92.234(6)
I1 – Pb – I3 ×2 91.214(10) 92.103(7) 92.485(5)
I1 – Pb – I3 ×1 176.754(110) 177.161(166) 174.516(110)
I2 – Pb – I2 ×1 95.956 96.613 96.189
I2 – Pb – I3 ×2 84.608(46) 83.651(68) 84.612(42)
I2 – Pb – I3 ×2 174.727(1) 173.598 175.179(1)
I2 – Pb – I3 ×2 83.862(2) 83.868(3) 84.115(2)
I3 – Pb – I3 ×2 90.993(12) 89.807(57) 91.247(10)
doi:10.1016/j.jpcs.2008.05.007
12
5 10 15 20 25 30
Inte
nsity
, arb
. u.
2, deg.
CsPbI3, T=298 K
Pnma
5 10 15 20 25 30
Inte
nsity
, arb
. u.
2, deg.
CsPbI3, T=634 K
Pm3m
5 10 15 20 25 30
Inte
nsity
, arb
. u.
2, deg.
RbPbI3, T=298 K
Pnma
Figure 1. The results of Rietveld refinements: points are experimental data, the lines are calculated profiles and the lower curves their differences. Tick marks show the calculated positions of CsPbI3 and RbPbI3 reflections.
doi:10.1016/j.jpcs.2008.05.007
13
(a)
(b) (c)
Figure 2. The structures of CsPbI3 at room temperature (a) and at T=634 K (c). (b) – iodine surroundings of alkaline and Pb2+ cations. Plots (a), (b) and (c) show the thermal ellipsoids at the 100%, 100% and 50% probability level, respectively.
doi:10.1016/j.jpcs.2008.05.007
14
300 350 400 450 500 550 600 650 7004.7604.7804.8004.8204.8404.860
b, Å
Temperature, K
6.2406.2606.2806.3006.3206.340
acu
b, Å
10.30010.35010.40010.45010.50010.550
a, Å
17.400
17.600
17.800
18.000
c, Å
212.00216.00220.00224.00228.00232.00
CsPbI3 RbPbI3
V/Z
and
Vcu
b/Z
, Å3
244.00
248.00
252.00
256.00
Figure 3. Temperature evolution of cell dimensions of CsPbI3 and RbPbI3. Two dotted vertical lines represent the boundaries of mixed Pnma + Pm 3 m region in CsPbI3.
doi:10.1016/j.jpcs.2008.05.007
15
300 350 400 450 500 550 600 650
0.0
0.4
0.8
1.2
1.6
Temperature, K
Rel
ativ
e ex
pan
sion
, %
a, CsPbI3b, CsPbI3c, CsPbI3
0.0
0.4
0.8
1.2
1.6a, RbPbI3b, RbPbI3c, RbPbI3
0.0
1.0
2.0
3.0
4.0 V, CsPbI3V, RbPbI3
Figure 4. Relative expansions in CsPbI3 and RbPbI3 structures.
doi:10.1016/j.jpcs.2008.05.007
16
300 350 400 450 500 550 6003.88
3.92
3.96
4.00
4.04
4.08
4.12
4.16
4.20
4.24Cs-I3x1
Cs-I2x1
Cs-I3x1
Cs-I2x2Cs-I1x2
Cs-
I, Å
Temperature, K
Cs-I1x2
300 350 400 450 500 550 600 6503.763.803.843.883.923.964.004.044.084.124.164.20 Rb-I3x1
Rb-I2x1
Rb-I3x1
Rb-I2x2Rb-I1x2R
b-I
, Å
Temperature, K
Rb-I1x2
300 350 400 450 500 550 6003.003.103.203.303.403.504.50
4.60
4.70
4.80
4.90Pb-Pbx2
Pb-Pbx2
Pb-I3x1
Pb-I2x2Pb-I3x2
Pb
-I a
nd
Pb-
Pb
in C
sPb
I 3, Å
Temperature, K
Pb-I1x1
300 350 400 450 500 550 600 6503.003.103.203.303.403.504.50
4.60
4.70
4.80
4.90Pb-Pbx2
Pb-Pbx2
Pb-I3x1
Pb-I2x2Pb-I3x2
Pb
-I a
nd P
b-P
b in
RbP
bI3, Å
Temperature, K
Pb-I1x1
300 350 400 450 500 550 600
4.80
5.00
5.20
5.40
5.60
5.80
6.00
Cs-Pbx2
Cs-Csx2
Cs-Pbx2
Cs-Pbx1
Cs-
Cs
and
Cs-
Pb
in C
sPbI
3, Å
Temperature, K
Cs-Csx2
300 350 400 450 500 550 600 650
4.80
5.00
5.20
5.40
5.60
5.80
Rb-Pbx2
Rb-Rbx2
Rb-Pbx2
Rb-Rbx2
Rb-
Rb
an
d R
b-P
b in
Rb
Pb
I 3, Å
Temperature, K
Rb-Pbx1
300 350 400 450 500 550 600
4.20
4.30
4.40
4.50
4.60
4.70
4.80
4.90
I3-I3x2
I1-I3x2
I2-I3x2
I2-I3x1
I1-I2x2
I1-I1x2
I1-I3x2
I-I i
n C
sPbI
3, Å
Temperature, K
I2-I2x2
300 350 400 450 500 550 600 650
4.10
4.20
4.30
4.40
4.50
4.60
4.70
4.80
4.90
I3-I3x2
I1-I3x2
I2-I3x2
I2-I3x1
I1-I2x2
I1-I1x2
I1-I3x2
I-I i
n R
bP
bI3,
Å
Temperature, K
I2-I2x2
Figure 5. Temperature dependencies of selected bound distances in CsPbI3 and RbPbI3
structures. Experimental data points were fitted by second-order polynomials.
doi:10.1016/j.jpcs.2008.05.007
17
300 350 400 450 500 550 600 650 70040
41
42
45
46
47
PbI6 in CsPbI3
PbI6 in RbPbI3
Vol
ume
of p
olyh
edro
ns, Å
3
Temperature, K
120
130
204
210 CsI9 CsI12 RbI9
Figure 6. Temperature dependencies of volumes of CsI12, CsI9, PbI6 and RbI9
polyhedrons. Data points were fitted by second-order polynomials.
doi:10.1016/j.jpcs.2008.05.007