laser spectroscopy with rubidium
TRANSCRIPT
Laser spectroscopy with rubidium
Versuchsanleitung zum Fortgeschrittenen-Praktikum
Humboldt-Universität zu Berlin
Institut für Physik
AG Optische Metrologie
Room: NEW 15, 2‘107, Phone (intern): 7974
Please bring the following: USB stick, Laptop, this document (Versuchsanleitung) printed.
Autor: Aline Dinkelaker, Marek Mandel, Sana Pyka
Stand: May 17
I
Table of Contents
1 Introduction .............................................................................................................. 2
2 Atom-light interaction ............................................................................................... 3
2.1 Absorption and Emission ............................................................................................. 4
2.2 Doppler-free Saturated Absorption Spectroscopy ...................................................... 6
3 Properties of Rubidium .............................................................................................. 7
4 Optical Setup ............................................................................................................. 8
4.1 Absorption Spectroscopy............................................................................................. 9
4.1.1 Doppler-free saturated absorption spectroscopy.............................................. 10
4.1.2 Error signal ......................................................................................................... 11
5 Instructions for using control and measurement equipment. ................................... 11
5.1 Switching on of cooling laser and changing the laser frequency .............................. 12
6 Tasks ....................................................................................................................... 13
Appendix ........................................................................................................................ 16
A.1 User guide oscilloscope .................................................................................................. 16
General ............................................................................................................................. 16
Trigger............................................................................................................................... 17
Data storage ..................................................................................................................... 17
A.2 The error signal in the Doppler-free saturated absorption spectroscopy ..................... 19
A.3 Locking a laser – feedback loop ..................................................................................... 20
Laser safety information ................................................................................................. 22
Anlage zur Lasersicherheit .............................................................................................. 23
Stand: Mai 17 2
1 Introduction
Spectroscopy is an important tool for different aspects of science: on the one hand, it can be
used to determine the composition of distant stars by comparing the absorbed or emitted
light of a gas to known atomic transitions. On the other hand, spectroscopy can also be used
to stabilize laser light to an absolute frequency. Here, the reference frequency it the absorp-
tion frequency, i.e. the energy that is necessary to change an atomic state. In order to stabilize
the laser to a specific atomic transition, which is part of an atomic spectrum, additional locking
electronics (or feedback electronics) has to be used.
Stable laser frequencies are required for a number of different applications. For rubidium,
important applications are the creation and manipulation of ultra-cold atoms. Ultra-cold at-
oms can improve the precision of atomic clocks, they can be used for creation and studies of
Bose-Einstein-condensates as well as for applications in quantum information.
As part of this experiment, you are required to first record a Doppler-broadened and secondly
a Doppler-free absorption spectrum of rubidium atoms in a gas cell.
Using literature values of the hyperfine structure, the frequency axis of the spectrum has to
be calibrated, and the Doppler broadening estimated by fitting the Doppler-broadened spec-
trum.
The experiment requires knowledge of saturated absorption spectroscopy, the working prin-
ciple of a laser, as well as the hyperfine splitting of atoms, specifically of rubidium.
This document is an introduction to these topics and aims to explain the experiment’s setup
and tasks. It also includes short procedures on how to use the equipment. Please bring this
document, as well as an USB stick.
Please be well prepared for the experiment! Read your tasks in chapter 6 thoroughly and plan
the experiment execution. Focus your preparations on these points:
Interaction of light and matter
Hyperfine structure of 87Rb (specifically the D2 line)
Working concept of a diode laser, optical elements (wave plates, polarizing beam split-
ter, …)
Doppler-broadened and Doppler-free saturated absorption spectroscopy
Stand: Mai 17 3
Recommended further reading:
Demtröder, W. (2010): Experimentalphysik 3 - Atome, Moleküle und Festkörper, 4.
Auflage, Springer-Verlag (Abschnitt 10.1, Spektroskopische Verfahren, speziell
10.2.7, Sättigungsspektroskopie)
Demtröder, W. (2011): Laserspektroskopie 1 - Grundlagen, 6. Auflage, Springer-
Verlag (Abschnitt 3.2, Doppler-Verbreiterung und Abschnitt 5.6.1, Halbleiterlaser)
Bjorklund, G.C. et al. (1983): Frequency Modulation (FM) Spectroscopy - Theory of
Lineshapes and Signal-to-Noise Analysis, Applied Physics B
Wieman, C.E. and Hollberg, L. (1990): Using diode lasers for atomic physics, Univer-
sity of Colorado & National Institute of Standards and Technology
Steck, D. A. (2010): Rubidium 87 D Line Data; http://steck.us/alkalidata/rubid-
ium87numbers.pdf
Finally, please read the attachment on laser safety! If you have any questions, please ask your
experiment supervisor.
If you have constructive criticism regarding the experiment itself or this document, please give
feedback.
2 Atom-light interaction
Atoms can take on different energetic states, which are described by different quantum num-
bers. Due to conservation of energy, light has to be absorbed if the atom changes its state
from lower to higher energy level, and light is emitted if the atom falls back into a lower energy
state. The energy levels are quantized. As a result, only specific frequencies can be absorbed
and emitted. The frequencies can be visualized using spectroscopy: a laser beam goes through
a gas cell. The laser frequency is changed periodically (the frequency is “scanned”). When the
transmitted light is analysed (e.g. using a photo diode), it shows a frequency-dependent in-
tensity: Because light is absorbed near the resonance frequency, less light is transmitted
through the cell.
Over time, higher resolution methods were developed, so that more detailed spectra could
be detected. For this experiment, the fine structure as well as the hyperfine structure are im-
portant: the electron has an orbital angular momentum as well as a spin. The relative direction
between these results in different energy levels: This is the fine structure.
Additionally, the electron’s total angular momentum interacts with the nucleus’ magnetic mo-
ment, which results in a (much smaller) splitting of the energy level into the hyperfine struc-
ture. The energy levels of rubidium are described in chapter 3.
Stand: Mai 17 4
2.1 Absorption and Emission
The transition between different atomic energy levels is either caused by the absorption of
light, or it results in the emission of light. If light of a specific frequency is shone into the gas
cell, there is a probability that the light is absorbed. The probability of absorption depend on
the light intensity and its frequency with respect to the atomic transition frequency (resonance
frequency, 𝑓0). The energy that is required to excite an atom into a different energy level is
not infinitely precise: Each energy level has a linewidth. This means that the atomic transition
can be driven by frequencies within a finite width around 𝑓0. The same is valid for the emitted
light.
If we measure the light intensity after the gas cell, the absorption profile has a Lorentz form
and is described through this equation:
𝐼(𝑓) = 𝐼0
Γ/2𝜋
(𝑓 − 𝑓0)2 + (Γ 2⁄ )2
The half width, Γ, of this profile is called the natural linewidth of a transition. In reality, the
actually observed width of a transition is usually larger than Γ, because there are several dif-
ferent mechanisms that lead to line broadening. For this experiment, we focus on Doppler-
broadening. Here, we consider an atomic gas at room temperature with incoming laser beam
along the x-axis. The atoms move with several hundred meters per seconds through space.
Thus, the atoms see the laser frequency, 𝑓𝐿, Doppler-shifted as frequency 𝑓′. Light and atoms
interact, if the light is in resonance to the atoms, i.e. 𝑓′ = 𝑓0, with the following condition for
the laser frequency:
𝑓𝐿 = 𝑓0 (1 +𝑣
𝑐).
Because the Doppler-effect depends on the atom’s velocity, the atomic velocity distribution
will affect the linewidth (here, only the atomic velocity along the beam is relevant).
Atoms in the gas cell at temperature T follow the Maxwell-Boltzmann velocity distribution, i.e.
the probability to find an atom with velocity between 𝑣 and 𝑣 + 𝑑𝑣 is described by a Gaussian:
𝑃(𝑣)𝑑𝑣 = √𝑀𝑅𝑏
2𝜋𝑘𝐵𝑇∙ exp (−
𝑀𝑅𝑏𝑣2
2𝑘𝐵𝑇) 𝑑𝑣
Here, 𝑀𝑅𝑏ist the mass of a rubidium atom, and 𝑘𝐵is the Boltzmann constant. In order to cal-
culate the probability of absorption for a specific laser frequency, the velocity 𝑣 must be re-
placed with a function of 𝑓𝐿. From the Doppler-shift we obtain the expression 𝑣 = (𝑓𝐿 −
𝑓0)𝑐
𝑓0 from which we get 𝑑𝑣 =
𝑐
𝑓0𝑑𝑓𝐿 . Both is substituted in 𝑃(𝑣)𝑑𝑣 to obtain 𝑃(𝑓𝐿)𝑑𝑓𝐿:
Stand: Mai 17 5
𝑃(𝑓𝐿)𝑑𝑓𝐿 = √𝑀𝑅𝑏
2𝜋𝑘𝐵𝑇∙
𝑐
𝑓0∙ exp (−
𝑀𝑅𝑏(𝑓𝐿 − 𝑓0)2𝑐2
2𝑘𝐵𝑇𝑓02 ) 𝑑𝑓𝐿 .
We now look for an expression of the Full Width at Half Maximum (FWHM) of the absorption
probability as a function of the laser frequency. With the new standard deviation 𝜎 =𝑓0
𝑐√
𝑘𝐵𝑇
𝑀𝑅𝑏,
the Full Width at Half Maximum is:
∆𝑓1/2 = 2 ∙ 𝜎 ∙ √2ln (2) = 2 ∙𝑓0
𝑐∙ √
2𝑘𝐵𝑇
𝑀𝑅𝑏ln (2)
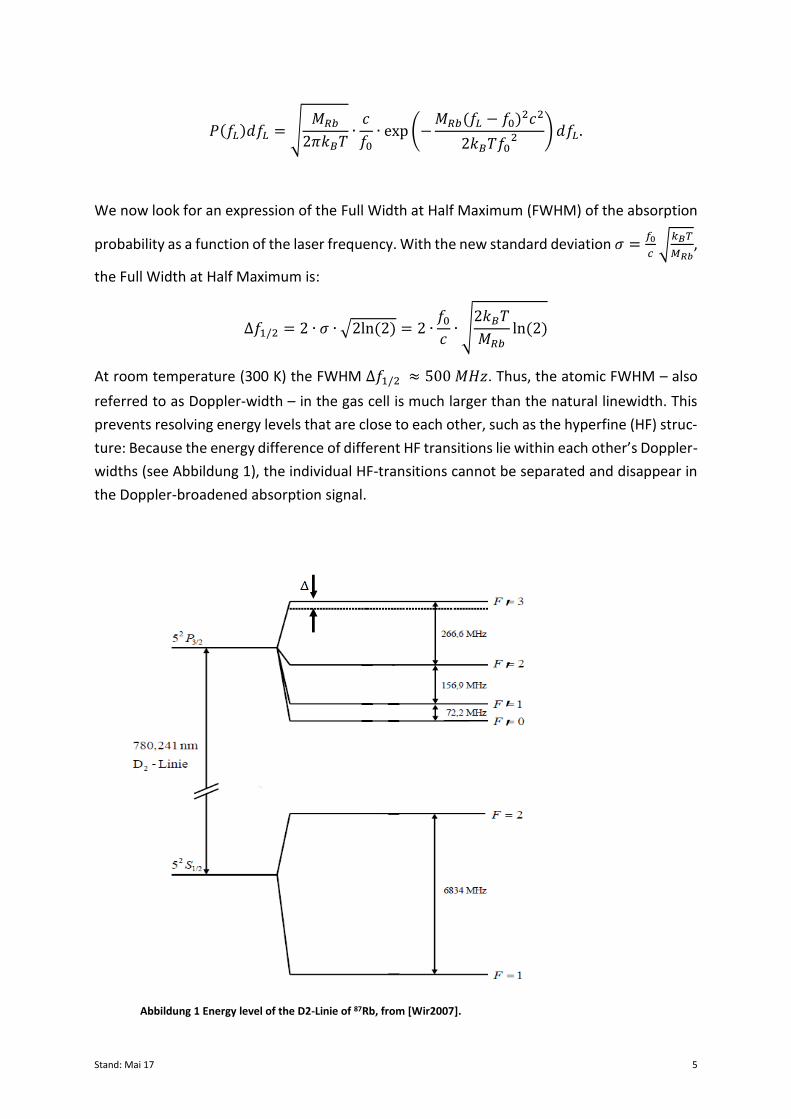
At room temperature (300 K) the FWHM ∆𝑓1/2 ≈ 500 𝑀𝐻𝑧. Thus, the atomic FWHM – also
referred to as Doppler-width – in the gas cell is much larger than the natural linewidth. This
prevents resolving energy levels that are close to each other, such as the hyperfine (HF) struc-
ture: Because the energy difference of different HF transitions lie within each other’s Doppler-
widths (see Abbildung 1), the individual HF-transitions cannot be separated and disappear in
the Doppler-broadened absorption signal.
'
'
' '
Abbildung 1 Energy level of the D2-Linie of 87Rb, from [Wir2007].
Stand: Mai 17 6
To be able to resolve the hyperfine transitions on which the laser can be stabilized, Doppler-
free saturated absorption spectroscopy is used. This brings the hidden peaks of the hyperfine-
structure back from the Doppler-background and makes them visible.
Note: For a better representation of the absorption, the Lorentz-profile of the individual tran-
sitions has to be convoluted with the Gauss-profile of the Doppler-broadening, which result in
a Voigt-profile with a Voigt-width.
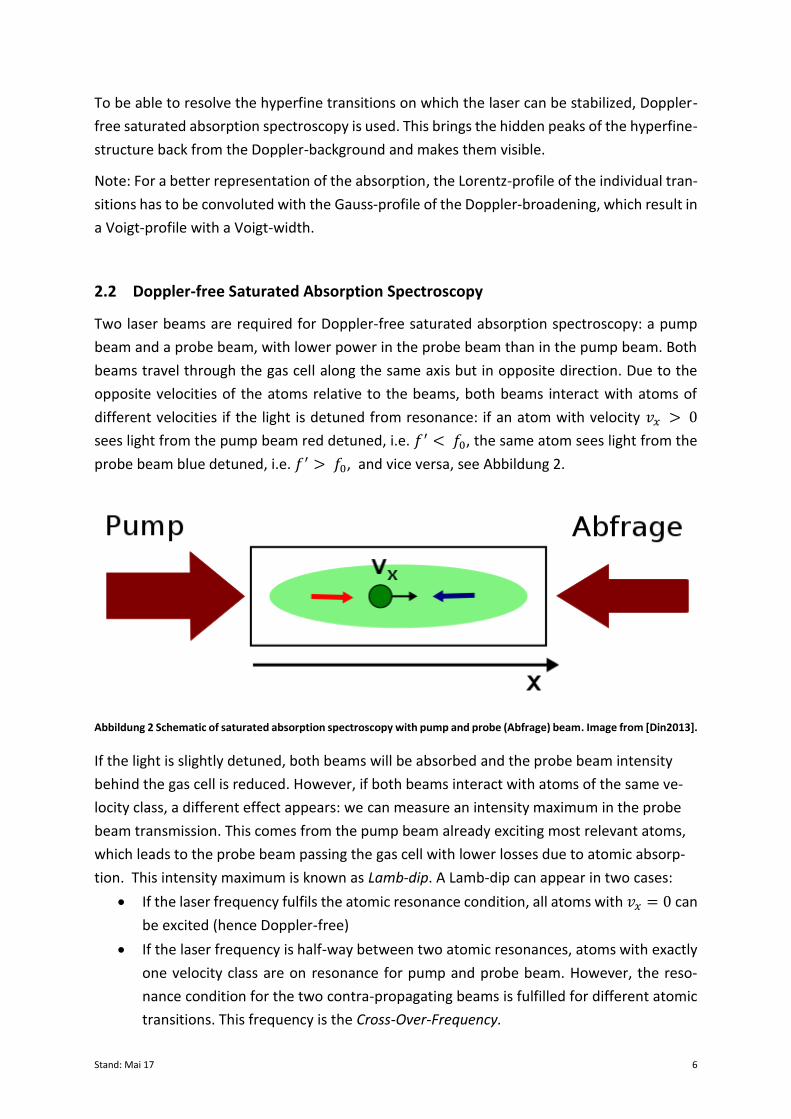
2.2 Doppler-free Saturated Absorption Spectroscopy
Two laser beams are required for Doppler-free saturated absorption spectroscopy: a pump
beam and a probe beam, with lower power in the probe beam than in the pump beam. Both
beams travel through the gas cell along the same axis but in opposite direction. Due to the
opposite velocities of the atoms relative to the beams, both beams interact with atoms of
different velocities if the light is detuned from resonance: if an atom with velocity 𝑣𝑥 > 0
sees light from the pump beam red detuned, i.e. 𝑓′ < 𝑓0, the same atom sees light from the
probe beam blue detuned, i.e. 𝑓′ > 𝑓0, and vice versa, see Abbildung 2.
Abbildung 2 Schematic of saturated absorption spectroscopy with pump and probe (Abfrage) beam. Image from [Din2013].
If the light is slightly detuned, both beams will be absorbed and the probe beam intensity
behind the gas cell is reduced. However, if both beams interact with atoms of the same ve-
locity class, a different effect appears: we can measure an intensity maximum in the probe
beam transmission. This comes from the pump beam already exciting most relevant atoms,
which leads to the probe beam passing the gas cell with lower losses due to atomic absorp-
tion. This intensity maximum is known as Lamb-dip. A Lamb-dip can appear in two cases:
If the laser frequency fulfils the atomic resonance condition, all atoms with 𝑣𝑥 = 0 can
be excited (hence Doppler-free)
If the laser frequency is half-way between two atomic resonances, atoms with exactly
one velocity class are on resonance for pump and probe beam. However, the reso-
nance condition for the two contra-propagating beams is fulfilled for different atomic
transitions. This frequency is the Cross-Over-Frequency.
Stand: Mai 17 7
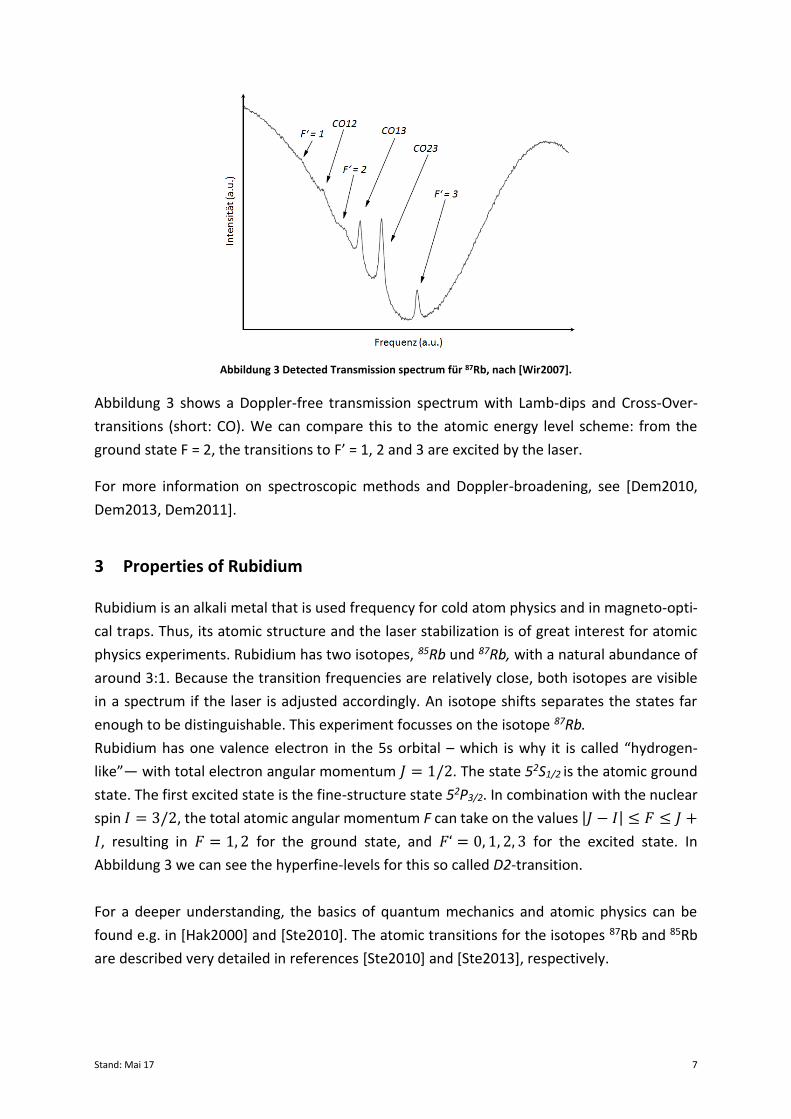
Abbildung 3 Detected Transmission spectrum für 87Rb, nach [Wir2007].
Abbildung 3 shows a Doppler-free transmission spectrum with Lamb-dips and Cross-Over-
transitions (short: CO). We can compare this to the atomic energy level scheme: from the
ground state F = 2, the transitions to F’ = 1, 2 and 3 are excited by the laser.
For more information on spectroscopic methods and Doppler-broadening, see [Dem2010,
Dem2013, Dem2011].
3 Properties of Rubidium
Rubidium is an alkali metal that is used frequency for cold atom physics and in magneto-opti-
cal traps. Thus, its atomic structure and the laser stabilization is of great interest for atomic
physics experiments. Rubidium has two isotopes, 85Rb und 87Rb, with a natural abundance of
around 3:1. Because the transition frequencies are relatively close, both isotopes are visible
in a spectrum if the laser is adjusted accordingly. An isotope shifts separates the states far
enough to be distinguishable. This experiment focusses on the isotope 87Rb.
Rubidium has one valence electron in the 5s orbital – which is why it is called “hydrogen-
like”— with total electron angular momentum 𝐽 = 1/2. The state 52S1/2 is the atomic ground
state. The first excited state is the fine-structure state 52P3/2. In combination with the nuclear
spin 𝐼 = 3/2, the total atomic angular momentum F can take on the values |𝐽 − 𝐼| ≤ 𝐹 ≤ 𝐽 +
𝐼, resulting in 𝐹 = 1, 2 for the ground state, and 𝐹‘ = 0, 1, 2, 3 for the excited state. In
Abbildung 3 we can see the hyperfine-levels for this so called D2-transition.
For a deeper understanding, the basics of quantum mechanics and atomic physics can be
found e.g. in [Hak2000] and [Ste2010]. The atomic transitions for the isotopes 87Rb and 85Rb
are described very detailed in references [Ste2010] and [Ste2013], respectively.
Stand: Mai 17 8
4 Optical Setup
The optical setup for saturated absorption spectroscopy is part of a bigger atomic physics ex-
periment. Here, we will describe only the spectroscopy setup. The optical elements in the
setup guide and shape the beam. The optics have to be changed and setup correctly as part
of this experiment, so that two different kinds of spectroscopy can be recorded. The laser light
for this experiment comes from a semiconductor laser, more specifically from a distributed
feedback diode (DFB diode). Further reading on the topic of diode lasers can be found in ref-
erence [Wie1990]. The laser light has a wavelength of 𝜆 = 780 nm. The laser source is labelled
„Laser 1” (in the context of the bigger atomic physics experiment, it is also called „Cooling
laser / „Kühllaser”). Light exits laser diode and passes a collimator lens. The light has a linear
polarisation. Using 𝜆/2-wave plates, the light intensity ratio after the polarizing beam splitters
(short: PBS) can be adjusted. The light that goes straight through the first PBS, right after the
laser, is guided to parts of the setup of the larger atomic physics experiment, which is not used
here. That path should be blocked and the optics should not be changed. The light that is
rejected at the first beam cube, i.e. the light that comes at a 90° angle, is used for the spec-
troscopy setup (see chapter 4.1). This part of the setup is described in the following section.
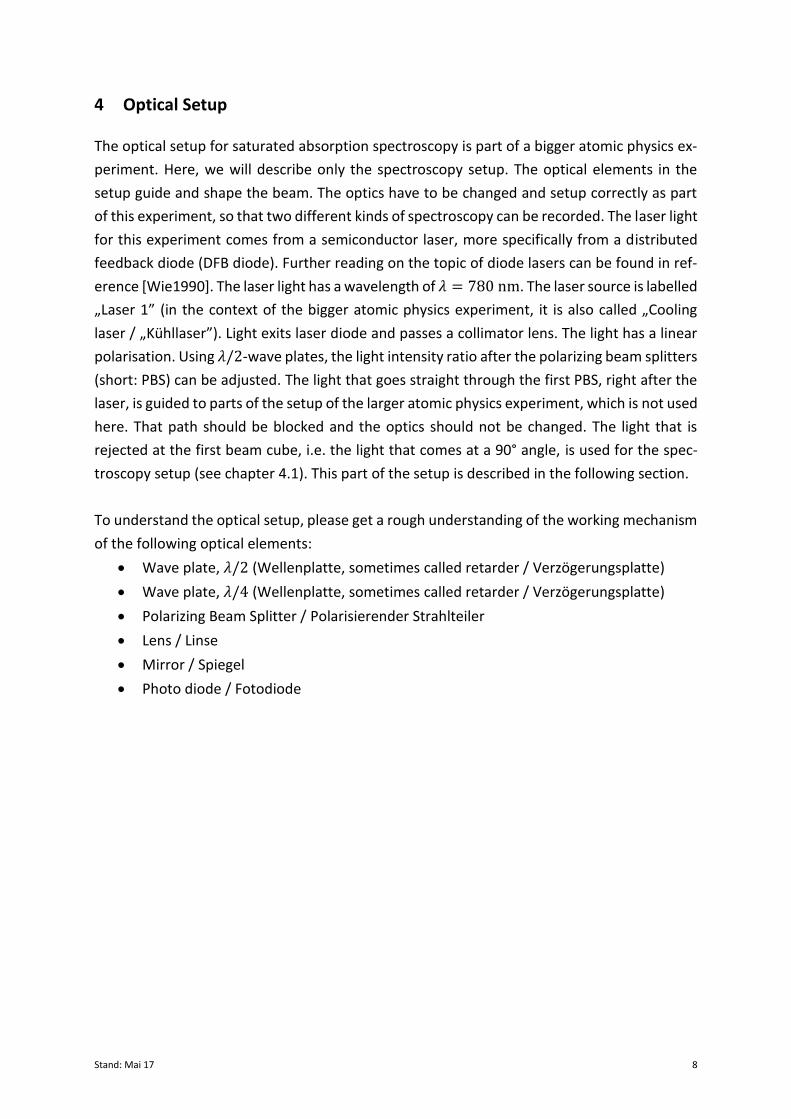
To understand the optical setup, please get a rough understanding of the working mechanism
of the following optical elements:
Wave plate, 𝜆/2 (Wellenplatte, sometimes called retarder / Verzögerungsplatte)
Wave plate, 𝜆/4 (Wellenplatte, sometimes called retarder / Verzögerungsplatte)
Polarizing Beam Splitter / Polarisierender Strahlteiler
Lens / Linse
Mirror / Spiegel
Photo diode / Fotodiode
Stand: Mai 17 9
4.1 Absorption Spectroscopy
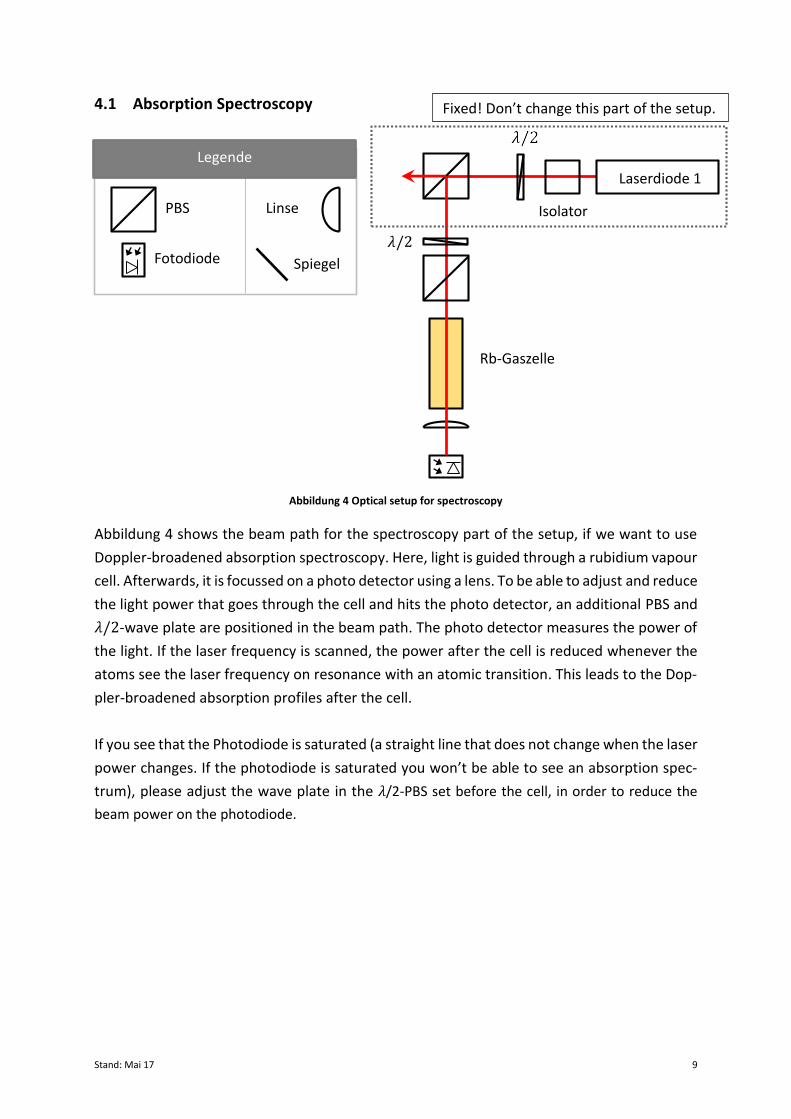
Abbildung 4 Optical setup for spectroscopy
Abbildung 4 shows the beam path for the spectroscopy part of the setup, if we want to use
Doppler-broadened absorption spectroscopy. Here, light is guided through a rubidium vapour
cell. Afterwards, it is focussed on a photo detector using a lens. To be able to adjust and reduce
the light power that goes through the cell and hits the photo detector, an additional PBS and
𝜆/2-wave plate are positioned in the beam path. The photo detector measures the power of
the light. If the laser frequency is scanned, the power after the cell is reduced whenever the
atoms see the laser frequency on resonance with an atomic transition. This leads to the Dop-
pler-broadened absorption profiles after the cell.
If you see that the Photodiode is saturated (a straight line that does not change when the laser
power changes. If the photodiode is saturated you won’t be able to see an absorption spec-
trum), please adjust the wave plate in the 𝜆/2-PBS set before the cell, in order to reduce the
beam power on the photodiode.
Legende
PBS
Fotodiode
Linse
Spiegel
Rb-Gaszelle
Isolator
Laserdiode 1 Legende
Fixed! Don’t change this part of the setup.
𝜆/2
Stand: Mai 17 10
4.1.1 Doppler-free saturated absorption spectroscopy
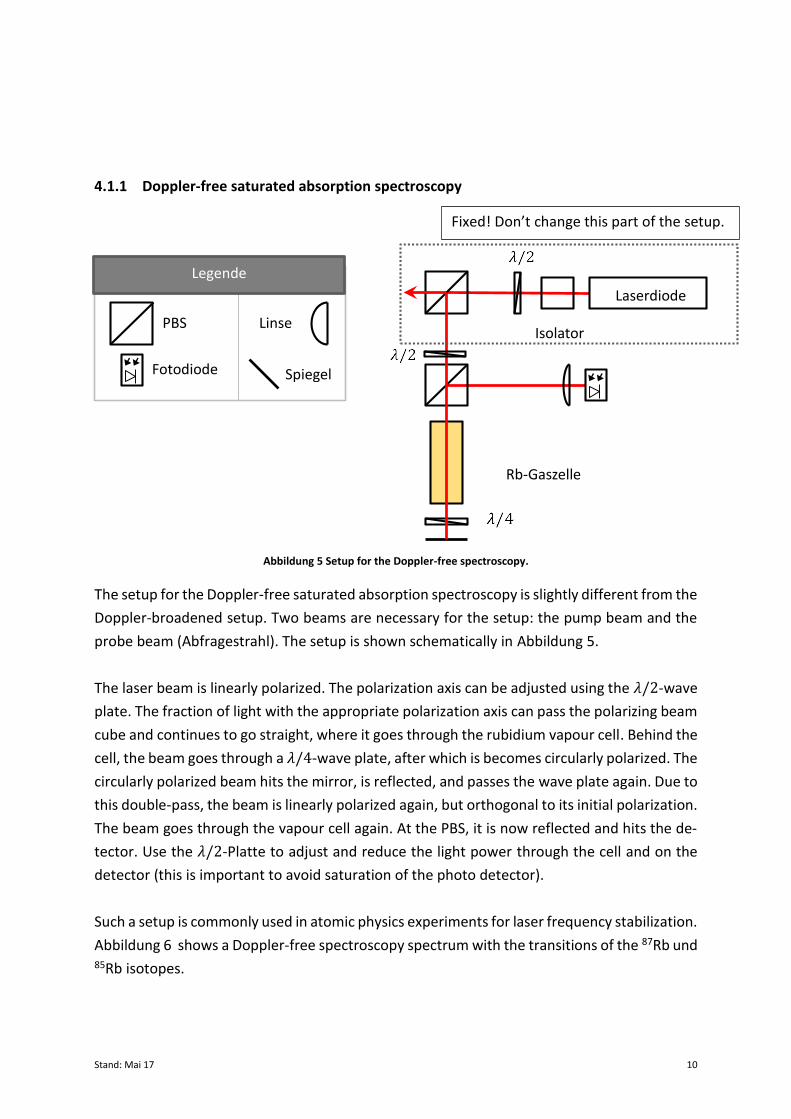
Abbildung 5 Setup for the Doppler-free spectroscopy.
The setup for the Doppler-free saturated absorption spectroscopy is slightly different from the
Doppler-broadened setup. Two beams are necessary for the setup: the pump beam and the
probe beam (Abfragestrahl). The setup is shown schematically in Abbildung 5.
The laser beam is linearly polarized. The polarization axis can be adjusted using the 𝜆/2-wave
plate. The fraction of light with the appropriate polarization axis can pass the polarizing beam
cube and continues to go straight, where it goes through the rubidium vapour cell. Behind the
cell, the beam goes through a 𝜆/4-wave plate, after which is becomes circularly polarized. The
circularly polarized beam hits the mirror, is reflected, and passes the wave plate again. Due to
this double-pass, the beam is linearly polarized again, but orthogonal to its initial polarization.
The beam goes through the vapour cell again. At the PBS, it is now reflected and hits the de-
tector. Use the 𝜆/2-Platte to adjust and reduce the light power through the cell and on the
detector (this is important to avoid saturation of the photo detector).
Such a setup is commonly used in atomic physics experiments for laser frequency stabilization.
Abbildung 6 shows a Doppler-free spectroscopy spectrum with the transitions of the 87Rb und 85Rb isotopes.
Legende
PBS
Fotodiode
Linse
Spiegel
Rb-Gaszelle
Isolator
Laserdiode 1
Legende
Fixed! Don’t change this part of the setup.

Stand: Mai 17 11
Abbildung 6 Rubidium spectrum, taken from [Mog2015].
4.1.2 Error signal
The Doppler-free spectroscopy signal from the photodiode is displayed on an oscilloscope. An
additional signal is produced, which is the „error signal” (Fehlersignal). It is the derivative of
the spectrum and is required for frequency stabilization. The error signal is the input for the
feedback loop that is switched on for an active frequency stabilization: the laser is “locked” to
a specific frequency. The error signal also allows us to see peaks that are very small and hardly
visible in the absorption spectrum. For your experimental analysis, you can also use the error
signal. It might make finding the peak positions for the frequency axis calibration easier. The
error signal of a Doppler-free spectrum of rubidium is shown in Abbildung 6. Since it is the
derivative of the absorption signal, the maximum um a peak in the absorption spectrum cor-
responds to a zero-crossing in the error signal. A bit more on how the error signal is produced
and how it is used to lock a laser can be found in the appendix.
5 Instructions for using control and measurement equipment.
This section gives a brief instruction on how to switch on and use the equipment that is part
of the spectroscopy setup. Powering off the devices follows the reverse order of switching
them on.
Stand: Mai 17 12
5.1 Switching on of cooling laser and changing the laser frequency
Before you begin, you have to make sure that the laser diode switch is set to „off“.
Switch on the laser current controller and check the laser current on the display. Make sure
that the laser current is zero. Only then are you allowed to switch on the laser diode using the
safety switch. By changing the laser current (Setpoint Laser diode), the laser output power and
the laser frequency can be adjusted. The maximum laser diode current is 150 mA!
The order for switch-off is reversed: Turn down the laser current until it is zero. Then switch
the laser diode safety switch to “off”. The laser current controller is switched off after the
experiment is completed at the end of the day.
Make sure that the temperature controller is switched on. Don’t change any settings, just
switch it off after the experiment is completed.
For frequency sweep and frequency stabilization, a Lockbox with scanning signal is used. The
Lock-switch at the Lockbox is set to SCAN. The Lockbox is also where the error signal would be
used as input if we wanted to actively stabilize the laser frequency. Before it goes into the
Lockbox, the error signal is created from the spectroscopy signal coming from the photo de-
tector: it goes through an amplifier and a mixer, where the signal is inverted and differentiated
to make the error signal.
All necessary signals are displayed on the oscilloscope: Channel 1 is connected to the scanning
signal coming from the Lockbox. Channel 2 shows the absorption spectrum from the photo-
detector. Channel 3 shows the error signal (i.e. the inverted, differentiated absorption spec-
trum). As trigger for the oscilloscope, the falling slope of the Lockbox scanning signal is used.
By changing the current at the laser current controller (changing the Setpoint Laserdiode), the
transmission spectrum of rubidium can be found. Adjust the current such that an appropriate
part of the spectrum is displayed (read the tasks properly to find out, which parts of the spec-
trum are important for this experiment). Make sure that all necessary peaks lie within the
scanning range and are visible on the oscilloscope, use Abbildung 1 and Abbildung 6 for com-
parison. Do not change the temperature controller settings, only adjust the laser current.
While you setup the optics and the photodiode, put the Photodiode channel of the oscillo-
scope into „DC“-mode. Leave it in this mode until you find the spectrum for the first time. This
allows you to easily spot if the photo diode is saturated (constant, flat signal). Adjust the 𝜆/2
before the PBS to reduce power in the beam. Once you have found the spectrum for the first
time, change the channel settings to “AC” in order to display the signal with a larger amplitude.
The oscilloscope we use is a HAMEG HMO 1024, instructions can be found in the appendix.
Stand: Mai 17 13
6 Tasks
Note: You have to wear laser safety goggles whenever the laser is switched on. Use the IR-
card to trace the beam. Switch off the ceiling lights when you record a signal with the photo-
detector (2 and 3), because the oscillations of the light will disturb the signal.
1.) Measure the output power of Laser 1 with the power meter FieldMax II (measurement
uncertainty is 1 %) as a function of laser current. Plot the data and estimate the threshold
current, including an absolute uncertainty. Note: do not exceed the maximum laser cur-
rent!
2.) Setup the optics following Kapitel 4, in order to record a Doppler-broadened absorption
spectrum with a photo detector (Kapitel 4.1). Change the laser frequency using the laser
current until you see an absorption spectrum on the oscilloscope. Note: Do not exceed
the maximum laser current! Save the spectrum digitally (Save the “waveform”, or “trace”
on the oscilloscope, use the .csv file format). Make sure that you identify the spectrum
that you record and that you know which atomic transition it refers to, so that the data
analysis is correct. Subsequently record the Doppler-broadened absorption signals of the
following transitions: for isotope 87𝑅𝑏 record the 𝐹 = 2 transition, for isotope 85𝑅𝑏
record the 𝐹 = 3 transition. For best result, adjust the laser frequency such that the cen-
tre of the Doppler-profile is at the centre of the oscilloscope trigger. Write down the cur-
rent values at which you record the absorption profiles. Take a picture of the setup (you
have to change the setup for the next task).
Note: Don’t touch the Rb vapour cell, mirrors, PBS and other optical elements on the facets.
Finger prints can destroy the optics. Be careful with metal tools as they can damage the glass
optics.
3.) Change the optical setup so that you can record a Doppler-free spectroscopy signal
(Kapitel 4.1.1). You need a pump and a probe beam for this. The frequency of the laser
should be roughly correct and won’t need much adjustment anymore (maybe a few mA)
in order to find the correct part of the absorption spectrum. Adjust the frequency such
that you can see the 𝐹 = 2 transitions for the isotope 87𝑅𝑏. You will need this data to
calibrate the frequency axis. Make sure that you select the correct atomic transitions and
the correct part of the spectrum: compare your error signal and your absorption spectrum
with the signals that are shown in this document. If you are not sure, please ask your lab
supervisor. The spectrum as well as the error signal can be optimized by adjusting the
beam overlap in the cell (using the mirror behind the cell). Use the phase settings on the
function generator for additional optimization for the error signal and write down the
optimum phase. Record the Doppler-free absorption spectrum and the error signal digi-
tally. Sketch or take a photo of the setup for your report.
Stand: Mai 17 14
4.) Measure the laser beam power before and after the vapour cell. Calculate the absorption
coefficient of the gas as well as the light intensity in the centre of the vapour cell (in units
of mW/cm2). You can approximate the beam diameter with 1 mm.
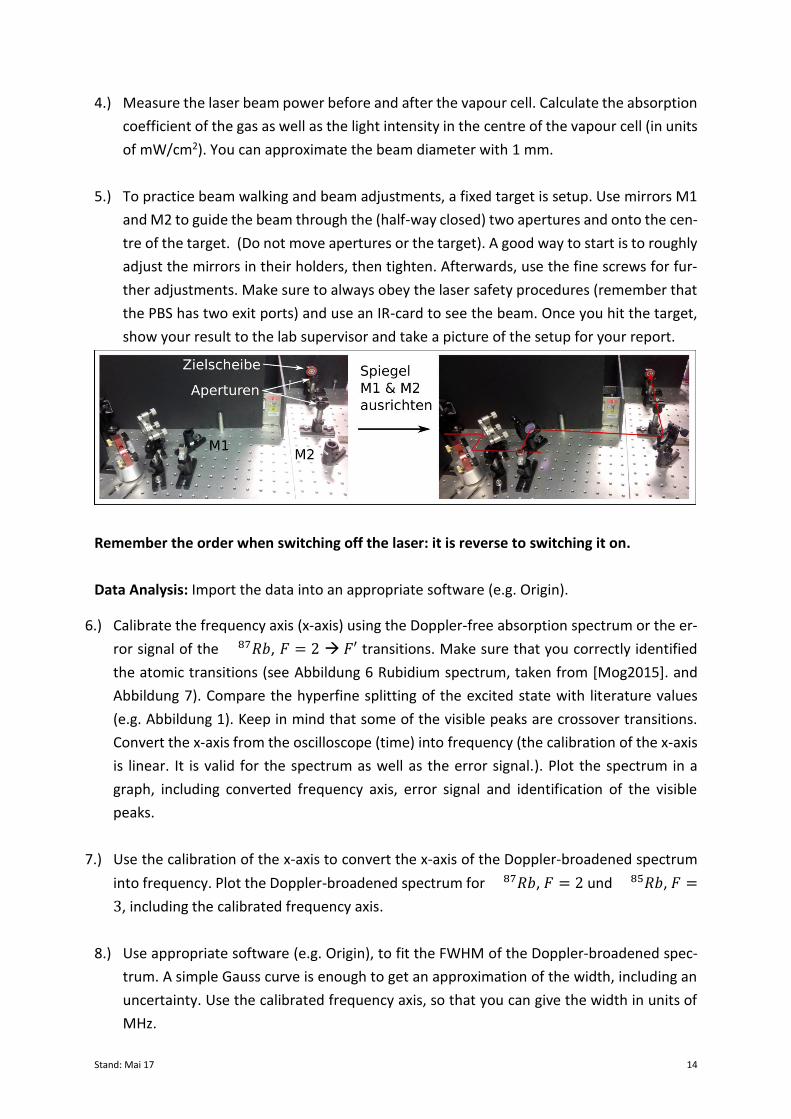
5.) To practice beam walking and beam adjustments, a fixed target is setup. Use mirrors M1
and M2 to guide the beam through the (half-way closed) two apertures and onto the cen-
tre of the target. (Do not move apertures or the target). A good way to start is to roughly
adjust the mirrors in their holders, then tighten. Afterwards, use the fine screws for fur-
ther adjustments. Make sure to always obey the laser safety procedures (remember that
the PBS has two exit ports) and use an IR-card to see the beam. Once you hit the target,
show your result to the lab supervisor and take a picture of the setup for your report.
Remember the order when switching off the laser: it is reverse to switching it on.
Data Analysis: Import the data into an appropriate software (e.g. Origin).
6.) Calibrate the frequency axis (x-axis) using the Doppler-free absorption spectrum or the er-
ror signal of the 87𝑅𝑏, 𝐹 = 2 𝐹′ transitions. Make sure that you correctly identified
the atomic transitions (see Abbildung 6 Rubidium spectrum, taken from [Mog2015]. and
Abbildung 7). Compare the hyperfine splitting of the excited state with literature values
(e.g. Abbildung 1). Keep in mind that some of the visible peaks are crossover transitions.
Convert the x-axis from the oscilloscope (time) into frequency (the calibration of the x-axis
is linear. It is valid for the spectrum as well as the error signal.). Plot the spectrum in a
graph, including converted frequency axis, error signal and identification of the visible
peaks.
7.) Use the calibration of the x-axis to convert the x-axis of the Doppler-broadened spectrum
into frequency. Plot the Doppler-broadened spectrum for 87𝑅𝑏, 𝐹 = 2 und 85𝑅𝑏, 𝐹 =
3, including the calibrated frequency axis.
8.) Use appropriate software (e.g. Origin), to fit the FWHM of the Doppler-broadened spec-
trum. A simple Gauss curve is enough to get an approximation of the width, including an
uncertainty. Use the calibrated frequency axis, so that you can give the width in units of
MHz.
Stand: Mai 17 15
9.) Create a numerical error signal by calculating the derivative of the Doppler-free absorption
spectrum (e.g. Matlab, Mathematica). If the absorption spectrum is very noise, you might
have to smooth the spectrum to be able to get a useful numerical error signal (you can use
e.g. moving average filter). Compare your numerical error signal with the recorded error
signal from task 3.
Stand: Mai 17 16
Appendix
A.1 User guide oscilloscope
General
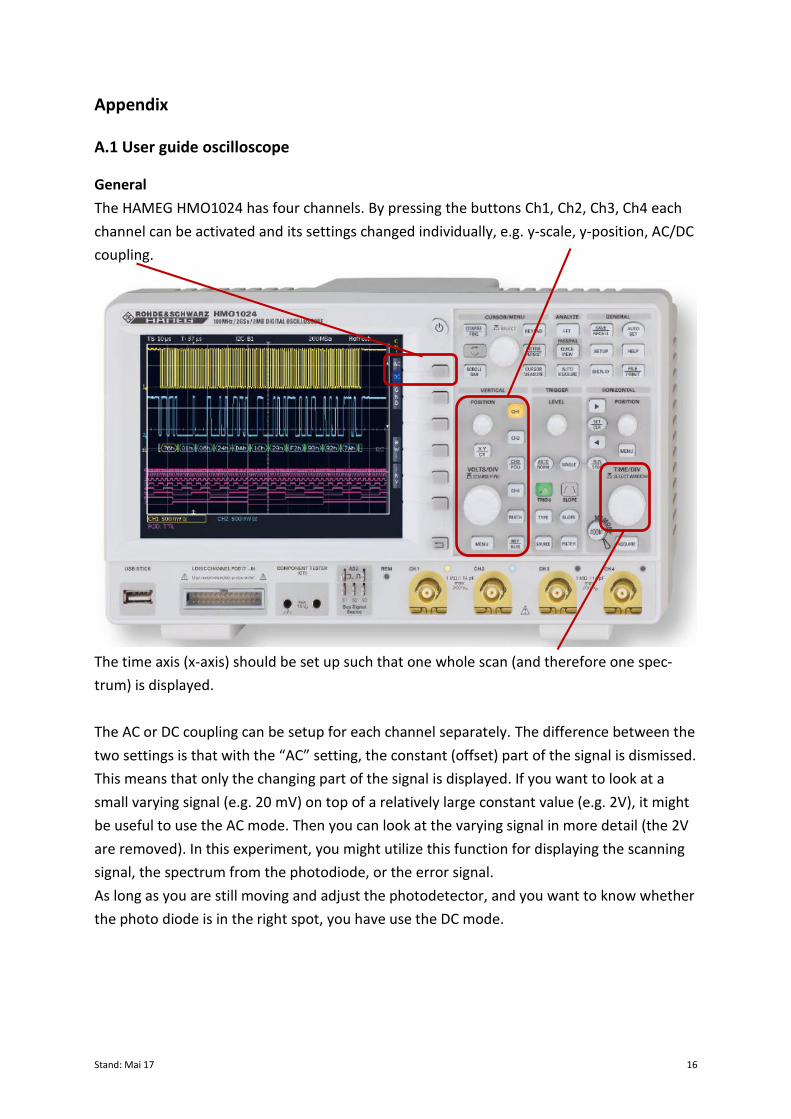
The HAMEG HMO1024 has four channels. By pressing the buttons Ch1, Ch2, Ch3, Ch4 each
channel can be activated and its settings changed individually, e.g. y-scale, y-position, AC/DC
coupling.
The time axis (x-axis) should be set up such that one whole scan (and therefore one spec-
trum) is displayed.
The AC or DC coupling can be setup for each channel separately. The difference between the
two settings is that with the “AC” setting, the constant (offset) part of the signal is dismissed.
This means that only the changing part of the signal is displayed. If you want to look at a
small varying signal (e.g. 20 mV) on top of a relatively large constant value (e.g. 2V), it might
be useful to use the AC mode. Then you can look at the varying signal in more detail (the 2V
are removed). In this experiment, you might utilize this function for displaying the scanning
signal, the spectrum from the photodiode, or the error signal.
As long as you are still moving and adjust the photodetector, and you want to know whether
the photo diode is in the right spot, you have use the DC mode.
Stand: Mai 17 17
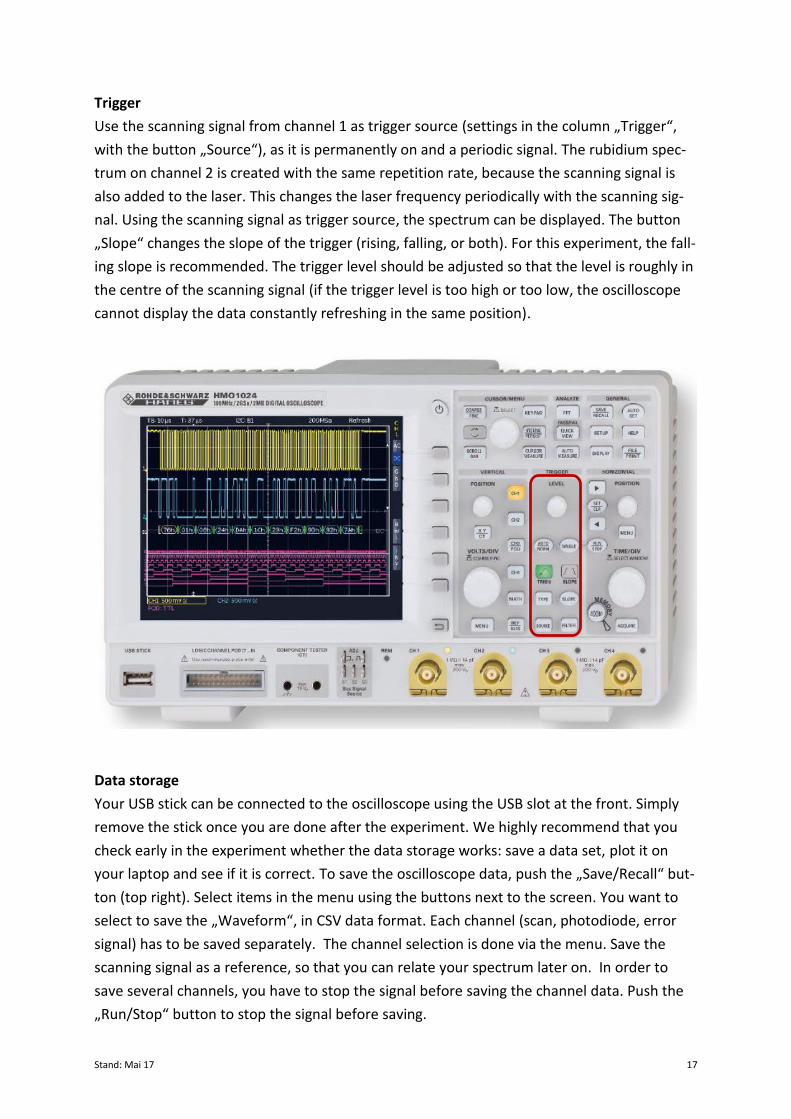
Trigger
Use the scanning signal from channel 1 as trigger source (settings in the column „Trigger“,
with the button „Source“), as it is permanently on and a periodic signal. The rubidium spec-
trum on channel 2 is created with the same repetition rate, because the scanning signal is
also added to the laser. This changes the laser frequency periodically with the scanning sig-
nal. Using the scanning signal as trigger source, the spectrum can be displayed. The button
„Slope“ changes the slope of the trigger (rising, falling, or both). For this experiment, the fall-
ing slope is recommended. The trigger level should be adjusted so that the level is roughly in
the centre of the scanning signal (if the trigger level is too high or too low, the oscilloscope
cannot display the data constantly refreshing in the same position).
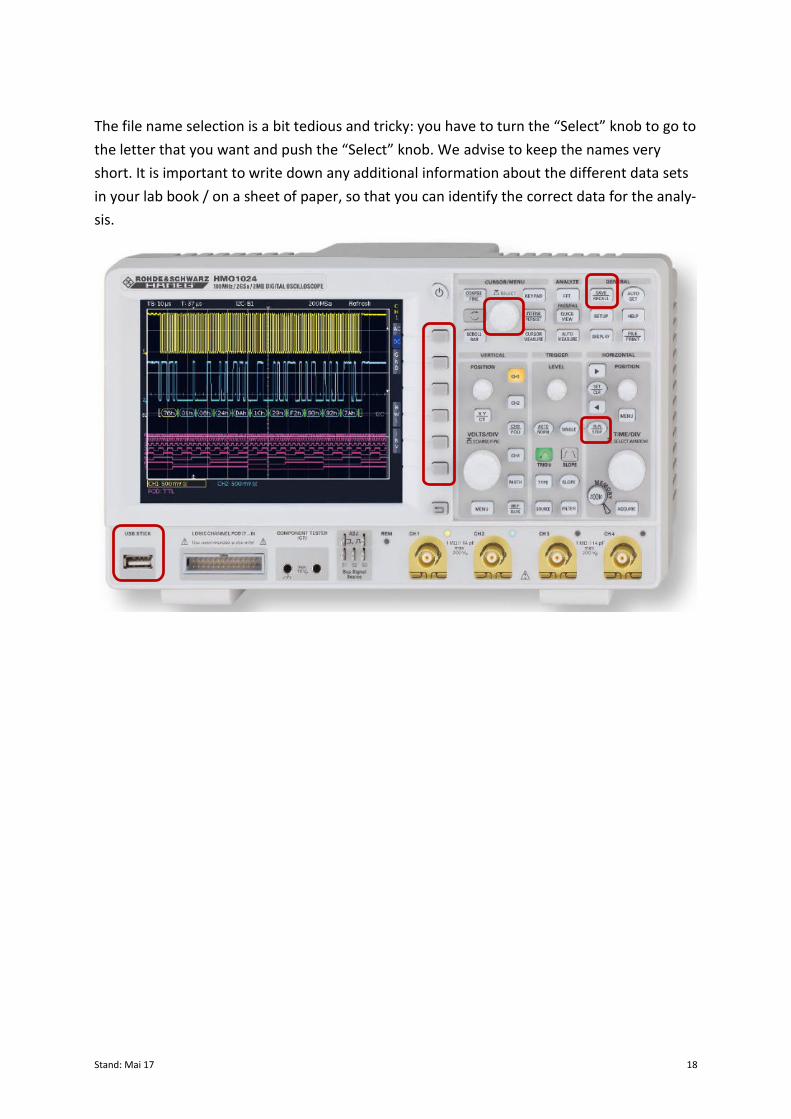
Data storage
Your USB stick can be connected to the oscilloscope using the USB slot at the front. Simply
remove the stick once you are done after the experiment. We highly recommend that you
check early in the experiment whether the data storage works: save a data set, plot it on
your laptop and see if it is correct. To save the oscilloscope data, push the „Save/Recall“ but-
ton (top right). Select items in the menu using the buttons next to the screen. You want to
select to save the „Waveform“, in CSV data format. Each channel (scan, photodiode, error
signal) has to be saved separately. The channel selection is done via the menu. Save the
scanning signal as a reference, so that you can relate your spectrum later on. In order to
save several channels, you have to stop the signal before saving the channel data. Push the
„Run/Stop“ button to stop the signal before saving.
Stand: Mai 17 18
The file name selection is a bit tedious and tricky: you have to turn the “Select” knob to go to
the letter that you want and push the “Select” knob. We advise to keep the names very
short. It is important to write down any additional information about the different data sets
in your lab book / on a sheet of paper, so that you can identify the correct data for the analy-
sis.
Stand: Mai 17 19
A.2 The error signal in the Doppler-free saturated absorption spectroscopy
This experiment uses the method of frequency modulation spectroscopy (FM Spectroscopy).
It produces a signal with a zero-crossing at the atomic transitions, with a linear slope around
the zero-crossing. Such a signal is suitable for laser frequency stabilization (see appendix
A.3).
The signal is created as follows:
A function generator (FG) outputs a radio frequency (RF) signal with frequency fMod in the
MHz region: 𝑈𝑀𝑜𝑑 = 𝐴 ∙ 𝑐os (2𝜋 ∙ 𝑓𝑀𝑜𝑑 + 𝜑). This signal is used to modulate the laser cur-
rent, which leads to laser frequency being modulated around a mean laser frequency. There-
fore, the laser does not produce light at a constant frequency fL. Instead there are side bands
at frequencies fL+fMod as well as fL- fMod. (Note: this is different from the scanning frequency.
The modulation frequency is very different from the scanning in terms of frequency and am-
plitude!) The modulated light passes the spectroscopy cell and is absorbed, depending on
the transition frequency of the atoms and the laser frequency (as described in the chapter
on saturated absorption spectroscopy). The photodiode signal, 𝑈𝑃𝐷, is split: one part goes to
the oscilloscope. The other part is used for the error signal. The photodiode signal goes to a
mixer, where it is mixed with the signal of the function generator, 𝑈𝑀𝑜𝑑. During the mixing,
the voltages (modulation signal and photodiode signal) are multiplied, which leads to high
frequency terms. These high frequency terms are filtered by a low-pass filter. The remaining
parts of the signal form the derivative of the spectrum as a result (a good explanation of this
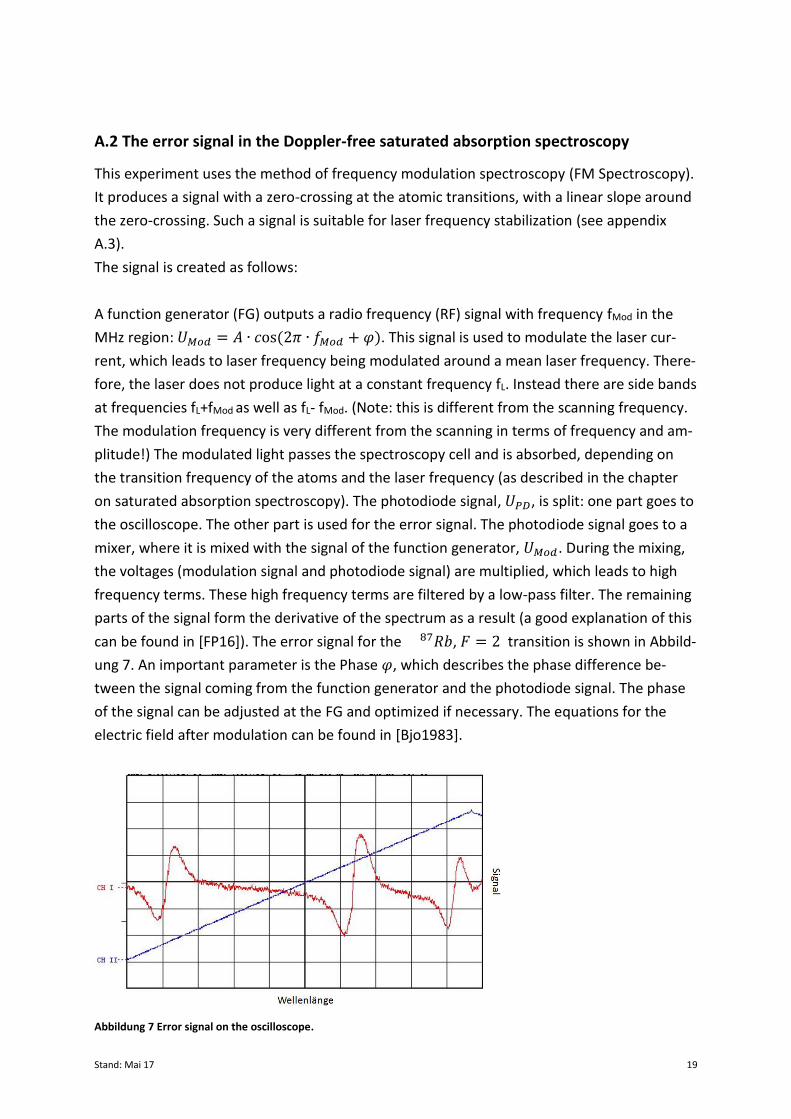
can be found in [FP16]). The error signal for the 87𝑅𝑏, 𝐹 = 2 transition is shown in Abbild-
ung 7. An important parameter is the Phase 𝜑, which describes the phase difference be-
tween the signal coming from the function generator and the photodiode signal. The phase
of the signal can be adjusted at the FG and optimized if necessary. The equations for the
electric field after modulation can be found in [Bjo1983].
Abbildung 7 Error signal on the oscilloscope.
Stand: Mai 17 20
A.3 Locking a laser – feedback loop
The error signal can be used to frequency stabilize the laser: if the laser temperature is con-
stant, the laser current is the defining parameter for the laser frequency. Therefore, the la-
ser current is adjusted if the laser frequency departs from our frequency setpoint.
This is realized in a feedback loop: we have one input parameter which tells the laser control
how far away the laser is from the frequency setpoint. The current is then changed propor-
tional to the input signal so that the laser frequency is back at the setpoint. The changes are
very small, and the laser sits relatively constant at the setpoint frequency.
The frequency of an atomic transition is an „absolute“ frequency reference. The laser is thus
stabilized on a hyperfine transition. The linewidth of the laser gets better, the better we can
stabilize it. We use the error signal for stabilization, which has a zero-crossing at the atomic
transition (compare Abbildung 7). In the vicinity of this zero-crossing, the error signal is lin-
ear. It is used as input for the feedback loop. We can adjust the factors with which the laser
current changes proportional to the error signal. Ideally, the diode laser current reacts to an
error fast enough so that there are very little frequency drifts. But the current should not re-
act too strongly and too fast, otherwise it overshoots and the current –and the frequency-
can start to oscillate.
The stabilization only works if the laser is already close to the atomic transition: the fre-
quency has to be within the linear part of the error signal. If the laser frequency is too far
away, the error signal is not proportional anymore to the current change that is necessary to
get to the frequency setpoint. Thus, the feedback loop can only be activated once the laser is
close to the atomic transition. Usually, the current is changed manually until the correct
transition is visible before the feedback loop is switched on.
Stand: Mai 17 21
Literature
Bjo1983 Bjorklund, G.C. et al. (1983): Frequency Modulation (FM) Spectroscopy - The-
ory of Lineshapes and Signal-to-Noise Analysis, Applied Physics B
Dem2010 Demtröder, W. (2010): Experimentalphysik 3 - Atome, Moleküle und
Festkörper, 4. Auflage, Springer-Verlag (Abschnitt 10.1, Spektroskopische Ver-
fahren, speziell 10.2.7, Sättigungsspektroskopie)
Dem2011 Demtröder, W. (2011): Laserspektroskopie 1 - Grundlagen, 6. Auflage,
Springer-Verlag (Abschnitt 3.2, Doppler-Verbreiterung und Abschnitt 5.6.1,
Halbleiterlaser)
Dem2013 Demtröder, W. (2013): Laserspektroskopie 2 – Experimentelle Techniken, 6.
Auflage, Springer-Verlag (Abschnitt 2.3, Sättigungs-Spektroskopie)
Din2013 Dinkelaker, A.N. (2013): Smooth Inductively Coupled Ring Trap for Cold Atom
Optics, Ph.D. Thesis, University of Strathclyde
http://photonics.phys.strath.ac.uk/wp-content/uploads/2014/02/Dinkelaker-
Aline.pdf
FP16 Versuchsanleitung zum FP am Max-Planck-Institut (Aufgerufen am 20.04.2015)
https://www.mpi-hd.mpg.de/praktika/FP16/AnleitungF16Kap5.pdf
Hak2000 Haken, H. und Wolf, H.C. (2000): Atom- und Quantenphysik - Einführung in die
experimentellen und theoretischen Grundlagen, Springer Verlag
Mog2015 MogLabs: Rubidium Spektrum,
http://www.moglabs.com/performance-data.html (Aufgerufen am
20.04.2015)
Ste2010 Steck, D. A. (2010): Rubidium 87 D Line Data; http://steck.us/alkalidata/rubid-
ium87numbers.pdf
Ste2013 Steck, D. A. (2013): Rubidium 85 D Line Data; http://steck.us/alkalidata/rubid-
ium85numbers.pdf
Wie1990 Wieman, C.E. and Hollberg, L. (1990): Using diode lasers for atomic physics,
University of Colorado & National Institute of Standards and Technology
Wir2007 Wirth, G. (2007): Aufbau und Charakterisierung einer magneto-optischen
Falle; Universität Hamburg
Stand: Mai 17 22
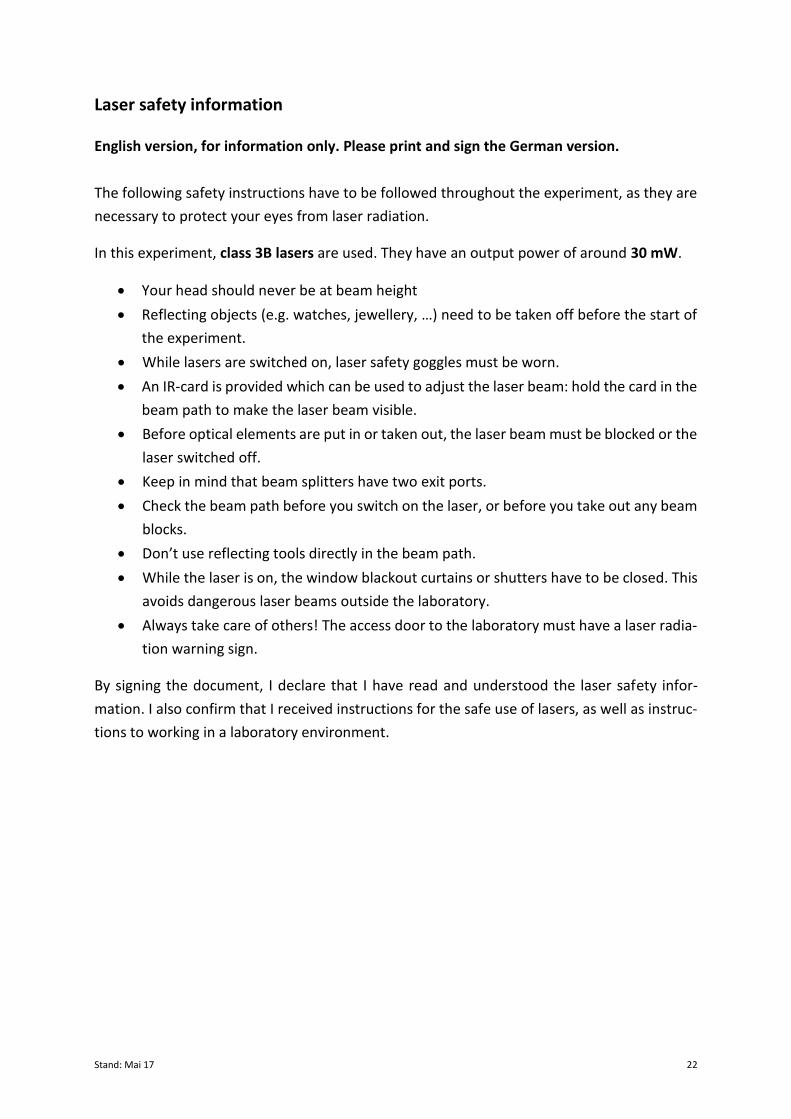
Laser safety information
English version, for information only. Please print and sign the German version.
The following safety instructions have to be followed throughout the experiment, as they are
necessary to protect your eyes from laser radiation.
In this experiment, class 3B lasers are used. They have an output power of around 30 mW.
Your head should never be at beam height
Reflecting objects (e.g. watches, jewellery, …) need to be taken off before the start of
the experiment.
While lasers are switched on, laser safety goggles must be worn.
An IR-card is provided which can be used to adjust the laser beam: hold the card in the
beam path to make the laser beam visible.
Before optical elements are put in or taken out, the laser beam must be blocked or the
laser switched off.
Keep in mind that beam splitters have two exit ports.
Check the beam path before you switch on the laser, or before you take out any beam
blocks.
Don’t use reflecting tools directly in the beam path.
While the laser is on, the window blackout curtains or shutters have to be closed. This
avoids dangerous laser beams outside the laboratory.
Always take care of others! The access door to the laboratory must have a laser radia-
tion warning sign.
By signing the document, I declare that I have read and understood the laser safety infor-
mation. I also confirm that I received instructions for the safe use of lasers, as well as instruc-
tions to working in a laboratory environment.
Stand: Mai 17 23
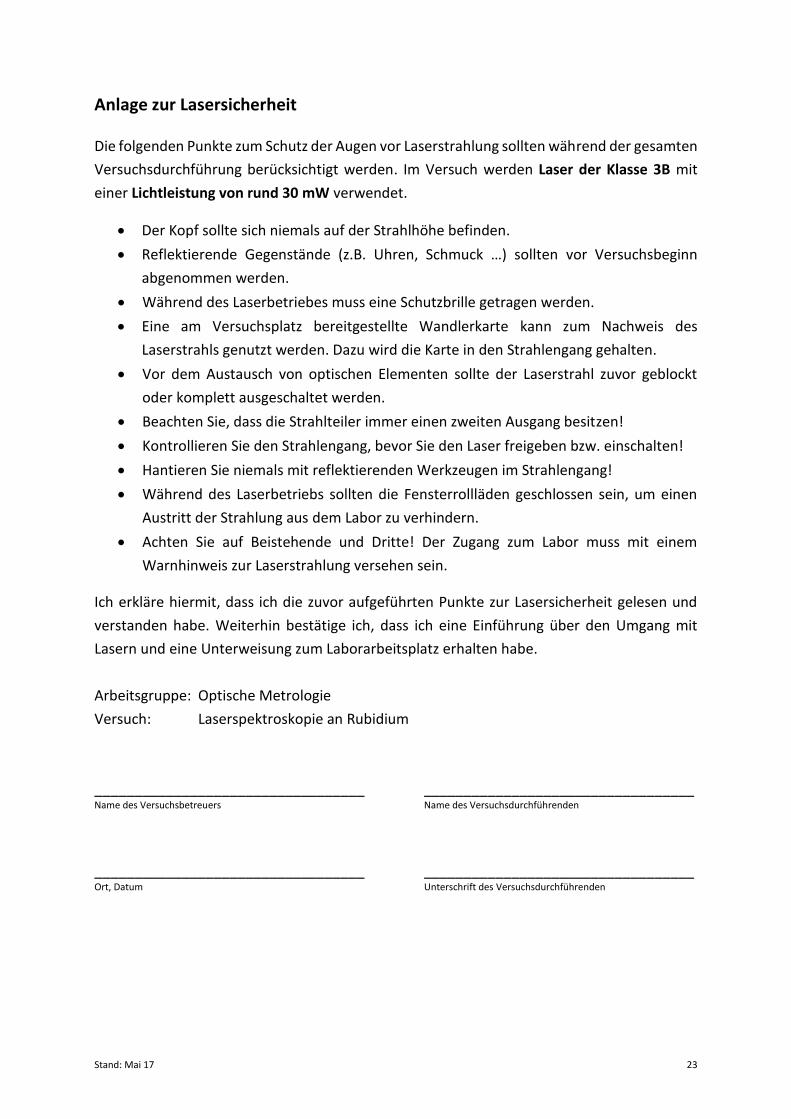
Anlage zur Lasersicherheit
Die folgenden Punkte zum Schutz der Augen vor Laserstrahlung sollten während der gesamten
Versuchsdurchführung berücksichtigt werden. Im Versuch werden Laser der Klasse 3B mit
einer Lichtleistung von rund 30 mW verwendet.
Der Kopf sollte sich niemals auf der Strahlhöhe befinden.
Reflektierende Gegenstände (z.B. Uhren, Schmuck …) sollten vor Versuchsbeginn
abgenommen werden.
Während des Laserbetriebes muss eine Schutzbrille getragen werden.
Eine am Versuchsplatz bereitgestellte Wandlerkarte kann zum Nachweis des
Laserstrahls genutzt werden. Dazu wird die Karte in den Strahlengang gehalten.
Vor dem Austausch von optischen Elementen sollte der Laserstrahl zuvor geblockt
oder komplett ausgeschaltet werden.
Beachten Sie, dass die Strahlteiler immer einen zweiten Ausgang besitzen!
Kontrollieren Sie den Strahlengang, bevor Sie den Laser freigeben bzw. einschalten!
Hantieren Sie niemals mit reflektierenden Werkzeugen im Strahlengang!
Während des Laserbetriebs sollten die Fensterrollläden geschlossen sein, um einen
Austritt der Strahlung aus dem Labor zu verhindern.
Achten Sie auf Beistehende und Dritte! Der Zugang zum Labor muss mit einem
Warnhinweis zur Laserstrahlung versehen sein.
Ich erkläre hiermit, dass ich die zuvor aufgeführten Punkte zur Lasersicherheit gelesen und
verstanden habe. Weiterhin bestätige ich, dass ich eine Einführung über den Umgang mit
Lasern und eine Unterweisung zum Laborarbeitsplatz erhalten habe.
Arbeitsgruppe: Optische Metrologie
Versuch: Laserspektroskopie an Rubidium
__________________________________ __________________________________ Name des Versuchsbetreuers Name des Versuchsdurchführenden
__________________________________ __________________________________ Ort, Datum Unterschrift des Versuchsdurchführenden