high-resolution imaging of photoreceptors in...
TRANSCRIPT

Retina
High-Resolution Imaging of Photoreceptors in MacularMicroholes
Sotaro Ooto,1 Masanori Hangai,1 Kohei Takayama,1 Naoko Ueda-Arakawa,1 Yukiko Makiyama,1
Masaaki Hanebuchi,2 and Nagahisa Yoshimura1
1Department of Ophthalmology and Visual Sciences, Kyoto University Graduate School of Medicine, Kyoto, Japan2NIDEK Co., Ltd., Gamagori, Japan
Correspondence: Sotaro Ooto, De-partment of Ophthalmology andVisual Sciences, Kyoto UniversityGraduate School of Medicine, 54Kawahara-cho, Shogoin, Sakyo-ku,Kyoto 606-8507, Japan;[email protected].
Submitted: December 18, 2013Accepted: August 8, 2014
Citation: Ooto S, Hangai M, TakayamaK, et al. High-resolution imaging ofphotoreceptors in macular micro-holes. Invest Ophthalmol Vis Sci.2014;55:5932–5943. DOI:10.1167/iovs.13-13792
PURPOSE. To assess photoreceptor structure in macular microholes by using adaptive opticsscanning laser ophthalmoscopy (AO-SLO) and spectral-domain optical coherence tomography(SD-OCT) and compare with visual acuity.
METHODS. Fourteen eyes from 12 patients with macular microholes underwent a fullophthalmologic examination and imaging with a fundus camera, SD-OCT, and an originalprototype AO-SLO system at each visit.
RESULTS. All eyes had a cone outer segment tip line disruption and a normal retinal pigmentepithelium line on SD-OCT images. Adaptive optics scanning laser ophthalmoscopy revealedfoveal cone disruption (13 eyes, round or oval; 1 eye, T-shaped) in all eyes. Cone disruptionarea (mean ¼ 14,805 6 9120 lm2; range, 3495–35,901 lm2) positively correlated withlogMAR visual acuity at the first visit (P ¼ 0.015, rs ¼ 0.679). During the follow-up period,cone disruption area increased in two eyes, was stable in seven eyes, and decreased in fiveeyes. At the last visit, cone disruption area (mean ¼ 8717 6 7432 lm2; range, 0–25,746 lm2)also positively correlated with logMAR visual acuity (P ¼ 0.035, rs ¼ 0.610). In one patientwith bilateral microholes and no apparent vitreous traction, lesion size gradually increased.Cone disruption area decreased and visual acuity improved following oral prednisone therapy.
CONCLUSIONS. Cone disruption occurs in eyes with macular microholes and a larger conedisruption area translates into a poorer visual acuity. Macular microholes, which arecommonly observed as foveal cone inner and outer segment disruptions, may occur in eyeswith or without vitreofoveal traction.
Keywords: macular microhole, optical coherence tomography, adaptive optics, scanning laserophthalmoscopy
A macular microhole is a little known condition that causesmildly reduced visual acuity, central scotoma, and meta-
morphopsia. Cairns and McCombe1 first described thiscondition in 1988 as ‘‘microholes of the fovea centralis’’ in aseries of 17 patients with red, well-defined, foveal defects nearthe center of the capillary free zone. In 1996, Reddy et al.2
described 14 patients with small, reddish macular holes, andtermed these holes, ‘‘microholes of the macula.’’ Using time-domain optical coherence tomography (OCT), Douglas et al.3
reported on 13 patients with a single foveal or juxtafoveal, red,irregular lesion with sharply defined borders. They namedthese defects, ‘‘foveal spots.’’ In 2005, Zambarakji et al.4
reported OCT and retinal thickness analyzer findings in a seriesof 22 patients with a well-demarcated, red, intraretinal, foveal,or juxtafoveal defects. They also named the defects, ‘‘macularmicroholes.’’ Optical coherence tomography images of eyeswith macular microholes have revealed macular structuralabnormalities in the outer retina, including disruption of thephotoreceptor inner and outer segment junction (IS/OS) lineand/or the retinal RPE.3–5 However, the current understandingof macular microhole pathology is limited and furtherinvestigation is needed.
Optical coherence tomography and other imaging modali-ties (e.g., scanning laser ophthalmoscopy [SLO]) fail to provide
sufficient detail of the photoreceptor microstructure, primarilybecause of ocular optical aberrations. Aberrations can becompensated for by using imaging systems with adaptive optics(AO). These include wavefront sensors that measure opticalaberrations and deformable mirrors or spatial light modulators,which compensate for aberrations.6–10 Adding AO to imagingsystems, including flood-illuminated ophthalmoscopes, SLOequipment, and OCT, has allowed researchers to identifyabnormalities in individual cone photoreceptors in patientswith various retinal disorders.11–34
Here, we used AO-SLO and spectral-domain OCT (SD-OCT)to assess pathologic changes in photoreceptors in eyes withmacular microholes. Cone abnormalities on AO-SLO and retinaland vitreous findings on SD-OCT images are discussed, alongwith the relationship between structural abnormalities andvisual function.
METHODS
Study conduct adhered to the tenets of the Declaration ofHelsinki. This study and the use of the prototype AO-SLOsystem were approved by the Institutional Review Board andthe Ethics Committee of Kyoto University Graduate School of
Copyright 2014 The Association for Research in Vision and Ophthalmology, Inc.
www.iovs.org j ISSN: 1552-5783 5932
Downloaded From: https://iovs.arvojournals.org/pdfaccess.ashx?url=/data/journals/iovs/933257/ on 08/20/2018

Medicine. The nature of this study, participation in it, andpossible risks and benefits were explained to study candidates,after which written informed consent was provided by allparticipants.
Participants
There were a total of 14 eyes from 12 participants (five men,seven women) in this observational case series. Average patientage was 59.4 6 11.5 years (range, 36–73 years) and all patientshad macular microholes with no other macular abnormalities,glaucoma, or inherited color blindness. All patients visited theKyoto University Hospital in Kyoto, Japan, between February2008 and May 2012. All patients were followed for at least 12months.
All patients were diagnosed with macular microholes, basedon the presence of a well-demarcated, red, intraretinal, foveal,or juxtafoveal defect. Patients with a full-thickness macularhole (MH), solar retinopathy (including history of visualdisturbance after sun gazing), laser pointer burn, any toxicmaculopathy, history of trauma, amyl nitrate abuse, welding arcmaculopathy, lightning maculopathy, cone dystrophy, andoccult macular dystrophy were excluded from participation.Eyes with high myopia (axial length > 26.5 mm) were alsoexcluded.
Ophthalmologic Examinations
All participants underwent comprehensive ophthalmologicexaminations at baseline, which included measurement of best-corrected visual acuity (BCVA), intraocular pressure (IOP), andaxial length (IOLMaster; Carl Zeiss Meditec, Dublin, CA, USA).Measurement of BCVA was performed using the Landolt chartand expressed as logMAR. In addition, indirect ophthalmosco-py, slit-lamp biomicroscopy with a noncontact lens, colorfundus photography, SD-OCT, and AO-SLO were performed. Ifnecessary, fluorescein angiography, fundus autofluorescence,and multifocal electroretinography were performed to obtain adifferential diagnosis. At each follow-up visit, all participantsunderwent BCVA measurement, color fundus photography, SD-OCT, and AO-SLO.
Spectral-Domain Optical Coherence Tomography
Examinations with SD-OCT were performed in all eyes using acommercial device (Spectralis HRAþOCT; Heidelberg Engi-neering, Dossenheim, Germany). Horizontal and vertical linescans through the center of the fovea were obtained at a 308angle, after which we performed 12 radial scans centered onthe fovea. We then obtained volume scans (horizontal B-scansat 108 3 308). At each location of interest on the retina, 50 SD-OCT images were acquired and averaged to reduce specklenoise.
The reflectivity of the inner segment/outer segment (IS/OS)or cone outer segment tip (COST) was measured from within a40-lm slab, and the IS/OS or COST line was quantified by usingthe plot profile function of ImageJ software (http://imagej.nih.gov/ij/; provided in the public domain by the NationalInstitutes of Health, Bethesda, MD, USA) with a 6-pixel fixed-width line. The border of the IS/OS or COST disruption wasdefined as the line on the grayscale image along which the IS/OS or COST reflectivity diminished by 2 SD from thereflectivity of the IS/OS or COST line in the unaffected retina.35
Outer nuclear layer (ONL) thickness was measured at thecenter of the fovea. Foveal ONL thickness was defined as thedistance between the vitreoretinal interface and the externallimiting membrane. We have also measured the ONL þ outerplexiform layer (OPL) thickness 0.5 and 1.0 mm from thecenter of the fovea.
Prototype AO-SLO
Our AO-SLO system has been previously described in full.28,33
Briefly, the AO-SLO system used in this study was designed andconstructed in our laboratory, based on previous reports ofhow incorporating a wide-field SLO is useful.36,37 The AO-SLOsystem is confocal, allowing it to create high-contrast ‘‘en face’’images in any plane. The system is composed of four primaryoptical subsystems: the AO subsystem (wavefront sensor,spatial light modulator), the high-resolution confocal SLOimaging subsystem, the wide-field imaging subsystem, andthe pupil observation subsystem. The pupil subsystemfacilitates initial pupil alignment with the AO-SLO system’s
FIGURE 1. Measurement of foveal dark area seen on AO-SLO. (A) An adaptive optics–SLO image of the area that includes the center of the fovea of anormal eye. (B) An adaptive optics-SLO image of the area that includes the center of the fovea of an eye with macular microhole (case 10, left eye).Note that the macular microhole is seen as a hyporeflective dark area. (C) The size of the dark lesion was quantified using ImageJ (http://imagej.nih.gov/ij/; provided in the public domain by the National Institutes of Health, Bethesda, MD, USA). In ImageJ, the command path of Image > Adjust >Threshold was used to differentiate the dark area (indicated by red) from the nondark area. Brightness was adjusted manually by each grader. Tomeasure the dark area, the command path of Analyze > Measure was used.
Photoreceptor Imaging in Macular Microholes IOVS j September 2014 j Vol. 55 j No. 9 j 5933
Downloaded From: https://iovs.arvojournals.org/pdfaccess.ashx?url=/data/journals/iovs/933257/ on 08/20/2018
optical axis through chin rest position adjustment. Thewavefront sensor measures aberrations in the eye as a whole,and the spatial light modulator compensates for theseaberrations. The total acquisition time was 10 minutes forone eye.
Cone Mosaic Imaging With the AO-SLO
A series of AO-SLO images was acquired at each of severalmacular locations by shifting the focal point from the retinalnerve fiber layer to the RPE, with particular attention paid toacquiring images showing the cone mosaic. We automatically
created a montage of AO-SLO images by using MosaicJ(National Institutes of Health, Bethesda, MD, USA). If neces-sary, we made manual corrections by selecting both the area ofinterest and each image to be included in the montage. Properreconstructions of AO-SLO images were verified by comparingthe final montage to the corresponding wide-field images forthat eye. The postprocessing time was 30 minutes for eachimage.
The size of the dark lesion in each eye was quantified in AO-SLO images by two independent, experienced examiners usingImageJ software, a Java-based image-processing softwareprogram (Fig. 1). In ImageJ, the command path of Image >
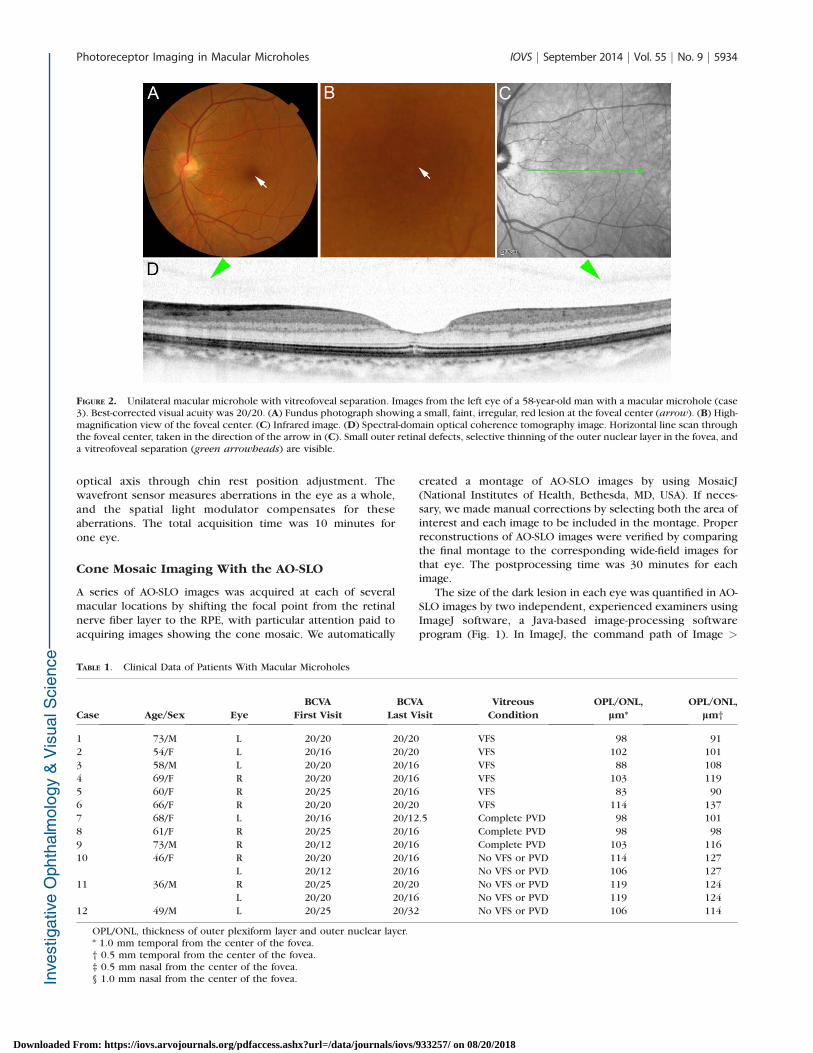
FIGURE 2. Unilateral macular microhole with vitreofoveal separation. Images from the left eye of a 58-year-old man with a macular microhole (case3). Best-corrected visual acuity was 20/20. (A) Fundus photograph showing a small, faint, irregular, red lesion at the foveal center (arrow). (B) High-magnification view of the foveal center. (C) Infrared image. (D) Spectral-domain optical coherence tomography image. Horizontal line scan throughthe foveal center, taken in the direction of the arrow in (C). Small outer retinal defects, selective thinning of the outer nuclear layer in the fovea, anda vitreofoveal separation (green arrowheads) are visible.
TABLE 1. Clinical Data of Patients With Macular Microholes
Case Age/Sex Eye
BCVA
First Visit
BCVA
Last Visit
Vitreous
Condition
OPL/ONL,
lm*
OPL/ONL,
lm†
1 73/M L 20/20 20/20 VFS 98 91
2 54/F L 20/16 20/20 VFS 102 101
3 58/M L 20/20 20/16 VFS 88 108
4 69/F R 20/20 20/16 VFS 103 119
5 60/F R 20/25 20/16 VFS 83 90
6 66/F R 20/20 20/20 VFS 114 137
7 68/F L 20/16 20/12.5 Complete PVD 98 101
8 61/F R 20/25 20/16 Complete PVD 98 98
9 73/M R 20/12 20/16 Complete PVD 103 116
10 46/F R 20/20 20/16 No VFS or PVD 114 127
L 20/12 20/16 No VFS or PVD 106 127
11 36/M R 20/25 20/20 No VFS or PVD 119 124
L 20/20 20/16 No VFS or PVD 119 124
12 49/M L 20/25 20/32 No VFS or PVD 106 114
OPL/ONL, thickness of outer plexiform layer and outer nuclear layer.* 1.0 mm temporal from the center of the fovea.† 0.5 mm temporal from the center of the fovea.‡ 0.5 mm nasal from the center of the fovea.§ 1.0 mm nasal from the center of the fovea.
Photoreceptor Imaging in Macular Microholes IOVS j September 2014 j Vol. 55 j No. 9 j 5934
Downloaded From: https://iovs.arvojournals.org/pdfaccess.ashx?url=/data/journals/iovs/933257/ on 08/20/2018
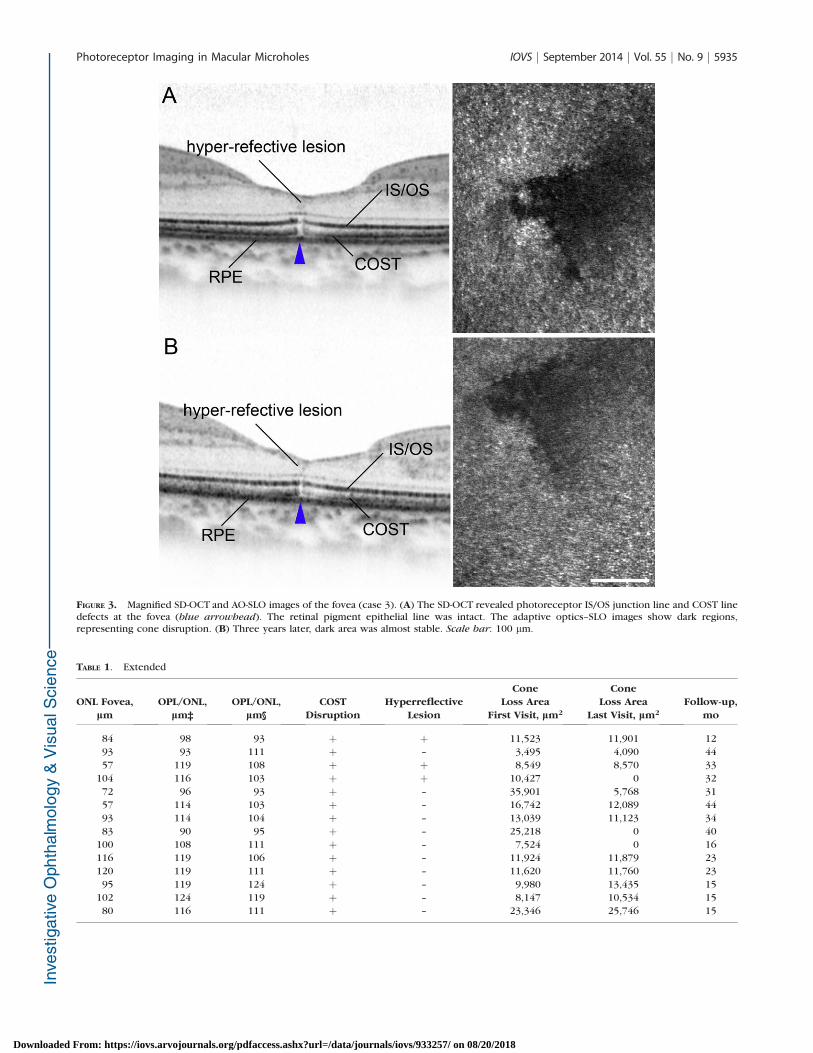
FIGURE 3. Magnified SD-OCT and AO-SLO images of the fovea (case 3). (A) The SD-OCT revealed photoreceptor IS/OS junction line and COST linedefects at the fovea (blue arrowhead). The retinal pigment epithelial line was intact. The adaptive optics–SLO images show dark regions,representing cone disruption. (B) Three years later, dark area was almost stable. Scale bar: 100 lm.
TABLE 1. Extended
ONL Fovea,
lm
OPL/ONL,
lm‡
OPL/ONL,
lm§
COST
Disruption
Hyperreflective
Lesion
Cone
Loss Area
First Visit, lm2
Cone
Loss Area
Last Visit, lm2
Follow-up,
mo
84 98 93 þ þ 11,523 11,901 12
93 93 111 þ – 3,495 4,090 44
57 119 108 þ þ 8,549 8,570 33
104 116 103 þ þ 10,427 0 32
72 96 93 þ – 35,901 5,768 31
57 114 103 þ – 16,742 12,089 44
93 114 104 þ – 13,039 11,123 34
83 90 95 þ – 25,218 0 40
100 108 111 þ – 7,524 0 16
116 119 106 þ – 11,924 11,879 23
120 119 111 þ – 11,620 11,760 23
95 119 124 þ – 9,980 13,435 15
102 124 119 þ – 8,147 10,534 15
80 116 111 þ – 23,346 25,746 15
Photoreceptor Imaging in Macular Microholes IOVS j September 2014 j Vol. 55 j No. 9 j 5935
Downloaded From: https://iovs.arvojournals.org/pdfaccess.ashx?url=/data/journals/iovs/933257/ on 08/20/2018

Adjust > Threshold was used to differentiate the dark areafrom the nondark area. Brightness was adjusted manually bythe grader. To measure the dark area, the command path ofAnalyze > Measure was used. To obtain accurate scan lengths,the magnification effect in each eye was corrected using theadjusted axial length method, previously devised by Bennett etal.38
To evaluate cone density, we applied the automated conelabeling process of Li and Roorda.39 After automated conelabeling, an experienced observer examined each image. Thearea for quantification (80 3 80 lm) was identified manually byselecting the area without vascular shadows and by placing thecomputer cursor on the area to be quantified. This method hasbeen used in other studies.19,24,25,26,28,33 As has been reportedfor similar systems,6–28 we found that our system did notalways allow clear visualization of individual cones withinmuch of the central fovea. However, we could clearlydistinguish individual cones ‡ 0.5 mm from the center of thefovea. Therefore, we obtained an estimate of cone density inareas 0.5 mm from the foveal center by dividing the number ofcones in each imaging area by the size of the area. Wemeasured cone density in each of four directions (superior,lower, nasal, and temporal), and the mean density wascalculated from the densities in all four directions.
Statistical Analyses
Statistical analysis was done using only one eye per patient. Weused the data of the right eye in bilaterally affected cases. Forintraobserver measurements, one-way random, average mea-sure intraclass correlation coefficients (ICC) were obtained.
Wilcoxon signed tests were used to compare parametersbetween the first and last clinic visits. The Spearman rankcorrelation coefficient was calculated to examine the associ-ation between cone disruption area and logMAR BCVA. Allstatistical calculations were performed using a commerciallyavailable statistical software program (SPSS, version 17; SPSS,Inc., Chicago, IL, USA). Statistical significance was defined as P
< 0.05.
RESULTS
Participant clinical characteristics are summarized in Table 1.Fourteen eyes from 12 patients (five men, seven women) wereincluded in this observational case series. Mean participant agewas 59.4 6 11.5 years (range, 36–73 years) and mean logMARBCVA was 0.082 6 0.087 (range, 20/12 to 20/25) at the firstvisit. At the last visit, on average 26.9 6 11.4 months (range,12–44 months) later, mean logMAR BCVA was�0.041 6 0.081(range, 20/12 to 20/30), which was no different from the firstvisit (P ¼ 0.097).
A small, red, well-demarcated, intraretinal, foveal defect wasseen in all eyes (Figs. 2–9, Supplementary Figs. S1, S2). Threeeyes (21%) had a complete posterior vitreous detachment(PVD) and 6 eyes (43%) had a vitreofoveal separation (VFS, Fig.2). The two participants with bilateral macular microholes andone patient with a unilateral microhole did not have a PVD, aVFS, or vitreous traction (Figs. 4, 7).
All 14 eyes had a disruption of the IS/OS and COST line onSD-OCT images and a normal RPE line (Figs. 2–5, 7–9,Supplementary Figs. S1, S2). Additionally, three eyes with
FIGURE 4. Nonprogressive bilateral macular microholes without apparent vitreous traction. Images from the right eye of a 46-year-old woman withbilateral macular microholes (case 10); BCVA was 20/20. (A) Fundus photographs showed small, localized, round, red lesions at the foveal center.(B) High-magnification view of the foveal center. (C) Multifocal electroretinography showed a near-normal response. (D, E) SD-OCT images.Horizontal (D) and vertical (E) line scans through the foveal center showed small outer retinal defects. The posterior vitreous membrane (green
arrowheads) is attached to the macula and neither eye had evident vitreoretinal traction.
Photoreceptor Imaging in Macular Microholes IOVS j September 2014 j Vol. 55 j No. 9 j 5936
Downloaded From: https://iovs.arvojournals.org/pdfaccess.ashx?url=/data/journals/iovs/933257/ on 08/20/2018

VFS also had a moderately reflective lesion in the outer nuclearlayer (ONL, Fig. 3). The mean ONL thickness of the fovea was86.2 6 17.9 lm (Table 2).
Foveal dark lesion was observed in all 14 eyes on AO-SLO. In13 eyes, the lesion was round or oval (Figs. 1, 5, 6, 8, 9,Supplementary Fig. S2) and in 1 eye it was T-shaped (Fig. 3).Cone abnormalities were limited to the fovea in all eyes (Fig.6). The reproducibility of the dark area measurements wasevaluated through an interobserver ICC. The ICC was 0.944 formeasurement at the first visit and 0.952 at the last visit. The95% confidential intervals for ICC values were 0.834 to 0.982 atthe first visit, and 0.858 to 0.984 at the last visit.
The IS/OS and COST disruption size on SD-OCT correlatedwith the dark area on AO-SLO (P ¼ 0.006, rs ¼ 0.741 and P ¼0.003, rs¼ 0.776, respectively) at the first visit. The IS/OS andCOST disruption size correlated with the dark area on AO-SLO(P¼ 0.005, rs¼ 0.749 and P < 0.001, rs¼ 0.858, respectively)at the last visit as well.
Cone disruption area (mean ¼ 14,805 6 9120 lm2, range,3495–35,901 lm2) positively correlated with logMAR visualacuity at the first visit (P ¼ 0.015, rs ¼ 0.679). The dark areaincreased by >20% in two eyes (14%), was stable in seven eyes(50%), and decreased by >20% in five eyes (36%). Three eyesshowed complete resolution of cone disruption (Supplemen-
FIGURE 5. Magnified SD-OCT and AO-SLO images of the fovea (case 10, right eye). (A) The SD-OCT image showed COST line defects and an irregularIS/OS line at the foveal center (blue arrowhead). The retinal pigment epithelial line was intact. The adaptive optics–SLO images show dark, roundregions, representing central foveal cone disruption. (B) Two years later, the size and shape dark regions was almost stable. Scale bar: 100 lm.
FIGURE 6. Montage AO-SLO images of the fovea and parafovea (case10, right eye). Right: High-magnification views of the areas outlined bythe white boxes. Note that cone mosaic is normal except for the centerof the fovea. Scale bar: 100 lm.
Photoreceptor Imaging in Macular Microholes IOVS j September 2014 j Vol. 55 j No. 9 j 5937
Downloaded From: https://iovs.arvojournals.org/pdfaccess.ashx?url=/data/journals/iovs/933257/ on 08/20/2018

tary Figs. S1, S2). Of the 5 eyes where cone disruptiondecreased during the follow-up period, three had a VFS andtwo had a complete PVD. Interestingly, the dark area was eitherstable or decreased in all eyes with a VFS or a complete PVD. Atthe last visit, cone disruption area (mean¼ 8717 6 7432 lm2;range, 0–25,746 lm2) also positively correlated with logMARvisual acuity (P¼0.035, rs¼0.610). The mean cone density 0.5mm from the center of the fovea (i.e., the area around thelesion) was 31,812 6 2715 at the first visit and 31,664 6 2515at the last visit (P¼ 0.583; Table 2), which was within normalrange.19,25,26,28
Five eyes (36%) had no apparent signs of either past orpresent vitreous traction. In one 36-year-old participant withbilateral microholes and no evident vitreous traction, retinallesion size gradually increased. Unfortunately, the patient alsoexperienced a gradual increase in scotoma size. Treatmentwith oral prednisone (40 mg/d) was initiated 16 weeks afterthe initial visit to prevent further cone disruption, andsubsequent vision loss. With systemic steroid treatment, darkarea decreased and visual acuity improved (Figs. 8, 9).
DISCUSSION
Macular microholes are diagnosed based on the presence of ared, well-demarcated, intraretinal, foveal, or juxtafoveal defecton fundoscopic examinations or fundus photography.1–5
However, the lesion is usually very small, and the diseasemay be easily overlooked during standard fundoscopicexaminations. Although SD-OCT is more sensitive than AO-SLO generally, macular microholes may even be overlooked onSD-OCT images without dense B-scans. The intervals of each B-scan are more than 20 lm, even using a raster scan, with lateralresolution of ~20 lm, whereas the AO-SLO, with lateralresolution of 3 lm, can detect ~20-lm–wide abnormalities. Infact, the dynamic lesion changes were more apparent on AO-SLO images than on SD-OCT images (Figs. 8, 9). Thus, thecombination of fundus examination, SD-OCT, and AO-SLO maybe useful in accurately diagnosing macular microholes and formonitoring patients with the disease. Recently Flatter et al.40
reported the SD-OCT and AO-SLO findings of photoreceptordamage after blunt trauma, which are similar to those of
FIGURE 7. Progressive bilateral macular microholes without apparent vitreous traction. Images of the right (A–D) and left (E–H) eyes from a 36-year-old man with bilateral macular microholes (case 11). Best corrected visual acuity was 20/25 in the right eye and 20/20 in the left. (A, E) Fundusphotographs showing small, localized, round, red lesions at the foveal center. (B, F) High-magnification view of the central fovea. (C, G) Fluoresceinangiograms were normal in both eyes. (D, H) Spectral-domain optical coherence tomography images. A horizontal line scan through the fovealcenter showed small COST line defects and IS/OS line irregularities (blue arrowheads) in both eyes. The retinal pigment epithelial line was intact.The posterior vitreous membrane (green arrowheads) was attached to the macula, but neither eye had evident vitreoretinal traction.
Photoreceptor Imaging in Macular Microholes IOVS j September 2014 j Vol. 55 j No. 9 j 5938
Downloaded From: https://iovs.arvojournals.org/pdfaccess.ashx?url=/data/journals/iovs/933257/ on 08/20/2018
macular microholes. In both conditions, the lesions were verysmall, and AO-SLO is useful for evaluating and monitoringpatients.
We propose that the ‘‘dark area’’ on AO-SLO representsabnormalities at the photoreceptor level. This proposal isbased on several findings. First, foveal ONL thickness wassmaller in eyes with macular microholes (86 6 18 lm),compared with normal eyes (122 6 23 lm).28 Second, acomparison of AO-SLO images with wide-field SLO images orfundus photographs allowed us to rule out the possibility thatthe dark areas represented the shadows of blood vessels.Moderately reflective foveal lesions (Fig. 3) seem to have littleeffect on the penetration of light reflected from the deeperlayers. In fact, on SD-OCT, which uses a light source with awavelength (840 nm) identical to that of our AO-SLO system,
no shadows were observed in the photoreceptor layer or RPE.Third, the dark areas on AO-SLO positively correlated with theareas of disruption in the IS/OS and COST line on SD-OCTimages.
Recently, Spaide and Curcio41 hypothesized that the IS/OSlines and COST lines correspond to the ellipsoid zone of thephotoreceptors and the contact cylinder of the cones. Theellipsoid section is a part of the photoreceptor inner segmentsand is densely packed with mitochondria. The OS continues tothe RPE, whereupon it is enveloped in specialized apicalprocesses, forming a contact cylinder. Thus, it is possible thatthe appearance of the presumed IS/OS line reflects thefunction of the photoreceptor inner segments, and theappearance of the presumed COST line reflects the functionof the photoreceptor outer segments. The high reflectance of
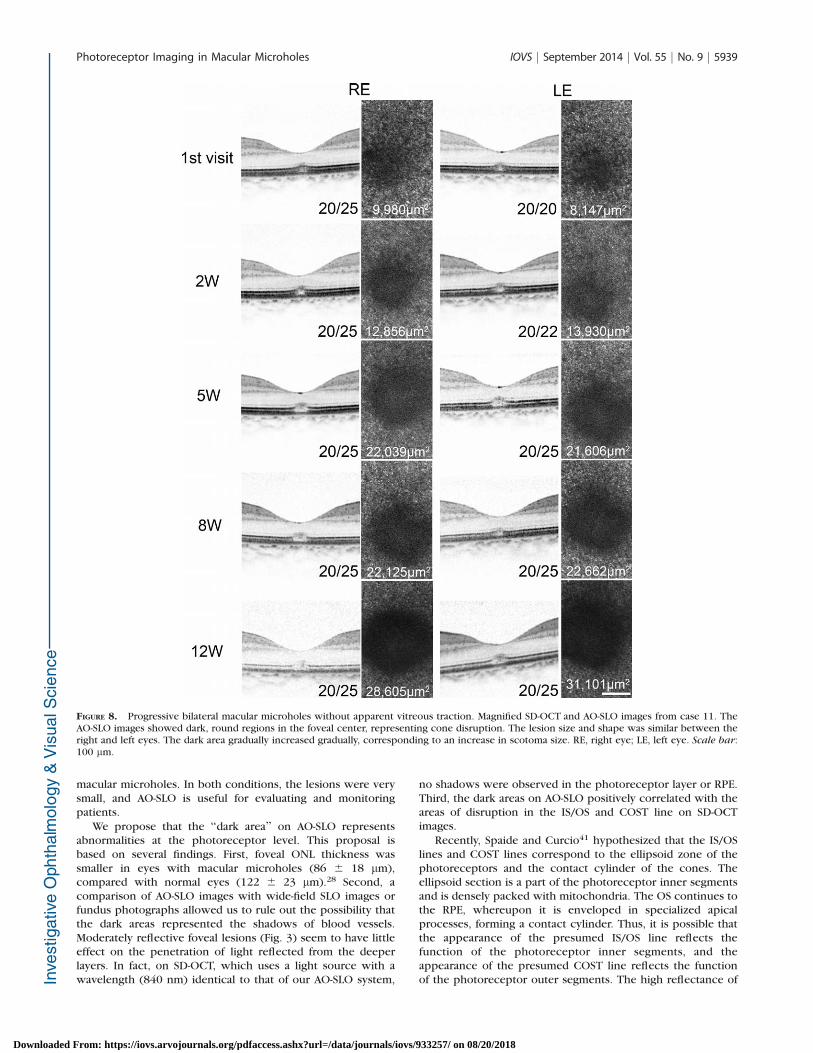
FIGURE 8. Progressive bilateral macular microholes without apparent vitreous traction. Magnified SD-OCT and AO-SLO images from case 11. TheAO-SLO images showed dark, round regions in the foveal center, representing cone disruption. The lesion size and shape was similar between theright and left eyes. The dark area gradually increased gradually, corresponding to an increase in scotoma size. RE, right eye; LE, left eye. Scale bar:100 lm.
Photoreceptor Imaging in Macular Microholes IOVS j September 2014 j Vol. 55 j No. 9 j 5939
Downloaded From: https://iovs.arvojournals.org/pdfaccess.ashx?url=/data/journals/iovs/933257/ on 08/20/2018
the cone mosaic in AO-SLO is thought to be caused byreflectance from both the IS/OS and the COST in the normalretina.42 In fact, the current study showed that the dark areawas correlated with larger decreases in the reflectivity sizes ofthe IS/OS and COST. However, dark areas were also observedon AO-SLO images in the areas where the IS/OS line wascontinuous (though it was irregular), but the COST line wasdisrupted, on SD-OCT (Figs. 7–9). This finding is consistentwith the results of a study by Kitaguchi et al.,16 in which thedark area observed on AO fundus camera images correspondedwith the areas where the COST line, rather than the IS/OS, wasdisrupted on SD-OCT images. Thus, the OS probably plays amore important role in the reflectance of the photoreceptormosaic on AO-imaging devices. This is also supported by therecent split detector AO-SLO imaging performed by Scoles etal.43
Previous studies examining OCT images of macular micro-holes have revealed retinal structural abnormalities.3–5 Usingtime-domain OCT, Zambarakji et al.4 found an outer retinalabnormality and/or RPE defect on many OCT series. Using SD-OCT, Gella et al.5 also reported the presence of photoreceptorlayer abnormalities in all OCT series, with some eyes alsohaving RPE abnormalities. However, both studies used single,and not averaged, images so speckle noise likely limiteddetailed layer analyses. In the current study, the speckle-noise-reduction capabilities of the SD-OCT device (eye trackingcombined with multiple B-scan averaging, Spectralis; Heidel-berg Engineering) allowed us to obtain highly detailed imagesof all retinal layers. Disruptions of the IS/OS and COST linewere found in all eyes examined, and the RPE line was normal.In addition, AO-SLO revealed dark area in the fovea in all eyes.Thus, the current study shows that foveal cones, especially the
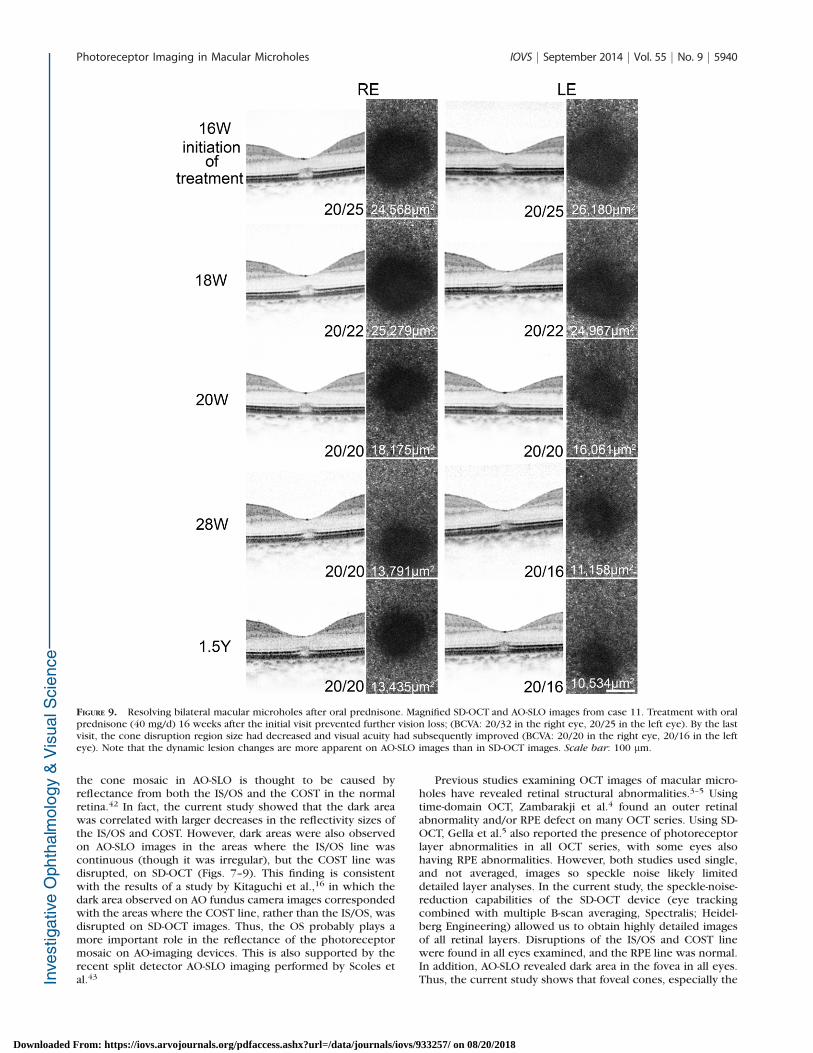
FIGURE 9. Resolving bilateral macular microholes after oral prednisone. Magnified SD-OCT and AO-SLO images from case 11. Treatment with oralprednisone (40 mg/d) 16 weeks after the initial visit prevented further vision loss; (BCVA: 20/32 in the right eye, 20/25 in the left eye). By the lastvisit, the cone disruption region size had decreased and visual acuity had subsequently improved (BCVA: 20/20 in the right eye, 20/16 in the lefteye). Note that the dynamic lesion changes are more apparent on AO-SLO images than in SD-OCT images. Scale bar: 100 lm.
Photoreceptor Imaging in Macular Microholes IOVS j September 2014 j Vol. 55 j No. 9 j 5940
Downloaded From: https://iovs.arvojournals.org/pdfaccess.ashx?url=/data/journals/iovs/933257/ on 08/20/2018

inner and outer segments, are mainly affected in eyes withmacular microholes.
Several researchers have proposed that macular microholepathogenesis may be associated with anteroposterior vitreoustraction at the macula.2,4,5 In the current study, nine eyes (64%)had evidence of acute or prior vitreous traction (i.e., VFS,complete PVD) on the fovea. This led us to hypothesize that,when a certain kind of macular microhole forms, conephotoreceptors are pulled away from the RPE, as a result ofanteroposterior traction on the photoreceptor layer, which ismostly made up of cones in the fovea. We believe that thistraction is caused by perifoveal posterior vitreous traction oracute detachment of vitreous.
Lai et al.44 examined spontaneous resolution of macularmicroholes and found that a type of macular microhole canform while a full-thickness macular hole is resolving. Histo-pathologic studies of repaired full-thickness macular hole haveshown that photoreceptor cells are replaced by Muller cellsand/or astrocytes at the site of the macular hole.45–47 Thesecellular changes may explain the moderately reflective ONLlesions seen on OCT that were first reported by Ko et al.48 onultrahigh-resolution OCT images. In the current study, threeeyes with macular microholes, all of which had VFS, had thesemoderately reflective ONL lesions in the macula. Together, thisevidence suggests that these eyes may have had a resolving full-thickness macular hole.
During the follow-up period (26.9 months on average), thedark area was stable or decreased in all eyes with VFS or acomplete PVD, both of which are evidence of past anteropos-terior vitreal traction on the macula. This finding implies thatmacular microholes, originally caused by acute anteroposteriorvitreous traction on the macula, may spontaneously decreasein size once the traction is no longer present. Additionally, ifthe photoreceptor cell body and the inner segment remainintact, the cell will regenerate its outer segment and visualacuity improves. This phenomenon may be consistent with thegradual recovery of the IS/OS line in closed full-thicknessmacular hole after vitreous surgery.49–51
Five eyes (36%) had no apparent signs of either past orpresent vitreous traction. Thus, macular microholes may bedivided into at least two subtypes, based on the involvement ofanteroposterior vitreous traction. The pathology of macularmicroholes without the involvement of anteroposterior vitre-ous traction may be similar to that of acute zonal occult outerretinopathy (AZOOR) complex disease, in which disruptions ofthe IS/OS and the COST lines are the characteristic findings onOCT as well.52–55 Indeed, in one middle-aged patient withbilateral microholes, lesion size gradually increased with no
apparent vitreous traction. When the size of cone disruptionregions decreased following oral steroid therapy, visual acuityalso improved, which is similar to the report of Spaide et al.53
that oral steroid and immunosuppressants reconstituted IS/OSline defects in eyes with AZOOR complex disease. Althoughmacular microholes caused by acute anteroposterior vitreoustraction are photoreceptor defects secondary to vitreofovealtraction, this microhole subtype may be caused by the primarydamage of the photoreceptor outer segments.
In the current study, a larger dark area in the fovea on AO-SLO coincided with a worse visual acuity at both the first andlist clinic visit. This pattern is consistent with a previous reportusing SD-OCT and microperimetry techniques, which foundcorrelations between the macular microhole size and theretinal sensitivity reduction.5 Cumulatively, these findingssuggest that macular functional impairment is closely associ-ated with foveal cone photoreceptor changes in eyes withmacular microholes.
Our study has several limitations. First, this study examineda relatively few eyes due to practical limitations associated withthe rarity of macular microholes. Second, although it has betterlateral resolution than commercially available SD-OCT, our AOimaging equipment was unable to clearly show individual conephotoreceptors near the foveal center. However, each darkarea, representing cone disruption, was larger than thediameter of a single central foveal cone. In fact, conedisruption area was detectable near the foveal center, eventhough individual cones could not be imaged in the samelocation. Despite these limitations, our study shows that thecombination of fundus examination, SD-OCT, and AO-SLO maybe useful in diagnosing and monitoring macular microholes.Using these images, we were able to associate photoreceptorand visual acuity changes in eyes with macular microholes.Macular microholes, which are commonly observed as innerand outer segment disruptions in the fovea, may occur in caseswith and without vitreofoveal traction.
Acknowledgments
Supported in part by the New Energy and Industrial TechnologyDevelopment Organization (NEDO; P05002), Kawasaki, Japan.
Disclosure: S. Ooto, None; M. Hangai, NIDEK, Co., Ltd. (C); K.Takayama, None; N. Ueda-Arakawa, None; Y. Makiyama,None; M. Hanebuchi, NIDEK Co., Ltd. (E); N. Yoshimura,NIDEK, Co., Ltd. (C)
References
1. Cairns JD, McCombe MF. Microholes of the fovea centralis.Aust NZ J Ophthalmol. 1988;16:75–79.
2. Reddy CV, Folk JC, Feist RM. Microholes of the macula. Arch
Ophthalmol. 1996;114:413–416.
3. Douglas RS, Duncan J, Brucker A, Prenner JL, Brucker AJ.Foveal spot: a report of thirteen patients. Retina. 2003;23:348–353.
4. Zambarakji HJ, Schlottmann P, Tanner V, Assi A, Gregor ZJ.Macular microholes: pathogenesis and natural history. Br J
Ophthalmol. 2005;89:189–193.
5. Gella L, Raman R, Pal SS, Nittala MG, Sharma T. Morphologicaland functional changes in spectral domain optical coherencetomography and microperimetry in macular microhole vari-ants: spectral domain optical coherence tomography andmicroperimetry correlation. Indian J Ophthalmol. 2012;60:53–56.
6. Liang J, Williams DR, Miller DT. Supernormal vision and high-resolution retinal imaging through adaptive optics. J Opt Soc
Am A Opt Image Sci Vis. 1997;14:2884–2892.
TABLE 2. Photoreceptor Abnormalities Detected by SD-OCT and AO-SLO in Macular Microholes
First Visit Last Visit P*
SD-OCT
ONL thickness, lm 86.2 6 17.9 89.7 6 36.2 0.410
IS/OS disruption
size, lm 105.8 6 61.8 62.8 6 63.5 0.084
COST disruption
size, lm 136.3 6 78.9 74.3 6 74.3 0.012
AO-SLO
Dark area, lm2 14,805 6 9,120 8,717 6 7,432 0.158
Cone density,
cones/mm2† 31,812 6 2,715 31,664 6 2,515 0.583
n, 12 eyes of 12 patients.* Wilcoxon rank test.† 0.5 mm from the central fovea.
Photoreceptor Imaging in Macular Microholes IOVS j September 2014 j Vol. 55 j No. 9 j 5941
Downloaded From: https://iovs.arvojournals.org/pdfaccess.ashx?url=/data/journals/iovs/933257/ on 08/20/2018

7. Roorda A, Williams DR. The arrangement of the three coneclasses in the living human eye. Nature. 1999;397:520–522.
8. Roorda A, Williams DR. Optical fiber properties of individualhuman cones. J Vis. 2002;2:404–412.
9. Roorda A, Romero-Borja F, Donnelly Iii W, Queener H, HebertT, Campbell M. Adaptive optics scanning laser ophthalmosco-py. Opt Express. 2002;10:405–412.
10. Pallikaris A, Williams DR, Hofer H. The reflectance of singlecones in the living human eye. Invest Ophthalmol Vis Sci.2003;44:4580–4592.
11. Carroll J, Neitz M, Hofer H, Neitz J, Williams DR. Functionalphotoreceptor loss related with adaptive optics: an alternatecause of color blindness. Proc Natl Acad Sci U S A. 2004;101:8461–8466.
12. Wolfing JI, Chung M, Carroll J, Roorda A Williams DR. High-resolution retinal imaging of cone-rod dystrophy. Ophthal-
mology. 2006;113:1019.e1.
13. Choi SS, Doble N, Hardy JL, et al. In vivo imaging of thephotoreceptor mosaic in retinal dystrophies and correlationswith visual function. Invest Ophthalmol Vis Sci. 2006;47:2080–2092.
14. Duncan JL, Zhang Y, Gandhi J, et al. High-resolution imagingwith adaptive optics in patients with inherited retinaldegeneration. Invest Ophthalmol Vis Sci. 2007;48:3283–3291.
15. Yoon MK, Roorda A, Zhang Y, et al. Adaptive optics scanninglaser ophthalmoscopy images in a family with the mitochon-drial DNA T8993C mutation. Invest Ophthalmol Vis Sci. 2009;50:1838–1847.
16. Kitaguchi Y, Fujikado T, Bessho K, et al. Adaptive optics funduscamera to examine localized changes in the photoreceptorlayer of the fovea. Ophthalmology. 2008;115:1771–1777.
17. Choi SS, Zawadzki RJ, Keltner JL, Werner JS. Changes incellular structures revealed by ultra-high resolution retinalimaging in optic neuropathies. Invest Ophthalmol Vis Sci.2008;49:2103–2119.
18. Marmor MF, Choi SS, Zawadzki RJ, Werner JS. Visualinsignificance of the foveal pit: reassessment of fovealhypoplasia as fovea plana. Arch Ophthalmol. 2008;126:907–913.
19. Ooto S, Hangai M, Sakamoto A, et al. High-resolution imagingof resolved central serous chorioretinopathy using adaptiveoptics scanning laser ophthalmoscopy. Ophthalmology. 2010;117:1800–1809.
20. Duncan JL, Ratnam K, Birch DG, et al. Abnormal conestructure in foveal schisis cavities in X-linked retinoschisisfrom mutations in exon 6 of the RS1 gene. Invest Ophthalmol
Vis Sci. 2011;52:9614–9623.
21. Chen Y, Ratnam K, Sundquist SM, et al. Cone photoreceptorabnormalities correlate with vision loss in patients withStargardt disease. Invest Ophthalmol Vis Sci. 2011;52:3281–3292.
22. Talcott KE, Ratnam K, Sundquist SM, et al. Longitudinal studyof cone photoreceptors during retinal degeneration and inresponse to ciliary neurotrophic factor treatment. Invest
Ophthalmol Vis Sci. 2011;52:2219–2226.
23. Duncan JL, Talcott KE, Ratnam K, et al. Cone structure inretinal degeneration associated with mutations in the periph-erin/RDS gene. Invest Ophthalmol Vis Sci. 2011;52:1557–1566.
24. Ooto S, Hangai M, Takayama K, et al. High-resolution imagingof the photoreceptor layer in epiretinal membrane usingadaptive optics scanning laser ophthalmoscopy. Ophthalmol-
ogy. 2011;118:873–881.
25. Ooto S, Hangai M, Takayama K, et al. High-resolutionphotoreceptor imaging in idiopathic macular telangiectasiatype 2 using adaptive optics scanning laser ophthalmoscopy.Invest Ophthalmol Vis Sci. 2011;52:5541–5550.
26. Ooto S, Hangai M, Yoshimura N. Photoreceptor restoration inunilateral acute idiopathic maculopathy on adaptive opticsscanning laser ophthalmoscopy. Arch Ophthalmol. 2011;129:1633–1635.
27. Mkrtchyan M, Lujan BJ, Merino D, Thirkill CE, Roorda A,Duncan JL. Outer retinal structure in patients with acute zonaloccult outer retinopathy. Am J Ophthalmol. 2012;153:757–768.
28. Ooto S, Hangai M, Takayama K, Ueda-Arakawa N, HanebuschiM, Yoshimura N . Photoreceptor damage and foveal sensitivityin surgically closed macular holes: an adaptive optics scanninglaser ophthalmoscopy study. Am J Ophthalmol. 2012;154:174–186.
29. Rossi EA, Achtman RL, Guidon A, et al. Visual function andcortical organization in carriers of blue cone monochromacy.PLoS One. 2013;8:e57956.
30. Syed R, Sundquist SM, Ratnam K, et al. High-resolution imagesof retinal structure in patients with choroideremia. Invest
Ophthalmol Vis Sci. 2013;54:950–961.
31. Vincent A, Wright T, Garcia-Sanchez Y, et al. Phenotypiccharacteristics including in vivo cone photoreceptor mosaic inKCNV2-related ‘‘cone dystrophy with supernormal rodelectroretinogram.’’ Invest Ophthalmol Vis Sci. 2013;54:898–908.
32. Ratnam K, Vastinsalo H, Roorda A, Sankila EM, Duncan JL.Cone structure in patients with usher syndrome type III andmutations in the Clarin 1 gene. JAMA Ophthalmol. 2013;131:67–74.
33. Ooto S, Hangai M, Takayama K, et al. Comparison of conepathological changes in idiopathic macular telangiectasiatypes 1 and 2 using adaptive optics scanning laser ophthal-moscopy. Am J Ophthalmol. 2013;155:1045–1057.
34. Yokota S, Ooto S, Hangai M, et al. Objective assessment offoveal cone loss ratio in surgically closed macular holes usingadaptive optics scanning laser ophthalmoscopy. PLoS One.2013;8:e63786.
35. Oh J, Smiddy WE, Flynn HW Jr, Gregori G, Lujan B.Photoreceptor inner/outer segment defect imaging by spec-tral domain OCT and visual prognosis after macular holesurgery. Invest Ophthalmol Vis Sci. 2010;51:1651–1658.
36. Burns SA, Tumbar R, Elsner AE, Ferguson D, Hammer DX.Large-field-of view, modular, stabilized, adaptive-optics-basedscanning laser ophthalmoscope. J Opt Soc Am A Opt Image Sci
Vis. 2007;24:1313–1326.
37. Ferguson RD, Zhong Z, Hammer DX, et al. Adaptive opticsscanning laser ophthalmoscope with integrated wide-fieldretinal imaging and tracking. J Opt Soc Am A Opt Image Sci
Vis. 2010;27:A265–A277.
38. Bennett AG, Rudnicka AR, Edgar DF. Improvements onLittmann’s method of determining the size of retinal featuresby fundus photography. Graefes Arch Clin Exp Ophthalmol.1994;232:361–367.
39. Li KY, Roorda A. Automated identification of cone photore-ceptors in adaptive optics retinal images. J Opt Soc Am A Opt
Image Sci Vis. 2007;24:1358–1363.
40. Flatter JA, Cooper RF, Dubow MJ, et al. Outer retinal structureafter closed-globe blunt ocular trauma [published online aheadof print April 18, 2014]. Retina. doi:24752010.
41. Spaide RF, Curcio CA. Anatomical correlates to the bands seenin the outer retina by optical coherence tomography:literature review and model. Retina. 2011;31:1609–1619.
42. Pircher M, Baumann B, Gotzinger E, Hizenberger CK. Retinalcone mosaic imaged with transverse scanning optical coher-ence tomography. Optics Lett. 2006; 31:1821–1823.
43. Scoles DH, Sulai YN, Langlo C, et al. In vivo imaging of humancone photoreceptor inner segments. Invest Ophthalmol Vis
Sci. 2014;55:4244–4251.
Photoreceptor Imaging in Macular Microholes IOVS j September 2014 j Vol. 55 j No. 9 j 5942
Downloaded From: https://iovs.arvojournals.org/pdfaccess.ashx?url=/data/journals/iovs/933257/ on 08/20/2018

44. Lai MM, Bressler SB, Haller JA. Spontaneous resolution ofmacular microhole. Am J Ophthalmol. 2006;141:210–212.
45. Funata M, Wendel RT, de la Cruz Z, Green WR. Clinicopath-ologic study of bilateral macular holes treated with pars planavitrectomy and gas tamponade. Retina. 1992;12:289–298.
46. Madreperla SA, Geiger GL, Funata M, et al. Clinicopathologiccorrelation of a macular hole treated by cortical vitreouspeeling and gas tamponade. Ophthalmology. 1994;101:682–686.
47. Rosa RH Jr, Glaser BM, de la Cruz Z, Green WR. Clinicopath-ologic correlation of an untreated macular hole and a macularhole treated by vitrectomy, transforming growth factor-beta 2,and gas tamponade. Am J Ophthalmol. 1996;122:853–863.
48. Ko TH, Fujimoto JG, Schuman JS, et al. Comparison ofultrahigh- and standard-resolution optical coherence tomogra-phy for imaging macular pathology. Ophthalmology. 2005;112:1922.e1–e15.
49. Sano M, Shimoda Y, Hashimoto H, Kishi S. Restoredphotoreceptor outer segment and visual recovery aftermacular hole closure. Am J Ophthalmol. 2009;147:313–318.e1.
50. Wakabayashi T, Fujiwara M, Sakaguchi H, Kusaka S, Oshima Y.Foveal microstructure and visual acuity in surgically closedmacular holes: spectral-domain optical coherence tomograph-ic analysis. Ophthalmology. 2010;117:1815–1824.
51. Bottoni F, De Angelis S, Luccarelli S, Cigada M, Staurenghi G.The dynamic healing process of idiopathic macular holes aftersurgical repair: a spectral-domain optical coherence tomogra-phy study. Invest Ophthalmol Vis Sci. 2011;52:4439–4446.
52. Li D, Kishi S. Loss of photoreceptor outer segment in acutezonal occult outer retinopathy. Arch Ophthalmol. 2007;125:1194–1200.
53. Spaide RF, Koizumi H, Freund KB. Photoreceptor outersegment abnormalities as a cause of blind spot enlargementin acute zonal occult outer retinopathy-complex diseases. Am
J Ophthalmol. 2008;146:111–120.
54. Tsunoda K, Fujinami K, Miyake Y. Selective abnormality ofcone outer segment tip line in acute zonal occult outerretinopathy as observed by spectral-domain optical coherencetomography. Arch Ophthalmol. 2011;129:1099–1101.
55. Wakazono T, Ooto S, Hangai M, Yoshimura N. Photoreceptorouter segment abnormalities and retinal sensitivity in acutezonal occult outer retinopathy. Retina. 2013;33:642–648.
Photoreceptor Imaging in Macular Microholes IOVS j September 2014 j Vol. 55 j No. 9 j 5943
Downloaded From: https://iovs.arvojournals.org/pdfaccess.ashx?url=/data/journals/iovs/933257/ on 08/20/2018