moderate resolution imaging spectroradiometer ... - nasa...moderate resolution imaging...
TRANSCRIPT

Moderate Resolution ImagingSpectroradiometer (MODIS)
Land Surface Temperature and EmissivityProduct (MxD21) User Guide
Collection-6
Glynn Hulley1, Robert Freepartner1, Nabin Malakar1, Sudipta Sarkar2
1. Jet Propulsion Laboratory, California Institute of Technology2. Science Systems and Applications Inc., NASA GSFC
National Aeronautics andSpace Administration
Jet Propulsion LaboratoryCalifornia Institute of TechnologyPasadena, California
December 2016
1

This research was carried out at the Jet Propulsion Laboratory, California Institute of Technology, under a
contract with the National Aeronautics and Space Administration.
Reference herein to any specific commercial product, process, or service by trade name, trademark,
manufacturer, or otherwise, does not constitute or imply its endorsement by the United States
Government or the Jet Propulsion Laboratory, California Institute of Technology.
© 2016. California Institute of Technology. Government sponsorship acknowledged.
Note:
The users' guide is designed to be a living document that describes the new MODIS Land
Surface Temperature and Emissivity (LST&E) product in Collection 6 (MxD21). The document
describes the current state of the art, and is revised as progress is made in the development and
assessment of the LST product. The primary purpose of the document is to present an overview
of the MxD21 data product to the potential user. For a complete detail of the Algorithm
Theoretical Basis Document (ATBD), please see Hulley et al (2015) or go to
https://modis.gsfc.nasa.gov/data/dataprod/MOD21.php
2

Change History Log
Revision Effective Date Prepared by Description of Changes
Outline 02/28/2016 Glynn Hulley, Nabin Malakar
User Guide outline based on MXD11.
Draft 04/18/2016 Glynn Hulley, Robert Freepartner
User Guide first draft for MxD21 products.
Draft 04/19/2016 Sudipta Sarkar Edits to MxD21A1/MxD21A2 production sections
Draft 07/18/2016 Glynn Hulley Updates to remove MOD09/MOD10 dependence and include ASTER GEDv3 in the outputs.Updates to SDS in MxD21A1/A2 products.
Draft 08/29/2016 Glynn HulleyRobert Freepartner
Updates to include global attributes in MxD21A1 and MxD21A2
Draft 01/09/2017 Glynn Hulley Included image examples of MxD21, MxD21A1 and MxD21A2 data. Changed all instances of ‘MOD21’ to ‘MxD21’.
Draft 05/08/2017 Glynn Hulley Added in description of near-real time processing with NCEP GFS data,and validation comparison with MERRA2
Draft 06/12/2017 Glynn Hulley Minor edits dealing discrepancies between User Guide and internal metadata
Draft 06/25/2017 Glynn Hulley QA update to deal with Terra band 29 dead detector
Draft 10/25/2017 Glynn Hulley Included section 1.3 describing product availability and ftp information for NRT users.
Draft 6/4/2018 Glynn Hulley Changed cloud confidence from 66%to 95% over land.
Final 7/25/2018 Glynn Hulley Minor edits to metadata definitions
3

Contacts
Readers seeking additional information about this product may contact the following:
Glynn C. Hulley (PI)MS 183-509Jet Propulsion Laboratory4800 Oak Grove Dr.Pasadena, CA 91109Email: [email protected]: (818) 354-2979
4

ContentsFigures..........................................................................................6Tables............................................................................................61 Introduction.............................................................................7
1.1 File Format of the LST Products...................................................................................71.2 LST&E Products............................................................................................................81.3 Product Availability.......................................................................................................9
2 MxD21 LST Product................................................................102.1 Algorithm Description.................................................................................................102.2 Scientific Data Sets (SDS)...........................................................................................132.3 Local Attributes...........................................................................................................142.4 Global Attributes..........................................................................................................142.5 Quality Assurance (QA)..............................................................................................18
3 MxD21A1 Daily LST Product....................................................203.1 Algorithm Description.................................................................................................203.2 Scientific Data Sets (SDS)...........................................................................................213.3 Local Attributes...........................................................................................................223.4 Global Attributes..........................................................................................................223.5 Quality Assurance........................................................................................................24
4 MxD21A2 Eight-day LST Product.............................................254.1 Algorithm Description.................................................................................................254.2 Scientific Data Sets (SDS)...........................................................................................264.3 Local Attributes...........................................................................................................274.4 Global Attributes..........................................................................................................274.5 Quality Assurance........................................................................................................27
5 Publications and References...................................................29
5

FiguresFigure 1. Example MxD21 LST granule (2006195) over southwestern USA (degrees K).........................................10Figure 2. Schematic detailing the flow of the MxD21 PGE at MODAPS..................................................................11Figure 3. Example MYD21A1D LST product for 2003001 produced by MODAPS using Aqua data......................20Figure 4. Example MYD21A2 8-day LST product for 2003001 produced by MODAPS using Aqua data...............25
Table
Table 1: Summary of the MxD21 LST&E product...........................................................................................................9Table 2: This table describes the MODIS products and other ancillary input data required to produce the MxD21
product, in this example for Terra data...............................................................................................................12Table 3. The SDSs in the MxD21 product........................................................................................................................13Table 4. Listing of objects in the global attribute CoreMetadata.0 in MxD21.................................................................14Table 5. Listing of objects in the global attribute ArchiveMetadata.0 in MxD21............................................................16Table 6. Listing of objects in the global attribute StructMetadata.0 in MxD21...............................................................17Table 7. Bit flags defined in the QC SDS in the MxD21 product. (Note: Bit 0 is the least significant bit).....................18Table 8. The SDSs in the MxD21A1D/MxD21A1N product...........................................................................................21Table 9. Listing of objects in the global attribute CoreMetadata.0 in the MxD21A1D/MxD21A1N products...............21Table 10. Bit flags defined in the QC SDS in the MxD21A1D/MxD21A1N product. (Note: Bit 0 is the least significant
bit).......................................................................................................................................................................23Table 11. The SDSs in the MxD21A2 product.................................................................................................................26Table 12. Bit flags defined in the QC_Day and QC_Night SDS in the MxD21A2 product. (Note: Bit 0 is the least
significant bit).....................................................................................................................................................27
6

1 Introduction
A new MODIS Land Surface Temperature and Emissivity (LST&E) product (MxD21) produced for Terra (MOD21) and Aqua (MYD21) data will be available in Collection 6 (C6). The MxD21 product uses a physics-based algorithm to dynamically retrieve both the LST and Emissivity simultaneously for the three MODIS thermal infrared bands (29, 31 and 32) at a spatial resolution of 1 km at nadir. The MxD21 product address the documented cold bias of 3-5 K in the MXD11 heritage split-window products (Malakar and Hulley 2016). The MxD21 algorithm is based on the ASTER Temperature Emissivity Separation (TES) algorithm, which uses full radiative transfer simulations for the atmospheric correction, and an emissivity model based on the variability in the surface radiance data to dynamically retrieve both LST and spectral emissivity (Hulley and Hook 2011). The TES algorithm is combined with an improved Water Vapor Scaling (WVS) atmospheric correction scheme to stabilize the retrieval during very warm and humid conditions (Islam et al. 2017; Malakar and Hulley 2016). Simulations and validation results available in the ATBD have shown consistent accuracies at the 1 K level over all land surface types including vegetation, water, and deserts.
The MxD21 product will include a swath (scene) Level-2 product daily, and a Level 3 daily and eight-day gridded products in sinusoidal projections. The algorithms and data content of these LST products are briefly described in this guide, with the purpose of providing a user with sufficient information about the content and structure of the data files to enable the user to accessand use the data, in addition to understanding the uncertainties involved with the product. Overviews of the file format and sequence of MxD21 products are given first. Descriptions of the algorithm and product content are presented in the following sections. Publications and documents related to the MxD21 LST products are listed in the final sections.
A description of the major components of the MxD21 algorithm implemented in the C6 daily LST Product Generation Executive (PGE) code are shown in Table 1 and described in depth in the ATBD available at https://modis.gsfc.nasa.gov/data/dataprod/MOD21.php. The primary purpose of this document is to supply a user with sufficient information about the content and structure of the data files so that the users will be able to access and use the data with confidence.
1.1 File Format of the LST Products
The MODIS LST products are archived in Hierarchical Data Format V4 - Earth Observing System (HDF-EOS) format files. HDF, developed by the NSCA, is the standard archive format for EOS Data Information System (EOSDIS) products. The LST product files contain global attributes (metadata) and scientific data sets (SDSs) (arrays) with local attributes. Unique in HDF-EOS data files is the use of HDF features to create point, swath, and grid structures to support geolocation of data. These structures (Vgroups and Vdata) provide geolocation relationships between data in an SDS and geographic coordinates (latitude and longitude or map projections) to support mapping the data. Attributes (metadata), global and local, provide variousinformation about the data. Users unfamiliar with HDF and HDF-EOS formats may wish to consult Web sites listed in the Related Web Sites section for more information.
7

Similar to the heritage MXD11 LST products, the MxD21 LST data product files contain three EOS Data Information System (EOSDIS) Core System (ECS) global attributes, which are also referred to as metadata by ECS. These ECS global attributes (CoreMetadata.0, ArchiveMetadata.0 and StructMetadata.0) contain information relevant to production, archiving, user services, geolocation and analysis of data. The ECS global attributes are written in parameter value language (PVL) and are stored as a character string. Metadata and values are stored as objects within the PVL string. Results of the LST algorithms are stored as SDSs with local attributes. Local attributes include summary statistics and other information about the data in an SDS or a key to data values. Detailed descriptions of each LST product are given in following sections.
Products may also contain product specific attributes (PSAs) defined by the product developers as part of the ECS CoreMetadata.0 attribute. Geolocation and gridding relationships between HDF-EOS point, swath, and grid structures and the data are contained in the ECS global attribute, StructuralMetadata.0.
A separate file containing metadata will accompany data products ordered from a DAAC. That metadata file will have a .met extension and is written in PVL. The .met file contains some of thesame metadata as in the product file but also has other information regarding archiving and user support services as well as some post production quality assurance (QA) information relevant to the product file ordered. The post production QA metadata may or may not be present depending on whether or not the data file has been investigated. The .met file should be examined to determine if post production QA has been applied to the product file. (The Quality Assurance sections of this guide provide information on post production QA.) The data products were generated in the science data production system using the HDF-EOS toolkit, Science Data Processing (SDP) Toolkit, HDF API and the C programming language.
1.2 LST&E Products
The MxD21 LST&E data products are produced in swath, daily gridded, and 8-day gridded products. The swath (scene/granule) has a nadir resolution of 1 km with 2030 pixels along track and 1354 pixels per line for each five minutes of the MODIS scans. The MxD21 Level 2 swath products are aggregated to produce the global L3 daily and 8-day mean LST&E products. Table 1 shows a summary of products that will be available for MxD21 and their characteristics. Products in EOSDIS are labeled as Earth Science Data Type (ESDT). The ESDT label "shortname" is used to identify the LST data products. Each LST product in the sequence is built from the previous LST products. These LST products are identified, in part, by product levels in EOSDIS that indicate what spatial and temporal processing has been applied to the data.
Data product levels briefly described: Level 1B (L1B) is a swath (scene) of measured MODIS radiance data geolocated to latitude and longitude centers of 1 km resolution pixels. A level 2 (L2) product is a geophysical product retrieved from the L1B data that remains in latitude and longitude orientation; it has not been temporally or spatially manipulated. A level 3 (L3) product
8

is a geophysical product that has been temporally and or spatially manipulated, and is usually in a gridded map projection format referred to as tiles. Each tile is a piece, e.g., about 1113km by 1113km in 1200 rows by 1200 columns, of a map projection.
Table 1: Summary of the MxD21 LST&E product.
Earth Science Data Type (ESDT)
Product Level
Data Dimension Spatial Resolution
Temporal Resolution
Map Projection
MxD21 L2 2030 (2040) lines by 1354 pixels per line
1 km at nadir Swath None, (lat, lontagged)
MxD21A1D/
MxD21A1N
L3 1200 rows by 1200 columns
1 km Daily Sinusoidal
MxD21A2 L3 1200 rows by 1200 columns
1 km Eight day Sinusoidal
The first product, MxD21, is a LST product at 1 km spatial resolution for a swath. This product is generated from the Temperature and Emissivity Separation (TES) algorithm (Hulley et al. 2012a). Geolocation data (latitude and longitude) at a coarse resolution of ~5 km is also stored inthe product. The second product, MxD21A1D/MxD21A1N, is a tile of daily LST Day/Night product at 1 km spatial resolution. It is generated by mapping the pixels in the MxD21 products for a day to the Earth locations on the sinusoidal projection. The third product, MxD21A2, is an eight-day LST product by averaging from two to eight days of the MxD21A1D and MxD21A1N product.
1.3 Product Availability
The standard MxD21 LST&E products produced using MERRA2 data are available through the NASA Land Processes Distribution Active Archive Center (LPDAAC), https://lpdaac.usgs.gov/dataset_discovery/modis/modis_products_table/myd21_v006 (DOI: 10.5067/MODIS/MYD21.006) and can be accessed via the Earthdata search engine, or in the Data Pool.
The Near-Real-Time (NRT) products produced using NCEP data (see 2.l for details) will be made available from the LAADS server in a 2-month rolling archive for use by NRT users.
1. ftp nrt3.modaps.eosdis.nasa.gov
2. Sign in using Earthdata registered credential to connect
3. Change to directory allData/6/MOD21/ or allData/6/MYD21
9

2 MxD21 LST Product
2.1 Algorithm Description
For a full detailed description of each module within the algorithm please see the MxD21 ATBD linked on the MODIS product page for MxD21 (Hulley et al. 2012a). The MxD21 product uses aphysical-based Temperature and Emissivity Separation (TES) algorithm to retrieve the Land Surface Temperature and Emissivity (LST&E) products (Gillespie et al. 1998; Hulley and Hook 2011). The atmospheric correction of the MODIS thermal infrared (TIR) bands 29, 31, and 32 is performed using the RTTOV radiative transfer model (Matricardi 2008; Saunders et al. 1999) with input atmospheric profiles from the MERRA-2 numerical weather prediction model(Rienecker et al. 2011). MERRA-2 is a reanalysis product produced by the NASA Global Modeling and Assimilation Office (GMAO) and typically have a data latency of 1-2 months delivery at MODAPS. As a result the PGE116 has an option to run operationally in near real time(NRT) mode using data from the NCEP Global Forecast System (GFS) available in near real time.
Figure 1. Example MxD21 LST granule (2006195) over southwestern USA (degrees K).
MxD21 products retrieved from the NCEP data will be made available from the LAADS server in a 2-month rolling archive for use by NRT users, however, this data will be reprocessed with MERRA-2 once available, and distributed to the LDPAAC. NRT users should be aware that differences as large as 5 K could be found between the MERRA-2 and NCEP versions of the product, mostly due to differences in spatial resolution of the water vapor fields in the NCEP (~100 km) and MERRA-2 (~50 km) products during warm and humid conditions. Preliminary validation of 3 years of data from the MYD21 product with MERRA-2 and NCEP have shown that on average their accuracy is similar to within <1 K at the Lake Tahoe validation site, and to within <1% difference in emissivity over a set of sand dune validation sites in the US Southwest.
10

More detailed information on MERRA-2 and NCEP and their characteristics and effects on LST retrieval are presented in the ATBD available here: (https://modis.gsfc.nasa.gov/data/atbd/atbd_mod21.pdf). Future plans are to use GEOS5-FP atmospheric fields from the GMAO for the atmospheric correction, which are available at a higher resolution (~25km) and in near real time for instrument and data product teams.
A Water Vapor Scaling (WVS) model is further employed to improve the atmospheric correction accuracy under conditions of heavy water vapor loadings on a pixel-by-pixel basis (Tonooka 2005). The MxD21 product is produced globally over all land cover types for all cloud-free pixels, and includes LST and emissivity for the three MODIS TIR bands 29, 31, and 32 at 1-km resolution at nadir. The product also includes a full set of uncertainty information, with estimatederrors for LST and the emissivity fields generated from an uncertainty model (Hulley et al. 2012b). Figure 2 shows a schematic detailing the flow of the MxD21 PGE within the MODAPS Science Data System including the primary input datasets, and subprocesses.
Similar to the heritage MXD11 product, the MxD21 LST&E retrieval in a MODIS swath is constrained to pixels that:
(1) Have nominal Level 1B radiance data in bands 29, 31 and 32,
(2) Are on land or inland water,
(3) Are in clear-sky conditions at a confidence (defined in MOD35) of >= 95% over land
Data inputs to the MxD21 LST algorithm are listed in Table 2. Clouds are masked with the MODIS Cloud Mask data product (MOD35_L2) at >=95% confidence over land. The algorithm is only run over land pixels, so masking of oceans is accomplished with the 1 km resolution land/water mask contained in the MODIS geolocation product (MOD03).
The ASTER GED v3 emissivity product (Hulley et al. 2015) is used to assign the correct emissivity-dependent coefficients in the WVS model on a scene-by-scene basis. Details of this method are available in the MxD21 ATBD.
Figure 2. Schematic detailing the flow of the MxD21 PGE at MODAPS.
11
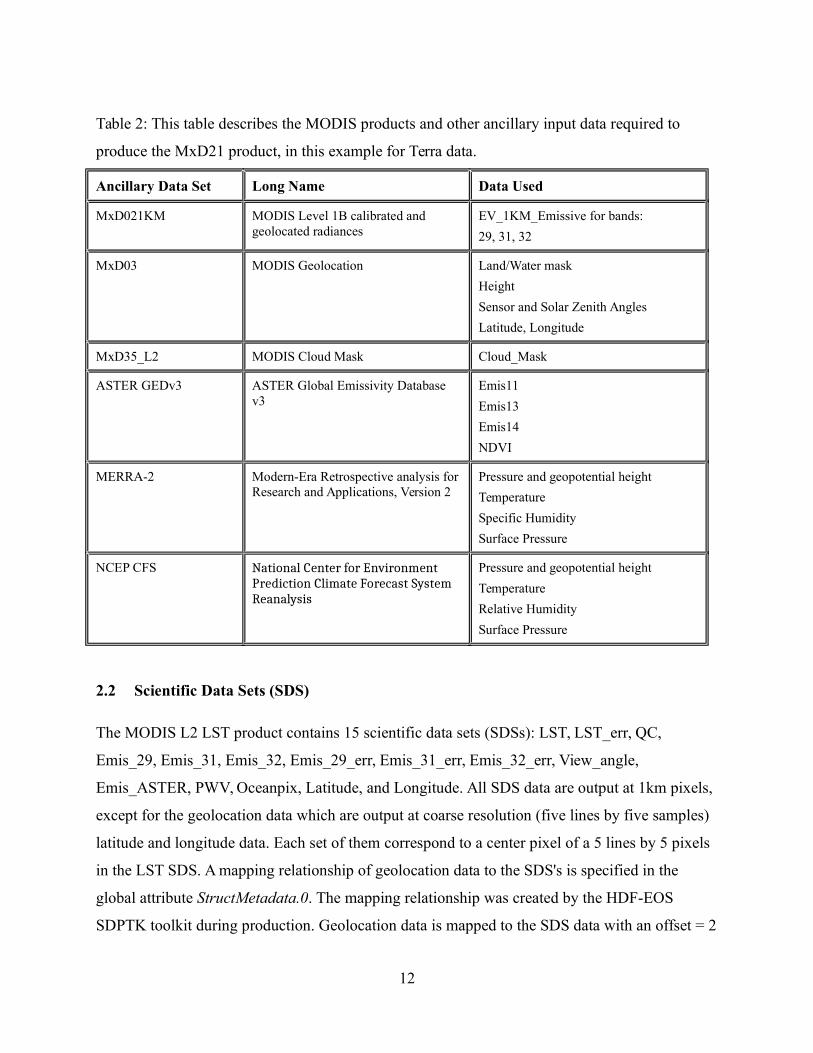
Table 2: This table describes the MODIS products and other ancillary input data required to
produce the MxD21 product, in this example for Terra data.
Ancillary Data Set Long Name Data Used
MxD021KM MODIS Level 1B calibrated and geolocated radiances
EV_1KM_Emissive for bands:
29, 31, 32
MxD03 MODIS Geolocation Land/Water mask
Height
Sensor and Solar Zenith Angles
Latitude, Longitude
MxD35_L2 MODIS Cloud Mask Cloud_Mask
ASTER GEDv3 ASTER Global Emissivity Database v3
Emis11
Emis13
Emis14
NDVI
MERRA-2 Modern-Era Retrospective analysis for Research and Applications, Version 2
Pressure and geopotential height
Temperature
Specific Humidity
Surface Pressure
NCEP CFS National Center for Environment Prediction Climate Forecast System Reanalysis
Pressure and geopotential height
Temperature
Relative Humidity
Surface Pressure
2.2 Scientific Data Sets (SDS)
The MODIS L2 LST product contains 15 scientific data sets (SDSs): LST, LST_err, QC,
Emis_29, Emis_31, Emis_32, Emis_29_err, Emis_31_err, Emis_32_err, View_angle,
Emis_ASTER, PWV, Oceanpix, Latitude, and Longitude. All SDS data are output at 1km pixels,
except for the geolocation data which are output at coarse resolution (five lines by five samples)
latitude and longitude data. Each set of them correspond to a center pixel of a 5 lines by 5 pixels
in the LST SDS. A mapping relationship of geolocation data to the SDS's is specified in the
global attribute StructMetadata.0. The mapping relationship was created by the HDF-EOS
SDPTK toolkit during production. Geolocation data is mapped to the SDS data with an offset = 2
12

and increment = 5. The first element (0,0) in the geolocation SDSs corresponds to element (2,2)
in LST SDS, then increments by 5 in the cross-track or along-track direction to map geolocation
data to the LST SDS element. Details are shown in Table 3.
Table 3. The SDSs in the MxD21 product.
SDS Long Name Data type
Units Valid Range
Fill Value
Scale Factor
Offset
LST Land Surface Temperature
uint16 K 7500-65535
0 0.02 0.0
QC Quality control for LST and emissivity
uint16 n/a 0-65535 n/a n/a n/a
Emis_29 Band 29 emissivity uint8 n/a 1-255 0 0.002 0.49Emis_31 Band 31 emissivity uint8 n/a 1-255 0 0.002 0.49Emis_32 Band 32 emissivity uint8 n/a 1-255 0 0.002 0.49LST_err Land Surface
Temperature erroruint8 K 1-255 0 0.04 0.0
Emis_29_err Band 29 emissivity error
uint16 n/a 1-65535 0 0.0001 0.0
Emis_31_err Band 31 emissivity error
uint16 n/a 1-65535 0 0.0001 0.0
Emis_32_err Band 32 emissivity error
uint16 n/a 1-65535 0 0.0001 0.0
View_angle MODIS view angle for current pixel
uint8 Deg 0-180 n/a 0.5 0.0
Emis_ASTER ASTER GED Emissivity
uint8 n/a 1-255 0 0.002 0.49
PWV Precipitable Water Vapor
uint16 cm 0-65535 n/a 0.001 0.0
oceanpix Ocean-land mask uint8 n/a 0 = land1 = water
n/a n/a n/a
Latitude Pixel Latitude float32 Deg -90 to 90 -999.0 n/a n/aLongitude Pixel Longitude float32 Deg -180 to
180-999.0 n/a n/a
2.3 Local Attributes
Archived with the "LST" SDS are local attributes including the coefficients of the calibration which converts the SDS value to real LST value in K. HDF predefined local attributes (Table 5) describe characteristics of the data.
13

2.4 Global Attributes
There are three global ECS attributes, i.e., CoreMetadata.0, ArchiveMetadata.0, and StructMetadata.0, in the MxD21 data product. Contents of these global attributes were determined and written during generation of the product and are used in archiving and populating the EOSDIS database to support user services. They are stored as very long character strings in parameter value language (PVL) format. Descriptions of the global attributes are given here to assist the user in understanding them.
CoreMetadata.0 is the global attribute in which information compiled about the product during product generation is archived and is used to populate the EOSDIS database to support user services. The content of the global attributes with sample values and comment of definition are listed in Table 4, Table 5, and Table 6, respectively. The user wanting detailed explanations of the global attributes and related information should query the EOSDIS related web sites.
Table 4. Listing of objects in the global attribute CoreMetadata.0 in MxD21.
Object Name Sample Value Comment ShortName "MxD21" ESDT name of product VersionID 6 ECS Version ReprocessingActual "reprocessed" ReprocessingPlanned "further update is
anticipated" Expect that products will be reprocessed one or more times.
LocalGranuleID "MxD21.A2004216.1100.006.2016090230901.hdf" DayNightFlag "Day" Day , Night or Both.ProductionDateTime "2006-07-27T23:10:07.000Z" LocalVersionID "SCF V6.0.21" Version of algorithm
delivered from the SCF. PGEVersion "6.0.40" Version of production
generation executable. InputPointer "MOD03.A2004216.1100.00
6.2012277025215.hdf","..." Location of input files in the production system.
RangeBeginningDate "2000-04-04" Beginning and ending times of the first and last scan linein the swath. RangeBeginningTime "19:15:00.000000"
RangeEndingDate "2000-04-04" RangeEndingTime "19:20:00.000000" ExclusionGRingFlag "N" Geographic bounds of
swath coverage.GRingPointLatitude [54.085346, 49.240036, 32.346612, 35.789540]
GRingPointLongitude [ -134.529204, -100.841011, -110.349156, -135.759611]
GRingPointSequenceNo [1,2,3,4]
14

OrbitNumber 1579 EquatorCrossingLongitude -131.114787 EquatorCrossingDate "2000-04-04" EquatorCrossingTime "19:29:39.345204" ParameterName " 1km LST, 3band Emissivity" AutomaticQualityFlag "Passed" Result of automated
checks during the run of the algorithm that screen for significant amounts of anomalous data.
AutomaticQualityFlagExplanation “No automatic quality assessment is performed inthe PGE.”
Explanation of result ofautomated QA checks made during execution.
ScienceQualityFlag "Not Investigated" Set by LST investigatorafter post-production investigation
SciencelQualityFlagExplanation "See http://landweb.nascom/nasa.gov/cgi-bin/QA_WWW/qaFlagPage.cgi?sat=terra the product Science Quality status."
Explanation of ScienceFlag
QAPercentMissingData 0 0-100 QAPercentCloudCover 60 0-100 AncillaryInputPointer "MOD03.A2000095.1915.
005.2006188045128.hdf" Location of geolocation input product in production system.
AncillaryInputType "Geolocation" Type of ancillary data referenced by pointer.
AssociatedSensorShortName "MODIS" AssociatedPlatformShortName "Terra" AssociatedInstrumentShortName "MODIS" Product Specific Attributes (PSA) QAPercentGoodQuality 29 Summary quality
assurance statistic for data product. Range is from 0-100.
QAPercentOtherQuality 8 QAPercentNotProducedCloud 33 QAPercentNotProducedOther 29 GranuleNumber 233 Unique granule
identifier
15

QAFractionGoodQuality 0.2947352 Summary fraction of the LST product. Range is from 0.0 to 1.0.
QAFractionOtherQuality 0.0831999 QAFractionNotProducedCloud 0.3331286 QAFractionNotProducedOther 0.2889363
The four QAFraction PSAs are specially useful to granules in ocean regions where only a small number of island pixels exist. Because the total number of land and coastal pixels is highly variable in granules covering both land and ocean, the values of QAPercent and QAFraction PSAs are calculated on the base of the total number of all pixels in a granule. Therefore, we can always calculate how many pixels with LST in good quality and other quality from these PSA values, even for island pixels.
The ECS global attribute ArchiveMetadata.0 contains information relevant to production of the data product. It also contains an alternate bounding of geographic coverage of the swath. These data may be useful in determining what version of the algorithm was used to generate the product. Contents are described in Table 5.
Table 5. Listing of objects in the global attribute ArchiveMetadata.0 in MxD21.
Object Name Typical Value Comment
EastBoundingCoordinate -100.843259 Extent of swath coverage, inlatitude and longitude.
WestBoundingCoordinate -135.743222
NorthBoundingCoordinate 54.070671
SouthBoundingCoordinate 32.460855
AlgorithmPackageAcceptanceDate "12-2011" Algorithm Descriptors
AlgorithmPackageMaturityCode "Normal"
AlgorithmPackageName "MOD_PRLST"
AlgorithmPackageVersion "6"
InstrumentName "Moderate-Resolution Imaging SpectroRadiometer"
ProcessingDateTime "2006-07-27T23:10:07.000Z"
LongName "MODIS/Terra Land Surface Temperature/Emissivity 5-Min L2 Swath 1km"
ProcessingCenter "MODAPS"
SPSOParameters "2484 and 3323"
LocalInputGranuleID "MOD021KM.A2000095.1915..."
input L1B HDF file.
ProcessingEnvironment "Linux moddev-c64 2.6.18-406.el5 #1 SMP Tue
16

Jun 2 17:25:57 EDT 2015 x86_64 x86_64 x86_64 GNU/Linux"
The StructMetadata.0 global attribute is used by the HDF-EOS toolkit to specify the mapping relationships between the geolocation data and the LST data (SDSs) as listed in Table 6. Mapping relationships are unique in HDF-EOS and are stored in the product using HDF structures. Descriptionof the mapping relationships is not given here. Use of HDF-EOS toolkit, other EOSDIS supplied toolkits may be used to geolocate the data.
Table 6. Listing of objects in the global attribute StructMetadata.0 in MxD21.
Object Definition
DIMENSION_1 swath_lines_5km (2*nscans)
DIMENSION_2 swath_pixels_5km
DIMENSION_3 swath_lines_1km (10*nscans)
DIMENSION_4 swath_pixels_1km
DIMENSION_5 number1km
GEOFIELD_1 GeoFieldName=Latitude
GEOFIELD_2 GeoFieldName=Longitude
DATAFIELD_1 DataFieldName=LST
DATAFIELD_2 DataFieldName=QC
DATAFIELD_3 DataFieldName=”Emis_29”
DATAFIELD_4 DataFieldName=”Emis_31”
DATAFIELD_5 DataFieldName=”Emis_32”
DATAFIELD_6 DataFieldName=”LST_err”
DATAFIELD_7 DataFieldName=”Emis_29_err”
DATAFIELD_8 DataFieldName=”Emis_31_err”
DATAFIELD_9 DataFieldName=”Emis_32_err”
DATAFIELD_10 DataFieldName=”PWV”
DATAFIELD_11 DataFieldName=”Emis_ASTER”
DATAFIELD_12 DataFieldName=”oceanpix”
DATAFIELD_13 DataFieldName=”View_angle”
2.5 Quality Assurance (QA)
Indicators of quality are given in metadata objects in the CoreMetadata.0 global attribute QA and in a quality control (QC) SDS, generated during production, or in post-product scientific and quality checks of the data product. QA metadata objects in the CoreMetadata.0 global attribute are the AutomaticQualityFlag and the ScienceQualityFlag and their corresponding explanations. The
17

AutomaticQualityFlag is set according to rules based on data conditions encountered during a run of the LST algorithm. Setting of this QA flag is fully automated. The rules used to set it are liberal; nearly all of the data or intermediate calculations would have to be anomalous for it to be set to "Failed". Typically, it will be set to "Passed". The ScienceQualityFlag is set post production either after an automated QA program is run on the data product or after the data product is inspected by a qualified LST investigator. Content and explanation of this flag are dynamic so it should always be examined if present. A sampling of products will be inspected. Sampling may be random, in support of field campaigns, or event driven.
The QC SDS in the data product provides additional information on algorithm results for each pixel. The QC SDS unsigned 16-bit data are stored as bit flags in the SDS. This QC information can be extracted by reading the bits in the 16-bit unsigned integer. The purpose of the QC SDS is to give the user information on algorithm results for each pixel that can be viewed in a spatial context. The QC information tells if algorithm results were nominal, abnormal, or if other defined conditions were encountered for a pixel. The QC information should be used to help determine the usefulness of the LST and Emissivity data for a user's needs. The bit flags in the QC SDS are listed in Table 7 and consist of flags related to data quality, cloud, TES algorithm diagnostics, and error estimates.
A value of 0 in the QC bit flags means good, cloud free data quality and no further analysis of the QCbits is necessary. Users may use data of 'unreliable quality' (bits 1&0 = 01), but caution should be taken since either the retrieved emissivity is suspect (emissivity in both longwave bands 31 and 32 < 0.95), the pixel is nearby cloud, there was low transmissivity in the atmospheric correction implying a very opaque atmosphere with high moisture content, which results in large uncertainty in the TES retrieval.
A note on Terra detector striping: From August 29, 2006 onward a dead detector for Terra band 29 resulted in a striping artifact in MOD21 L2 products. Since the TES algorithm requires well calibrated data for MODIS bands 29, 31, and 32, the dead detector pixels are skipped in TES processing and flaggedas ‘11’ in bits 1&0 and 3&2 in the QC SDS as shown in Table 7. For qualitative purposes these pixels are filled in with a nearest neigbor average in the MOD21_L2 product but should not be used for quantitative or any science related purposes.
Table 7. Bit flags defined in the QC SDS in the MxD21 product. (Note: Bit 0 is the least
significant bit).
Bits Long Name Description
1&0 Mandatory QA flags 00 = Pixel produced, good quality, no further QA info necessary
01 = Pixel produced but unreliable quality. Either one or more of the following conditions are met: emissivity in both bands 31 and 32 < 0.95, retrievalaffected by nearby cloud, low transmissivity due tohigh water vapor loading (<0.4). Recommend moredetailed analysis of other QC information
10 = Pixel not produced due to cloud
11 = Pixel not produced due to reasons other than cloud (e.g. ocean pixel, poorly calibrated input
18

radiance, dead detector, TES divergence flag)
3 & 2 Data quality flag 00 = Good data quality of L1B bands 29, 31, 32
01 = Missing pixel
10 = Fairly calibrated
11 = Poorly calibrated, TES processing skipped
5 & 4 Cloud flag 00 = Cloud free pixel
01 = Thin cirrus
10 = Pixel within 2 pixels of nearest cloud (~2km)
11 = Cloud pixel
7 & 6 TES Iterations (k) 00 = 7 (Slow convergence)
01 = 6 (Nominal)
10 = 5 (Nominal)
11 = <5 (Fast)
9 & 8 Atmospheric OpacityLλ
↓/L'
00 = 0.3 (Warm, humid air; or cold land)
01 = 0.2 - 0.3 (Nominal value)
10 = 0.1 - 0.2 (Nominal value)
11 = <0.1 (Dry, or high altitude pixel)
11 & 10 Min-Max Difference (MMD). Difference between minimum and maximum emissivity for bands 29, 31, 32
00 = >0.15 (Most silicate rocks)
01 = 0.1 - 0.15 (Rocks, sand, some soils)
10 = 0.03 - 0.1 (Mostly soils, mixed pixel)
11 = <0.03 (Vegetation, snow, water, ice)
13 & 12 Emissivity accuracy 00 = >0.017 (Poor performance)
01 = 0.015 - 0.017 (Marginal performance)
10 = 0.013 - 0.015 (Good performance)
11 = <0.013 (Excellent performance)
15 & 14 LST accuracy 00 = >2.5 K (Poor performance)
01 = 1.5 - 2.5 K (Marginal performance)
10 = 1 - 1.5 K (Good performance)
11 = <1 K (Excellent performance)
19

3 MxD21A1 Daily LST Product
The daily level 3 LST&E day and night product at 1km spatial resolution is a tile of daily LST&E product gridded in the Sinusoidal projection. A tile contains 1200 x 1200 grids in 1200 rows and 1200 columns. The exact grid size at 1km spatial resolution is 0.928km by 0.928km.
3.1 Algorithm Description
The daily MxD21A1D/MxD21A1N LST products are compiled from daily gridded L2G intermediateproducts (MxD21GD/MxD21GN). The L2G process maps the daily MxD21 granules onto a sinusoidal MODIS grid and stores all observations falling over a gridded cell for a given day. The total number of observations for a day are determined not only by the number of orbits passing over that cell but also by the spread of observations from off-nadir coverage.
The MxD21A1 algorithm sorts through all these observations for each cell and for a given day and estimates the final LST value as a weighted average over all observations that are cloud free and havegood LST and emissivity accuracies, weighted by the observation coverage for that cell. Only observations having observation coverage more than a certain threshold (15%) are considered for thisaveraging. This process is repeated for all day and night granules separately to create separate MxD21A1D (day) and MxD21A1N (night) products. The final quality byte for the output product reflects the lowest quality values from all observations that went into the final averaging.
Figure 3. Example MYD21A1D LST product for 2003001 produced by MODAPS using Aqua
data.
20

3.2 Scientific Data Sets (SDS)
The SDSs in the MxD21A1D/MxD21A1N product include:
LST_1KM: Daily 1km Land Surface temperature
QC: Daily QA bytes for LST and emissivity.
View_Angle: View zenith angle of LST
View_Time: Time of LST observations
Emis_29: Daily Band 29 emissivity
Emis_31: Daily Band 31 emissivity
Emis_32: Daily Band 32 emissivity
Table 8. The SDSs in the MxD21A1D/MxD21A1N product.
SDS Long Name Data type
Units Valid Range
Fill Value
Scale Factor
Offset
LST_1KM Land Surface Temperature
uint16 K 7500-65535
0 0.02 0.0
QC Quality control uint16 n/a 0-65535 n/a n/a n/aEmis_29 Band 29 emissivity uint8 n/a 1-255 0 0.002 0.49Emis_31 Band 31 emissivity uint8 n/a 1-255 0 0.002 0.49Emis_32 Band 32 emissivity uint8 n/a 1-255 0 0.002 0.49View_Angle MODIS view angle uint8 deg 0-130 255 1 -65View_Time Time of MODIS
observationuint8 hrs 0-240 255 0.1 0
3.3 Local Attributes
The local attributes for SDS, LST_1KM is similar to those in Table 5.
3.4 Global Attributes
Three ECS global attributes and 12 product-specific global attributes are stored as metadata. The ECS global attributes, CoreMetadata.0, ArchiveMetadata.0 and StructMetadata.0 are stored as very long character strings in PVL format.
CoreMetadata.0 contains information about the product during production and is used to populate theEOSDIS data base for user support. A listing of objects along with sample values is given in Table 4.
Table 9. Listing of objects in the global attribute CoreMetadata.0 in the
MxD21A1D/MxD21A1N products.
21

Object Name Sample Value Comment ReprocessingPlanned "further update is anticipated" Expect that products will
be reprocessed one or more times.
ReprocessingActual "reprocessed" LocalGranuleID " MxD21A1D.A2003001.h06v14.006.2016229184116.hdf" DayNightFlag "Day" Day , Night or Both.ProductionDateTime "2006-07-27T23:10:07.000Z" LocalVersionID “6.0.3” Version of algorithm
delivered from the SCF.
ParameterName “MxD21A1”AutomaticQualityFlag "Passed" Result of automated
checks during the run of the algorithm that screen for significant amounts of anomalous data.
AutomaticQualityFlagExplanation “No automatic quality assessment is performed in thePGE.”
Explanation of result ofautomated QA checks made during execution.
ScienceQualityFlag "Not Investigated" Set by LST investigator after post-production investigation
SciencelQualityFlagExplanation "See http://landweb.nascom.nasa.gov/cgi-bin/QA_WWW/qaFlagPage.cgi?sat=terra&ver=C6 for the product Science Quality status."
Explanation of ScienceFlag
QAPercentInterpolatedData 0 0-100 QAPercentMissingData 0 0-100 QAPercentOutOfBoundsData 0 0-100 QAPercentCloudCover 60 0-100 ShortName "MxD21A1D" ESDT name of product VersionID 6 ECS Version InputPointer ["MODPT1KD.A2003001.h06v1
4.006.2016229184000.hdf", "MODMGGAD.A2003001.h06v14.006.2016229184008.hdf", "MxD21GD.A2003001.h06v14.006.2016229184037.hdf", "MOD03.A2003001.2005.006.2012260054944.hdf", "MOD03.A2003001.2140.006.2
Location of input files in the production system.
22

012260053401.hdf", " MOD03.A2003001.2145.006.2012260055003.hdf"]
ExclusionGRingFlag "N" Geographic bounds of swath coverage.
GRingPointLongitude [ -134.529204, -100.841011, -110.349156, -135.759611]
GRingPointLatitude [54.085346, 49.240036, 32.346612, 35.789540]
GRingPointSequenceNo [1,2,3,4] RangeBeginningDate "2000-04-04" Beginning and ending
times of the first and last scan line in the swath. RangeBeginningTime "19:15:00.000000"
RangeEndingDate "2000-04-04" RangeEndingTime "19:20:00.000000" PGEVersion "6.0.4" Version of production
generation executable.
AssociatedSensorShortName "MODIS" AssociatedPlatformShortName "Terra" AssociatedInstrumentShortName "MODIS" QAPercentGoodQuality 29 Summary quality
assurance statistic for data product. Range is from 0-100.
QAPercentOtherQuality 8 QAPercentNotProducedCloud 33 QAPercentNotProducedOther 29 HorizontalTileNumber 6VerticalTileNumber 14
TileID 51006014ProcessVersion 6.0.3identifier_product_doi 10.5067/MODIS/MxD21A1D.006identifier_product_doi_authority http://dx.doi.org
3.5 Quality Assurance
The bit flags defined for the quality assurance SDS QC are listed in Table 10.
Table 10. Bit flags defined in the QC SDS in the MxD21A1D/MxD21A1N product. (Note: Bit 0
is the least significant bit).
Bits Long Name Description
1&0 Mandatory QA flags 00 = Pixel produced, good quality, no further QA
23

info necessary
01 = Pixel produced but unreliable quality. Either one or more of the following conditions are met: emissivity in both bands 31 and 32 < 0.95, retrievalaffected by nearby cloud, low transmissivity due tohigh water vapor loading (<0.4), Recommend moredetailed analysis of other QC information
10 = Pixel not produced due to cloud
11 = Pixel not produced due to reasons other than cloud
3 & 2 Data quality flag 00 = Good data quality of L1B bands 29, 31, 32
01 = Missing pixel
10 = Fairly calibrated
11 = Poorly calibrated, TES processing skipped
5 & 4 Cloud Flag 00 = Cloud free
01 = Thin cirrus
10 = Pixel within 2 pixels of nearest cloud
11 = Cloudy pixels
7 & 6 Iterations 00 = Slow convergence
01 = Nominal
10 = Nominal
11 = Fast
9 & 8 Atmospheric Opacity 00 = >=3 (Warm, humid air; or cold land)
01 = 0.2 - 0.3 (Nominal value)
10 = 0.1 - 0.2 (Nominal value)
11 = <0.1 (Dry, or high altitude pixel)
11 & 10 MMD 00 = > 0.15 (Most silicate rocks)
01 = 0.1 - 0.15 (Rocks, sand, some soils)
10 = 0.03 - 0.1 (Mostly soils, mixed pixel)
11 = <0.03 (Vegetation, snow, water, ice)
13 & 12 Emissivity accuracy 00 = >0.02 (Poor performance)
01 = 0.015 - 0.02 (Marginal performance)
10 = 0.01 - 0.015 (Good performance)
11 = <0.01 (Excellent performance)
15 & 14 LST accuracy 00 = >2 K (Poor performance)
01 = 1.5 - 2 K (Marginal performance)
10 = 1 - 1.5 K (Good performance)
24

11 = <1 K (Excellent performance)
4 MxD21A2 Eight-day LST Product
An eight-day compositing period was chosen because double that period is the exact ground track repeat period of the Terra/Aqua platform. LST over eight days is the averaged LSTs of the MxD21A1product over eight days.
4.1 Algorithm Description
A simple average method is used in the current algorithm for the MxD21A2 product. The averaging is done for day and night separately for LST, QC, View angle and Viewing time, while for the Band 29, 31 and 32 emissivities the averaging is done over both day and night. The averaging process includes only daily values that are cloud free.
Figure 4. Example MYD21A2 8-day LST product for 2003001 produced by MODAPS using
Aqua data
4.2 Scientific Data Sets (SDS)
In the MxD21A2 product, the day and night daily MxD21A1 products are combined into single product but it has different SDS for LST, QC, View angle and View time for day and night respectively. The day and night specific SDS in MxD21A2 are listed below and summarized in Table 11.
LST_Day_1KM
25

QC_Day
View_Angle_Day
View_Time_Day
LST_Night_1KM
QC_Night
View_Angle_Night
View_Time_Night
Emis_29
Emis_31
Emis_32
Table 11. The SDSs in the MxD21A2 product.
SDS Long Name Data type
Units Valid Range
Fill Value
Scale Factor
Offset
LST_Day_1KM Day Land Surface Temperature
uint16 K 7500-65535
0 0.02 0.0
QC_Day Day Quality control uint8 n/a 0-255 n/a n/a n/aView_Angle_Day Day view angle uint8 deg 0-130 255 1 -65View_Time_Day Day time of
observationuint8 hrs 0-240 255 0.1 0
LST_Night_1KM Night Land Surface Temperature
uint16 K 7500-65535
0 0.02 0.0
QC_Night Night Quality control
uint8 n/a 0-255 n/a n/a n/a
View_Angle_Night
Night view angle uint8 deg 0-130 255 1 -65
View_Time_Night Night time of observation
uint8 hrs 0-240 255 0.1 0
Emis_29 Average Day/Night Band 29 emissivity
uint8 n/a 1-255 0 0.002 0.49
Emis_31 Average Day/Night Band 31 emissivity
uint8 n/a 1-255 0 0.002 0.49
Emis_32 Average Day/Night Band 32 emissivity
uint8 n/a 1-255 0 0.002 0.49
4.3 Local Attributes
Similar to MxD21A1.
26

4.4 Global Attributes
Similar to MxD21A1.
4.5 Quality Assurance
The bit flags defined for the quality assurance SDSs QC_Day and QC_Night are listed in Table 12.
Table 12. Bit flags defined in the QC_Day and QC_Night SDS in the MxD21A2 product. (Note:
Bit 0 is the least significant bit).
Bits Long Name Description
1&0 Mandatory QA flags 00 = Pixel produced, good quality, no further QA info necessary
01 = Pixel produced but unreliable quality. Recommend more detailed analysis of other QC information
10 = Pixel not produced due to cloud
11 = Pixel not produced due to reasons other than cloud
3 & 2 Data quality flag 00 = Good data quality of L1B bands 29, 31, 32
01 = Missing pixel
10 = Fairly calibrated
11 = Poorly calibrated, TES processing skipped
5 & 4 Emissivity accuracy 00 = >0.02 (Poor performance)
01 = 0.015 - 0.02 (Marginal performance)
10 = 0.01 - 0.015 (Good performance)
11 = <0.01 (Excellent performance)
7 & 6 LST accuracy 00 = >2 K (Poor performance)
01 = 1.5 - 2 K (Marginal performance)
10 = 1 - 1.5 K (Good performance)
11 = <1 K (Excellent performance)
27

5 Publications and References
Gillespie, A., Rokugawa, S., Matsunaga, T., Cothern, J.S., Hook, S., & Kahle, A.B. (1998). A temperature and emissivity separation algorithm for Advanced Spaceborne Thermal Emission and Reflection Radiometer (ASTER) images. Ieee Transactions on Geoscience and Remote Sensing, 36, 1113-1126
Hulley, G., Hook, S., & Hughes, C. (2012a). MODIS MOD21 Land Surface Temperature and Emissivity Algorithm Theoretical Basis Document. In: Jet Propulsion Laboratory, California Institute of Technology, JPL Publication 12-17, August, 2012
Hulley, G.C., & Hook, S.J. (2011). Generating Consistent Land Surface Temperature and Emissivity Products Between ASTER and MODIS Data for Earth Science Research. Ieee Transactions on Geoscience and Remote Sensing, 49, 1304-1315
Hulley, G.C., Hook, S.J., Abbott, E., Malakar, N., Islam, T., & Abrams, M. (2015). The ASTER Global Emissivity Dataset (ASTER GED): Mapping Earth's emissivity at 100 meter spatial scale.Geophysical Research Letters, 42, 7966-7976
Hulley, G.C., Hughes, C.G., & Hook, S.J. (2012b). Quantifying uncertainties in land surface temperature and emissivity retrievals from ASTER and MODIS thermal infrared data. Journal ofGeophysical Research-Atmospheres, 117
Islam, T., Hulley, G.C., Malakar, N.K., Radocinski, R.G., Guillevic, P.C., & Hook, S.J. (2017). A Physics-Based Algorithm for the Simultaneous Retrieval of Land Surface Temperature and Emissivity From VIIRS Thermal Infrared Data. Ieee Transactions on Geoscience and Remote Sensing, 55, 563-576
Malakar, N., & Hulley, G.C. (2016). A water vapor scaling model for improved land surface temperature and emissivity separation of MODIS thermal infrared data. Remote Sensing of Environment, 182, 252-264
Matricardi, M. (2008). The generation of RTTOV regression coefficients for IASI and AIRS using a new profile training set and a new line-by-line database. In: ECMWF Research Dept. Tech. Memo.
Rienecker, M.M., Suarez, M.J., Gelaro, R., Todling, R., Bacmeister, J., Liu, E., Bosilovich, M.G.,Schubert, S.D., Takacs, L., Kim, G.K., Bloom, S., Chen, J.Y., Collins, D., Conaty, A., Da Silva, A., Gu, W., Joiner, J., Koster, R.D., Lucchesi, R., Molod, A., Owens, T., Pawson, S., Pegion, P., Redder, C.R., Reichle, R., Robertson, F.R., Ruddick, A.G., Sienkiewicz, M., & Woollen, J. (2011). MERRA: NASA's Modern-Era Retrospective Analysis for Research and Applications. Journal of Climate, 24, 3624-3648
Saunders, R., Matricardi, M., & Brunel, P. (1999). An improved fast radiative transfer model for assimilation of satellite radiance observations. Quarterly Journal of the Royal Meteorological Society, 125, 1407-1425
Tonooka, H. (2005). Accurate atmospheric correction of ASTER thermal infrared imagery using the WVS method. Ieee Transactions on Geoscience and Remote Sensing, 43, 2778-2792
28

29