high reliability principles and verifications in solid … · high reliability principles and...
TRANSCRIPT

High Reliability Principles and Verifications in Solid Tantalum Capacitors.
End-User’s Manufacturing Processes
William Winkel, Edward Rich,
Northrop Grumman Corporation
7323 Aviation Blvd, Baltimore, MD 21240-2001
(410)-765-1000
Abstract
This paper is companion to Y. Freeman’s and P. Lessner’s paper [1] introducing a new Flawless Technology
with Simulated Breakdown Screening, (F-TECH) for manufacturing MnO2 style Tantalum (Ta) capacitors.
This paper focuses on the impact that the end-user’s manufacturing processes have on reliability of Solid Ta
capacitors. It demonstrates that depending on the end-user’s techniques and conditions, improvements in
the capacitors quality can diminish significantly by unintended damage to the Ta capacitor dielectric during
end-user’s manufacturing processes. Among the other factors affecting non-hermetic solid Ta capacitors,
exposure to moisture prior to surface mounting can have a strong negative effect on the capacitor reliability.
Test results will be provided to measure failure rate differences between conventional and F-TECH solid Ta
capacitors. The results provide evidence that the F-TECH process along with the end-user process
improvements provide the lowest component failure rates and the highest reliability.
1. Summary of industry reporting
Evidence of catastrophic failure of MnO2 style Ta capacitor as a result of exposure to humidity is well
documented [2,3,4]. In 1998, Devaney and Dicken [2] reported the results of testing following exposure to
85% RH at 35°C. They observed 20% failure with no subsequent bake out and a decrease to 4-5% failure
with bake out at 100°C for 3 days. They concluded that the effects of humidity are not unique to one
manufacturer, can be lot independent or dependent on the location of the user’s facility.
In 2003, R.W. Dobson [3] observed 2.9% fallout of surface mount MnO2 style capacitors used in switching
power supply applications. These parts were stored in conditions of uncontrolled humidity prior to
mounting as well as uncontrolled internal manufacturing process related to aqueous wash and solder
reflow. The supplier retested recently manufactured capacitors and found no failures following surge A and
B and a 100 hour screen performed at 85°C and rated voltage. A subset of these same parts was subjected
to 85°C/85%RH/100hours with 7.5% failure. Independent testing of parts that were initially stored in an
uncontrolled environment with and without unbiased 85°C/85%RH/100hours showed a range of 1.7% to 5%
failure with an undefined bake out. Continued testing of this sample under conditions of biased
85°C/85%RH/100hours showed failures 3 to 4 time higher than unbiased test results. The conclusions from
this work indicate that failure mechanism is not lot or supplier specific, exposure to biased humidity is more
severe than un-biased, the failure mechanism affects the entire population of parts and exhibits a wear-out
characteristic given continued or repeated exposure to moisture.
CARTS International 2014 March 31-April 3, 2014
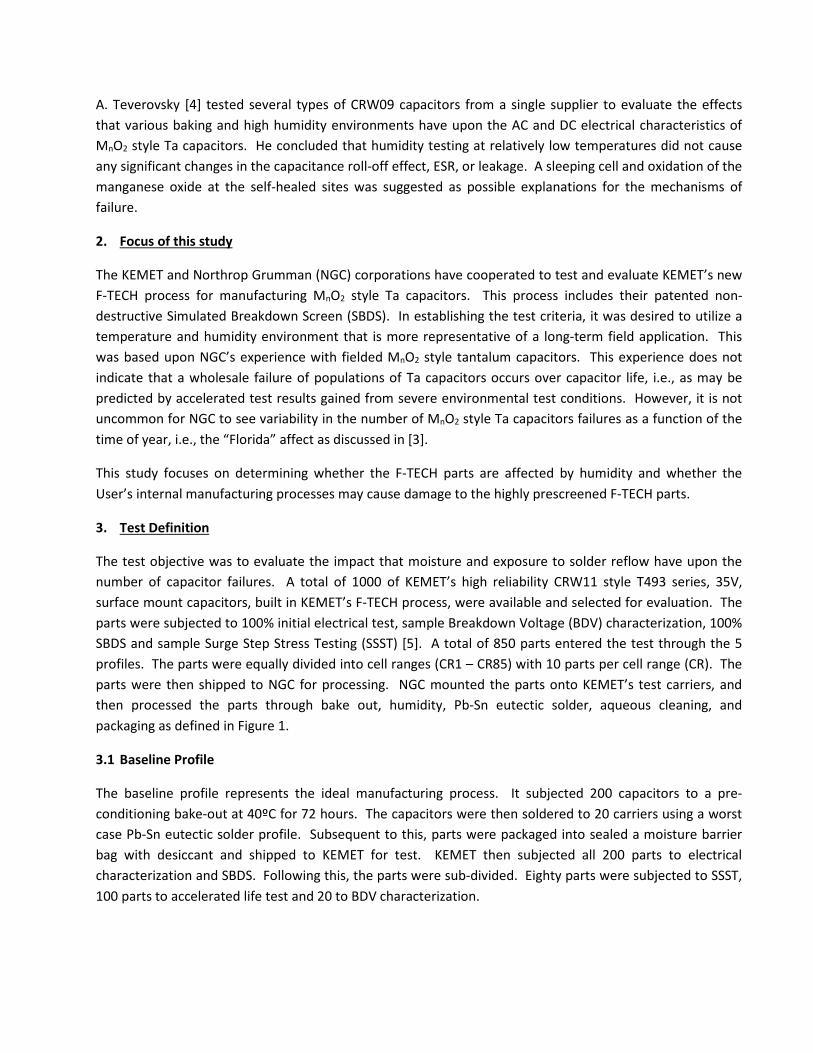
A. Teverovsky [4] tested several types of CRW09 capacitors from a single supplier to evaluate the effects
that various baking and high humidity environments have upon the AC and DC electrical characteristics of
MnO2 style Ta capacitors. He concluded that humidity testing at relatively low temperatures did not cause
any significant changes in the capacitance roll-off effect, ESR, or leakage. A sleeping cell and oxidation of the
manganese oxide at the self-healed sites was suggested as possible explanations for the mechanisms of
failure.
2. Focus of this study
The KEMET and Northrop Grumman (NGC) corporations have cooperated to test and evaluate KEMET’s new
F-TECH process for manufacturing MnO2 style Ta capacitors. This process includes their patented non-
destructive Simulated Breakdown Screen (SBDS). In establishing the test criteria, it was desired to utilize a
temperature and humidity environment that is more representative of a long-term field application. This
was based upon NGC’s experience with fielded MnO2 style tantalum capacitors. This experience does not
indicate that a wholesale failure of populations of Ta capacitors occurs over capacitor life, i.e., as may be
predicted by accelerated test results gained from severe environmental test conditions. However, it is not
uncommon for NGC to see variability in the number of MnO2 style Ta capacitors failures as a function of the
time of year, i.e., the “Florida” affect as discussed in [3].
This study focuses on determining whether the F-TECH parts are affected by humidity and whether the
User’s internal manufacturing processes may cause damage to the highly prescreened F-TECH parts.
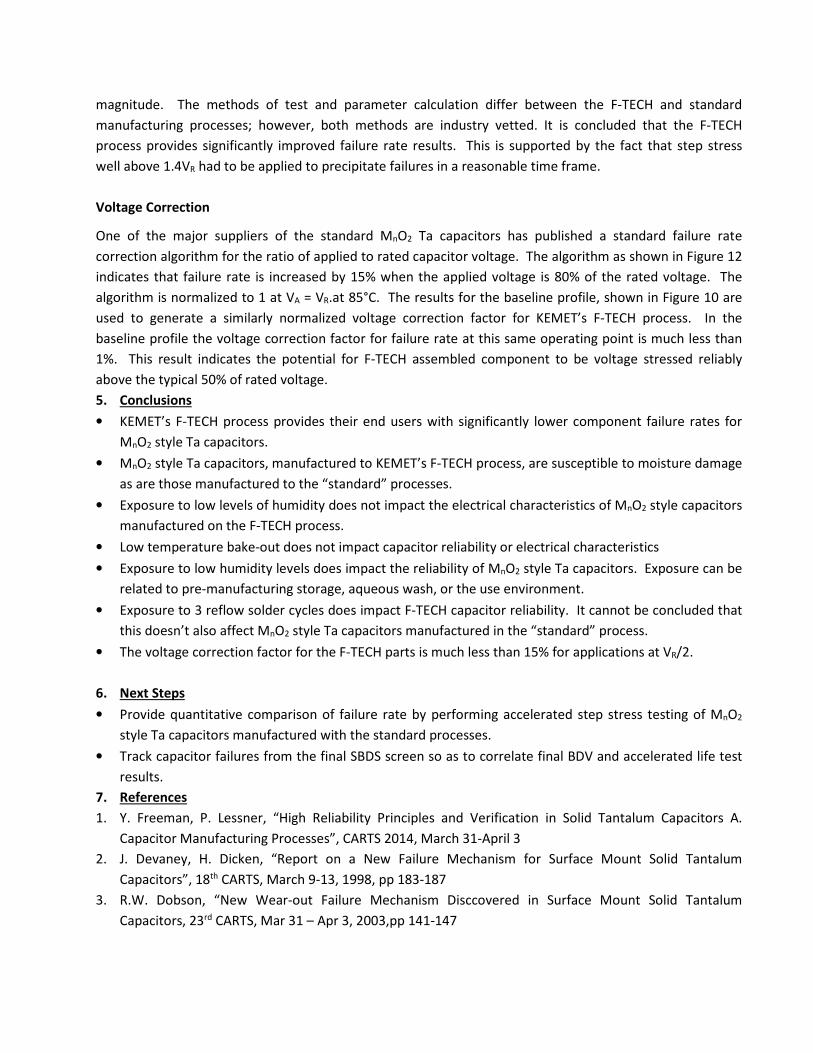
3. Test Definition
The test objective was to evaluate the impact that moisture and exposure to solder reflow have upon the
number of capacitor failures. A total of 1000 of KEMET’s high reliability CRW11 style T493 series, 35V,
surface mount capacitors, built in KEMET’s F-TECH process, were available and selected for evaluation. The
parts were subjected to 100% initial electrical test, sample Breakdown Voltage (BDV) characterization, 100%
SBDS and sample Surge Step Stress Testing (SSST) [5]. A total of 850 parts entered the test through the 5
profiles. The parts were equally divided into cell ranges (CR1 – CR85) with 10 parts per cell range (CR). The
parts were then shipped to NGC for processing. NGC mounted the parts onto KEMET’s test carriers, and
then processed the parts through bake out, humidity, Pb-Sn eutectic solder, aqueous cleaning, and
packaging as defined in Figure 1.
3.1 Baseline Profile
The baseline profile represents the ideal manufacturing process. It subjected 200 capacitors to a pre-
conditioning bake-out at 40ºC for 72 hours. The capacitors were then soldered to 20 carriers using a worst
case Pb-Sn eutectic solder profile. Subsequent to this, parts were packaged into sealed a moisture barrier
bag with desiccant and shipped to KEMET for test. KEMET then subjected all 200 parts to electrical
characterization and SBDS. Following this, the parts were sub-divided. Eighty parts were subjected to SSST,
100 parts to accelerated life test and 20 to BDV characterization.
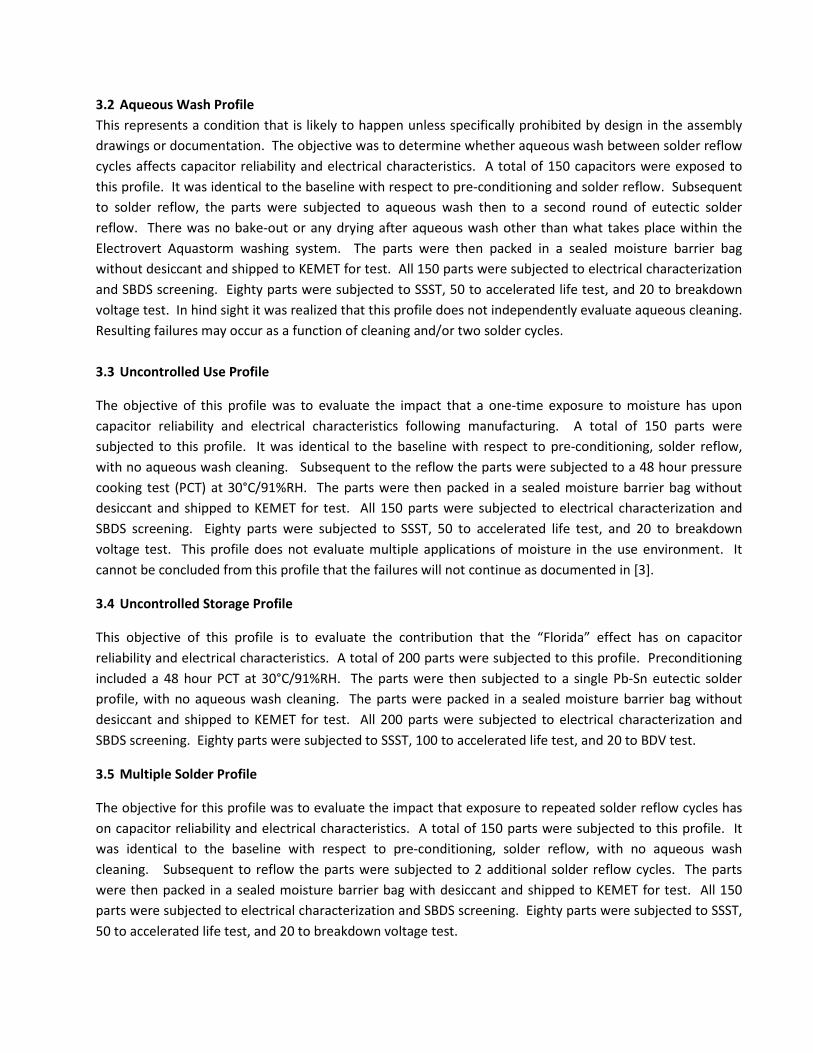
3.2 Aqueous Wash Profile
This represents a condition that is likely to happen unless specifically prohibited by design in the assembly
drawings or documentation. The objective was to determine whether aqueous wash between solder reflow
cycles affects capacitor reliability and electrical characteristics. A total of 150 capacitors were exposed to
this profile. It was identical to the baseline with respect to pre-conditioning and solder reflow. Subsequent
to solder reflow, the parts were subjected to aqueous wash then to a second round of eutectic solder
reflow. There was no bake-out or any drying after aqueous wash other than what takes place within the
Electrovert Aquastorm washing system. The parts were then packed in a sealed moisture barrier bag
without desiccant and shipped to KEMET for test. All 150 parts were subjected to electrical characterization
and SBDS screening. Eighty parts were subjected to SSST, 50 to accelerated life test, and 20 to breakdown
voltage test. In hind sight it was realized that this profile does not independently evaluate aqueous cleaning.
Resulting failures may occur as a function of cleaning and/or two solder cycles.
3.3 Uncontrolled Use Profile
The objective of this profile was to evaluate the impact that a one-time exposure to moisture has upon
capacitor reliability and electrical characteristics following manufacturing. A total of 150 parts were
subjected to this profile. It was identical to the baseline with respect to pre-conditioning, solder reflow,
with no aqueous wash cleaning. Subsequent to the reflow the parts were subjected to a 48 hour pressure
cooking test (PCT) at 30°C/91%RH. The parts were then packed in a sealed moisture barrier bag without
desiccant and shipped to KEMET for test. All 150 parts were subjected to electrical characterization and
SBDS screening. Eighty parts were subjected to SSST, 50 to accelerated life test, and 20 to breakdown
voltage test. This profile does not evaluate multiple applications of moisture in the use environment. It
cannot be concluded from this profile that the failures will not continue as documented in [3].
3.4 Uncontrolled Storage Profile
This objective of this profile is to evaluate the contribution that the “Florida” effect has on capacitor
reliability and electrical characteristics. A total of 200 parts were subjected to this profile. Preconditioning
included a 48 hour PCT at 30°C/91%RH. The parts were then subjected to a single Pb-Sn eutectic solder
profile, with no aqueous wash cleaning. The parts were packed in a sealed moisture barrier bag without
desiccant and shipped to KEMET for test. All 200 parts were subjected to electrical characterization and
SBDS screening. Eighty parts were subjected to SSST, 100 to accelerated life test, and 20 to BDV test.
3.5 Multiple Solder Profile
The objective for this profile was to evaluate the impact that exposure to repeated solder reflow cycles has
on capacitor reliability and electrical characteristics. A total of 150 parts were subjected to this profile. It
was identical to the baseline with respect to pre-conditioning, solder reflow, with no aqueous wash
cleaning. Subsequent to reflow the parts were subjected to 2 additional solder reflow cycles. The parts
were then packed in a sealed moisture barrier bag with desiccant and shipped to KEMET for test. All 150
parts were subjected to electrical characterization and SBDS screening. Eighty parts were subjected to SSST,
50 to accelerated life test, and 20 to breakdown voltage test.
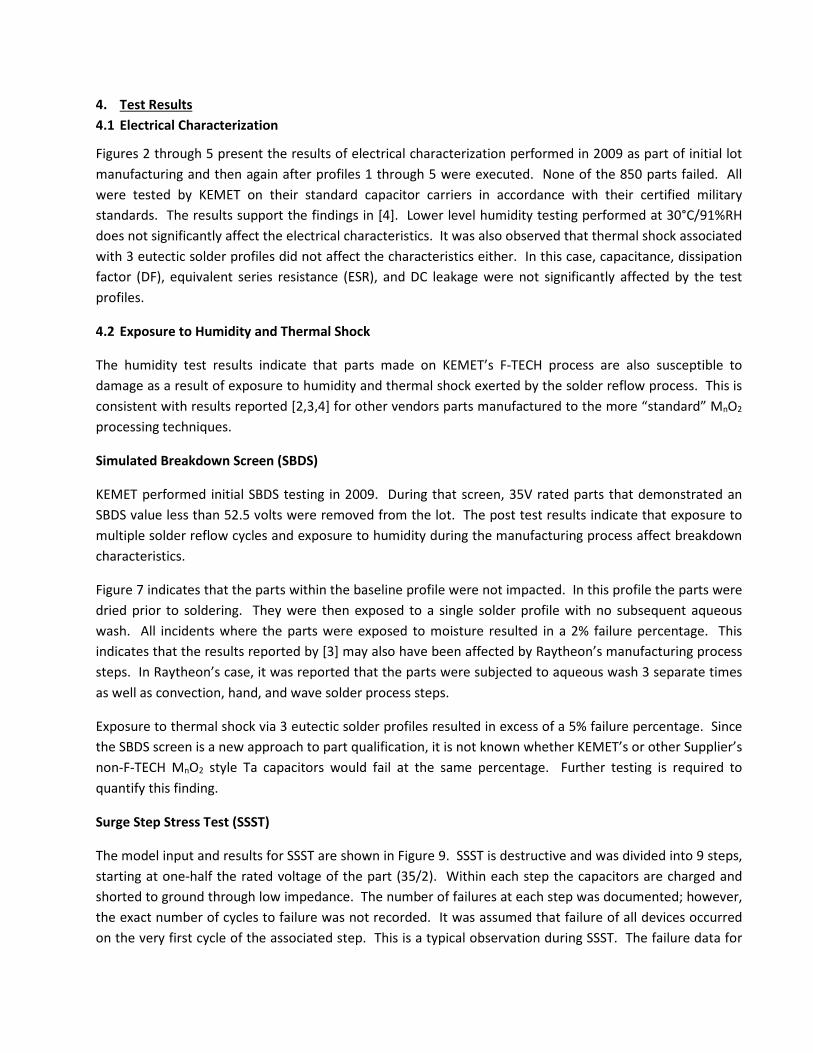
4. Test Results
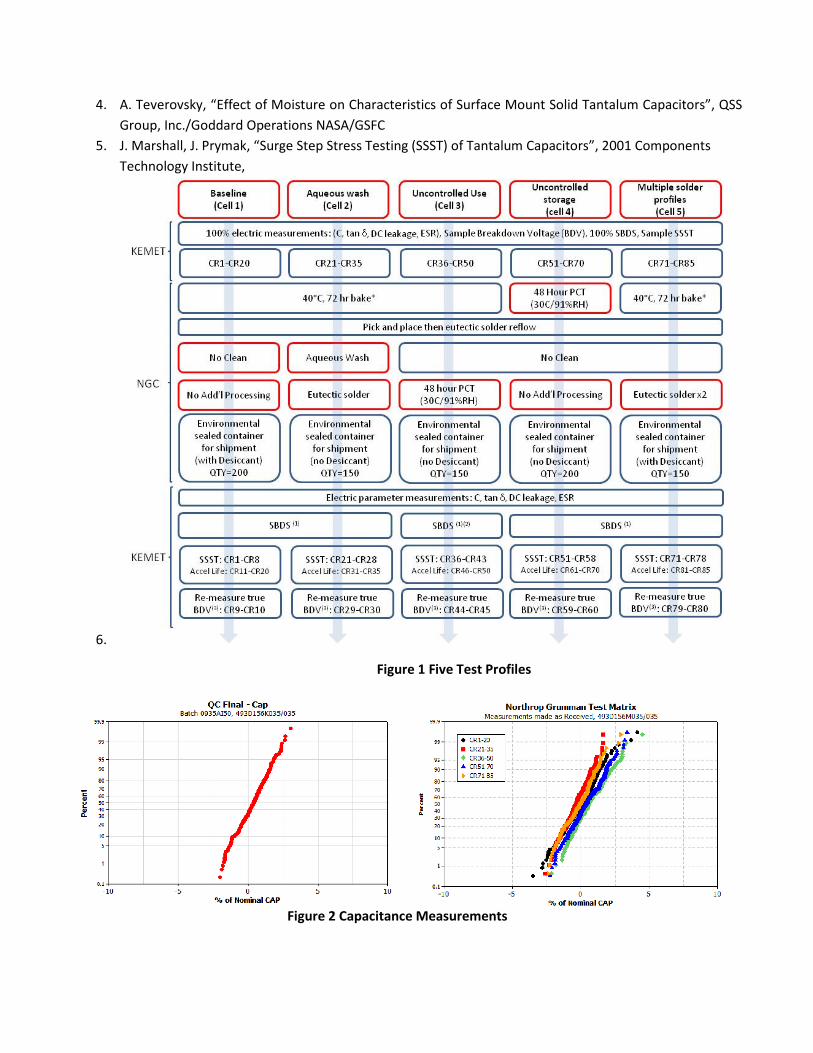
4.1 Electrical Characterization
Figures 2 through 5 present the results of electrical characterization performed in 2009 as part of initial lot
manufacturing and then again after profiles 1 through 5 were executed. None of the 850 parts failed. All
were tested by KEMET on their standard capacitor carriers in accordance with their certified military
standards. The results support the findings in [4]. Lower level humidity testing performed at 30°C/91%RH
does not significantly affect the electrical characteristics. It was also observed that thermal shock associated
with 3 eutectic solder profiles did not affect the characteristics either. In this case, capacitance, dissipation
factor (DF), equivalent series resistance (ESR), and DC leakage were not significantly affected by the test
profiles.
4.2 Exposure to Humidity and Thermal Shock
The humidity test results indicate that parts made on KEMET’s F-TECH process are also susceptible to
damage as a result of exposure to humidity and thermal shock exerted by the solder reflow process. This is
consistent with results reported [2,3,4] for other vendors parts manufactured to the more “standard” MnO2
processing techniques.
Simulated Breakdown Screen (SBDS)
KEMET performed initial SBDS testing in 2009. During that screen, 35V rated parts that demonstrated an
SBDS value less than 52.5 volts were removed from the lot. The post test results indicate that exposure to
multiple solder reflow cycles and exposure to humidity during the manufacturing process affect breakdown
characteristics.
Figure 7 indicates that the parts within the baseline profile were not impacted. In this profile the parts were
dried prior to soldering. They were then exposed to a single solder profile with no subsequent aqueous
wash. All incidents where the parts were exposed to moisture resulted in a 2% failure percentage. This
indicates that the results reported by [3] may also have been affected by Raytheon’s manufacturing process
steps. In Raytheon’s case, it was reported that the parts were subjected to aqueous wash 3 separate times
as well as convection, hand, and wave solder process steps.
Exposure to thermal shock via 3 eutectic solder profiles resulted in excess of a 5% failure percentage. Since
the SBDS screen is a new approach to part qualification, it is not known whether KEMET’s or other Supplier’s
non-F-TECH MnO2 style Ta capacitors would fail at the same percentage. Further testing is required to
quantify this finding.
Surge Step Stress Test (SSST)
The model input and results for SSST are shown in Figure 9. SSST is destructive and was divided into 9 steps,
starting at one-half the rated voltage of the part (35/2). Within each step the capacitors are charged and
shorted to ground through low impedance. The number of failures at each step was documented; however,
the exact number of cycles to failure was not recorded. It was assumed that failure of all devices occurred
on the very first cycle of the associated step. This is a typical observation during SSST. The failure data for
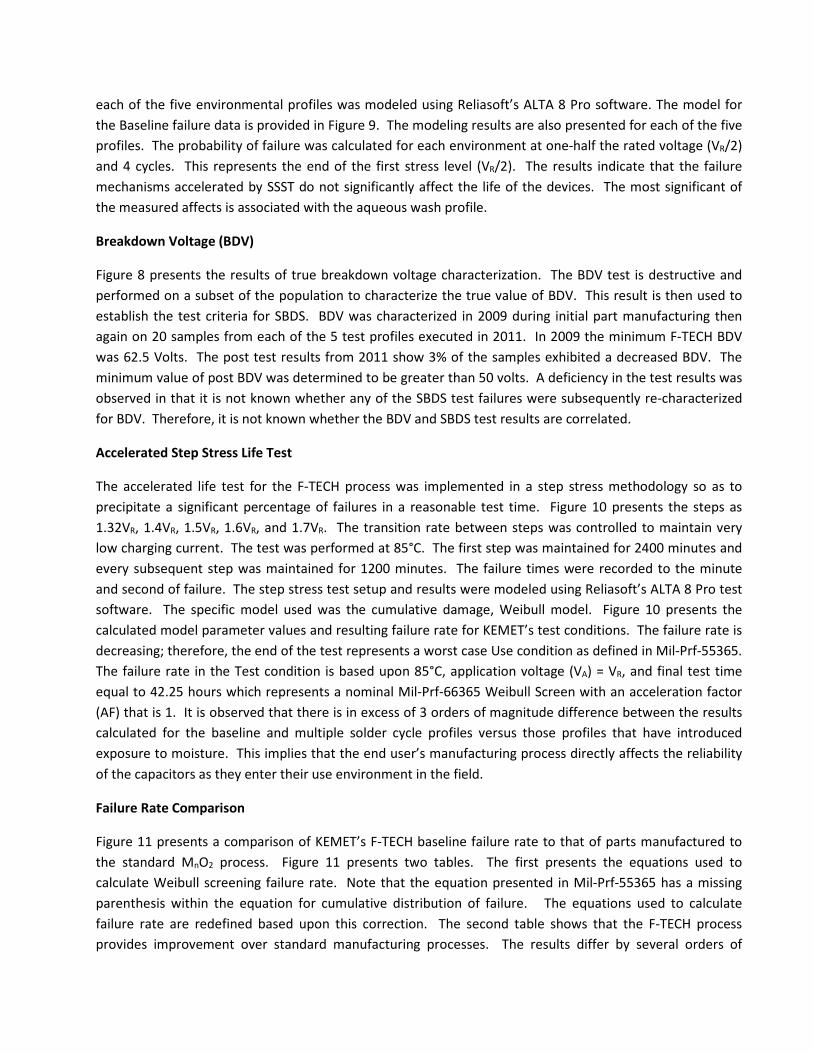
each of the five environmental profiles was modeled using Reliasoft’s ALTA 8 Pro software. The model for
the Baseline failure data is provided in Figure 9. The modeling results are also presented for each of the five
profiles. The probability of failure was calculated for each environment at one-half the rated voltage (VR/2)
and 4 cycles. This represents the end of the first stress level (VR/2). The results indicate that the failure
mechanisms accelerated by SSST do not significantly affect the life of the devices. The most significant of
the measured affects is associated with the aqueous wash profile.
Breakdown Voltage (BDV)
Figure 8 presents the results of true breakdown voltage characterization. The BDV test is destructive and
performed on a subset of the population to characterize the true value of BDV. This result is then used to
establish the test criteria for SBDS. BDV was characterized in 2009 during initial part manufacturing then
again on 20 samples from each of the 5 test profiles executed in 2011. In 2009 the minimum F-TECH BDV
was 62.5 Volts. The post test results from 2011 show 3% of the samples exhibited a decreased BDV. The
minimum value of post BDV was determined to be greater than 50 volts. A deficiency in the test results was
observed in that it is not known whether any of the SBDS test failures were subsequently re-characterized
for BDV. Therefore, it is not known whether the BDV and SBDS test results are correlated.
Accelerated Step Stress Life Test
The accelerated life test for the F-TECH process was implemented in a step stress methodology so as to
precipitate a significant percentage of failures in a reasonable test time. Figure 10 presents the steps as
1.32VR, 1.4VR, 1.5VR, 1.6VR, and 1.7VR. The transition rate between steps was controlled to maintain very
low charging current. The test was performed at 85°C. The first step was maintained for 2400 minutes and
every subsequent step was maintained for 1200 minutes. The failure times were recorded to the minute
and second of failure. The step stress test setup and results were modeled using Reliasoft’s ALTA 8 Pro test
software. The specific model used was the cumulative damage, Weibull model. Figure 10 presents the
calculated model parameter values and resulting failure rate for KEMET’s test conditions. The failure rate is
decreasing; therefore, the end of the test represents a worst case Use condition as defined in Mil-Prf-55365.
The failure rate in the Test condition is based upon 85°C, application voltage (VA) = VR, and final test time
equal to 42.25 hours which represents a nominal Mil-Prf-66365 Weibull Screen with an acceleration factor
(AF) that is 1. It is observed that there is in excess of 3 orders of magnitude difference between the results
calculated for the baseline and multiple solder cycle profiles versus those profiles that have introduced
exposure to moisture. This implies that the end user’s manufacturing process directly affects the reliability
of the capacitors as they enter their use environment in the field.
Failure Rate Comparison
Figure 11 presents a comparison of KEMET’s F-TECH baseline failure rate to that of parts manufactured to
the standard MnO2 process. Figure 11 presents two tables. The first presents the equations used to
calculate Weibull screening failure rate. Note that the equation presented in Mil-Prf-55365 has a missing
parenthesis within the equation for cumulative distribution of failure. The equations used to calculate
failure rate are redefined based upon this correction. The second table shows that the F-TECH process
provides improvement over standard manufacturing processes. The results differ by several orders of
magnitude. The methods of test and parameter calculation differ between the F-TECH and standard
manufacturing processes; however, both methods are industry vetted. It is concluded that the F-TECH
process provides significantly improved failure rate results. This is supported by the fact that step stress
well above 1.4VR had to be applied to precipitate failures in a reasonable time frame.
Voltage Correction
One of the major suppliers of the standard MnO2 Ta capacitors has published a standard failure rate
correction algorithm for the ratio of applied to rated capacitor voltage. The algorithm as shown in Figure 12
indicates that failure rate is increased by 15% when the applied voltage is 80% of the rated voltage. The
algorithm is normalized to 1 at VA = VR.at 85°C. The results for the baseline profile, shown in Figure 10 are
used to generate a similarly normalized voltage correction factor for KEMET’s F-TECH process. In the
baseline profile the voltage correction factor for failure rate at this same operating point is much less than
1%. This result indicates the potential for F-TECH assembled component to be voltage stressed reliably
above the typical 50% of rated voltage.
5. Conclusions
• KEMET’s F-TECH process provides their end users with significantly lower component failure rates for
MnO2 style Ta capacitors.
• MnO2 style Ta capacitors, manufactured to KEMET’s F-TECH process, are susceptible to moisture damage
as are those manufactured to the “standard” processes.
• Exposure to low levels of humidity does not impact the electrical characteristics of MnO2 style capacitors
manufactured on the F-TECH process.
• Low temperature bake-out does not impact capacitor reliability or electrical characteristics
• Exposure to low humidity levels does impact the reliability of MnO2 style Ta capacitors. Exposure can be
related to pre-manufacturing storage, aqueous wash, or the use environment.
• Exposure to 3 reflow solder cycles does impact F-TECH capacitor reliability. It cannot be concluded that
this doesn’t also affect MnO2 style Ta capacitors manufactured in the “standard” process.
• The voltage correction factor for the F-TECH parts is much less than 15% for applications at VR/2.
6. Next Steps
• Provide quantitative comparison of failure rate by performing accelerated step stress testing of MnO2
style Ta capacitors manufactured with the standard processes.
• Track capacitor failures from the final SBDS screen so as to correlate final BDV and accelerated life test
results.
7. References
1. Y. Freeman, P. Lessner, “High Reliability Principles and Verification in Solid Tantalum Capacitors A.
Capacitor Manufacturing Processes”, CARTS 2014, March 31-April 3
2. J. Devaney, H. Dicken, “Report on a New Failure Mechanism for Surface Mount Solid Tantalum
Capacitors”, 18th CARTS, March 9-13, 1998, pp 183-187
3. R.W. Dobson, “New Wear-out Failure Mechanism Disccovered in Surface Mount Solid Tantalum
Capacitors, 23rd CARTS, Mar 31 – Apr 3, 2003,pp 141-147
4. A. Teverovsky, “Effect of Moisture on Characteristics of Surface Mount Solid Tantalum Capacitors”, QSS
Group, Inc./Goddard Operations NASA/GSFC
5. J. Marshall, J. Prymak, “Surge Step Stress Testing (SSST) of Tantalum Capacitors”, 2001 Components
Technology Institute,
6.
Figure 1 Five Test Profiles
Figure 2 Capacitance Measurements
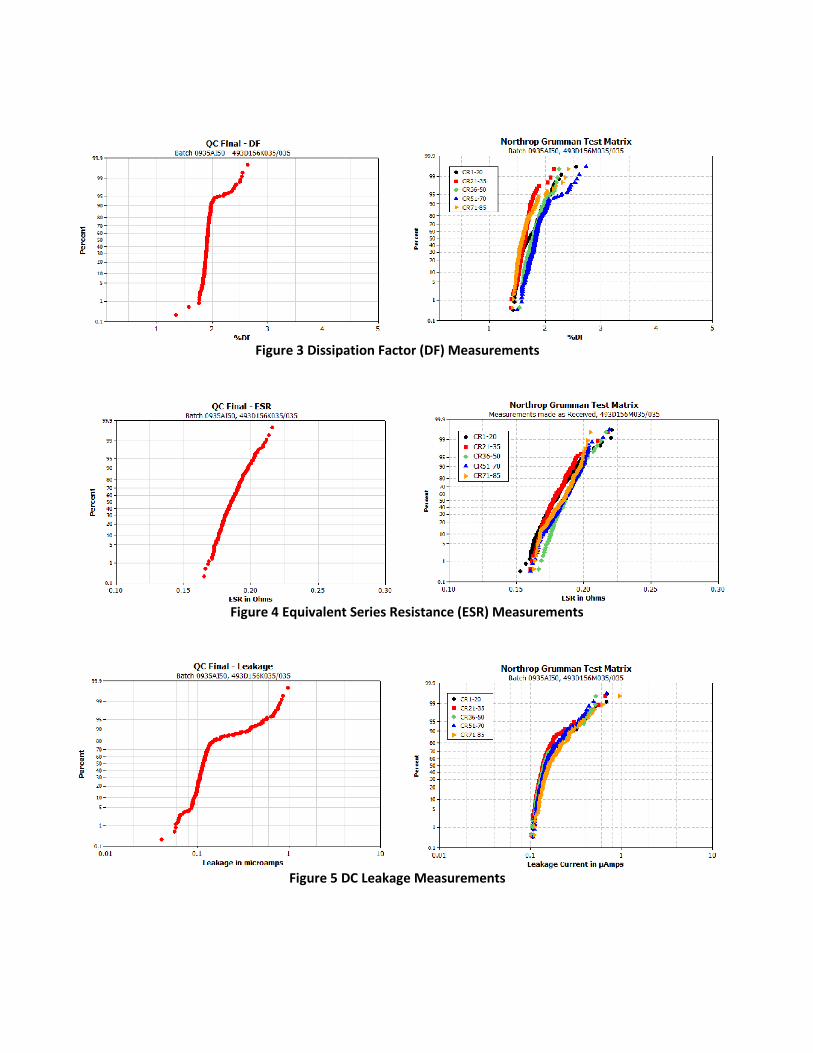
Figure 3 Dissipation Factor (DF) Measurements
Figure 4 Equivalent Series Resistance (ESR) Measurements
Figure 5 DC Leakage Measurements
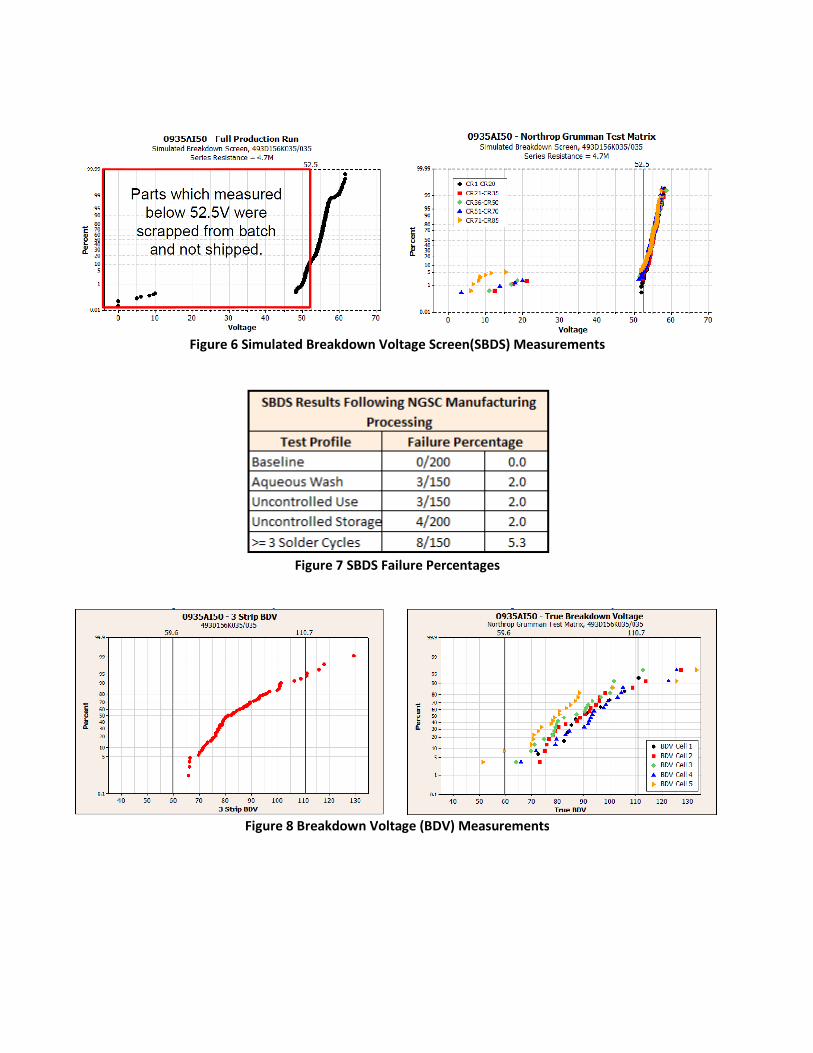
Figure 6 Simulated Breakdown Voltage Screen(SBDS) Measurements
Figure 7 SBDS Failure Percentages
Figure 8 Breakdown Voltage (BDV) Measurements
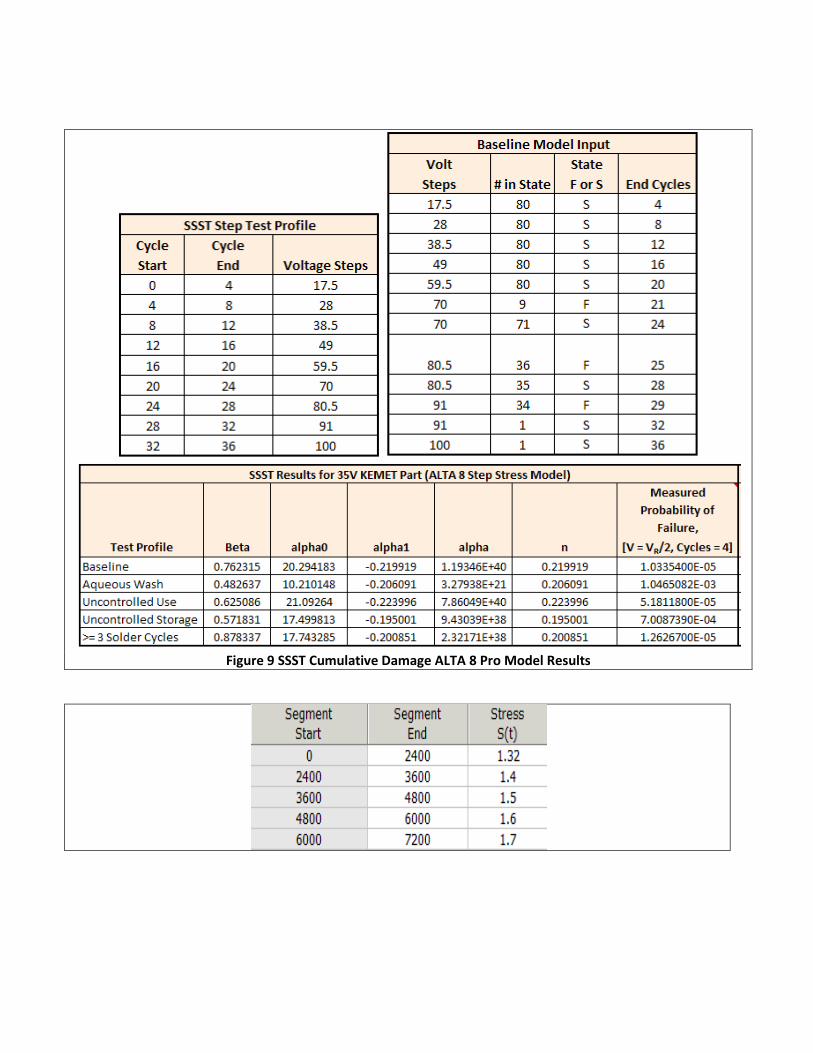
Figure 9 SSST Cumulative Damage ALTA 8 Pro Model Results
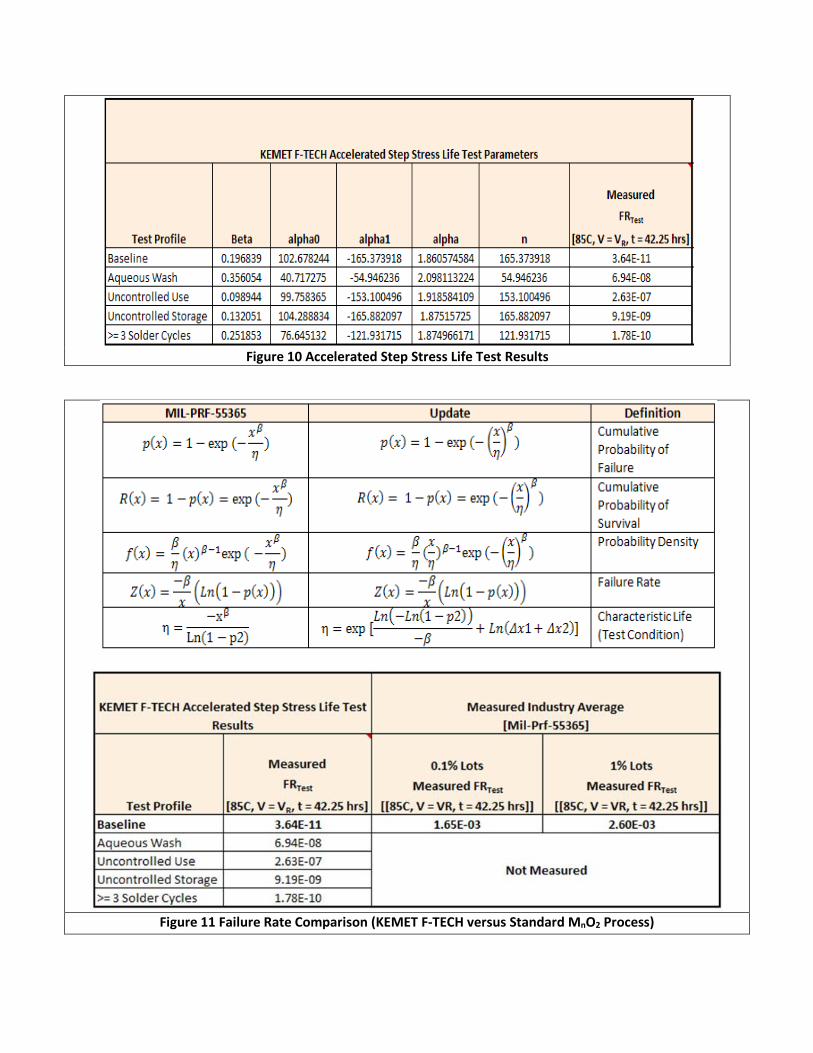
Figure 11 Failure Rate Comparison (KEMET F-TECH versus Standard MnO2 Process)
Figure 10 Accelerated Step Stress Life Test Results
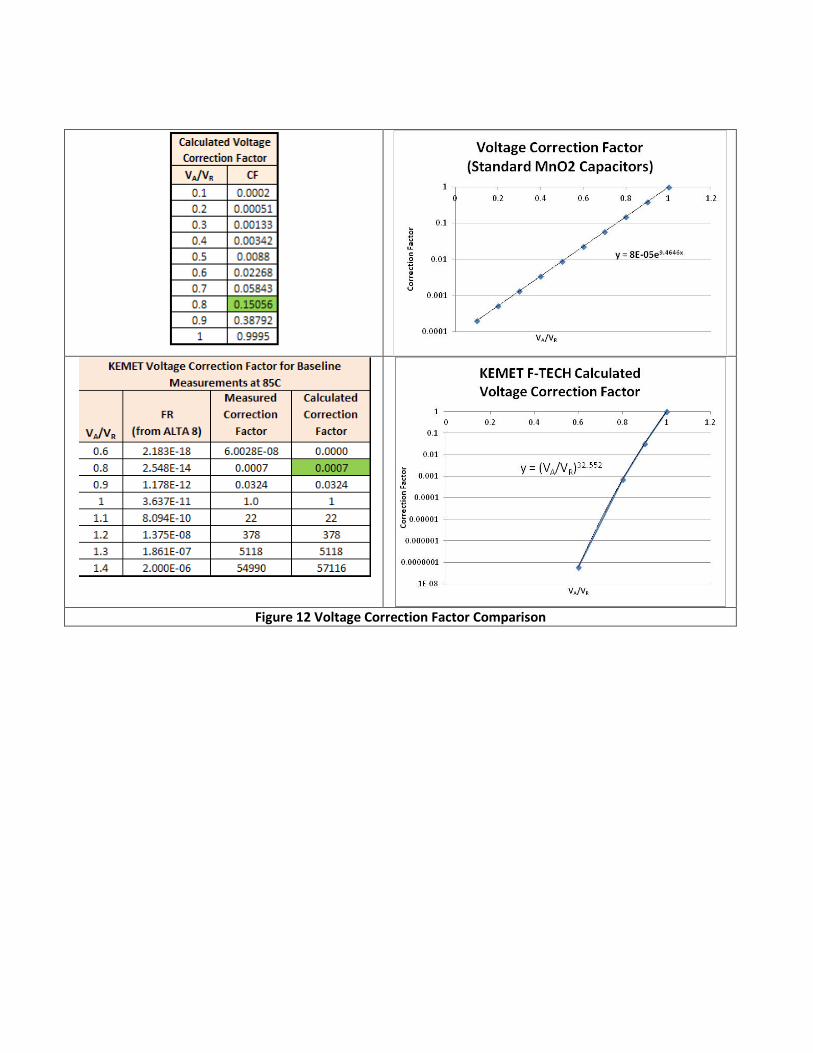
Figure 12 Voltage Correction Factor Comparison