reliability analysis for multiple-stage solid waste
TRANSCRIPT
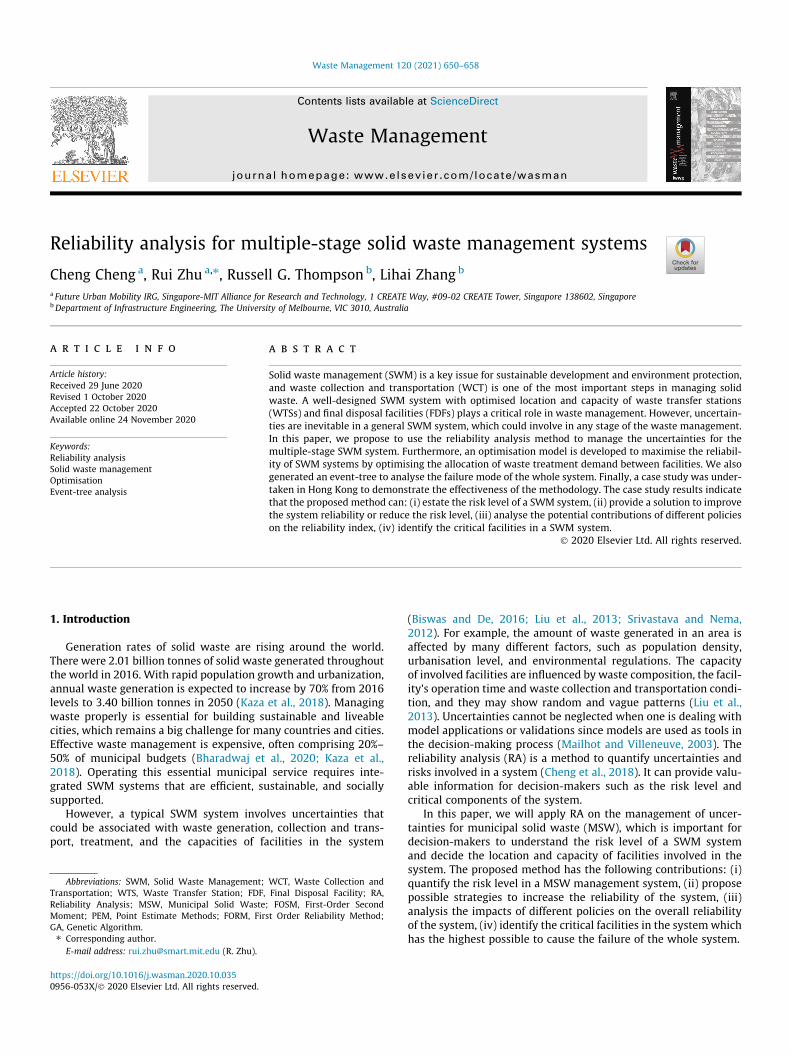
Waste Management 120 (2021) 650–658
Contents lists available at ScienceDirect
Waste Management
journal homepage: www.elsevier .com/locate /wasman
Reliability analysis for multiple-stage solid waste management systems
https://doi.org/10.1016/j.wasman.2020.10.0350956-053X/� 2020 Elsevier Ltd. All rights reserved.
Abbreviations: SWM, Solid Waste Management; WCT, Waste Collection andTransportation; WTS, Waste Transfer Station; FDF, Final Disposal Facility; RA,Reliability Analysis; MSW, Municipal Solid Waste; FOSM, First-Order SecondMoment; PEM, Point Estimate Methods; FORM, First Order Reliability Method;GA, Genetic Algorithm.⇑ Corresponding author.
E-mail address: [email protected] (R. Zhu).
Cheng Cheng a, Rui Zhu a,⇑, Russell G. Thompson b, Lihai Zhang b
a Future Urban Mobility IRG, Singapore-MIT Alliance for Research and Technology, 1 CREATE Way, #09-02 CREATE Tower, Singapore 138602, SingaporebDepartment of Infrastructure Engineering, The University of Melbourne, VIC 3010, Australia
a r t i c l e i n f o
Article history:Received 29 June 2020Revised 1 October 2020Accepted 22 October 2020Available online 24 November 2020
Keywords:Reliability analysisSolid waste managementOptimisationEvent-tree analysis
a b s t r a c t
Solid waste management (SWM) is a key issue for sustainable development and environment protection,and waste collection and transportation (WCT) is one of the most important steps in managing solidwaste. A well-designed SWM system with optimised location and capacity of waste transfer stations(WTSs) and final disposal facilities (FDFs) plays a critical role in waste management. However, uncertain-ties are inevitable in a general SWM system, which could involve in any stage of the waste management.In this paper, we propose to use the reliability analysis method to manage the uncertainties for themultiple-stage SWM system. Furthermore, an optimisation model is developed to maximise the reliabil-ity of SWM systems by optimising the allocation of waste treatment demand between facilities. We alsogenerated an event-tree to analyse the failure mode of the whole system. Finally, a case study was under-taken in Hong Kong to demonstrate the effectiveness of the methodology. The case study results indicatethat the proposed method can: (i) estate the risk level of a SWM system, (ii) provide a solution to improvethe system reliability or reduce the risk level, (iii) analyse the potential contributions of different policieson the reliability index, (iv) identify the critical facilities in a SWM system.
� 2020 Elsevier Ltd. All rights reserved.
1. Introduction
Generation rates of solid waste are rising around the world.There were 2.01 billion tonnes of solid waste generated throughoutthe world in 2016. With rapid population growth and urbanization,annual waste generation is expected to increase by 70% from 2016levels to 3.40 billion tonnes in 2050 (Kaza et al., 2018). Managingwaste properly is essential for building sustainable and liveablecities, which remains a big challenge for many countries and cities.Effective waste management is expensive, often comprising 20%–50% of municipal budgets (Bharadwaj et al., 2020; Kaza et al.,2018). Operating this essential municipal service requires inte-grated SWM systems that are efficient, sustainable, and sociallysupported.
However, a typical SWM system involves uncertainties thatcould be associated with waste generation, collection and trans-port, treatment, and the capacities of facilities in the system
(Biswas and De, 2016; Liu et al., 2013; Srivastava and Nema,2012). For example, the amount of waste generated in an area isaffected by many different factors, such as population density,urbanisation level, and environmental regulations. The capacityof involved facilities are influenced by waste composition, the facil-ity’s operation time and waste collection and transportation condi-tion, and they may show random and vague patterns (Liu et al.,2013). Uncertainties cannot be neglected when one is dealing withmodel applications or validations since models are used as tools inthe decision-making process (Mailhot and Villeneuve, 2003). Thereliability analysis (RA) is a method to quantify uncertainties andrisks involved in a system (Cheng et al., 2018). It can provide valu-able information for decision-makers such as the risk level andcritical components of the system.
In this paper, we will apply RA on the management of uncer-tainties for municipal solid waste (MSW), which is important fordecision-makers to understand the risk level of a SWM systemand decide the location and capacity of facilities involved in thesystem. The proposed method has the following contributions: (i)quantify the risk level in a MSW management system, (ii) proposepossible strategies to increase the reliability of the system, (iii)analysis the impacts of different policies on the overall reliabilityof the system, (iv) identify the critical facilities in the systemwhichhas the highest possible to cause the failure of the whole system.

C. Cheng, R. Zhu, R.G. Thompson et al. Waste Management 120 (2021) 650–658
The remainder of this paper is structured as follows. Section 2presents a literature review. Section 3 describes the methodologyof reliability analysis of solid waste management systems the opti-mization model for system reliability maximization. In Section 4,we conduct a case study in Hong Kong to demonstrate the method-ology. Then, Section 5 analyses the results of the case study andSection 6 provide the discussions. Finally, the conclusions, limita-tions of the proposed method, and the future research perspectivesare provided in Section 5.
2. Literature review
2.1. Modelling MSW management under uncertainties
Uncertainties are widely considered in optimisation models forSWM (Saif et al., 2017). In general, uncertainty problems in wastemanagement were addressed by using different inexact program-ming methods such as interval programming, minimax regret opti-misation, inexact semi-infinite programming, and fuzzyparametric programming (Singh, 2019). In interval programming,the uncertainties can be expressed as discrete values at certainintervals instead of probability distribution functions (Chenget al., 2003). Minimax regret optimization technique in which theproblem with uncertainty is reduced into a number of certainsub-problems. And these sub-problems are focused on a calcula-tion where the regret of not getting the goal is minimized(Averbakh, 2000). The inexact semi-infinite programming methodconsiders input parameters as the functions of time in given inter-vals to represent the uncertain feature of the inputs (Guo et al.,2008). In fuzzy parametric programming, interval numbers offuzzy membership functions are used to represent the input vari-ables (Cheng et al., 2017; Nie et al., 2007). All these methods pro-vide solutions for optimization problems involved in uncertainties.However, they don’t have the capability to quantify the uncertain-ties or help to reduce the risk caused by the uncertainties.
2.2. Reliability analysis
RA is a necessary part of quantitative risk and uncertainties(Portielje et al., 2000). It cannot be neglected when dealing withmodel applications or validations since models are used as toolsin the decision-making process (Mailhot and Villeneuve, 2003).In general, uncertainty is caused by the inherent randomness ofphysical processes that cannot be eliminated and should be anal-ysed (Bogárdi and Kundzewicz, 2002). The goal of RA is to identifythe uncertainty features of the system outputs, which act as a func-tion of uncertainties in both the system model itself and therelated stochastic variables. Thus, a formal and systematic frame-work for quantifying the uncertainty associated with the systemoutputs is provided (Mirakbari and Ganji, 2010). Additionally, thedecision-maker can observe the contribution of each stochasticvariable to the overall uncertainty of the system outputs (Ganjiand Jowkarshorijeh, 2012).
Traditionally, RA is used in structural projects regarding resis-tance and loading (Haldar and Mahadevan, 2000). However, ithas also been applied in other areas such as water quality mod-elling (Mailhot and Villeneuve, 2003), water distribution networks(Liu et al., 2015), the failure probability of rock slope (Zhou et al.,2017). The method has also been applied in the waste managementarea. (Cheng et al.) 2018 developed a model applying FORM in adisaster waste management system considering the uncertaintiesof disaster waste generation, and landfill capacity. The resultsshow that the model has the capability of maximising the reliabil-ity and minimising the total clean-up costs. Cheng et al. (2019)presented a framework to estimate the overall reliability of a
651
disaster waste management system considering the reliability ofeach route involved in the road network, which provides informa-tion to decision-makers regarding the priority of the routes in thesystem. Nevertheless, to the best of our knowledge, there is noresearch applied to the RA method in peace-time municipalSWM systems, usually involved with multiple stages of wastemanagement facilities such as waste transfer stations (WTSs) andfinal disposal facilities (FDFs).
2.3. Reliability analysis methods
Current RA methods have been classified into three categories,namely exact methods, first-order second moment (FOSM) meth-ods and point estimate methods (PEM) (Harr, 1987). Inexact meth-ods (for example, Monte Carlo Simulation), probabilitydistributions are used for comprehensive analysis (Adarsh andReddy, 2013). In FOSM methods, the functional relationshipbetween independent and dependent variables are simplified bya truncated Taylor series expansion. The inputs and outputs ofthese processes are expressed as expected values and standarddeviations (Madsen et al., 2006). In the cases where the limit statefunction is either a graph or a chart, or a finite element solution,PEMs are useful (Harr, 1987).
To summary, the objective of this paper is to apply the RAmethod in a multiple-stage solid waste management system toestimate the reliability of the system and the contribution ofuncertain variables involved in the system. Furthermore, we alsopropose an optimization model to improve the reliability of solidwaste collection systems by reallocating the distribution of wastedemand between facilities without decrease the waste generationor raise the waste management facilities’ capacity. Moreover, weconduct sensitivity analysis to understand the contributions of dif-ferent policies and event-tree analysis to identify critical facilitiesin the system.
3. Methodology
3.1. Problem description
Although SWM systems are different from one country toanother, the major components of the systems are similar. Thecommon task performed in all SWM systems is the collection ofwaste from residential areas to FDFs such as recovery plants, com-posting plants, landfill areas, and incinerators. When the FDFs arelocated far away from the waste generation area to protect theenvironment and maintain a reasonable service for the public, anefficient way of performing the waste collection activities is toemploy WTSs (Habibi et al., 2017; Kirca and Erkip, 1988). WTSsserve as a link between communities and FDFs with a designatedreceiving area where waste collection vehicles discharge theirloads. The waste is often compacted, then loaded into larger vehi-cles for long-haul shipment to an FDF (Christensen, 2010).
Normally, a SWM system with WTSs is a two-stage system. Inthe first stage, waste is collected from the waste generation sourcetoWTSs. In the second stage, waste is transport fromWTSs to FDFs.However, depending on the distance between waste generationsources and the FDFs, there can be several levels of transfer sta-tions, which can lead to a three or more stages system. For exam-ple, Chongqing city has implemented two-level waste transferstations, which leads to a three-stage waste collection system(GU, 2019). Recently, there is an increase in the number of WTSswithin municipal SWM systems, which will likely continue in thefuture (Washburn, 2012). For example, in China, two-stage orthree-stage waste collection systems has already been widelyapplied in many cities such as Beijing, Guangzhou, and Shenzhen
C. Cheng, R. Zhu, R.G. Thompson et al. Waste Management 120 (2021) 650–658
(Lu et al., 2015). Therefore, in this paper we will propose a generalmethod to apply RA for a multi-stage SWmanagement system con-sidered the uncertainties in the waste management demand andcapacity of facilities in the system.
3.2. Overall reliability of a general solid waste management system
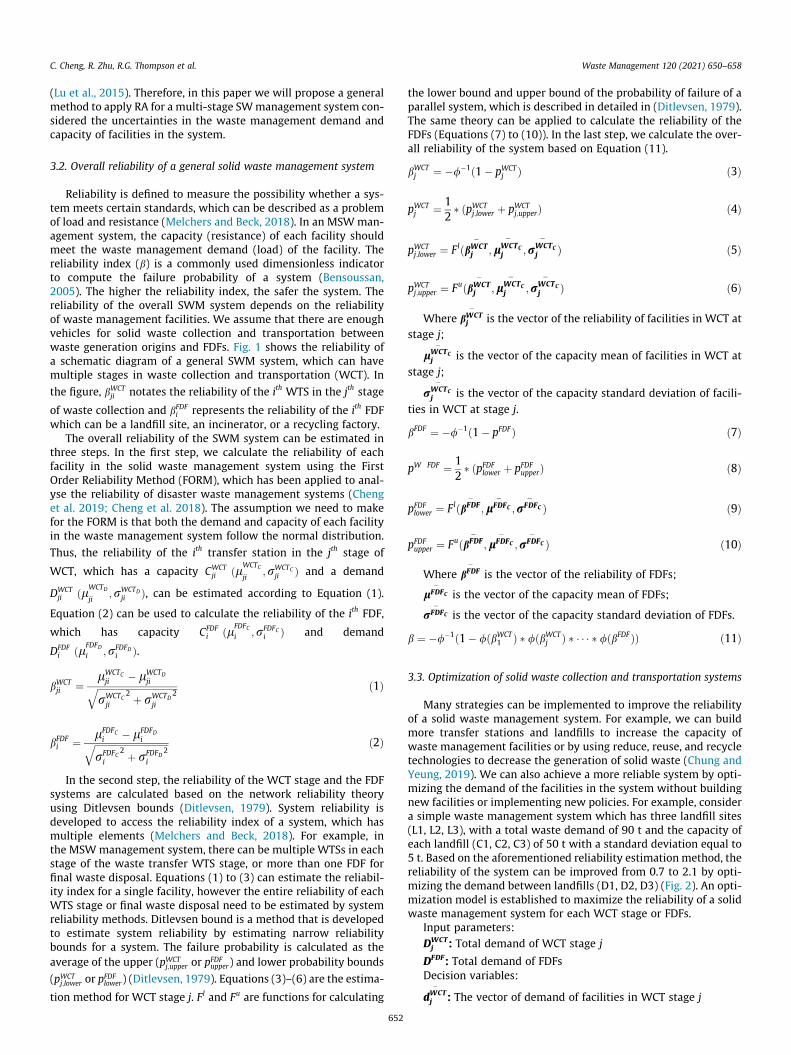
Reliability is defined to measure the possibility whether a sys-tem meets certain standards, which can be described as a problemof load and resistance (Melchers and Beck, 2018). In an MSW man-agement system, the capacity (resistance) of each facility shouldmeet the waste management demand (load) of the facility. Thereliability index (b) is a commonly used dimensionless indicatorto compute the failure probability of a system (Bensoussan,2005). The higher the reliability index, the safer the system. Thereliability of the overall SWM system depends on the reliabilityof waste management facilities. We assume that there are enoughvehicles for solid waste collection and transportation betweenwaste generation origins and FDFs. Fig. 1 shows the reliability ofa schematic diagram of a general SWM system, which can havemultiple stages in waste collection and transportation (WCT). In
the figure, bWCTji notates the reliability of the ith WTS in the jth stage
of waste collection and bFDFi represents the reliability of the ith FDF
which can be a landfill site, an incinerator, or a recycling factory.The overall reliability of the SWM system can be estimated in
three steps. In the first step, we calculate the reliability of eachfacility in the solid waste management system using the FirstOrder Reliability Method (FORM), which has been applied to anal-yse the reliability of disaster waste management systems (Chenget al. 2019; Cheng et al. 2018). The assumption we need to makefor the FORM is that both the demand and capacity of each facilityin the waste management system follow the normal distribution.
Thus, the reliability of the ith transfer station in the jth stage of
WCT, which has a capacity CWCTji ðlWCTC
ji;rWCTC
ji Þ and a demand
DWCTji ðlWCTD
ji;rWCTD
ji Þ, can be estimated according to Equation (1).
Equation (2) can be used to calculate the reliability of the ith FDF,
which has capacity CFDFi ðlFDFC
i ;rFDFCi Þ and demand
DFDFi ðlFDFD
i ;rFDFDi Þ.
bWCTji ¼ lWCTC
ji � lWCTDjiffiffiffiffiffiffiffiffiffiffiffiffiffiffiffiffiffiffiffiffiffiffiffiffiffiffiffiffiffiffiffiffiffiffiffi
rWCTCji
2 þ rWCTDji
2q ð1Þ
bFDFi ¼ lFDFC
i � lFDFDiffiffiffiffiffiffiffiffiffiffiffiffiffiffiffiffiffiffiffiffiffiffiffiffiffiffiffiffiffiffiffiffi
rFDFCi
2 þ rFDFDi
2q ð2Þ
In the second step, the reliability of the WCT stage and the FDFsystems are calculated based on the network reliability theoryusing Ditlevsen bounds (Ditlevsen, 1979). System reliability isdeveloped to access the reliability index of a system, which hasmultiple elements (Melchers and Beck, 2018). For example, inthe MSW management system, there can be multiple WTSs in eachstage of the waste transfer WTS stage, or more than one FDF forfinal waste disposal. Equations (1) to (3) can estimate the reliabil-ity index for a single facility, however the entire reliability of eachWTS stage or final waste disposal need to be estimated by systemreliability methods. Ditlevsen bound is a method that is developedto estimate system reliability by estimating narrow reliabilitybounds for a system. The failure probability is calculated as theaverage of the upper (pWCT
j;upper or pFDFupper) and lower probability bounds
(pWCTj;lower or p
FDFlower) (Ditlevsen, 1979). Equations (3)–(6) are the estima-
tion method for WCT stage j. Fl and Fu are functions for calculating
652
the lower bound and upper bound of the probability of failure of aparallel system, which is described in detailed in (Ditlevsen, 1979).The same theory can be applied to calculate the reliability of theFDFs (Equations (7) to (10)). In the last step, we calculate the over-all reliability of the system based on Equation (11).
bWCTj ¼ �/�1ð1� pWCT
j Þ ð3Þ
pWCTj ¼ 1
2� ðpWCT
j;lower þ pWCTj;upperÞ ð4Þ
pWCTj;lower ¼ FlðbWCT
j
�;lWCTC
j
�;rWCTC
j
�Þ ð5Þ
pWCTj;upper ¼ FuðbWCT
j
�;lWCTC
j
�;rWCTC
j
�Þ ð6Þ
Where bWCTj
�is the vector of the reliability of facilities in WCT at
stage j;
lWCTCj
�is the vector of the capacity mean of facilities in WCT at
stage j;
rWCTCj
�is the vector of the capacity standard deviation of facili-
ties in WCT at stage j.
bFDF ¼ �/�1ð1� pFDFÞ ð7Þ
pW FDF ¼ 12� ðpFDF
lower þ pFDFupperÞ ð8Þ
pFDFlower ¼ FlðbFDF
�;lFDFC
�;rFDFC
�Þ ð9Þ
pFDFupper ¼ FuðbFDF
�;lFDFC
�;rFDFC
�Þ ð10Þ
Where bFDF�
is the vector of the reliability of FDFs;
lFDFC�
is the vector of the capacity mean of FDFs;
rFDFC�
is the vector of the capacity standard deviation of FDFs.
b ¼ �/�1ð1� /ðbWCT1 Þ � /ðbWCT
j Þ � � � � � /ðbFDFÞÞ ð11Þ
3.3. Optimization of solid waste collection and transportation systems
Many strategies can be implemented to improve the reliabilityof a solid waste management system. For example, we can buildmore transfer stations and landfills to increase the capacity ofwaste management facilities or by using reduce, reuse, and recycletechnologies to decrease the generation of solid waste (Chung andYeung, 2019). We can also achieve a more reliable system by opti-mizing the demand of the facilities in the system without buildingnew facilities or implementing new policies. For example, considera simple waste management system which has three landfill sites(L1, L2, L3), with a total waste demand of 90 t and the capacity ofeach landfill (C1, C2, C3) of 50 t with a standard deviation equal to5 t. Based on the aforementioned reliability estimation method, thereliability of the system can be improved from 0.7 to 2.1 by opti-mizing the demand between landfills (D1, D2, D3) (Fig. 2). An opti-mization model is established to maximize the reliability of a solidwaste management system for each WCT stage or FDFs.
Input parameters:DWCT
j : Total demand of WCT stage j
DFDF : Total demand of FDFsDecision variables:
dWCTj
�: The vector of demand of facilities in WCT stage j
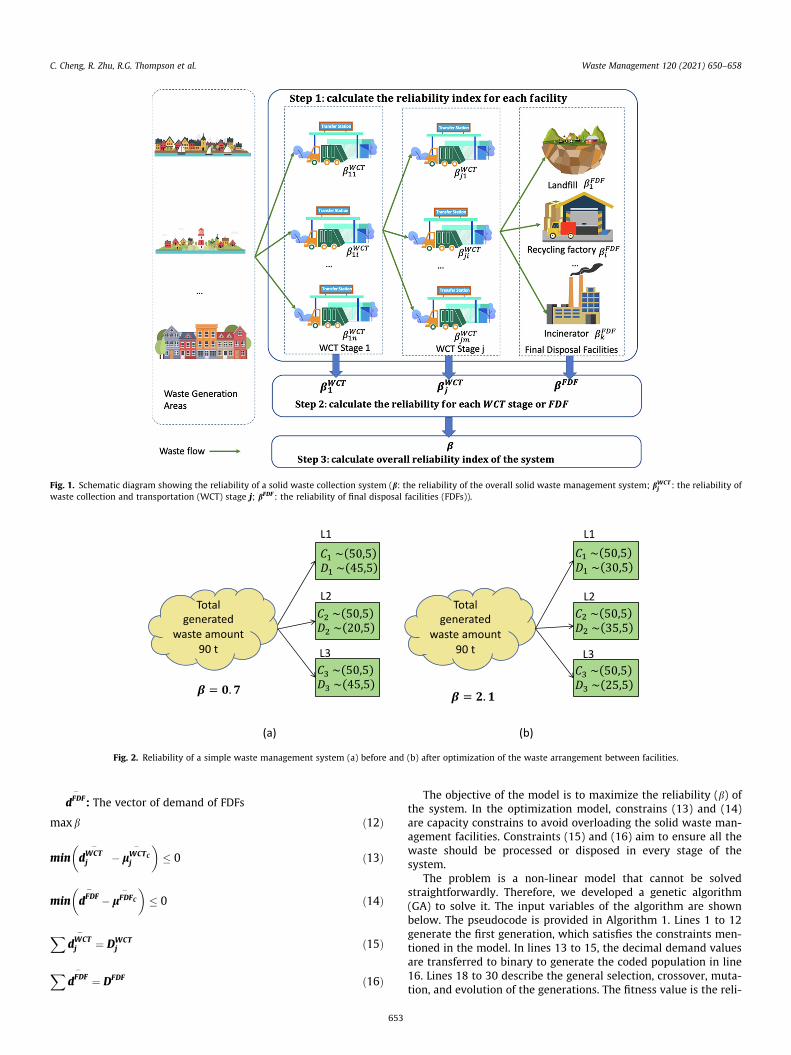
Fig. 1. Schematic diagram showing the reliability of a solid waste collection system (b: the reliability of the overall solid waste management system; bWCTj : the reliability of
waste collection and transportation (WCT) stage j; bFDF : the reliability of final disposal facilities (FDFs)).
(a) (b)
Fig. 2. Reliability of a simple waste management system (a) before and (b) after optimization of the waste arrangement between facilities.
C. Cheng, R. Zhu, R.G. Thompson et al. Waste Management 120 (2021) 650–658
dFDF�
: The vector of demand of FDFs
maxb ð12Þ
min dWCTj
��lWCTC
j
�� �� 0 ð13Þ
min dFDF�
�lFDFC�� �
� 0 ð14Þ
XdWCTj
�¼ DWCT
j ð15Þ
XdFDF
�¼ DFDF ð16Þ
653
The objective of the model is to maximize the reliability (b) ofthe system. In the optimization model, constrains (13) and (14)are capacity constrains to avoid overloading the solid waste man-agement facilities. Constraints (15) and (16) aim to ensure all thewaste should be processed or disposed in every stage of thesystem.
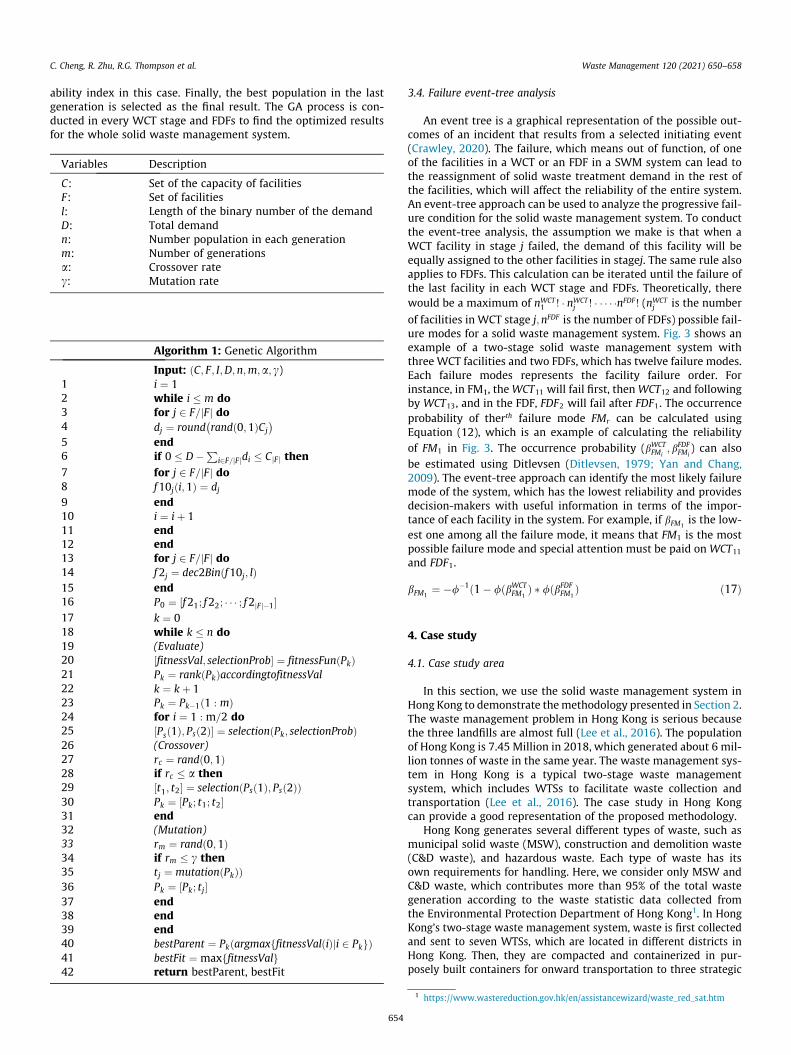
The problem is a non-linear model that cannot be solvedstraightforwardly. Therefore, we developed a genetic algorithm(GA) to solve it. The input variables of the algorithm are shownbelow. The pseudocode is provided in Algorithm 1. Lines 1 to 12generate the first generation, which satisfies the constraints men-tioned in the model. In lines 13 to 15, the decimal demand valuesare transferred to binary to generate the coded population in line16. Lines 18 to 30 describe the general selection, crossover, muta-tion, and evolution of the generations. The fitness value is the reli-
C. Cheng, R. Zhu, R.G. Thompson et al. Waste Management 120 (2021) 650–658
ability index in this case. Finally, the best population in the lastgeneration is selected as the final result. The GA process is con-ducted in every WCT stage and FDFs to find the optimized resultsfor the whole solid waste management system.
Variables
DescriptionC:
Set of the capacity of facilities F: Set of facilities l: Length of the binary number of the demand D: Total demand n: Number population in each generation m: Number of generations a: Crossover rate c: Mutation rateAlgorithm 1: Genetic Algorithm
Input: ðC; F; I;D;n;m;a; c)
1 i ¼ 1 2 while i � m do 3 for j 2 F=jFj do� � 4 dj ¼ round rand 0;1ð ÞCj5
end P 6 if 0 � D� i2F=jFjdi � CjFj then 7 for j 2 F=jFj do 8 f10jði;1Þ ¼ dj 9 end 10 i ¼ iþ 1 11 end 12 end 13 for j 2 F=jFj do 14 f2j ¼ dec2Binðf10j; lÞ 15 end 16 P0 ¼ ½f21; f22; � � � ; f2 Fj j�1� 17 k ¼ 0 18 while k � n do 19 (Evaluate) 20 fitnessVal; selectionProb½ � ¼ fitnessFunðPkÞ 21 Pk ¼ rank Pkð ÞaccordingtofitnessVal 22 k ¼ kþ 1 23 Pk ¼ Pk�1ð1 : mÞ 24 for i ¼ 1 : m=2 do 25 ½Ps 1ð Þ; Ps 2ð Þ� ¼ selectionðPk; selectionProbÞ 26 (Crossover) 27 rc ¼ randð0;1Þ 28 if rc � a then 29 ½t1; t2� ¼ selectionðPs 1ð Þ; Ps 2ð ÞÞ 30 Pk ¼ ½Pk; t1; t2� 31 end 32 (Mutation) 33 rm ¼ randð0;1Þ 34 if rm � c then 35 tj ¼ mutationðPkÞÞ 36 Pk ¼ ½Pk; tj� 37 end 38 end 39 end 40 bestParent ¼ Pkðargmax fitnessVal ið Þji 2 Pkf gÞ 41 bestFit ¼ maxffitnessValg 42 return bestParent, bestFit1 https://www.wastereduction.gov.hk/en/assistancewizard/waste_red_sat.htm
654
3.4. Failure event-tree analysis
An event tree is a graphical representation of the possible out-comes of an incident that results from a selected initiating event(Crawley, 2020). The failure, which means out of function, of oneof the facilities in a WCT or an FDF in a SWM system can lead tothe reassignment of solid waste treatment demand in the rest ofthe facilities, which will affect the reliability of the entire system.An event-tree approach can be used to analyze the progressive fail-ure condition for the solid waste management system. To conductthe event-tree analysis, the assumption we make is that when aWCT facility in stage j failed, the demand of this facility will beequally assigned to the other facilities in stagej. The same rule alsoapplies to FDFs. This calculation can be iterated until the failure ofthe last facility in each WCT stage and FDFs. Theoretically, therewould be a maximum of nWCT
1 ! � nWCTj ! � � � � �nFDF ! (nWCT
j is the number
of facilities in WCT stage j;nFDF is the number of FDFs) possible fail-ure modes for a solid waste management system. Fig. 3 shows anexample of a two-stage solid waste management system withthree WCT facilities and two FDFs, which has twelve failure modes.Each failure modes represents the facility failure order. Forinstance, in FM1, theWCT11 will fail first, thenWCT12 and followingby WCT13, and in the FDF, FDF2 will fail after FDF1. The occurrenceprobability of therth failure mode FMr can be calculated usingEquation (12), which is an example of calculating the reliabilityof FM1 in Fig. 3. The occurrence probability (bWCT
FMi; bFDF
FMi) can also
be estimated using Ditlevsen (Ditlevsen, 1979; Yan and Chang,2009). The event-tree approach can identify the most likely failuremode of the system, which has the lowest reliability and providesdecision-makers with useful information in terms of the impor-tance of each facility in the system. For example, if bFM1
is the low-est one among all the failure mode, it means that FM1 is the mostpossible failure mode and special attention must be paid on WCT11
and FDF1.
bFM1¼ �/�1ð1� /ðbWCT
FM1Þ � /ðbFDF
FM1Þ ð17Þ
4. Case study
4.1. Case study area
In this section, we use the solid waste management system inHong Kong to demonstrate themethodology presented in Section 2.The waste management problem in Hong Kong is serious becausethe three landfills are almost full (Lee et al., 2016). The populationof Hong Kong is 7.45 Million in 2018, which generated about 6 mil-lion tonnes of waste in the same year. The waste management sys-tem in Hong Kong is a typical two-stage waste managementsystem, which includes WTSs to facilitate waste collection andtransportation (Lee et al., 2016). The case study in Hong Kongcan provide a good representation of the proposed methodology.
Hong Kong generates several different types of waste, such asmunicipal solid waste (MSW), construction and demolition waste(C&D waste), and hazardous waste. Each type of waste has itsown requirements for handling. Here, we consider only MSW andC&D waste, which contributes more than 95% of the total wastegeneration according to the waste statistic data collected fromthe Environmental Protection Department of Hong Kong1. In HongKong’s two-stage waste management system, waste is first collectedand sent to seven WTSs, which are located in different districts inHong Kong. Then, they are compacted and containerized in pur-posely built containers for onward transportation to three strategic

Fig. 3. An example of the failure event-tree for a waste management system with three transfer stations and two final disposal facilities.
C. Cheng, R. Zhu, R.G. Thompson et al. Waste Management 120 (2021) 650–658
landfills. In this case, the sevenWTSs are WCT facilities mentioned inSection 2 and the strategic landfills are FDFs. Fig. 4 shows the loca-tion of the WTSs and landfills. In Hong Kong, waste is first collectedfrom the source generation area to WTSs (green diamonds in Fig. 4),then the waste is transported to landfills (orange triangles in Fig. 4)after compression.
4.2. Data collection
We collected waste collection and transportation data from theEnvironmental Protection Department of Hong Kong, whichprovides the average daily throughout (demand) and the capacity
Fig. 4. Location of Transfer stations and landfills in Hong Kong (IETS: Island EastTransfer Station, IWTS: Island West Transfer Station, STTS: Shatin Transfer Station,NLTS: North Lantau Transfer Station, OITF: Outlying Islands Transfer Facilities,WKTS: West Kowloon Transfer Station, NWNTTS: North West New TerritoriesTransfer Station, NENT: North East New Territories Landfill, SENT: South East NewTerritories Landfill, WENT: West New Territories Landfill).
655
of the 7 WTSs and the 3 landfills in Hong Kong from 2014 to2018. We also make a simple prediction of the demand from2019 to 2023 based on the average increase rates from 2014 to2018 for each WTS and landfill site without considering the poli-cies the government implemented or will implement to reducethe demand. The standard deviation of both the demand and thecapacity of each facility is calculated using the Monto Carlo simu-lation by assuming a 10% randomness in demand and 5% random-ness in the capacity of each facility involved in the waste collectionand the transportation system in Hong Kong. The uncertainty levelin demand and capacity can be obtained from the daily wastetreatment data, which is, unfortunately, not available to us. Thus,the proposed randomness level is derived from literature(Srivastava and Nema, 2012). Table 1 shows the summary of thedata used for the case study.
5. Results analysis
5.1. Reliability of solid waste collection and the transportation system
In this section, we calculated the reliability of WTSs, FDFs, andthe entire waste collection and transportation system in HongKong. Fig. 5 shows the reliability indexes from 2014 to 2023 forthe original scenario (base case) presented in Table 1 and theresults after optimizing the distribution of solid waste collectionand transportation using the method proposed in Section 2.3.Fig. 5 presents that the curve of the original reliability index hasa slight increase from 2014 to 2015, followed by a continuousdecrease till 2020 and the trend continues in the future, whichleads to a negative infinite reliability index in the three years.
The results indicate that if the Hong Kong government does notimplement any measures to reduce the demand or increase thecapacity of the solid waste management system, the system willdefinitely out of function from 2020. To avoid the failure of the sys-
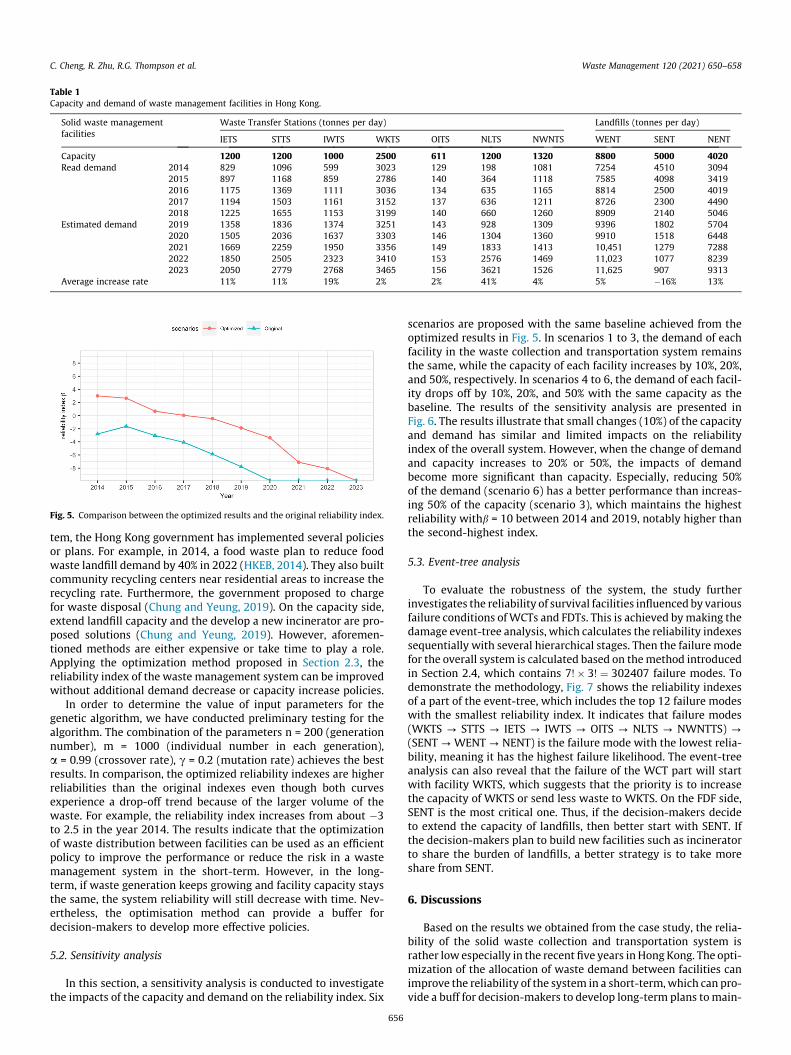
Table 1Capacity and demand of waste management facilities in Hong Kong.
Solid waste managementfacilities
Waste Transfer Stations (tonnes per day) Landfills (tonnes per day)
IETS STTS IWTS WKTS OITS NLTS NWNTS WENT SENT NENT
Capacity 1200 1200 1000 2500 611 1200 1320 8800 5000 4020Read demand 2014 829 1096 599 3023 129 198 1081 7254 4510 3094
2015 897 1168 859 2786 140 364 1118 7585 4098 34192016 1175 1369 1111 3036 134 635 1165 8814 2500 40192017 1194 1503 1161 3152 137 636 1211 8726 2300 44902018 1225 1655 1153 3199 140 660 1260 8909 2140 5046
Estimated demand 2019 1358 1836 1374 3251 143 928 1309 9396 1802 57042020 1505 2036 1637 3303 146 1304 1360 9910 1518 64482021 1669 2259 1950 3356 149 1833 1413 10,451 1279 72882022 1850 2505 2323 3410 153 2576 1469 11,023 1077 82392023 2050 2779 2768 3465 156 3621 1526 11,625 907 9313
Average increase rate 11% 11% 19% 2% 2% 41% 4% 5% �16% 13%
Fig. 5. Comparison between the optimized results and the original reliability index.
C. Cheng, R. Zhu, R.G. Thompson et al. Waste Management 120 (2021) 650–658
tem, the Hong Kong government has implemented several policiesor plans. For example, in 2014, a food waste plan to reduce foodwaste landfill demand by 40% in 2022 (HKEB, 2014). They also builtcommunity recycling centers near residential areas to increase therecycling rate. Furthermore, the government proposed to chargefor waste disposal (Chung and Yeung, 2019). On the capacity side,extend landfill capacity and the develop a new incinerator are pro-posed solutions (Chung and Yeung, 2019). However, aforemen-tioned methods are either expensive or take time to play a role.Applying the optimization method proposed in Section 2.3, thereliability index of the waste management system can be improvedwithout additional demand decrease or capacity increase policies.
In order to determine the value of input parameters for thegenetic algorithm, we have conducted preliminary testing for thealgorithm. The combination of the parameters n = 200 (generationnumber), m = 1000 (individual number in each generation),a = 0.99 (crossover rate), c = 0.2 (mutation rate) achieves the bestresults. In comparison, the optimized reliability indexes are higherreliabilities than the original indexes even though both curvesexperience a drop-off trend because of the larger volume of thewaste. For example, the reliability index increases from about �3to 2.5 in the year 2014. The results indicate that the optimizationof waste distribution between facilities can be used as an efficientpolicy to improve the performance or reduce the risk in a wastemanagement system in the short-term. However, in the long-term, if waste generation keeps growing and facility capacity staysthe same, the system reliability will still decrease with time. Nev-ertheless, the optimisation method can provide a buffer fordecision-makers to develop more effective policies.
5.2. Sensitivity analysis
In this section, a sensitivity analysis is conducted to investigatethe impacts of the capacity and demand on the reliability index. Six
656
scenarios are proposed with the same baseline achieved from theoptimized results in Fig. 5. In scenarios 1 to 3, the demand of eachfacility in the waste collection and transportation system remainsthe same, while the capacity of each facility increases by 10%, 20%,and 50%, respectively. In scenarios 4 to 6, the demand of each facil-ity drops off by 10%, 20%, and 50% with the same capacity as thebaseline. The results of the sensitivity analysis are presented inFig. 6. The results illustrate that small changes (10%) of the capacityand demand has similar and limited impacts on the reliabilityindex of the overall system. However, when the change of demandand capacity increases to 20% or 50%, the impacts of demandbecome more significant than capacity. Especially, reducing 50%of the demand (scenario 6) has a better performance than increas-ing 50% of the capacity (scenario 3), which maintains the highestreliability withb = 10 between 2014 and 2019, notably higher thanthe second-highest index.
5.3. Event-tree analysis
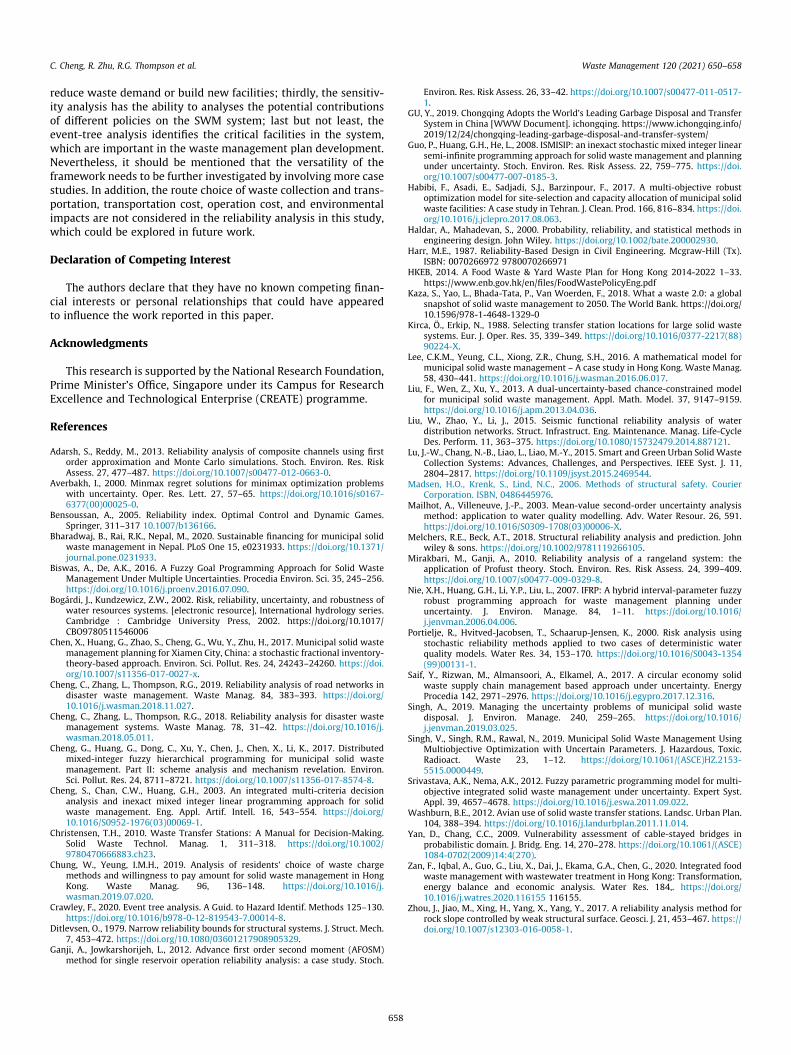
To evaluate the robustness of the system, the study furtherinvestigates the reliability of survival facilities influenced by variousfailure conditions ofWCTs and FDTs. This is achieved bymaking thedamage event-tree analysis, which calculates the reliability indexessequentially with several hierarchical stages. Then the failure modefor the overall system is calculated based on themethod introducedin Section 2.4, which contains 7!� 3! ¼ 302407 failure modes. Todemonstrate the methodology, Fig. 7 shows the reliability indexesof a part of the event-tree, which includes the top 12 failure modeswith the smallest reliability index. It indicates that failure modes(WKTS ? STTS ? IETS ? IWTS ? OITS ? NLTS ? NWNTTS) ?(SENT ? WENT ? NENT) is the failure mode with the lowest relia-bility, meaning it has the highest failure likelihood. The event-treeanalysis can also reveal that the failure of the WCT part will startwith facility WKTS, which suggests that the priority is to increasethe capacity of WKTS or send less waste to WKTS. On the FDF side,SENT is the most critical one. Thus, if the decision-makers decideto extend the capacity of landfills, then better start with SENT. Ifthe decision-makers plan to build new facilities such as incineratorto share the burden of landfills, a better strategy is to take moreshare from SENT.
6. Discussions
Based on the results we obtained from the case study, the relia-bility of the solid waste collection and transportation system israther low especially in the recent five years in Hong Kong. The opti-mization of the allocation of waste demand between facilities canimprove the reliability of the system in a short-term,which can pro-vide a buff for decision-makers to develop long-term plans tomain-
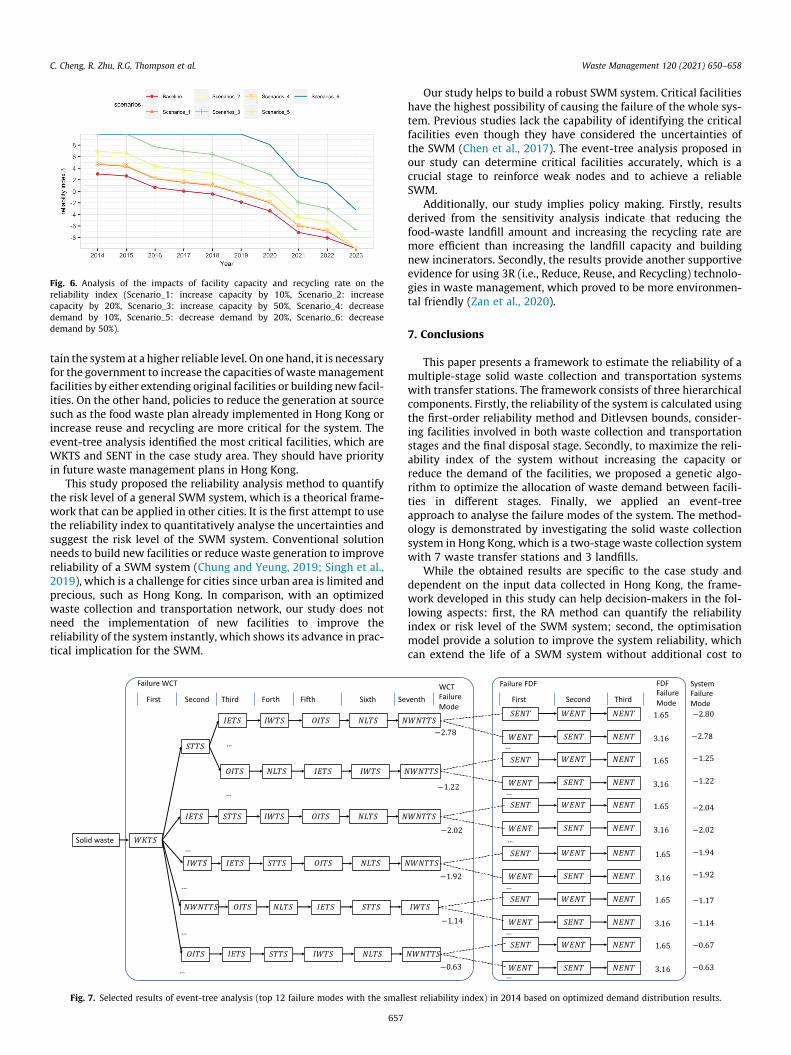
Fig. 6. Analysis of the impacts of facility capacity and recycling rate on thereliability index (Scenario_1: increase capacity by 10%, Scenario_2: increasecapacity by 20%, Scenario_3: increase capacity by 50%, Scenario_4: decreasedemand by 10%, Scenario_5: decrease demand by 20%, Scenario_6: decreasedemand by 50%).
C. Cheng, R. Zhu, R.G. Thompson et al. Waste Management 120 (2021) 650–658
tain the systemat a higher reliable level. On one hand, it is necessaryfor the government to increase the capacities of wastemanagementfacilities by either extending original facilities or building new facil-ities. On the other hand, policies to reduce the generation at sourcesuch as the food waste plan already implemented in Hong Kong orincrease reuse and recycling are more critical for the system. Theevent-tree analysis identified the most critical facilities, which areWKTS and SENT in the case study area. They should have priorityin future waste management plans in Hong Kong.
This study proposed the reliability analysis method to quantifythe risk level of a general SWM system, which is a theorical frame-work that can be applied in other cities. It is the first attempt to usethe reliability index to quantitatively analyse the uncertainties andsuggest the risk level of the SWM system. Conventional solutionneeds to build new facilities or reduce waste generation to improvereliability of a SWM system (Chung and Yeung, 2019; Singh et al.,2019), which is a challenge for cities since urban area is limited andprecious, such as Hong Kong. In comparison, with an optimizedwaste collection and transportation network, our study does notneed the implementation of new facilities to improve thereliability of the system instantly, which shows its advance in prac-tical implication for the SWM.
Fig. 7. Selected results of event-tree analysis (top 12 failure modes with the small
657
Our study helps to build a robust SWM system. Critical facilitieshave the highest possibility of causing the failure of the whole sys-tem. Previous studies lack the capability of identifying the criticalfacilities even though they have considered the uncertainties ofthe SWM (Chen et al., 2017). The event-tree analysis proposed inour study can determine critical facilities accurately, which is acrucial stage to reinforce weak nodes and to achieve a reliableSWM.
Additionally, our study implies policy making. Firstly, resultsderived from the sensitivity analysis indicate that reducing thefood-waste landfill amount and increasing the recycling rate aremore efficient than increasing the landfill capacity and buildingnew incinerators. Secondly, the results provide another supportiveevidence for using 3R (i.e., Reduce, Reuse, and Recycling) technolo-gies in waste management, which proved to be more environmen-tal friendly (Zan et al., 2020).
7. Conclusions
This paper presents a framework to estimate the reliability of amultiple-stage solid waste collection and transportation systemswith transfer stations. The framework consists of three hierarchicalcomponents. Firstly, the reliability of the system is calculated usingthe first-order reliability method and Ditlevsen bounds, consider-ing facilities involved in both waste collection and transportationstages and the final disposal stage. Secondly, to maximize the reli-ability index of the system without increasing the capacity orreduce the demand of the facilities, we proposed a genetic algo-rithm to optimize the allocation of waste demand between facili-ties in different stages. Finally, we applied an event-treeapproach to analyse the failure modes of the system. The method-ology is demonstrated by investigating the solid waste collectionsystem in Hong Kong, which is a two-stage waste collection systemwith 7 waste transfer stations and 3 landfills.
While the obtained results are specific to the case study anddependent on the input data collected in Hong Kong, the frame-work developed in this study can help decision-makers in the fol-lowing aspects: first, the RA method can quantify the reliabilityindex or risk level of the SWM system; second, the optimisationmodel provide a solution to improve the system reliability, whichcan extend the life of a SWM system without additional cost to
est reliability index) in 2014 based on optimized demand distribution results.
C. Cheng, R. Zhu, R.G. Thompson et al. Waste Management 120 (2021) 650–658
reduce waste demand or build new facilities; thirdly, the sensitiv-ity analysis has the ability to analyses the potential contributionsof different policies on the SWM system; last but not least, theevent-tree analysis identifies the critical facilities in the system,which are important in the waste management plan development.Nevertheless, it should be mentioned that the versatility of theframework needs to be further investigated by involving more casestudies. In addition, the route choice of waste collection and trans-portation, transportation cost, operation cost, and environmentalimpacts are not considered in the reliability analysis in this study,which could be explored in future work.
Declaration of Competing Interest
The authors declare that they have no known competing finan-cial interests or personal relationships that could have appearedto influence the work reported in this paper.
Acknowledgments
This research is supported by the National Research Foundation,Prime Minister’s Office, Singapore under its Campus for ResearchExcellence and Technological Enterprise (CREATE) programme.
References
Adarsh, S., Reddy, M., 2013. Reliability analysis of composite channels using firstorder approximation and Monte Carlo simulations. Stoch. Environ. Res. RiskAssess. 27, 477–487. https://doi.org/10.1007/s00477-012-0663-0.
Averbakh, I., 2000. Minmax regret solutions for minimax optimization problemswith uncertainty. Oper. Res. Lett. 27, 57–65. https://doi.org/10.1016/s0167-6377(00)00025-0.
Bensoussan, A., 2005. Reliability index. Optimal Control and Dynamic Games.Springer, 311–317 10.1007/b136166.
Bharadwaj, B., Rai, R.K., Nepal, M., 2020. Sustainable financing for municipal solidwaste management in Nepal. PLoS One 15, e0231933. https://doi.org/10.1371/journal.pone.0231933.
Biswas, A., De, A.K., 2016. A Fuzzy Goal Programming Approach for Solid WasteManagement Under Multiple Uncertainties. Procedia Environ. Sci. 35, 245–256.https://doi.org/10.1016/j.proenv.2016.07.090.
Bogárdi, J., Kundzewicz, Z.W., 2002. Risk, reliability, uncertainty, and robustness ofwater resources systems. [electronic resource], International hydrology series.Cambridge : Cambridge University Press, 2002. https://doi.org/10.1017/CBO9780511546006
Chen, X., Huang, G., Zhao, S., Cheng, G., Wu, Y., Zhu, H., 2017. Municipal solid wastemanagement planning for Xiamen City, China: a stochastic fractional inventory-theory-based approach. Environ. Sci. Pollut. Res. 24, 24243–24260. https://doi.org/10.1007/s11356-017-0027-x.
Cheng, C., Zhang, L., Thompson, R.G., 2019. Reliability analysis of road networks indisaster waste management. Waste Manag. 84, 383–393. https://doi.org/10.1016/j.wasman.2018.11.027.
Cheng, C., Zhang, L., Thompson, R.G., 2018. Reliability analysis for disaster wastemanagement systems. Waste Manag. 78, 31–42. https://doi.org/10.1016/j.wasman.2018.05.011.
Cheng, G., Huang, G., Dong, C., Xu, Y., Chen, J., Chen, X., Li, K., 2017. Distributedmixed-integer fuzzy hierarchical programming for municipal solid wastemanagement. Part II: scheme analysis and mechanism revelation. Environ.Sci. Pollut. Res. 24, 8711–8721. https://doi.org/10.1007/s11356-017-8574-8.
Cheng, S., Chan, C.W., Huang, G.H., 2003. An integrated multi-criteria decisionanalysis and inexact mixed integer linear programming approach for solidwaste management. Eng. Appl. Artif. Intell. 16, 543–554. https://doi.org/10.1016/S0952-1976(03)00069-1.
Christensen, T.H., 2010. Waste Transfer Stations: A Manual for Decision-Making.Solid Waste Technol. Manag. 1, 311–318. https://doi.org/10.1002/9780470666883.ch23.
Chung, W., Yeung, I.M.H., 2019. Analysis of residents’ choice of waste chargemethods and willingness to pay amount for solid waste management in HongKong. Waste Manag. 96, 136–148. https://doi.org/10.1016/j.wasman.2019.07.020.
Crawley, F., 2020. Event tree analysis. A Guid. to Hazard Identif. Methods 125–130.https://doi.org/10.1016/b978-0-12-819543-7.00014-8.
Ditlevsen, O., 1979. Narrow reliability bounds for structural systems. J. Struct. Mech.7, 453–472. https://doi.org/10.1080/03601217908905329.
Ganji, A., Jowkarshorijeh, L., 2012. Advance first order second moment (AFOSM)method for single reservoir operation reliability analysis: a case study. Stoch.
658
Environ. Res. Risk Assess. 26, 33–42. https://doi.org/10.1007/s00477-011-0517-1.
GU, Y., 2019. Chongqing Adopts the World’s Leading Garbage Disposal and TransferSystem in China [WWW Document]. ichongqing. https://www.ichongqing.info/2019/12/24/chongqing-leading-garbage-disposal-and-transfer-system/
Guo, P., Huang, G.H., He, L., 2008. ISMISIP: an inexact stochastic mixed integer linearsemi-infinite programming approach for solid waste management and planningunder uncertainty. Stoch. Environ. Res. Risk Assess. 22, 759–775. https://doi.org/10.1007/s00477-007-0185-3.
Habibi, F., Asadi, E., Sadjadi, S.J., Barzinpour, F., 2017. A multi-objective robustoptimization model for site-selection and capacity allocation of municipal solidwaste facilities: A case study in Tehran. J. Clean. Prod. 166, 816–834. https://doi.org/10.1016/j.jclepro.2017.08.063.
Haldar, A., Mahadevan, S., 2000. Probability, reliability, and statistical methods inengineering design. John Wiley. https://doi.org/10.1002/bate.200002930.
Harr, M.E., 1987. Reliability-Based Design in Civil Engineering. Mcgraw-Hill (Tx).ISBN: 0070266972 9780070266971
HKEB, 2014. A Food Waste & Yard Waste Plan for Hong Kong 2014-2022 1–33.https://www.enb.gov.hk/en/files/FoodWastePolicyEng.pdf
Kaza, S., Yao, L., Bhada-Tata, P., Van Woerden, F., 2018. What a waste 2.0: a globalsnapshot of solid waste management to 2050. The World Bank. https://doi.org/10.1596/978-1-4648-1329-0
Kirca, Ö., Erkip, N., 1988. Selecting transfer station locations for large solid wastesystems. Eur. J. Oper. Res. 35, 339–349. https://doi.org/10.1016/0377-2217(88)90224-X.
Lee, C.K.M., Yeung, C.L., Xiong, Z.R., Chung, S.H., 2016. A mathematical model formunicipal solid waste management – A case study in Hong Kong. Waste Manag.58, 430–441. https://doi.org/10.1016/j.wasman.2016.06.017.
Liu, F., Wen, Z., Xu, Y., 2013. A dual-uncertainty-based chance-constrained modelfor municipal solid waste management. Appl. Math. Model. 37, 9147–9159.https://doi.org/10.1016/j.apm.2013.04.036.
Liu, W., Zhao, Y., Li, J., 2015. Seismic functional reliability analysis of waterdistribution networks. Struct. Infrastruct. Eng. Maintenance. Manag. Life-CycleDes. Perform. 11, 363–375. https://doi.org/10.1080/15732479.2014.887121.
Lu, J.-W., Chang, N.-B., Liao, L., Liao, M.-Y., 2015. Smart and Green Urban Solid WasteCollection Systems: Advances, Challenges, and Perspectives. IEEE Syst. J. 11,2804–2817. https://doi.org/10.1109/jsyst.2015.2469544.
Madsen, H.O., Krenk, S., Lind, N.C., 2006. Methods of structural safety. CourierCorporation. ISBN, 0486445976.
Mailhot, A., Villeneuve, J.-P., 2003. Mean-value second-order uncertainty analysismethod: application to water quality modelling. Adv. Water Resour. 26, 591.https://doi.org/10.1016/S0309-1708(03)00006-X.
Melchers, R.E., Beck, A.T., 2018. Structural reliability analysis and prediction. Johnwiley & sons. https://doi.org/10.1002/9781119266105.
Mirakbari, M., Ganji, A., 2010. Reliability analysis of a rangeland system: theapplication of Profust theory. Stoch. Environ. Res. Risk Assess. 24, 399–409.https://doi.org/10.1007/s00477-009-0329-8.
Nie, X.H., Huang, G.H., Li, Y.P., Liu, L., 2007. IFRP: A hybrid interval-parameter fuzzyrobust programming approach for waste management planning underuncertainty. J. Environ. Manage. 84, 1–11. https://doi.org/10.1016/j.jenvman.2006.04.006.
Portielje, R., Hvitved-Jacobsen, T., Schaarup-Jensen, K., 2000. Risk analysis usingstochastic reliability methods applied to two cases of deterministic waterquality models. Water Res. 34, 153–170. https://doi.org/10.1016/S0043-1354(99)00131-1.
Saif, Y., Rizwan, M., Almansoori, A., Elkamel, A., 2017. A circular economy solidwaste supply chain management based approach under uncertainty. EnergyProcedia 142, 2971–2976. https://doi.org/10.1016/j.egypro.2017.12.316.
Singh, A., 2019. Managing the uncertainty problems of municipal solid wastedisposal. J. Environ. Manage. 240, 259–265. https://doi.org/10.1016/j.jenvman.2019.03.025.
Singh, V., Singh, R.M., Rawal, N., 2019. Municipal Solid Waste Management UsingMultiobjective Optimization with Uncertain Parameters. J. Hazardous, Toxic.Radioact. Waste 23, 1–12. https://doi.org/10.1061/(ASCE)HZ.2153-5515.0000449.
Srivastava, A.K., Nema, A.K., 2012. Fuzzy parametric programming model for multi-objective integrated solid waste management under uncertainty. Expert Syst.Appl. 39, 4657–4678. https://doi.org/10.1016/j.eswa.2011.09.022.
Washburn, B.E., 2012. Avian use of solid waste transfer stations. Landsc. Urban Plan.104, 388–394. https://doi.org/10.1016/j.landurbplan.2011.11.014.
Yan, D., Chang, C.C., 2009. Vulnerability assessment of cable-stayed bridges inprobabilistic domain. J. Bridg. Eng. 14, 270–278. https://doi.org/10.1061/(ASCE)1084-0702(2009)14:4(270).
Zan, F., Iqbal, A., Guo, G., Liu, X., Dai, J., Ekama, G.A., Chen, G., 2020. Integrated foodwaste management with wastewater treatment in Hong Kong: Transformation,energy balance and economic analysis. Water Res. 184,. https://doi.org/10.1016/j.watres.2020.116155 116155.
Zhou, J., Jiao, M., Xing, H., Yang, X., Yang, Y., 2017. A reliability analysis method forrock slope controlled by weak structural surface. Geosci. J. 21, 453–467. https://doi.org/10.1007/s12303-016-0058-1.