high impact philanthropy in the downturn · 2017-12-13 · high impact philanthropy in the downturn...
TRANSCRIPT

High Impact Philanthropy in the DownturnFocus on Housing, Health, and Hunger: A Guide for Donors
The Center for High Impact Phi lanthropySchool of Socia l Pol icy & Pract ice | Univers i t y of Pennsylvania
November 2009
THe CeNTer for HIgH ImPaCT PHIlaNTHroPyii
About the Authors
Katherina M. Rosqueta, MBA, is the founding executive director of the Center for High Impact Philanthropy. Previous-ly, she was a consultant at McKinsey & Company. Prior to joining McKinsey, she worked in community development, nonprofit management, and corporate and venture philanthropy.
Carol A. McLaughlin, MD, MPH, is the research director for global public health at the Center for High Impact Philan-thropy. She is a primary care physician and public health specialist with experience in research, community engage-ment, and program implementation in the U.S. and the developing world.
Hilary J. Rhodes, PhD, is a senior analyst at Abt Associates, formerly the senior analyst in education at the Center for High Impact Philanthropy. Prior to joining the Center, she was a doctoral fellow at the RAND Corporation.
The authors can be contacted at www.impact.upenn.edu or 215.573.7266.
About the Center for high impACt philAnthropy
The nonprofit Center for High Impact Philanthropy was founded in 2006 by Wharton alumni and is housed at the University of Pennsylvania’s School of Social Policy & Practice. Our aim is to provide information and tools to help philanthropists determine where their funds can have the greatest impact in improving the lives of others. With expertise in business, medicine, the law, and public and social policy, our team brings a multidisciplinary approach, in-depth knowledge of research methods, and seasoned judgment to the analysis of high impact philanthropic op-portunities.
sourCes of INformaTIoN
Field experience
Practitioner insights Performance assessments In-depth case studies
inFormed opinion
Expert opinion Stakeholder input Policy analyses
research
Randomized controlled trials and quasi-experimental studies
Modeled analyses (e.g., cost-effectiveness)
Field
experience
inFormed
opinionresearch
most promising
To meet our goal of providing smart, practical guidance to individual philanthropists, we synthesize the best available information from three domains: research, informed opinion, and field experience. By considering evidence from these three sources, we seek to leverage the strengths while minimizing the limitations of each. We believe the most promising opportunities exist where the recommendations of these three domains overlap.
our multi -perspeCtive , evidenCe- informed ApproACh
HIgH ImPaCT PHIlaNTHroPy IN THe dowNTurN iii
Table of ContentsWhy this , Why noW 1
opportunity 1: prevent foreClosures 3
Context 4
How Philanthropic Capital Can Change The Situation 6
2 Solution 1: Nonprofit Housing Counseling 6
2 Solution 2: Outreach To At-Risk Homeowners 9
Taking Action 10
opportunity 2: sustAin ACCess to primAry And preventive heAlthCAre 13
Context 14
How Philanthropic Capital Can Change The Situation 15
2 Solution 1: Community Health Centers 15
2 Solution 2: Targeted Prevention And Outreach 20
Taking Action 23
opportunity 3: ensure ACCess to food 27
Context 28
How Philanthropic Capital Can Change The Situation 28
2 Solution 1: Emergency Food Providers 29
2 Solution 2: Benefits Access Programs 32
Taking Action 36
referenCes And endnotes (inCluding list of nonprofits) ref- i
ACKnoWledgments inside bACK Cover
2 Model In Practice in this section

THe CeNTer for HIgH ImPaCT PHIlaNTHroPyiv

HIgH ImPaCT PHIlaNTHroPy IN THe dowNTurN 1
We began this effort in April when we issued High Impact Philanthropy in the Economic Downturn - Action Agenda. Since then, there have been many new developments, including major federal fund-ing initiatives and hopeful signs that the economy is stabilizing. Yet as we write this, unemployment and foreclosure rates remain alarmingly high; foun-dation assets and state and municipal budgets have been drastically cut; and the nonprofits that provide a critical safety net in communities around the coun-try continue to face heightened demand for their ser-vices precisely when their resources have shrunk.
Now, more than ever, donors need to understand where their resources can deliver big results.
To help donors understand where such high impact opportunities exist, our multidisciplinary team relied on numerous sources of information. These sources included available academic research, policy briefs, financial and performance data from nonprofits, and emerging statistics on the overall economic situation. We interviewed dozens of experts including econo-mists, funders, nonprofit staff, government officials, and researchers. To understand client needs and the day-to-day realities of the nonprofits working with them, we conducted site visits, including observ-ing housing counselor sessions and listening in on outbound and inbound help lines. (See inside back cover for the full list of individuals who contrib-uted to our work.)
Three years ago, the Center for High Impact Philanthropy was founded to provide analysis and decision-making tools to help philanthropists determine where their funds can have the greatest impact in improving the lives of others. Given the breadth and severity of the current economic downturn, the question we needed to answer was clear: Where can individual donors make a significant difference in addressing the suffering caused by the economic crisis?
Why this , Why noW

THe CeNTer for HIgH ImPaCT PHIlaNTHroPy2
Our hope is that by doing much of this legwork for you, we provide the kind of independent, practical advice that will move you to translate concern and good intentions into impact.
why we focus on housing, health, and hunger
Although the needs for philanthropic support are great in many areas, this guide focuses on three is-sues in particular. They are:
Preventing foreclosures
Sustaining primary and preventive healthcare programs
Ensuring access to food
We focus on these areas because in each case, the need has clearly spiked due to the downturn. Even with the recent surge in government stimulus, there remain structural gaps that philanthropic capital is well positioned to fill. Effective and cost-efficient nonprofit solutions exist. Acting now means not only addressing an immediate need, but also avoiding enormous future costs. In short, these are three areas where individual donors can obtain a big bang for their philanthropic buck.
what you can expect in each section
This guide was written for individuals seeking to turn their philanthropic capital into a meaningful difference in people’s lives. To that end, each section includes the following:
A brief analysis of the current situation
A description of high-impact models to improve the situation, including an estimate of the impact and cost of each model. These estimates were de-rived either from our team’s analysis of available data or from rigorous cost-benefit analyses
Examples of the model in practice to help potential donors understand how nonprofits target these is-sues effectively
Contact information for nonprofits mentioned and tips for finding a local nonprofit delivering these models in your community
As with all of our work, we have vetted this material with content experts, individual philanthropists, and advisors to ensure that our guidance is both smart and actionable. It represents the best advice we can offer at this time. We welcome continued input and are exploring ways to update this material to incor-porate new information and new developments. To receive notices of updates to this guide, please con-tact [email protected].
HIgH ImPaCT PHIlaNTHroPy IN THe dowNTurN 3
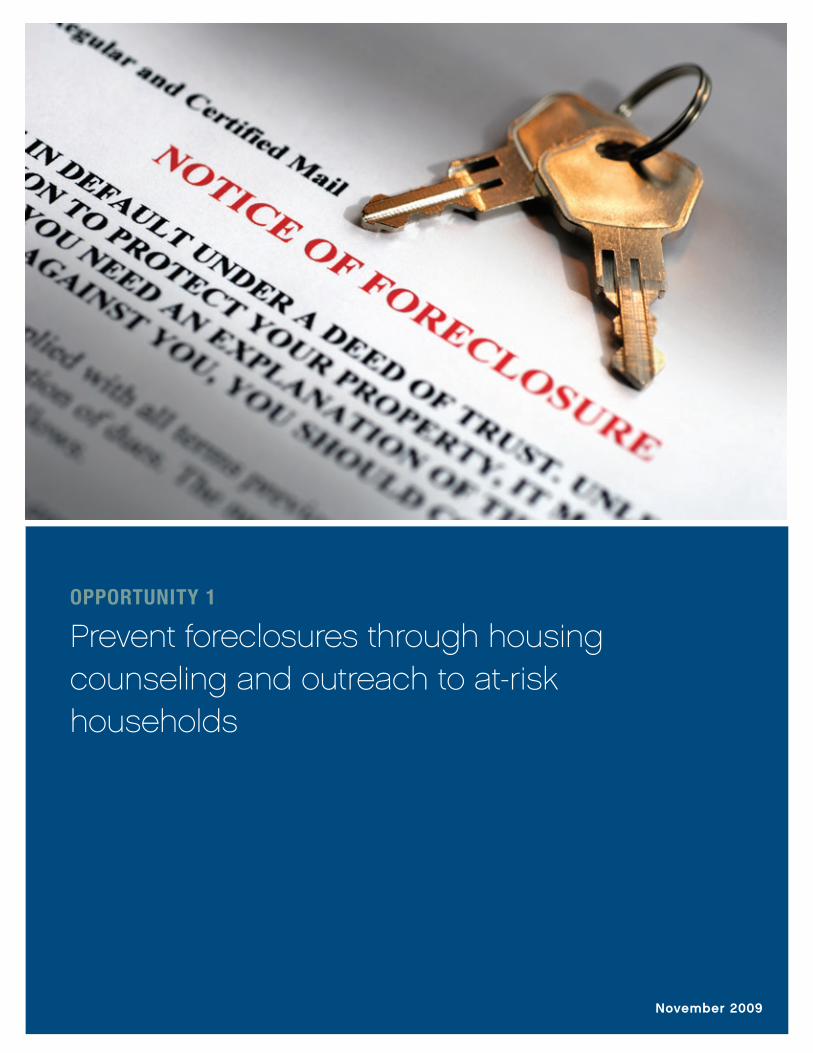
opportunity 1
Prevent foreclosures through housing counseling and outreach to at-risk households
November 2009

THe CeNTer for HIgH ImPaCT PHIlaNTHroPy4
Foreclosures can be devastating. Beyond the loss of shelter, affected households experience significant instability, anguish, loss of important social support, and continued financial distress. When foreclosures mean transferring schools and day care facilities, children’s learning suffers.3 For already vulnerable families, the risk of homelessness becomes real.4
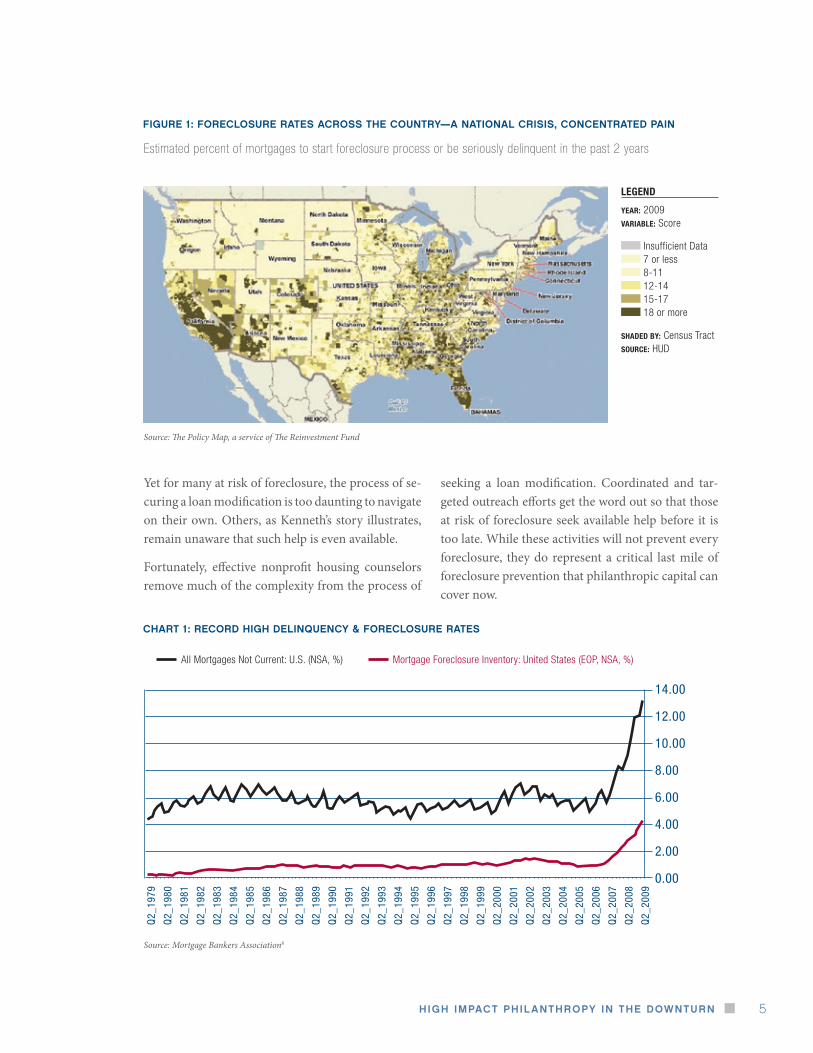
When foreclosures are clustered—as they have been in many communities during this recession—affect-ed neighborhoods see significant declines in property values,5 increases in violent crime,6 and increases in related municipal costs, such as inspections, unpaid water and sewage bills, and trash removal.7 (See Fig-ure 1: Foreclosures Rates Across The Country—A National Crisis, Concentrated Pain).
As we write, foreclosure rates are at the highest ever recorded since the Mortgage Bankers Association
began tracking such data in 1979 (See Chart 1: Re-cord High Delinquency & Foreclosure Rates). The proportion of mortgage holders not current on their mortgages is at a record 13.16 percent.8 The Center for Responsible Lending projects that 9 million fore-closures will occur between 2009 to 2012. In addi-tion, due to the increasing spillover effects of fore-closures on neighboring homes, it estimates that 91.5 million homes will lose a combined $1.86 trillion in property value during that same period.9
In response to this national crisis, the federal gov-ernment has committed $75 billion in incentives for loan servicers and borrowers to complete loan modifications, permanent changes in the terms of a mortgage loan that can prevent borrowers from los-ing their homes.
“ We lived in a home for 3 years and we lost it … almost a year ago. It was the first American Dream my
parents could’ve accomplished but they did not know interest would rise—they would not be able to pay
the mortgage. So we moved in with our aunt. There are currently 12 of us in a one-room house, so do
the math.”1
- evelyn, student at Village Academy High School Is Anybody Listening? A testament by Village Academy High School students on the economic crisis
the Context
“ Refinancing … could that have been a factor? I’m not 100% sure but that company sure as heck didn’t
want to work with me. You’re not looking for a free handout, you’re looking for someone to give you a
fresh start … Well, if the deal isn’t reached they say by the end of the month, there will be a Sheriff’s
sale. Now I know they initiated the stimulus package to help people but it seems like you don’t know
where to go to get that help.”2
- Kenneth Kruse, at-risk homeowner The Faces of Foreclosure: People across the New York region tell their stories
An unprecedented number of people across the country face losing their homes to foreclosure. However, for many families like Evelyn’s and Keith’s, effective housing counseling and targeted outreach can prevent foreclosure’s enormous emotional, social, and economic toll. Such efforts now represent great bang for philanthropic buck.
HIgH ImPaCT PHIlaNTHroPy IN THe dowNTurN 5
Yet for many at risk of foreclosure, the process of se-curing a loan modification is too daunting to navigate on their own. Others, as Kenneth’s story illustrates, remain unaware that such help is even available.
Fortunately, effective nonprofit housing counselors remove much of the complexity from the process of
seeking a loan modification. Coordinated and tar-geted outreach efforts get the word out so that those at risk of foreclosure seek available help before it is too late. While these activities will not prevent every foreclosure, they do represent a critical last mile of foreclosure prevention that philanthropic capital can cover now.
fIgure 1: foreClosure raTes aCross THe CouNTry—a NaTIoNal CrIsIs, CoNCeNTraTed PaIN
Source: The Policy Map, a service of The Reinvestment Fund
Estimated percent of mortgages to start foreclosure process or be seriously delinquent in the past 2 years
CHarT 1: reCord HIgH delINQueNCy & foreClosure raTes
14.00
12.00
10.00
8.00
6.00
4.00
2.00
0.00
Q2_
1979
Q2_
1980
Q2_
1981
Q2_
1982
Q2_
1983
Q2_
1984
Q2_
1985
Q2_
1986
Q2_
1987
Q2_
1988
Q2_
1989
Q2_
1990
Q2_
1991
Q2_
1992
Q2_
1993
Q2_
1994
Q2_
1995
Q2_
1996
Q2_
1997
Q2_
1998
Q2_
1999
Q2_
2000
Q2_
2001
Q2_
2002
Q2_
2003
Q2_
2004
Q2_
2005
Q2_
2006
Q2_
2007
Q2_
2008
Q2_
2009
Mortgage Foreclosure Inventory: United States (EOP, NSA, %)All Mortgages Not Current: U.S. (NSA, %)
Source: Mortgage Bankers Association8
legend
year: 2009variable: Score
Insufficient Data 7 or less 8-11 12-14 15-17 18 or more
shaded by: Census Tractsource: HUD
THe CeNTer for HIgH ImPaCT PHIlaNTHroPy6
Given the devastating toll that each foreclosure can inflict, donors can make a meaningful difference by funding:
solution 1: nonprofit housing counseling: Seeking a loan modification can be daunting for anyone, let alone a household in financial distress. Effective nonprofit housing counselors help troubled borrow-ers navigate the process of seeking an affordable loan modification from their servicer and work with the borrower and servicer to negotiate a loan modifica-tion that can succeed (i.e., the homeowner does not redefault on the loan).
solution 2: coordinated outreach and public educa-tion: Too many people remain unaware that help is now available. Worse still, scam artists, sometimes posing as representatives of legitimate nonprofits, are targeting desperate homeowners with high-priced (and worthless) loan modification services.10 Coor-dinated outreach and public education help troubled homeowners gain access to legitimate counseling and avoid becoming victims of fraud.
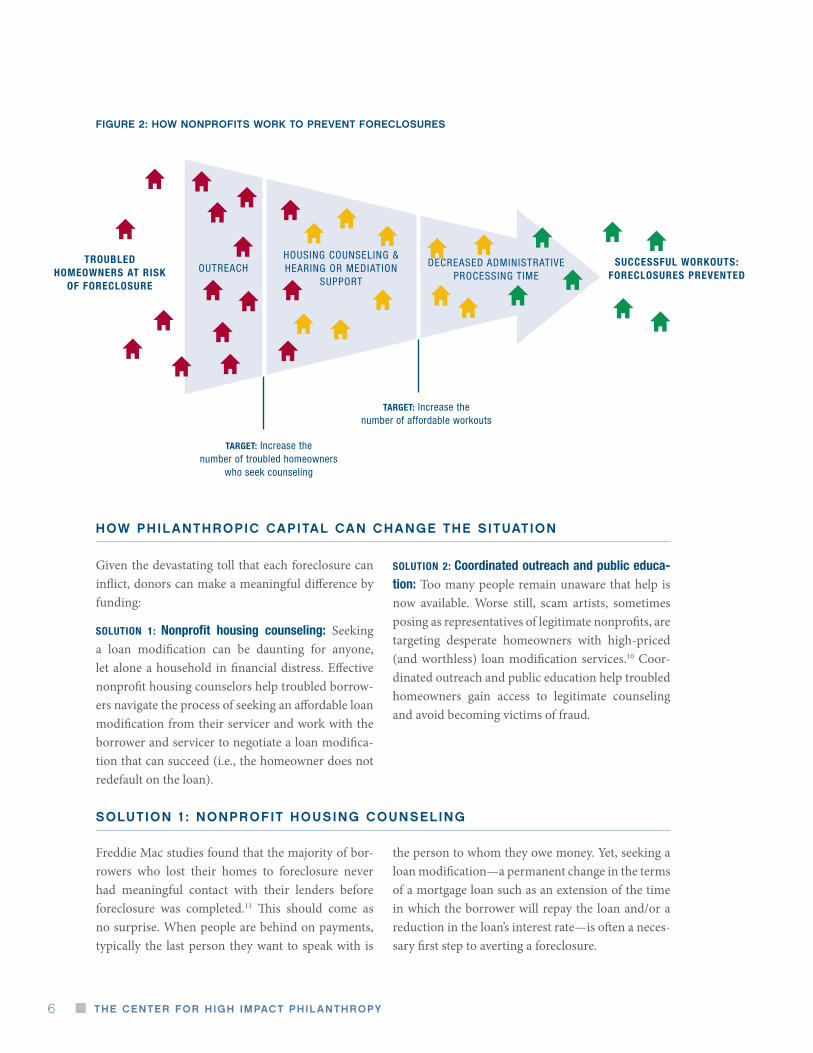
fIgure 2: How NoNProfITs work To PreveNT foreClosures
troubled homeowners at risK
oF Foreclosure
OUTREACHHOUSINg COUNSELINg & HEARINg OR MEDIATION
SUPPORT
DECREASED ADMINISTRATIvE PROCESSINg TIME
successFul worKouts: Foreclosures prevented
target: Increase the number of troubled homeowners
who seek counseling
target: Increase the number of affordable workouts
hoW philAnthropiC CApitAl CAn ChAnge the situAtion
solution 1 : nonprofit housing Counseling
Freddie Mac studies found that the majority of bor-rowers who lost their homes to foreclosure never had meaningful contact with their lenders before foreclosure was completed.11 This should come as no surprise. When people are behind on payments, typically the last person they want to speak with is
the person to whom they owe money. Yet, seeking a loan modification—a permanent change in the terms of a mortgage loan such as an extension of the time in which the borrower will repay the loan and/or a reduction in the loan’s interest rate—is often a neces-sary first step to averting a foreclosure.

HIgH ImPaCT PHIlaNTHroPy IN THe dowNTurN 7
Nonprofit housing counselors act as neutral interme-diaries between the borrower and the servicer to help negotiate an affordable loan modification for the cli-ent. Effective housing counselors assess the client’s financial situation, determine what the client can af-ford to pay for housing, and create an action plan. Such counselors will verify the homeowner’s budget by reviewing a credit report and comparing the re-port to documents provided by the client. They will also create a detailed plan that may involve budgeting and financial management strategies such as renting out a room, asking adult children to contribute, or cutting off cable. If requested by the client, counsel-ors will contact the servicer and negotiate on behalf of the borrower.
This last activity can be especially impactful as ef-fective housing counseling agencies understand the new rules and incentives for loan modifications, have experience working with the major servicers, and have access to data exchange systems with servicers. These capabilities enable them to expedite the loan modification process. Many nonprofit counseling agencies are now actively working with Hope Now, a cooperative effort of nonprofit counseling agencies, mortgage companies, trade associations, investors, and mortgage insurance companies to continue to forge solutions to keep people in their homes. (see Taking Action, p 10).
We estimate that it costs between $300 and $3,800 to provide effective counseling that keeps a client at risk of foreclosure in his or her home for at least 12 months. These estimates are based on available indus-try reports regarding average costs and success rates. We do not yet have estimates beyond 12 months be-cause these programs are still so new. However, if a homeowner is able to make payments for 12 months, it is a good sign that a permanent solution has been found. Equally important, this “cost per foreclosure prevented” is small compared to the damage done by each foreclosure. (See below: Great Bang for Buck: Nonprofit Housing Counseling)
An affordable loan modification cannot always be reached. In those cases, effective nonprofit housing counselors map out a strategy to help homeowners exit with the least amount of disruption or damage to their credit history. Such counselors often nego-tiate a “graceful exit,” or “cash for keys.” Such cash can serve as a down payment for a rental and an in-centive for the homeowner to maintain the property before vacating.
In the Taking Action section (see page 10), we tell you how to find an effective nonprofit housing counsel-ing agency to support. In addition, to help you better understand how philanthropic capital can help, we provide an example of the Model in Practice on the next page.
greaT BaNg for BuCk: NoNProfIT HousINg CouNselINg
Cost per impact: $300 to $3,800 to help a homeowner at risk of foreclosure reach a successful loan modification with a servicer. Compare this to:
Costs to society: As much as $34,000 in municipal costs per foreclosure.12 Given that 9 million foreclosures are anticipated over the next four years,13 the total bill to cities could reach $306 billion.14 The reduction in property values could reach $1.86 trillion.15
Costs to communities: When a foreclosure occurs in a neighborhood, each neighboring home loses an average of $7,200 in value.16 Neighborhood violent crime rises an estimated 2.33 percent with each percentage point increase in that neighborhood’s foreclosure rate.17
Costs to individual: Increased risk of homelessness, continued financial distress, increased rates of stress and mental illness; for children, loss in learning and development.
THe CeNTer for HIgH ImPaCT PHIlaNTHroPy8
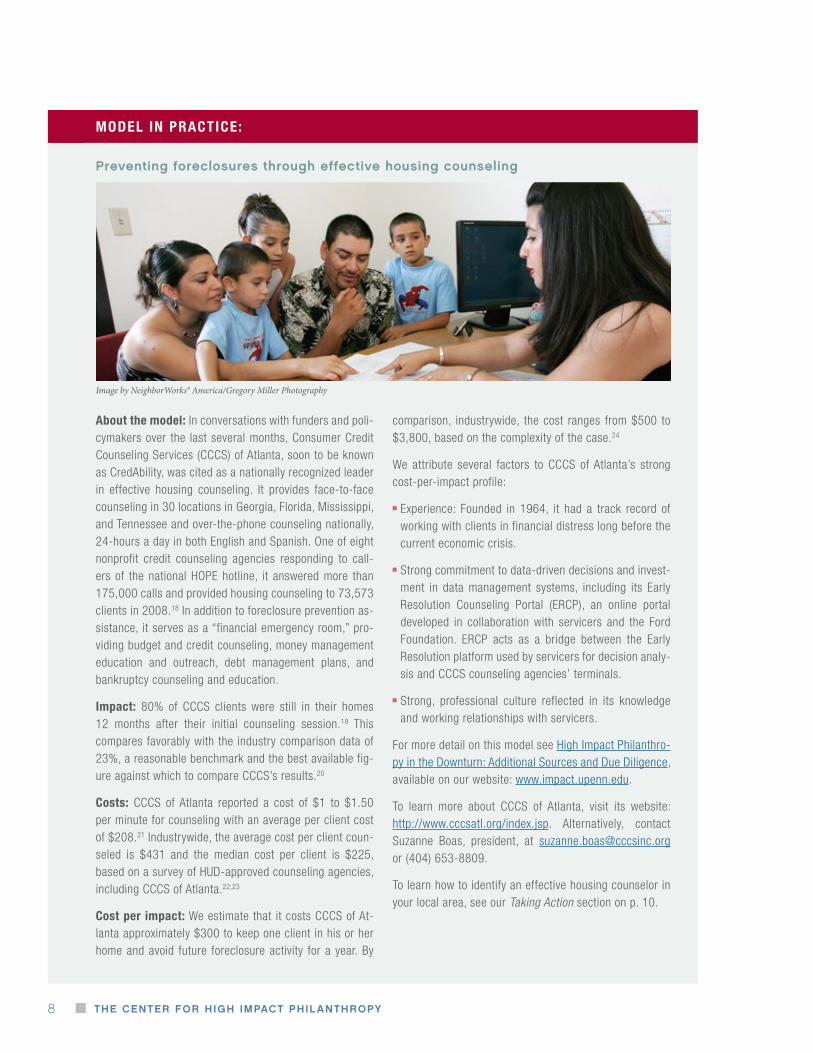
model in practice:
Preventing foreclosures through effective housing counseling
about the model: In conversations with funders and poli-cymakers over the last several months, Consumer Credit Counseling Services (CCCS) of Atlanta, soon to be known as CredAbility, was cited as a nationally recognized leader in effective housing counseling. It provides face-to-face counseling in 30 locations in Georgia, Florida, Mississippi, and Tennessee and over-the-phone counseling nationally, 24-hours a day in both English and Spanish. One of eight nonprofit credit counseling agencies responding to call-ers of the national HOPE hotline, it answered more than 175,000 calls and provided housing counseling to 73,573 clients in 2008.18 In addition to foreclosure prevention as-sistance, it serves as a “financial emergency room,” pro-viding budget and credit counseling, money management education and outreach, debt management plans, and bankruptcy counseling and education.
impact: 80% of CCCS clients were still in their homes 12 months after their initial counseling session.19 This compares favorably with the industry comparison data of 23%, a reasonable benchmark and the best available fig-ure against which to compare CCCS’s results.20
costs: CCCS of Atlanta reported a cost of $1 to $1.50 per minute for counseling with an average per client cost of $208.21 Industrywide, the average cost per client coun-seled is $431 and the median cost per client is $225, based on a survey of HUD-approved counseling agencies, including CCCS of Atlanta.22,23
cost per impact: We estimate that it costs CCCS of At-lanta approximately $300 to keep one client in his or her home and avoid future foreclosure activity for a year. By
comparison, industrywide, the cost ranges from $500 to $3,800, based on the complexity of the case.24
We attribute several factors to CCCS of Atlanta’s strong cost-per-impact profile:
Experience: Founded in 1964, it had a track record of working with clients in financial distress long before the current economic crisis.
Strong commitment to data-driven decisions and invest-ment in data management systems, including its Early Resolution Counseling Portal (ERCP), an online portal developed in collaboration with servicers and the Ford Foundation. ERCP acts as a bridge between the Early Resolution platform used by servicers for decision analy-sis and CCCS counseling agencies’ terminals.
Strong, professional culture reflected in its knowledge and working relationships with servicers.
For more detail on this model see High Impact Philanthro-py in the Downturn: Additional Sources and Due Diligence, available on our website: www.impact.upenn.edu.
To learn more about CCCS of Atlanta, visit its website: http://www.cccsatl.org/index.jsp. Alternatively, contact Suzanne Boas, president, at [email protected] or (404) 653-8809.
To learn how to identify an effective housing counselor in your local area, see our Taking Action section on p. 10.
Image by NeighborWorks® America/Gregory Miller Photography

HIgH ImPaCT PHIlaNTHroPy IN THe dowNTurN 9
model in practice:
linking troubled homeowners to assistance through targeted, “door-knock” campaign
about the model: General outreach activities (e.g., public service announcements, bill inserts) can raise overall public awareness. But in urban areas with a high concentration of households at risk of foreclosure, a targeted “door knock” campaign can be a cost-effective way to link borrowers with housing counseling. The city of Philadelphia incorporated such a campaign in its Residential Mortgage Foreclosure Di-version Program. The city partnered with 15 local nonprofits to conduct door-to-door outreach to approximately 400 to 500 eligible homeowners a month.25,26 Representing the city, trained nonprofit staff received a list of at-risk, owner-oc-cupied households. Households could receive up to 3 visits. If representatives successfully reached a homeowner, they explained that help was available and urged the borrower to call the city hotline to set up a free housing counseling session. The city is currently working with a foundation to understand the impact and cost effectiveness of its efforts, but the program has already been recognized nationally by mayors such as Michael Bloomberg of New York and Antonio Villaraigosa of Los Angeles.27
impact: It will be some time before rigorous studies are available on programs created to respond to the current cri-sis. In the meantime, we applied the success rates of one of the City’s nonprofit partners to estimate the potential im-pact of a door-knock campaign. In a nonprofit pilot of 117
households contacted, of which 94 were actually reached, 65%—or 61 households—called the hotline immediately to set up a housing counseling appointment.28 We don’t know the effects of the campaign isolated from other aspects of the program. In an early attempt to understand this, the city observed a 12% increase in response rates by those covered by the door-knock campaign versus those who were not.29
cost: An estimated $25 to $75 per household “knocked,” that is, per name on the list.30 This is not the cost to the city, but simply an estimate provided by a nonprofit partner of its costs to deploy staff as part of a city campaign. Cost includes transportation, canvassers’ compensation, and cellphones.31
cost per impact: We estimated it cost $60 to $200 for every homeowner who seeks help by scheduling a housing counselor appointment, based on figures provided by the nonprofit pilot.32
In our conversations with those involved in outreach efforts, two criteria emerged as central to the success of any door-knock campaign. The first is the availability of a good quality, targeted list of at-risk households. The second is the avail-ability of experienced canvassers who already have, or can quickly gain, the necessary trust from the low-income and minority communities most at-risk of foreclosure.
Borrowers typically gain access to counselors through a hotline or by submitting an online appli-cation to counseling agencies. However, many at-risk households, unaware of new incentives for servicers and lenders to modify loans, do not seek housing counseling. With no knowledge of legitimate options for help, desperate homeowners become victims to increasingly sophisticated scam artists, peddling bad information and worthless loan modification services.
Outreach can take many forms including direct mail, cold calls, robocalls from city officials, high profile counseling fairs, public service announcements on TV and radio, billboards and bus advertisements,
and door-to-door canvassing. When well coordinat-ed, such activities can reach troubled homeowners, serving as a check against scams.
However, as with all outreach activities, the most successful are able to 1) target those at risk and 2) remove existing barriers to access (e.g., lack of com-puter or phone access, language differences, and trust issues).
In the Taking Action section (see page 10), we tell you how to find local outreach efforts to support. In addition, to help you better understand how philan-thropic capital can help, we provide the following de-scription of an outreach Model in Practice.
solution 2 : outreACh to At-risK homeoWners
THe CeNTer for HIgH ImPaCT PHIlaNTHroPy10
model in practice (continued):
how to find a housing counselor in your local area
As we mentioned earlier, CCCS of Atlanta is a na-tional leader in providing nonprofit housing coun-seling and other services for those in financial dis-tress. It currently provides face-to-face counseling in 30 locations in Georgia, Florida, Mississippi, and Tennessee and over-the-phone counseling nation-ally, 24-hours a day in both English and Spanish. To learn more about CCCS of Atlanta, please visit its website, http://www.cccsatl.org/index.jsp. Alterna-tively, contact Suzanne Boas, president, at [email protected] or (404) 653-8809.
For those wishing to support nonprofit housing counseling in other areas, NeighborWorks America http://www.nw.org/network/home.asp was also cit-ed by those we spoke to for its strong work in foreclo-sure prevention. Founded in 1978 (as Neighborhood Reinvestment Corporation), it is a national nonprofit corporation created by Congress that supports a net-work of more than 235 nonprofit community-based organizations providing affordable housing, tech-nical assistance and finance for community-based revitalization efforts. NeighborWorks America ad-ministers the National Foreclosure Mitigation Coun-seling (NFMC) Program, distributing to agencies the federal dollars set aside to cover transactional costs of counseling. On its website, http://www.finda-foreclosurecounselor.org/network/nfmc_lookup/, users can search for housing agencies by state and
tAKing ACtion
TIPs for assessINg HousINg CouNselINg
ageNCIes
There is significant variation in the quality of hous-ing counseling, so look for the following when as-sessing an organization’s strength:
Commitment and capacity to go beyond simply providing and collecting information to actually negotiating and advocating for an affordable loan modification from servicers
Experience working with clients in financial dis-tress, relationships with servicers, and ability to ad-dress other financial needs (e.g., financial literacy and debt management)
Systems to support data-driven decision making and to expedite the loan modification process
Status as a HUD-approved housing counseling agency http://www.hud.gov/offices/hsg/sfh/hcc/hcs.cfm and a responder to the national HOPE hotline, which provides free phone counseling 24-hours a day http://www.hopenow.com/mem-bers.php. (See also Hope Now Alliance in “How to find an outreach provider.”)
Capacity to provide counseling in languages other than English since low-income, new immigrant, and minority communities have been especially hard hit
For more details on this model see High Impact Philan-thropy in the Downturn: Additional Sources and Due Dili-gence, available on our website: www.impact.upenn.edu.
To learn more about Philadelphia’s Residential Mortgage Foreclosure Diversion Pilot Program, contact Terry Gil-len, executive director, Redevelopment Authority, City of Philadelphia, at (215) 209-8720, [email protected] or Laura Taylor, contract administrator, City of Philadelphia at (215) 686-9711, [email protected].

HIgH ImPaCT PHIlaNTHroPy IN THe dowNTurN 11
greaT BaNg for BuCk: How your dollars Could HelP
For $300 to $3,800, effective housing counseling can help a homeowner at risk of foreclosure reach a successful loan modification with a servicer. Examples of how philanthropists can make this model more effective and efficient include:
$15,000 to $20,000 will enable housing counselors like CCCS of Atlanta to recruit, hire, train, and provide necessary resources (e.g., computers, desks, and office supplies) for a new housing counselor, who will work with 800 to 1,000 clients per year.33
$15,000 will enable counseling agencies to purchase early resolution portal software. Right now, servicer capacity to process loan modifications remains a severe bottleneck. Such data exchange systems can alleviate servicers’ overload and expedite the loan modification process.
In addition, funding targeted outreach and community education ensures that more troubled borrowers connect with available, effective housing counseling.
We offer these not as a menu but rather simply to provide you with examples of the types of unmet needs we heard from leaders in foreclosure prevention.
by zip code. Donors interested in funding housing counselors in their local communities can identify candidates through this resource.
how to find an outreach provider
Any housing counseling organization you identify from the guidance we provide above should be able to discuss related outreach efforts in the areas they serve.
In addition, for donors interested in supporting out-reach and community education, we recommend Hope Now Alliance as a source of information on ef-fective outreach models currently being implement-ed in communities across the country. Hope Now is
a cooperative effort of nonprofit counseling agen-cies, mortgage companies, trade associations, inves-tors, and mortgage insurance companies. It works to increase awareness of the availability of free help for troubled homeowners and provides free phone counseling 24-hours a day, in multiple languages, via its national hotline.
Contact information:
Website: http://www.hopenow.com/
HOPE Hotline: (888)-995-HOPE (4673)
Executive Director: Faith Schwartz: (202) 589-2406 or [email protected]

THe CeNTer for HIgH ImPaCT PHIlaNTHroPy12
HIgH ImPaCT PHIlaNTHroPy IN THe dowNTurN 13
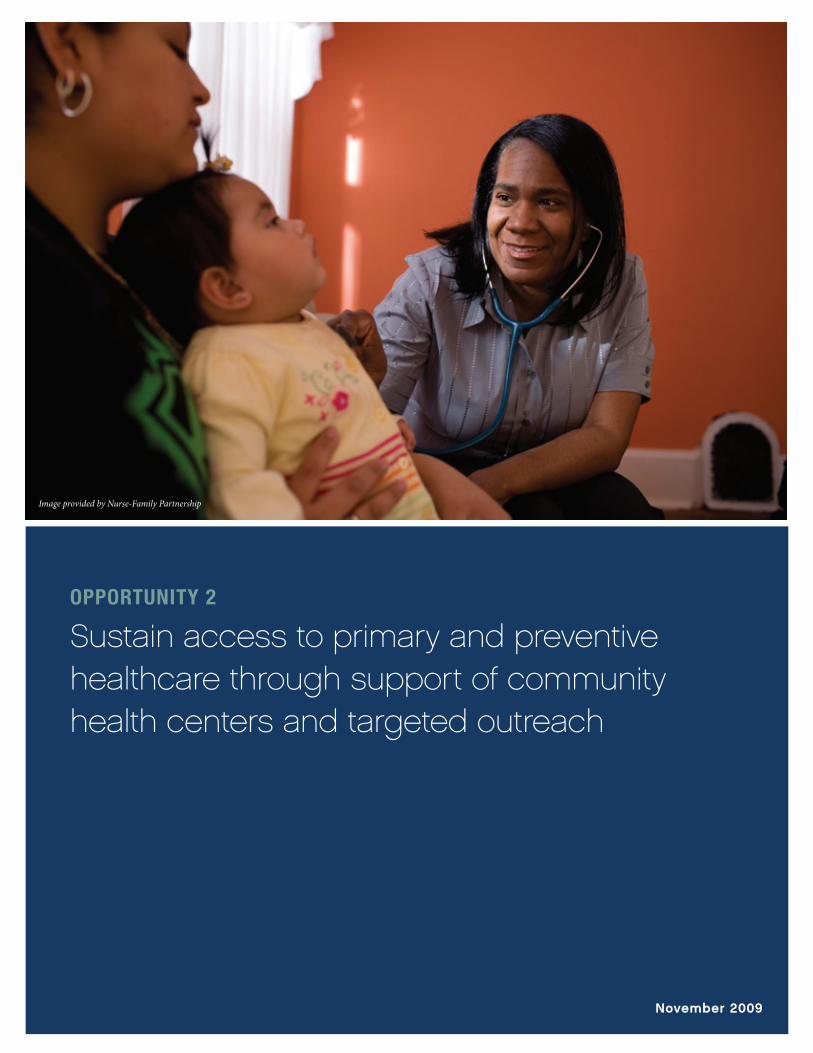
opportunity 2
Sustain access to primary and preventive healthcare through support of community health centers and targeted outreach
November 2009
Image provided by Nurse-Family Partnership
THe CeNTer for HIgH ImPaCT PHIlaNTHroPy14
One of the most troubling consequences of this downturn is that more and more families like the Pyes are postponing or foregoing healthcare, of-ten leading to more serious conditions and costs in the future.2 For women, that can mean foregoing a routine Pap smear that could prevent the advance-ment of cervical cancer. For children, that can mean foregoing recommended vaccines that have prevent-ed thousands of hospitalizations, disabilities, and deaths from measles, influenza, and other prevent-able diseases. When a new health crisis hits already strapped, uninsured families, it can push them over the edge into bankruptcy or force them to choose be-tween health and other basic needs such as food and housing.3
For society as a whole, the swelling ranks of those without access to healthcare mean skyrocketing costs from increased hospitalizations and emergency room visits, as well as higher rates of sickness and death.
As we write this guide, there is ongoing and impas-sioned debate regarding what to do about health-care in this country. Much of the debate focuses on
health insurance coverage. Indeed, this recession has brought the largest loss of jobs since the Great De-pression and with it, millions of Americans have lost their job-based health insurance.4 Currently, nearly 47 million people in this country are uninsured.5 Researchers estimate 6.9 million more Americans will lose health coverage by the end of 2010.6 This translates into 44,230 people losing health insurance each week.7 In addition, the sudden and dramatic drop in state and municipal tax revenues has resulted in cuts to even the most effective and cost-efficient children’s health insurance and community outreach programs.
However, access to healthcare is not just about insur-ance. Many currently insured through Medicaid find that they cannot access care, either because private providers do not accept public insurance or because private providers are often not located in rural and inner-city communities where patients live.
Fortunately, cost-effective nonprofit models exist that remove these barriers to access. They represent high impact opportunities for donors to help.
“ Since sales at the Sebring, Fla.-area car dealership where Christopher Pye works have dwindled, so have
the commissions that were 40% of his income in good times. Barely able to afford his $850 monthly
mortgage and pay for groceries, he says something had to give: his two young sons’ annual medical
checkups. ‘It’s just a little too expensive right now,’ says Mr. Pye, 32-years old, who says he can’t afford
to have his family on the company health plan or to pay up front for the visits. This month, Mr. Pye is
canceling his own insurance, hoping the $56 he’ll save in weekly premiums will pay for the exams of his
boys, ages 3 and 4, later.”1
By supporting community health centers, donors can help families like the Pyes stay healthy and avoid the more serious health problems that come from foregoing care. In addition, existing nonprofit models provide cost-effective programs targeting families who are especially vulnerable.
the Context

HIgH ImPaCT PHIlaNTHroPy IN THe dowNTurN 15
In the midst of this recession and regardless of the outcomes of the current healthcare policy debate, donors can make a difference by funding:
solution 1: community health centers (chcs): More than just clinics, these nonprofits provide compre-hensive primary and preventive care regardless of a patient’s ability to pay or type of insurance. Located in rural and urban areas of high need, they remove both financial and logistical barriers to access. In ad-dition, they provide services such as translation and social service referrals that further reduce barriers to access and increase their ability to help those in need. Philanthropic capital can play a strategic role in in-creasing their capacity to meet heightened demand and reach the newly poor and uninsured.
solution 2: targeted prevention and education pro-grams: For especially vulnerable populations (e.g., first time moms), targeted home-based education and prevention programs are another way to remove barriers to access. Such programs have demonstrated that intensive support earlier can have huge payoffs later, not just for patients/clients but also for their families and communities. The use of philanthropic capital to maintain such programs now can prevent enormous suffering and costs in the future.
hoW philAnthropiC CApitAl CAn ChAnge the situAtion
solution 1 : inCreAse ACCess to Comprehensive primAry And preventive CAre by supporting Community heAlth Centers
Community health centers are nonprofit organiza-tions that provide comprehensive, high-quality care to patients regardless of a patient’s income or insur-ance coverage. The national network of community health centers represents the largest system of com-
prehensive care in the United States, serving 18 mil-lion people at more than 7,000 sites in every state and territory.12 In the Taking Action section (see page 23), we tell you how to find one in your state or county.
greaT BaNg for BuCk: CommuNITy HealTH CeNTers
Average cost: $560 per person/year for access to comprehensive primary care8
representative impacts:
For communities: significantly better health outcomes, such as 11% lower rate of low birth weight infants and 8% higher rates of blood pressure control (compared with national average) despite serving communities at higher risk for both9
For society: an estimated $10 billion to $18 billion saved by averting more costly hospital- or ER-based care10
For local economies: for every $1 million invested, $6 million in direct and indirect economic benefits through job creation and local business stimulus11
THe CeNTer for HIgH ImPaCT PHIlaNTHroPy16
Community health centers:
are located in or serve the most medically under-served communities
provide comprehensive primary care services with a focus on prevention
are open to all with sliding scale fees based on abil-ity to pay
are governed by a community board to ensure re-sponsiveness to community needs
These criteria designate them as Federally Qualified Health Centers (FQHCs) or FQHC look-alikes, a designation that allows them to receive federal fund-ing to cover some portion of their operations.13
demonstrated impact
The community health center model has demon-strated impressive results for the people it serves:
Improved health outcomes: Communities served by CHCs have rates of low birth weight infants 11% lower than national rates, despite these communi-ties’ higher risk populations.14
Higher levels of preventive care: Patients served by CHCs receive more preventive care (e.g. screen-ing for diabetes, hypertension, and cervical cancer) than patients served in other primary health care settings. For example, studies have found that for
uninsured women needing Pap smears, rates of screening in CHCs were 22% higher than rates seen in other primary healthcare settings.15
Decreased health disparities: Studies indicate that as the proportion of a state’s low income population served by CHCs grows, gaps in health outcomes along racial lines decline in important key areas such as prenatal care, infant mortality, and age ad-justed death rates.16
Furthermore, studies show that the quality of care in CHCs meets or exceeds the quality of care in the private sector.17
These impressive results are achieved at a relatively low cost. For a typical community health center, the estimated cost of serving a patient is approximately $560 per year.19 CHCs’ costs are among the lowest of healthcare providers. For example, in South Caro-lina, treating patients with diabetes at community health centers costs $400 less than treatment by a typical private provider.20
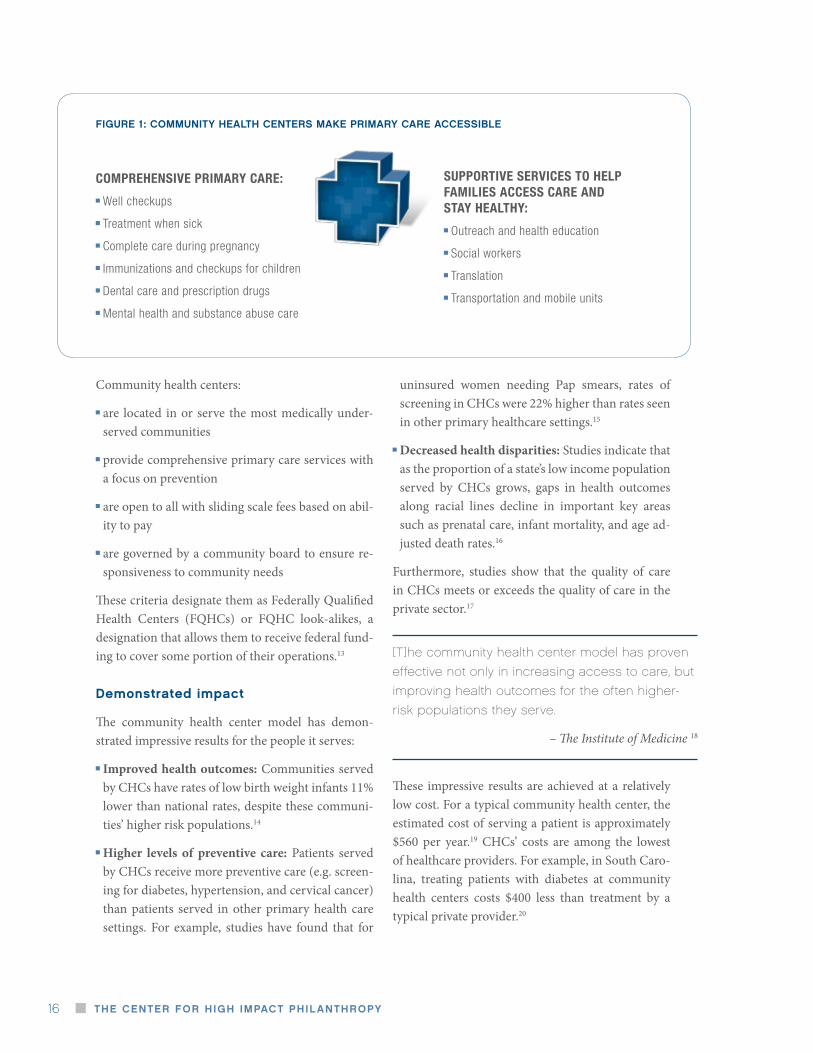
comprehensive primary care:
Well checkups
Treatment when sick
Complete care during pregnancy
Immunizations and checkups for children
Dental care and prescription drugs
Mental health and substance abuse care
supportive services to help Families access care and stay healthy:
Outreach and health education
Social workers
Translation
Transportation and mobile units
fIgure 1: CommuNITy HealTH CeNTers make PrImary Care aCCessIBle
[T]he community health center model has proven
effective not only in increasing access to care, but
improving health outcomes for the often higher-
risk populations they serve.
– The Institute of Medicine 18

HIgH ImPaCT PHIlaNTHroPy IN THe dowNTurN 17
Several factors account for CHCs’ high impact at a relatively low cost. First, CHCs do not provide ex-pensive specialty care such as complex surgery or high-tech radiology. Instead, they emphasize com-prehensive primary and preventive care. This is a more cost-effective way to address health outcomes, rather than foregoing early care only to pay the higher price of addressing a more serious condition later. A second factor is its delivery of community education, case management, transportation, and translation services. These services are high impact because they not only improve access to CHCs’ clinical services, but also help patients take better care of themselves outside of the CHC.
where philanthropic capital is especially needed
In our conversations with community health centers around the country over the past several months, two types of opportunities emerged where private philanthropic capital can fill the gaps and leverage the strengths of the CHC model:
Increase capacity to meet heightened demand
Enhance outreach to newly uninsured and hard to reach populations
For any given CHC, the specific ways in which do-nors can increase capacity or enhance outreach will
depend on the unique health needs of the communi-ty that CHC serves and its specific funding gaps. The recent federal stimulus bill, the American Recovery and Reinvestment Act of 2009 (ARRA), includes ad-ditional resources for CHCs, primarily for capital projects and electronic medical records. However, facing large tax revenue shortfalls, certain states and municipalities are now cutting or threatening to de-crease funding for CHC services and public insur-ance (CHCs’ main source of revenue) despite the increasing demands for CHC services.
As of September 2009, at least 27 states have imple-mented cuts that will restrict low income childrens’ or families’ eligibility for insurance or restrict their access to healthcare services.22 Philanthropic capital is particularly useful given its flexibility and speed in filling strategic gaps while leveraging the public in-vestments already made. In our Taking Action sec-tion (see page 23), we provide tips on approaching and assessing a local CHC to understand the specific, strategic funding gaps your capital can fill.
In addition, to help you better understand how CHCs work and how philanthropic capital can help, we provide the following descriptions of the Models in Practice.
Community Health CenterA
Walk-in Health ClinicB
Private Physician’s
OfficeC
Emergency Room visitB
Facility type
CHarT 1: CommuNITy HealTH CeNTers: aN affordaBle oPTIoN for uNINsured famIlIes
Comparison of out-of-pocket costs incurred by an uninsured, low-income patient for treatment of a common ear infection at different provider sites
Sources: A – Salud health center pricing chart; B – Aetna; C – Healthcare Blue Book21
700
600
500
400
300
200
100
$
med
ian
co
st
to u
nin
su
red
pat
ien
t

THe CeNTer for HIgH ImPaCT PHIlaNTHroPy18
enhancing outreach to newly uninsured and hard-to-reach populations
Many people in need of care, especially the newly unin-sured, are unaware of the services at CHCs and how to get access to them. Private philanthropy can help by sup-porting community outreach workers and support person-nel who ensure that families in need know about and can obtain clinic services.
For example, Community Healthcare Network (CHN) of New York estimates that four out of five people who could use its services do not come in. Instead, they often end up in emergency rooms when their health deteriorates. Com-munity health educators and skilled call center/custom-er service staff can overcome access barriers and help the newly uninsured get the care they need.
A community outreach educator provides information about a clinic’s services to those at greatest risk for being
uninsured, and delivers health programs in areas such as nutrition and sexual health to teenagers in high schools. Well-trained support staff, such as call center personnel, answer calls, link patients to the services they need (e.g., doctor visits, case management, translation, transporta-tion), and provide answers to basic health questions. For some CHCs, mobile units help reach rural families spread out over large distances or engage urban teenagers who would rarely come to a clinic. Quality information and communication on first contact with the CHC mean more families get the care they need and take advantage of the effective CHC model.
For more details on these models see High Impact Phi-lanthropy in the Downturn: Additional Sources and Due Diligence on our website www.impact.upenn.edu.
models in practice:
Increasing community health center (CHC) capacity to meet growing demand
Escalating unemployment rates mean community health centers see more uninsured and underinsured pa-tients. This demand comes at a time when essential fund-ing from state grants and public insurance is threatened by state budget shortfalls. In order to bring more quality care to more people, CHCs need additional staff, infra-structure, and systems. Philanthropic support can bridge the gap between public funding and the cost of providing CHCs’ core services to the growing number in need.
CHCs like Salud Family Health Centers in Colorado have ex-perienced a steady increase in demand for services, most-ly from the newly uninsured. In 2008, fifty-two percent of its patients were uninsured and eligible for sliding-scale
payment based on family size and family income. As fed-eral and state grants cover only a small portion of costs for uninsured patients, there is an increasing gap between the cost of services provided and funds to cover those costs.
Private philanthropic capital can expand a core program such as dental health services that are currently under-funded. Examples of core staff that are needed are nurses, doctors, pharmacists, and health educators.
In addition to human capital, CHCs need capacity invest-ments in systems that increase their quality and effi-ciency. For example, Clinica Sierra Vista in Fresno, Calif., an area hard hit by the recession, seeks to expand its electronic patient registry and tracking program. By creat-ing an interface between patient records, lab reports, and clinic visits, these programs help clinic staff understand who needs what tests, who is doing fine on their own, and who needs more help. For chronic illnesses such as dia-betes and asthma, as well as outreach efforts for breast and cervical cancer, such systems can help CHCs target their limited resources to where they can do the most good. They are particularly needed for outreach to mobile or migrant populations to ensure that patients receive ap-propriate screening and follow-up care.Teaching a patient with diabetes how to self-administer insulin
Image provided by Clinica Sierra Vista

HIgH ImPaCT PHIlaNTHroPy IN THe dowNTurN 19
Nine-year-old Michael was carried into the dental clinic of the Community Health Center of Southeast Kansas (CHCSEK) in Pittsburg, Kansas, with a high temperature and an abscessed tooth. He hadn’t eaten solid food in weeks. There was no dentist in the community that accepted Medicaid. The school nurse contacted the nearby CHCSEK clinic and was told to bring Michael to the center right away. Crying and frightened when he arrived, Michael was bundled into blankets and comforted while the dentist examined him. It was evident that Michael had been enduring an enormous amount of pain for weeks and he was within hours of having to be hospitalized. Michael was given a large dose of antibiotics and the tooth was extracted. Michael’s face immediately lit up with relief despite his discomfort due to the infection.
The health center continues to provide care for the extensive decay persisting throughout Michael’s mouth. When staff went to Michael’s school a few months later to screen 700 other children, he took the hands of CHCSEK staff, led them into his classroom and announced “These are my friends and they will help you.”
Adapted from U.S. Department of Health and Human Services. (2008, June). “Health Centers: America’s Primary Care Safety Net, Reflections on Success, 2002-2007.”Rockville, MD. ftp://ftp.hrsa.gov/bphc/HRSA_HealthCenterProgramReport.pdf
c o m m u n i t y h e a l t h i n a c t i o n

THe CeNTer for HIgH ImPaCT PHIlaNTHroPy20
solution 2 : support tArgeted prevention And heAlth eduCAtion progrAms for espeCiAlly vulnerAble populAtions
For many vulnerable populations (e.g. new moms with few social supports), intensive help early on can have huge payoffs in preventing bad health outcomes and future costs to society. Home or school-based programs have been effective in helping high-risk populations make decisions and establish habits that result in a positive, life-long impact on their health. Examples of such programs include:
home-based prevention and early treatment for asthma that keep at-risk children healthy and out of the emergency room
programs that decrease the risk of falls and help the elderly live independently
education initiatives that equip teenagers with the information and skills they need to make positive choices, particularly regarding nutrition and sexual health
Philanthropic capital is especially needed now. More people have become vulnerable and isolated as a re-sult of the downturn. Yet, community prevention and
education programs are often the first to get cut with budget shortfalls, despite evidence of their ability to improve health outcomes and decrease long-term costs. Many of the most effective outreach initiatives use community health workers. Studies have shown that they can be essential to the success of prevention programs for asthma,25 diabetes,26 cervical cancer,27 and other chronic diseases.28
In the Model in Practice call-out box, we provide an example of an evidence-based nurse home visi-tation program for first-time, low-income mothers and their babies. This model has been replicated in over 20 states. Nurse-Family Partnership (NFP) is a successful and cost-effective community outreach program whose positive impact on children, moth-ers, and society has been well established. At the end of the section, we also provide tips on finding other agents in your local area who target especially vul-nerable populations.
greaT BaNg for BuCk: TargeTed PreveNTIoN aNd HealTH eduCaTIoN Programs
a 5x return for every dollar invested
example – community education and prevention
After five years, an investment of $10 per person per year in evidence-based community education and prevention programs directed at physical activity, healthy eating, and reduction in smoking returns an estimated $5.60 for each dollar invested, taking into account only reductions in healthcare costs and not including improvements in productivity, school achievement, or quality of life.23
example – targeted home-based support
Nurse-Family Partnership (a nurse visitation program for first-time moms): a 2005 cost-benefit analysis by RAND found that for every one dollar invested, the program returned $5.70, providing a net benefit to society of over $34,148 per high-risk family served.24

HIgH ImPaCT PHIlaNTHroPy IN THe dowNTurN 21
model in practice:
Home-based prevention: Helping first-time parents succeed
about the model: Pioneered by the nonprofit Nurse-Family Partnership (NFP), this program targets low-income mothers pregnant with their first child. Participating moth-ers are partnered with a registered nurse early in preg-nancy and receive in-home support and guidance through their child’s second birthday. Support from nurse home visitors begins with education for the women and their families about healthy pregnancy practices such as good nutrition, regular and early prenatal checkups, and quit-ting smoking. It then progresses to coaching parents in providing care for their newborn, infant, and toddler, plan-ning future pregnancies, and developing skills to reach education and work goals.
Registered nurses receive more than 60 hours of train-ing in the NFP model, meet with supervisors on a regular basis, and come together as teams for case conferences to learn from one another and ensure the highest standard of care.
impact: Evidence from more than thirty years of re-search and three randomized controlled trials substanti-ates significant benefits for both mother and baby. They include:29
48% decrease in child abuse and neglect
56% reduction in ER visits for accidents and poisoning
67% reduction in behavioral and intellectual problems at age 6
59% reduction in arrests by the time child is age 15
83% increase in labor force participation by the mother
cost-benefit: In addition, studies have found the program provides an excellent return on investment for society. RAND researchers found that for every one dollar invest-ed, the program returned $5.70, providing a net benefit to society of over $34,148 per high-risk family served.30 The best returns were achieved by targeting the program to
Image provided by Nurse-Family Partnership

THe CeNTer for HIgH ImPaCT PHIlaNTHroPy22
families at highest risk as the return on investment (ROI) was less for lower-risk families. Societal savings came from increased tax revenues from increased employment, decreased welfare costs, lower criminal justice costs, and reduced costs for healthcare and other social services. (See Chart 2: Nurse-Family Partnership: Mon-etary benefits to society.)
role for philanthropy: While the Obama administration has expressed support for the expansion of nurse home visitation programs, states hard hit by the recession have had to cut funding for these programs. For example, Detroit and surrounding counties in Michigan cut state funding to their well-established NFP program as of July 1, 2009. Such funding cuts provide a high leverage opportunity for private philanthropy to step in and keep the programs running, especially as there are federal dollars available to match local funds. In general, private philanthropy can support activities that will enhance the impact of existing
programs and enable the replication of the model in more communities of need. Private philanthropists can increase the impact and capacity at current sites by providing funds for nurses, nursing practice consultants, information sys-tems for tracking outcomes, and training and oversight to ensure implementation fidelity.
For more details on this model see High Impact Philan-thropy in the Downturn: Additional Sources and Due Dili-gence available on our website: www.impact.upenn.edu.
To learn more about NFP, visit its website: www.nursefam-ilypartnership.org or contact Scott Shirai, chief develop-ment officer, at [email protected] or (303) 327-4246.
CHarT 2: Nurse-famIly ParTNersHIP: moNeTary BeNefITs To soCIeTy
Source: 2005 RAND Corporation Study31
$ $10,000 $20,000 $30,000 $40,000 $50,000
net present value dollars per child 2003
HIgHER RISK FAMILIES
LOWER RISK FAMILIES
BenefitCost
CostBenefit
increased participant income
savings to government
reduction in tangible crime losses
cost
model in practice (continued):
HIgH ImPaCT PHIlaNTHroPy IN THe dowNTurN 23
solution 1: how to find a community health center in your local area
There are over 7,200 sites in the United States where community health centers provide care mainly in economically challenged urban and rural communi-ties. To find a community health center in a particu-lar state or city, use the following link and mapping tool: http://findahealthcenter.hrsa.gov
All of the health centers listed are Federally Quali-fied Health Centers (FQHCs) or FQHC-look-alikes. As discussed on page 16, all FQHCs or FQHC look-alikes meet the following criteria:32
Are located in or serve the most medically under-served communities
Provide comprehensive primary care services with a focus on prevention
Are open to all with sliding scale fees based on abil-ity to pay
Are governed by a community board to ensure re-sponsiveness to community needs
Though intended primarily as a screen for govern-ment support, the criteria used to designate a CHC as a Federally Qualified Health Center also provide a useful screen for individual donors seeking to in-crease access to care by supporting the CHC model. If you find a clinic that is not officially designated as FQHC (e.g., a free clinic), we recommend applying the FQHC criteria as a standard by which to assess that center’s ability to deliver the CHC model we dis-cuss in this guide.
About 30% of CHCs are also accredited by The Joint Commission (JCAHO), the preeminent national accrediting association for health service organiza-tions. For those CHCs that have gone through the time-consuming and sometimes expensive process, JCAHO accreditation can be yet another signal of achievement of high standards of quality care, pa-tient safety, and commitment to continuous perfor-mance improvement.33
If you would like to support a CHC in your local area, but don’t see one on the mapping tool linked above, here are suggestions of places to start.
1. City, County, or State Health Departments – Most city and county health departments can direct you to the local health safety net providers. If no in-formation is available at the county level, try the state health department. They often have infor-mation available online or you can call the main number and ask for contact information for the local safety net provider.
2. United Way – Many counties have an active Unit-ed Way chapter that is linked to the 2-1-1 infor-mation system, which is a database that allows people in need to find help. You can search online by “health center” or “medical care.” You can also call your local United Way chapter office. http://www.211.org
tAKing ACtion
TIPs for assessINg CommuNITy HealTH CeNTers
Talk to health center leadershipAs the most urgent unmet needs will differ greatly depending on the particular community served and state funding levels, we recommend that potential donors talk with the leadership of their target health center so that funding can meet locally defined pri-orities. An interested philanthropist can schedule a time to talk with the clinic’s executive director or medical/nursing director. A good CHC should:
be able to articulate the main health issues for its target population and point to effective programs in place to meet these local needs
have done a needs assessment to see what barriers individuals face in accessing services at the clinic and have an outreach plan for addressing them
be able to identify priority areas where cost-effec-tive solutions could be implemented with addi-tional funding

THe CeNTer for HIgH ImPaCT PHIlaNTHroPy24
As you talk with people, keep in mind that not every-one will be familiar with the term “community health center” or “safety net provider.” You may need to ex-plain that you are looking for a place that will care for people regardless of income or ability to pay.
In the box below, we provide examples of ways do-
nors can support CHCs to provide care to those in need. These examples come from conversations we had with CHC leaders over the past several months.
solution 2: how to find targeted home-based programs in your community
To find a Nurse-Family Partnership Program, contact Scott Shirai, chief development officer, at [email protected] or (303) 327-4246 or visit its website http://www.nursefamilypartnership.org/content/index.cfm?fuseaction=showMap&navID=17
The link has a mapping tool of the more than 20 states with active NFP programs and includes con-tact information for the local implementing partners
in each state and county, which philanthropists can also contact. If your state is not listed, contact the national NFP office for information on how to help support new pilot sites for the program.
To find other outreach programs in your area, com-munity health centers and public health departments are your best bet for identifying good local nonprofit agents. When contacting the CHC, we recommend talking to the community programs director or med-ical/nurse director as they are likely to be the most knowledgeable about outreach programming in your community.
greaT BaNg for BuCk: How your dollars Could HelP
For less than $600 per person per year, CHCs deliver impressive health outcomes (see page 15.)
examples oF how philanthropists can extend this model to more people and/or improve the eFFiciency oF existing chcs:
$35,000 would allow Salud Family Health Centers to equip a dental exam room with X-ray equipment and instruments, and $150,000 will cover a dental team comprised of a dentist and a hygienist, making it possible for an additional 2,000 patients to receive a year of standard dental care.34
$45,000 will cover a typical performance tracking program, including personnel and computer expenses, at one of Clinica Sierra Vista’s health centers, to track patients and provide appropriate follow-up.35 Such programs allow CHCs to target their limited resources to where they can make the most difference in patient care.
At Community Healthcare Network, an investment of $35,000 will fund a community health educator who can provide important health information (e.g., substance abuse prevention, child nutrition, HIV prevention), as well as guide community members to appropriate clinic services. In addition to providing health education to at-risk communities, one additional outreach worker could also mean, conservatively, that three to five new patients each week, or an additional 150 to 250 patients each year, would take advantage of clinic services.36
We offer these not as a menu but rather simply to provide you with examples of the types of unmet needs we heard from leaders of CHCs across the country.

HIgH ImPaCT PHIlaNTHroPy IN THe dowNTurN 25
TIPs for assessINg good ouTreaCH
Programs
When you are thinking of supporting a community prevention, education, or visitation program, we recommend selecting a non-profit agent that has:
a level of trust and experience working within the target community
a system to assess quality of program implementa-tion and evidence of its impact
language skills and cultural understanding to com-municate health messages effectively
Often, the best programs will train and employ members of the local community as part of their outreach teams.
exploring ways to improve access and care beyond individual communities and CHCs
We focused on community health centers and com-munity prevention and outreach programs because of their ability to meet health needs using highly ef-fective and efficient models. If you are trying to af-fect access and care beyond individual communities and CHCs, you will need a network of public and nonprofit partners to address larger structural de-terminants of health and well-being. From conversa-tions with leading health foundations, we compiled the following resources that were recommended as sources of useful local information and potential col-laborators. These will be helpful for philanthropists interested in broader efforts to address community health challenges.
additional resources for partnerships on the county, state, or national level
To find up-to-date information on unmet needs, health priorities, and potential opportunities and partners on a county or state level:
Primary Care Associations (PCAs). Every state has a PCA whose members represent the commu-nity health centers in that state and can direct do-nors to specific CHCs based on current priorities, unmet needs, or geographic interest. A listing of all the state PCAs is at: http://bphc.hrsa.gov/techni-calassistance/pcadirectory.htm.
Public health institutes exist in many states and play a complementary role to government. They are good places to find out which community based organizations are key players on specific issues in specific areas. The National Network of Public Health Institutes has a map with contact informa-tion by state at: www.nnphi.org/home/section/2/members.
Many state and county health departments have associated NGOs working in close collaboration with government programs that can take private donations to support the public health and pre-vention needs of local populations. For example, through The Fund for Public Health in New York, http://www.fphny.org/index.php, private donors can support the blending of the expertise and scale of the public sector with the efficiency and flexibil-ity of a nonprofit model.
To support CHCs on a national or regional level:
The National Association of Community Health Centers can act as an intermediary for philanthro-pists who want to support CHCs on a national scale or through a competitive grants program. Addi-tional information on the impact of CHCs can be found on the association’s website: http://www.nachc.com.

THe CeNTer for HIgH ImPaCT PHIlaNTHroPy26
HIgH ImPaCT PHIlaNTHroPy IN THe dowNTurN 27
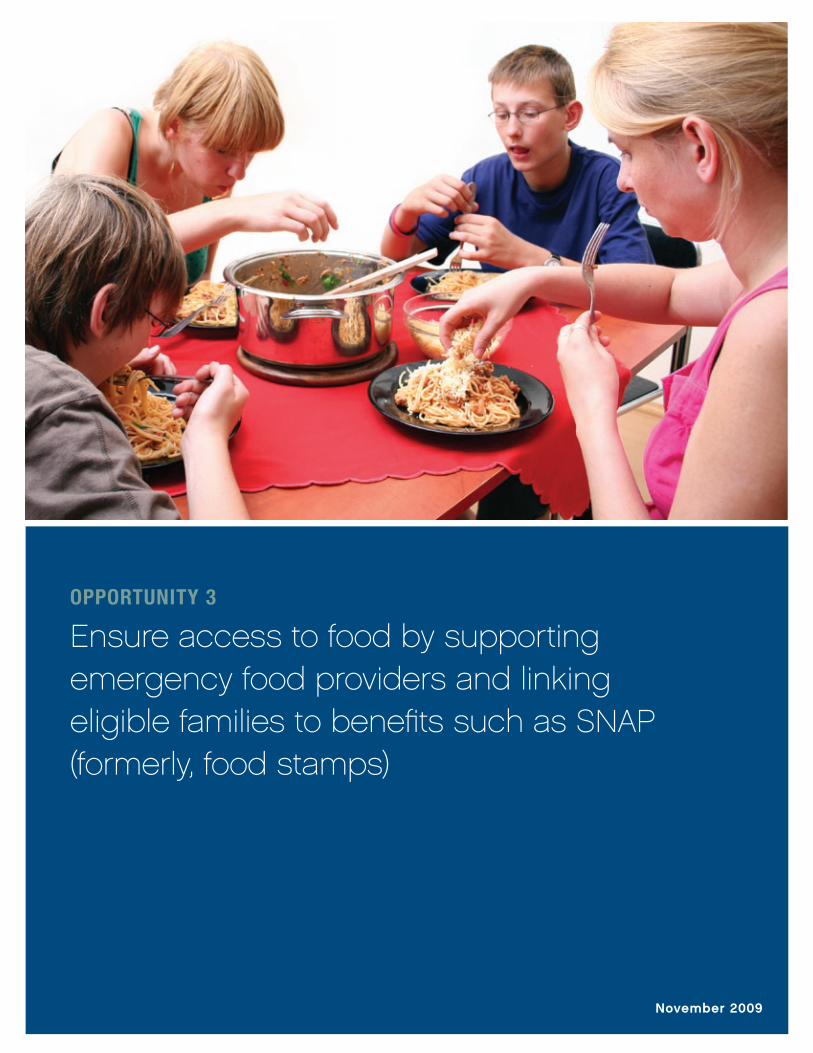
opportunity 3
Ensure access to food by supporting emergency food providers and linking eligible families to benefits such as SNAP (formerly, food stamps)
November 2009

THe CeNTer for HIgH ImPaCT PHIlaNTHroPy28
Historic rates of unemployment, foreclosure, and lack of access to healthcare have stretched families to the limit. As a result, many are increasingly unable to meet the most fundamental of needs—food. In 2007, the most recent year for which USDA data is avail-able, 36.2 million Americans lived in food insecure households – i.e., households experiencing difficulty providing adequate food for all members due to lack of income or other resources. Over a third, or 12.4 million, were children.2 Experts agree that the sever-ity of the current recession has dramatically wors-ened the situation.
Given substantial evidence that lack of adequate and nutritious food has a negative and irreversible impact
on a child’s development, ensuring access to food not only addresses clear, immediate suffering, but also represents a critical investment in the future health, welfare, and productivity of our communities.
the Context
We are able to show quite precisely that because
people can’t afford to pay for housing, health care,
transportation, child care, other basic expenses, as
well as all the food they need, they are forced to
frequently ration food.3
– Joel Berg, author of All You Can Eat: How Hungry Is America
Since losing her job, it has become impossible for Sarah Hammer to make ends meet. Every day, she
takes her two daughters to Boston Medical Center for their severe asthma. Their heat and lights had been
cut off. To make sure the girls were getting their nebulizer treatments, her landlord was letting her run an
electric cord from the basement, and the neighbors were letting the girls bathe at their apartment to avoid
their asthma from being triggered by cold showers. To pay the rent, the family had cut back as far as they
could on food.1
Shoring up existing networks of emergency food providers and linking eligible families to benefits can prevent a family like Sarah Hammer’s from going hungry. Making sure families have access to nutritious food, in particular, can help prevent lost productivity and health problems for adults and irreversible losses in cognitive skills and development in children.
hoW philAnthropiC CApitAl CAn ChAnge the situAtion
There are two linked and complementary solutions that philanthropists can fund to prevent people from going hungry.
solution 1: emergency Food providers: Expand the capacity of food banks and their affiliate soup kitch-ens and pantries to provide free and healthy emer-gency food. Food drives can be an excellent way to raise awareness of the need for emergency food. However, the providers and funders we spoke to em-phasized that providing philanthropic capital, rather than actual food donations, is a more efficient and effective way to support their efforts. Thanks to their relationships with food wholesalers and distributors,
nonprofits can obtain food at very low costs.
solution 2: benefits access programs: Connect eligible households with available public benefits programs. Some of these benefits programs, such as SNAP (Supplemental Nutrition Assistance Pro-gram, formerly known as food stamps), are specific to nutrition. Others can serve as work supports (e.g., childcare subsidies) and/or help offset a portion of household expenses (e.g., LIHEAP or Low-Income Energy Assistance Program to help with heating bills), thereby reducing the need for families to go without food.

HIgH ImPaCT PHIlaNTHroPy IN THe dowNTurN 29
Each of these solutions can be successful depending on a family’s situation. However, each solution has its limitations.
Many emergency food providers are small, local operations operated by religious organizations. By leveraging donations of food, money, and volunteer time, these nonprofits can provide food at a relatively low cost. Unfortunately, these same characteristics mean that they can run out of food unpredictably, have limited hours of operation, restrict the number of times a client can visit, and lack the space or re-frigeration to handle fresh or perishable food. While philanthropic capital for capacity-building activities can help, even an immediate and massive influx of philanthropic capital is unlikely to be able to meet
the scale of need brought on by the recession.
Federal benefit programs such as SNAP allow recipi-ents to use an existing, national network of grocery and convenience stores. As a result, SNAP is a more dependable support for a family who needs help be-yond the few days or weeks that the emergency food providers were designed to address. However, this dependability comes at a cost. For every taxpayer dollar spent on SNAP, the beneficiary family receives only $0.78 to spend on food due to administrative costs, especially the cost required to certify house-hold eligibility.4 Even with recent increased funding, SNAP covers only a portion of monthly food expens-es and many poor families must rely on emergency food providers to make up the difference.
solution 1 : emergenCy food providers
greaT BaNg for BuCk: emergeNCy food ProvIders usINg HIgHly effICIeNT sourCINg aNd dIsTrIBuTIoN sTraTegIes
Cost per impact: As little as $16 to $37 to feed a family of four for a week8
Choice and/or bulk purchasing models (see Model in Practice sections that follow) represent a particularly efficient and effective strategy for emergency food providers. By comparison, the US Department of Agriculture (USDA) estimates that it costs a family of four on a low to moderate budget $150 to $220 to purchase enough food to feed themselves for a week.9
However, the choice model is a relatively recent innovation, and a typical food bank can spend $150 or more to feed a family of four for a week. Philanthropists can help local providers become more efficient by funding regional networks that provide logistics and bulk purchasing capabilities, making monetary donations instead of food donations, and supporting providers’ efforts to incorporate other aspects of the choice model into their operations.
Emergency food providers—food banks, soup kitch-ens, and food pantries—mitigate hunger by offering free food to households in need. Currently, however, emergency food providers are struggling to keep up with demand. Food banks across the country have seen a surge in the number of clients and frequency of visits5, reporting a 29% to 38% increase in demand for their services.6 In the most recent survey of the US Conference of Mayors in December 2008, all 21 cities with available data reported an increase in the number of people requesting food assistance for the first time.7
Source: Olsen, E., Almeida, M. (2009, July 29). A Year of Struggle at a Food Bank. Retrieved August 6, 2009, from http://video.nytimes.com/vid-eo/2009/07/29/us/1247463625625/a-year-of-struggle-at-a-food-bank.html

THe CeNTer for HIgH ImPaCT PHIlaNTHroPy30
Philanthropy can fill the gap by directly support-ing local emergency food providers. We present two promising models for overcoming the limitations of traditional food banks. The first is a pioneering new operating model that reduces costs while better meeting client needs. The second illustrates how new outreach and delivery strategies can cost effectively
meet increased demand while also providing healthy food. In the Model in Practice below, we provide de-tailed descriptions of these models, including bench-marks for linking cost and impact. In the Taking Ac-tion section on page 36, we tell you how to identify an agent in your local area and we provide tips on supporting its work.
model in practice:
“waste Not, want Not” or choice model for providing emergency food
about the model: In the choice model, food banks pur-chase food at significantly discounted wholesale prices, far more cheaply than the general public can. Food banks then allow clients to select their own food from super-market-style displays. This approach differs significantly from that used by most food pantries, where volunteers pre-sort food into identical boxes that are then distributed to clients regardless of client needs. The choice model has been pioneered by Feeding America West Michigan Food Bank (formerly Second Harvest Gleaners Food Bank of West Michigan, Inc.), the region’s nonprofit clearing-house for food since 1981. In its implementation of the model, West Michigan refers to it as the “Waste Not, Want Not” program.
impact: The model has helped increase West Michigan’s distribution from 8.3 million pounds of food in 1994 to 22 million pounds in 2008. Using this model, the food
bank expects to distribute 24.5 million pounds by the end of 2009, providing food to 400,000 needy people annu-ally. Compared with traditional practices, it wastes half as much food, drops the cost of addressing hunger, and ensures that people are fed according to their needs.10
costs: 15 cents per pound to acquire and distribute food.11
cost per impact: We estimate that it costs between $16 to $20 to feed a family of four for a week. We calculated this estimate based on food provider and US Department of Agriculture estimates of per person average daily con-sumption and nonprofit-reported costs.12
For more details on this model see High Impact Philan-thropy in the Downturn: Additional Sources and Due Dili-gence available on our website: www.impact.upenn.edu.
For more information and a detailed guide on how to es-tablish a “Waste Not/Want Not” or choice model pantry in your community, visit: www.endhungerinamerica.org/EndHunger.pdf.
To learn more about Feeding America West Michigan Food Bank, contact John Arnold, executive director, Feeding America West Michigan Food Bank, at (616) 784-3250, x206 or [email protected]. You can visit their web-site at: www.wmgleaners.org.
Image provided by Feeding America West Michigan Food Bank
The economic downturn has increased not only rates of hunger, but also concerns that the costliness and inaccessibility of fresh food will increase rates of obe-sity, diabetes, and poor health. Of particular concern
is the lack of access to healthy food for low-income children. In the following Model in Practice, we de-scribe how one emergency food provider is tackling both hunger and nutrition.

HIgH ImPaCT PHIlaNTHroPy IN THe dowNTurN 31
model in practice:
addressing both hunger and nutrition through improved outreach and provision strategies
about the model: By employing a multi-pronged ap-proach to emergency food provision, emergency food providers can help meet heightened demand while also making healthy food more accessible to those in need. For example, Philabundance, the largest hunger relief organi-zation in the ten-county region surrounding Philadelphia, has responded to the downturn by:
Delivering fresh produce to hard-hit neighborhoods where residents select perishable items right off the truck. Philabundance has doubled the number of its year-round Fresh for All delivery sites from six to twelve in response to increased demand.
Implementing the Emergency Food Response system, a toll-free hotline for individuals seeking information about food assistance
Introducing pick-up points beyond established pantries for one-time emergency food box with three days’ worth of food for a family of five
Partnering with St. Joseph’s University and the Mayor’s Office of Community Service to pilot choice model of distribution as pioneered by the Feeding America West Michigan Food Bank (see previous Model in Practice on p 30).
These represent promising strategies that other food banks can adopt.
impact: Provides approximately 65,000 people per week with five pounds of food to supplement what they obtain from other sources, or enough food to cover the weekly consumption needs of 9,000 to 15,000 people.13 In 2008, Philabundance distributed 17 million pounds of food within its ten-county service area and exported six mil-lion pounds of additional food, primarily produce, to food banks in the Feeding America network.14
costs: 28 cents per pound to acquire and distribute food, well below the wholesale rate of $1.50 per pound, because of significantly discounted prices from the food industry. The organization also receives some food at no cost from distributors for whom it is cheaper to give away food than to dispose of it in landfills at $65 per palette.15
cost per impact: We estimate that it costs between $30 and $37 to feed a family of four for a week.16 Although this is twice the cost of the “Waste Not/Want Not” or choice model pioneered by West Michigan, it is still significant-ly lower than the USDA estimate of $150 to $220 for a family of four on a low to moderate budget to purchase enough food to feed themselves for a week17 and there-fore represents a useful benchmark for efficiency for do-nors interested in supporting their local agents who may not have existing infrastructure to implement the choice model at this time.
For more details on this model see High Impact Philan-thropy in the Downturn: Additional Sources and Due Dili-gence available on our website: www.impact.upenn.edu.
To learn more about Philabundance, contact Martha M. Buccino, senior vice president and chief development of-ficer at (215) 339-0900 x 30, or [email protected]. Visit its website at: www.philabundance.org.
Image provided by Philabundance

THe CeNTer for HIgH ImPaCT PHIlaNTHroPy32
Emergency food providers play a critical role in ad-dressing hunger. However, as we noted earlier, they are limited in their ability to meet the scale of need brought on by the current crisis. SNAP (Supplemen-tal Nutrition Assistance Program, formerly known as food stamps) can address the current limitations of emergency food providers.
There are major barriers to gaining access to benefits especially for those who are newly poor. In 2006, the SNAP participation rate for eligible low-income families—the working poor—was 57%. For eligible elderly, it was only 34%.18 Challenges to gaining ac-cess to benefits include: lack of awareness of the exis-tence of programs, complicated application process-es, inability to take off work to enroll, language and educational barriers, lack of understanding of how even small (in dollar value) benefits can help, and even psychological barriers, such as social stigma or a belief that others are more deserving of benefits.
In our Models in Practice examples on pages 34 to 36, we describe innovative nonprofit models for over-coming these access hurdles. They represent prom-ising approaches in different cities and states that could be supported with philanthropic capital.
evidence on impact and efficiency of public benefits programs
Supporting increased access to programs makes sense when those programs are effective and efficient at targeting the intended need. This is true whether the program is a nonprofit, or in this case, a gov-ernment program. Here we briefly discuss available evidence on the impact and efficiency of the govern-ment programs to which nonprofits are working to improve access.
There is a large body of evidence regarding SNAP’s impact on reducing hunger and improving nutri-tion.19 Analysis of US Department of Agriculture data by the Center on Budget and Policy Priorites found the program to be administratively efficient, mean-ing it had very low error rates.20 In addition, a recent economic analysis by Moodys.com chief economist Mark Zandi ranked SNAP as providing the greatest return on investment of the 13 programs examined for proposed stimulus funding, in part because of its immediate impact on local economies (See Chart 1: Fiscal Economic Bang for Buck).21
Other public benefits programs can increase house-hold budgets so that families have a greater pool
solution 2 : ACCess to snAp (food stAmps) And other publiC benefits
greaT BaNg for BuCk: BeNefITs aCCess Programs
Cost per impact: Estimated $70 to $230 to successfully enroll an eligible individual or family in benefits programs that help maintain household access to basic essentials such as food22
Some programs such as SNAP specifically target food and nutrition. Others serve as work supports (e.g., childcare subsidies) and/or help with other urgent expenses such as heating bills. Such assistance helps prevent strapped families from rationing food.
Access barriers differ by benefit program and population. These differences account for some of the range in our “cost per impact” estimates. However, all these estimates compare favorably with the median and average costs observed across the 19 USDA-funded outreach efforts for food stamps (SNAP) in 2002. The median cost to successfully enroll a client in food stamps was $776 (with an average of $1,558 and a range of $126 to more than $4,000).23

HIgH ImPaCT PHIlaNTHroPy IN THe dowNTurN 33
of resources to prevent them from rationing food. While we have not analyzed the efficiency of each of these programs, a 2006 analysis by the Center on Budget and Policy Priorities found that the govern-ment safety net as a whole has “cut the number of Americans living in poverty by nearly half ” (i.e., 44% or 31 million) and “reduced the severity of poverty for those who remain poor.”24
A note on reported ROI for benefits access programs
In our research, we found that many nonprofit ben-efits access programs estimate a dollar amount for the benefits to which their clients have gained access, calling this a “return on investment figure”. However, since SNAP is designed to help needy families access federal dollars, any ROI should factor in the costs for the government funding and the dollars required to feed a family of four for a week. When these costs are considered along with the costs of the nonprofit benefits access program, we estimate that it costs roughly $1.40 to provide $1 worth of SNAP benefits to a family of four.25 In other words, it would cost $200 to $300 to feed a family of four for a week using SNAP benefits, compared to $150 to $220 if they had the means to purchase the same amount of food on their own. While this cost per impact is much more
than the cost per impact of the most efficient emer-gency food providers (see Great Bang for Buck, page 32), SNAP has the advantage of addressing many of the limitations of emergency food providers and could be justified for its economic stimulus impact alone (see below: Chart 1: Fiscal Economic Bang for Buck). The nonprofit models we describe in this sec-tion are focused only on removing access barriers to SNAP. Therefore, in our Models in Practice, we esti-mate a “cost per successful enrollment” (for more on how we link considerations of cost and social impact, visit our website www.impact.upenn.edu).
For donors concerned about government inefficien-cy or politically or philosophically opposed to gov-ernment provision of public benefits, we recommend supporting the private nonprofit emergency food providers described on pages 29 to 31.
Nonprofit solutions to connecting eligible families to benefits
In order to overcome existing access barriers, a num-ber of nonprofit organizations have taken advantage of technological advances to develop web-based tools that screen people to determine their eligibil-ity, quickly cue them as to whether it is worth their
CHarT 1: esTImaTed fIsCal eCoNomIC BaNg for BuCk
$0.00 $0.20 $0.40 $0.60 $0.80 $1.00 $1.20 $1.40 $1.60 $1.80 $2.00
one year change in real gdp For a given $1 reduction in Federal tax revenue or $1 increase in spending
temporary increase in food stamps
extending ui benefits
increased infrastructure spending
general aid to state governments
payroll tax holiday
refundable lump-sum tax rebate
across the board tax cut
non-refundable lump-sum tax rebate
extend alternative minimum tax patch
make dividend and capital gains tax cuts permanent
cut in corporate tax rate
make bush income tax cuts permanent
accelerated depreciation
tax cut or spending increase
Source: Zandi, M. (July 24, 2008).21

THe CeNTer for HIgH ImPaCT PHIlaNTHroPy34
models in practice:
overcoming barriers to benefit enrollment for the working poor
about the model: Launched in 2004 by the national nonprofit Seedco, EarnBenefits helps the working poor gain access to benefits. Currently operating in six cit-ies (Atlanta, Baltimore, Buffalo, Memphis, New York, and Louisville) and soon in Tulsa, EarnBenefits partners with local community organizations to assist clients through three stages of the enrollment process: outreach, eli-gibility screening and application, and ongoing benefits management. At partner sites and through its website, EarnBenefits provides user-friendly materials that inform low-wage workers about available benefits and their eligi-bility. Professional counselors provide on-site, one-on-one help, guiding clients through application processes and later following up to provide assistance with recertification as well as suggestions for additional benefits for which clients may be eligible.
impact: From January 2005 through June 2009, Earn-Benefits has screened 75,580 people to determine their eligibility for benefits, enrolling 46,405 in at least one ad-
ditional benefit program. In total, it has enrolled its clients in more than 57,961 benefit programs.27
costs: Costs fall into three broad categories: technol-ogy and technical assistance ($150,000 for year one; $50,000 annually for subsequent years), program man-agement ($100,000 for year one; $30,000 to $50,000 annually for subsequent years); and counseling ($50,000 annually for a professional counselor; $20,000 annually for an AmeriCorps member).28
cost per impact: On average, $215 to successfully en-roll a new client in at least one benefit program, with a potential range of $125 to $800, depending on the com-plexity of a client’s situation and the cost of counseling (i.e., professional vs. AmeriCorps).29
To learn more about EarnBenefits, visit its website: http://www.earnbenefits.org. Alternatively, contact Michelle Hen-ry, senior program manager for asset building, Seedco, at (212) 204-1337 or [email protected].
while to apply, and facilitate the application and en-rollment process. While many states provide online applications for different benefits, nonprofits remove the remaining barriers to access by:
Simplifying the complex application process and conducting follow-up. Such activities ensure that people submit appropriate documentation in the required timely manner and reduce the likelihood that an eligible family’s application is rejected for administrative reasons
Facilitating enrollment for multiple benefits
Conducting outreach and operating in neighbor-hoods with high percentages of eligible households. Such efforts reduce the logistical challenges of gain-ing access to benefits
In addition, nonprofits are often better at gaining the trust and confidence of clients, many of whom are wary of welfare and other government offices.
There are significant differences in enrollment pro-cedures for different programs. For example, SNAP enrollment requires the submission of multiple forms of documentation within a given time period and sometimes even an in-person interview, whereas prescription benefit programs for the elderly entail completion of a short, simple form. The following Models in Practice illustrate how different nonprof-its are tackling both the program-specific as well as the population-specific barriers to access. As you will see, our cost per impact estimates for all of these models are well below the median and average cost per impact estimates we calculated for 19 USDA-funded outreach efforts for food stamps (SNAP). Based on reported cost and impact figures in 2002, the median cost to successfully enroll a client in food stamps was $776 and the average was $1,558, with a range of $126 to more than $4,000.26

HIgH ImPaCT PHIlaNTHroPy IN THe dowNTurN 35
models in practice (continued):
about the model: Currently, only about a third of the elderly eligible for SNAP receive them.30 A complex enroll-ment process, involving multiple forms and often requiring numerous accompanying documents and in-person inter-views, presents barriers to many eligible clients, but es-pecially the elderly poor. Benefits Data Trust (BDT) has re-cently pioneered an approach to overcome these barriers and is seeing impressive early results. Using an approach modeled on successful credit card marketing programs, BDT obtains lists from government and private organiza-tions and cross references them to identify seniors who are eligible but not receiving benefits. It then contacts eligible individuals through direct mail and automated, prerecorded telephone calls. Through its call center, BDT assists those it contacts by filling out applications elec-tronically and submitting them to the appropriate agency. A client usually can complete up to three applications during a 30-minute call. Since BDT representatives keep detailed electronic logs of their contact with clients, any representative can provide prompt service when a client calls in. Tracking also supports BDT’s efforts to assess
and analyze its performance. In addition to assisting with SNAP enrollment, BDT helps low-income seniors gain ac-cess to Low Income Home Energy Assistance Program (LI-HEAP) and drug benefits.
impact: Screened 11,000 clients and completed 6,166 applications, yielding 4,471 new benefits accessed be-tween September 2008 and January 2009. These enroll-ments all helped people 65 and over.31
costs: $300,000 to cover computers and phones, sala-ries and benefits for call center representatives, program-ming for benefits, and direct mail costs.32
cost per impact: An estimated $67 per newly enrolled client. This number is decreasing as BDT enrolls more cli-ents, leveraging economies of scale.33
To learn more about Benefits Data Trust, visit its website at: http://www.bdtrust.org. Alternatively, contact Michelle Raymond, development director, at (215) 207-9106 or [email protected].
Improving state-wide access through a broad public-private partnership
about the model: For many programs, processes and eligibility for enrollment differ by state. The Ohio Ben-efit Bank (OBB) is one of nine state efforts by the Work Supports Initiative, a public-private partnership to connect low-and moderate-income families with work supports, The Ohio Benefit Bank (OBB) is a public-private partner-ship of the Ohio Governor’s Office of Faith-Based and Community Initiatives, Ohio Association of Second Harvest Foodbanks, foundations, and other faith-based, nonprofit, governmental, and private-sector organizations. Its web-based service reduces complex tax and benefit forms to simple questions written at a 4th-grade level. A network of community-based nonprofit partners (e.g., churches, legal aid services, and food pantries) offers the web-based service, and a corps of trained volunteers assist clients with entering answers to questions. The service uses the answers to assess a person’s eligibility for about 20 ben-
efits across four categories: food,medical, tax assistance, and other supports (e.g.,childcare and home energy as-sistance). The counselor then helps the client complete and submit the appropriate applications.
impact: Since its inception in 2006, OBB has trained more than 5,300 volunteer counselors who help clients at nearly 1,200 sites in all of Ohio’s 88 counties. OBB has screened more than 88,000 people and completed 32,000 benefit applications. Based on assumptions made by OBB, the screenings are estimated to have produced more than 22,000 new enrollments in public benefit pro-grams.34
costs: Costs for launching an effort in a new state fall into three broad categories: initial investment in technolo-gy and technical assistance ($950,000 to $1,600,000 for year one);ongoing operational support (estimated at 35%
using credit card marketing techniques to provide benefits to the underserved elderly
THe CeNTer for HIgH ImPaCT PHIlaNTHroPy36
Emergency food providers and benefits access pro-grams play complementary roles in ensuring that needy households have access to food. A common feature among all the service providers discussed in this section is their commitment to overcoming lo-gistical barriers to access for low-income individuals and families. Whether by partnering with established community-based groups, extending hours of opera-tion, or launching mobile units to reach underserved
areas, these innovative models provide services where they are needed most.
Our research revealed these featured food banks and benefits enrollment organizations to be innova-tors in their efforts to alleviate hunger and increase household budgets, but others also exist. Philanthro-pists can help address hunger in their communities by building on existing efforts or funding new pro-grams.
tAKing ACtion
Images provided by Philabundance
models in practice:
Improving state-wide access through a broad public-private partnership (cont’d)
of technology costs, or $330,000 to $560,000 annually); and civic engagement and counseling efforts ($600,000 to $650,000 annually).35
cost per impact: Between $170 to $230 for a state with a program and client population similar to that served by OBB. State demographics and geography, state-specific technology requirements, and relationships with civic en-gagement partners (e.g., community colleges) are exam-
ples of factors that can influence both the cost and impact of a new program.36
To learn more about Ohio Benefit Bank, go to its web-site at: http://www.obb.ohio.gov. To learn more about the Work Supports Initiative, go to: http://www.mdcinc.org or contact Ralph Gildehaus, senior fellow at MDC, the North Carolina-based nonprofit founder and managing partner of the Work Supports Initiative, at (919) 251-8818.
For more details on these models see High Impact Philanthropy
in the Downturn: Additional Sources and Due Diligence available on our website: www.impact.upenn.edu.
HIgH ImPaCT PHIlaNTHroPy IN THe dowNTurN 37
how to find an emergency food provider in your area:
Food banks tend to focus their services within a par-ticular geographic region. The national organization Feeding America can help you locate a food bank in your area. Go to its website http://feedingamerica.org where you can enter your zip code or state to find a food bank near you. Under each listing, Feeding America provides contact information as well as ba-sic information regarding the scale of the organiza-tion and the range of services offered.
Philanthropists can play a significant role in fund-ing the expansion of an existing food bank so that they can accept greater quantities of donated whole-sale food, thus enabling it to serve more people. They can also help their local provider set up a system to ensure access to fresh fruits and vegetables that help meet both nutritional and caloric needs.
how to contact a benefits access organization
Organizations that inform families of their eligibility for federal benefits and assist them in the complicat-ed application process fill a growing need during this time of economic hardship and uncertainty.
The benefits access programs we describe in our Models in Practice are all experienced in launching programs in new locations. Each group has already developed effective technological tools to screen and enroll individuals. Philanthropic capital can bring these organizations to new communities. If one of the organizations profiled interests you, see the following page for contact information.
TIPs for assessINg emergeNCy food
ProvIders:
Strong providers will have the following:
Strategies to improve access to their services, such as mobile food pantries, telephone hotline services, multiple locations, and websites with locations and hours of operations
Healthy food options, such as fresh produce, that go beyond meeting caloric needs to help meet nu-tritional needs as well
On-site application or referral to SNAP and other benefit enrollment programs that further defray costs of food for needy families
Exceptional agents often do the following:
Buy food in bulk from distributors for increased efficiency
Provide a choice option for clients (see Model in Practice page 30 for more detail). Although the choice model is not widely in practice, many pro-viders incorporate elements of it into their work rather than handing out prepackaged boxes or bags
Because most providers are very small local dis-tributors and pantries, many do not perform these last two activities However, philanthropists can fi-nance regional provider networks that can support the small but critical local providers with capacity, logistics, and bulk purchasing, leading to greater ef-ficiencies.

THe CeNTer for HIgH ImPaCT PHIlaNTHroPy38
TIPs for assessINg BeNefITs aCCess
orgaNIzaTIoNs:
The models we discuss in this guide all had the fol-lowing features that allowed them to successfully enroll eligible members of their target client popula-tions. These features can serve as a useful due dili-gence checklist should you identify other organiza-tions working to improve benefits access.
Practices that reduce the logistical barriers for their target client populations. For EarnBenefits and Ohio Benefit Bank, that has included locating their operations in trusted nonprofit organizations or areas with a high concentration of their targeted population. For Benefit Data Trust, that has meant creating a call center that its less mobile, elderly cli-ents can contact
Systems for getting all the paperwork (applications, supporting documentation) to the benefits office, verifying eligibility, and conducting follow-up, all in a timely manner. This requires technological ca-pabilities and strong relationships with state gov-ernments
Capacity to do business in languages other than English. This addresses language and cultural bar-riers to access
Commitment to developing capability in systems to handle multiple benefits to improve their effi-ciency
Organizations profiled in this guide and where they operate:
EArNBENEfIts
Client population: Low-income workers
Location: Atlanta, Baltimore, Buffalo, Memphis, New York City, Louisville, Tulsa
Contact: Michelle Henry, senior program manager for asset building
Email: [email protected]
Phone: (212) 204-1337
Web: www.earnbenefits.org
BENEfIt DAtA trust
Client population: Low-income elderly
Location: Philadelphia; also operates in New York City, and Pennsylvania; experience nationwide
Contact: Michelle Raymond, development director
Email: [email protected]
Phone: (215) 207-9106
Web: www.bdtrust.org
OHIO BENEfIt BANk
Client population: Low to moderate-income indi-viduals
Location: Ohio; Benefit Bank also located in PA, FL, DC, MD, MS, KS, AK
Ohio Benefit Bank
Web: www.obb.ohio.gov
MDC
Contact: Ralph Gildehaus, senior fellow at MDC
Email: [email protected]
Web: www.mdcinc.org
Benefit BankTM
Contact: Bob Brand, president and CEO of Solutions for Progress, Inc., the for-profit developer and operator of Benefit Bank
Email: [email protected]
Web: www.thebenefitbank.com
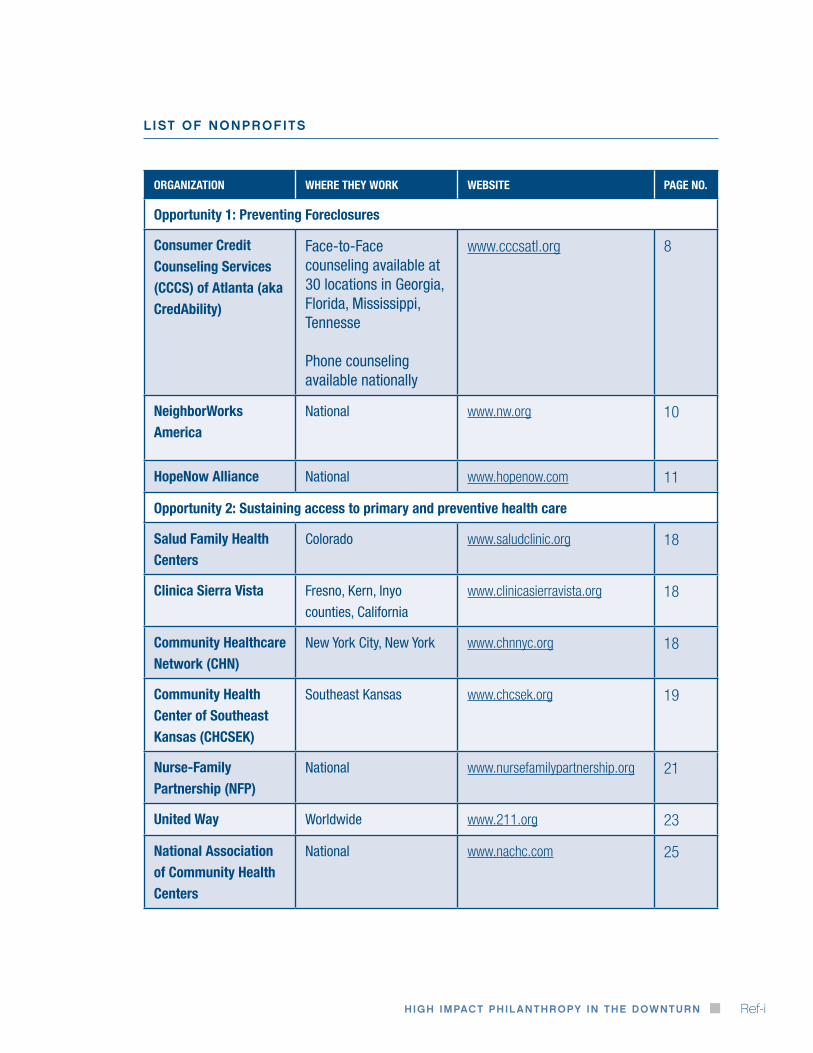
HIgH ImPaCT PHIlaNTHroPy IN THe dowNTurN Ref-i
organiZation where they worK website page no.
opportunity 1: preventing Foreclosures
consumer credit counseling services (cccs) of atlanta (aka credability)
Face-to-Face counseling available at 30 locations in georgia, Florida, Mississippi, Tennesse
Phone counseling available nationally
www.cccsatl.org 8
neighborworks america
National www.nw.org 10
hopenow alliance National www.hopenow.com 11
opportunity 2: sustaining access to primary and preventive health care
salud Family health centers
Colorado www.saludclinic.org 18
clinica sierra vista Fresno, Kern, Inyo
counties, California
www.clinicasierravista.org 18
community healthcare network (chn)
New York City, New York www.chnnyc.org 18
community health center of southeast Kansas (chcseK)
Southeast Kansas www.chcsek.org 19
nurse-Family partnership (nFp)
National www.nursefamilypartnership.org 21
united way Worldwide www.211.org 23
national association of community health centers
National www.nachc.com 25
list of nonprofits

THe CeNTer for HIgH ImPaCT PHIlaNTHroPyRef-ii
organiZation where they worK website page no.
opportunity 3: ensuring access to food
Feeding america west michigan Food bank
West Michigan www.wmgleaners.org 30
philabundance Delaware valley www.philabundance.org 31
earnbenefits Atlanta, Baltimore, Buffalo,
Memphis, New York,
Louisville, Tulsa
www.earnbenefits.org 34
benefits data trust (bdt)
Philadelphia, Pennsylvania www.bdtrust.org 35
ohio benefit bank (obb)
Ohio www.obb.ohio.gov 35
benefit bank Pennsylvania, Florida,
District of Columbia,
Maryland, Mississippi,
Kansas, Arkansas
www.thebenefitbank.com 35
mdc, inc North Carolina www.mdcinc.org 36
Feeding america National www.feedingamerica.org 37
list of nonprofits (Continued)

HIgH ImPaCT PHIlaNTHroPy IN THe dowNTurN Ref-iii
1 VMA Communications. (2009, January 16). Is anybody listening? A testament by Village Academy High School students on the economic crisis. Retrieved September 17, 2009, from http://www.youtube.com/user/vmacommunications.
2 Kolomatsky, M., Berger, J., Conrad, F.R., Fahim, K., Haughney, C., & Henry, D. (2009, May 17). The faces of foreclosure: People across the New York region tell their stories. New York Times. Retrieved September 17, 2009, from http://www.nytimes.com/ interactive/2009/05/17/nyregion/new-jersey/20090517_FORECLOSURE.html.
3 Lovell, P., & Isaacs, J. (2008, April). The impact of the mortgage crisis on children and their education. Washington, DC: First Focus. Retrieved July 28, 2009, from http://www.brookings.edu/~/media/Files/rc/papers/2008/04_mortgage_crisis_isaacs/04_mortgage_ crisis_isaacs.pdf.
4 Erlenbusch, B., O’Connor, K., Downing, S., & Phillips, S. W. (2008, April 15). Foreclosure to homelessness: The forgotten victims of the subprime crisis: A national call to action. Washington, DC: National Coalition for the Homeless. Retrieved July 28, 2009, from http://www.lacehh.org/documents/ForeclosuretoHomelessnessApril152008.pdf.
5 Center for Responsible Lending. (2009, May). Soaring spillover: Accelerating foreclosures to cost neighbors $502 Billion in 2009 alone. Retrieved May 10, 2009, from http://www.responsiblelending.org/mortgage-lending/research-analysis/soaring-spillover-3-09.pdf.
6 Immergluck, D., & Smith, G. (2006, November). The impact of single-family mortgage foreclosures on neighborhood crime. Housing Studies, 21(6), 851-866.
7 Apgar, W.C., & Duda, M. (2005, May 11). Collateral damage: The municipal impact of today’s mortgage foreclosure boom. Homeownership Preservation Foundation. Retrieved April 1, 2009, from http://www.995hope.org/content/pdf/Apgar_Duda_Study_Short_Version.pdf.
8 Mortgage Bankers Association. (2009). National delinquency survey: Second quarter 2009. Retrieved October 19, 2009, from http://store.mortgagebankers.org/ProductDetail.aspx?product_code=EC1-300081-RP-I. Note: 13.16% is based on non-seasonally-adjusted data from the MBA National Delinquency Survey. “Mortgage holders not current” refers not only to those in foreclosure but also to those who are at least one payment past due on their loan.
9 See Reference 5.
10 RealEstateRama. (2009, Sept 17). FTC announces new enforcement actions in continuing crackdown on mortgage relief services scams. Retrieved September 17, 2009, from http://www.realestaterama.com/2009/09/17/ftc-announces-new-enforcement-actions-in- continuing-crackdown-on-mortgage-relief-services-scams-ID06001.html.
11 Freddie Mac. (2005). Foreclosure avoidance research. Retrieved May 19, 2009, from http://www.freddiemac.com/service/msp/pdf/foreclosure_avoidance_dec2005.pdf.
12 See Reference 7.
13 See Reference 5.
14 The total bill to the city figure (i.e., $306 billion) was calculated by using the maximum municipal costs per foreclosure (i.e., $34,000) reported in Apgar’s piece multiplied by the total number of foreclosures over the next four years (i.e., 9 million) projected by Center for Responsible Lending.
15 See Reference 5.
16 See Reference 5.
17 See Reference 6.
18 CCCS of Atlanta. (2009, January 21). Consumer credit counseling service of greater Atlanta helps record number of people in 2008. Retrieved June 15, 2009, from http://www.cccsatl.org/mediaRoom/pressReleaseDetail.jsp?id=183
19 Consumer Credit Counseling Service. (2009, July 17). Using technology solutions to improve outcomes in foreclosure prevention: A presentation to Kat Rosqueta and Hilary Rhodes, The University of Pennsylvania. Atlanta, GA.
20 Herbert, C., Turnham, J., & Rodger, C. (2008, September). The state of the housing counseling industry. U.S. Department of Housing and Urban Development. Retrieved May 19, 2009, from http://www.huduser.org/Publications/PDF/hsg_counsel.pdf.
21 Personal communication with Mark Cole, Executive Vice President and Chief Operating Officer of CCCS of Atlanta, July 17, 2009.
22 See Reference 20.
opportunity 1 : referenCes And endnotes
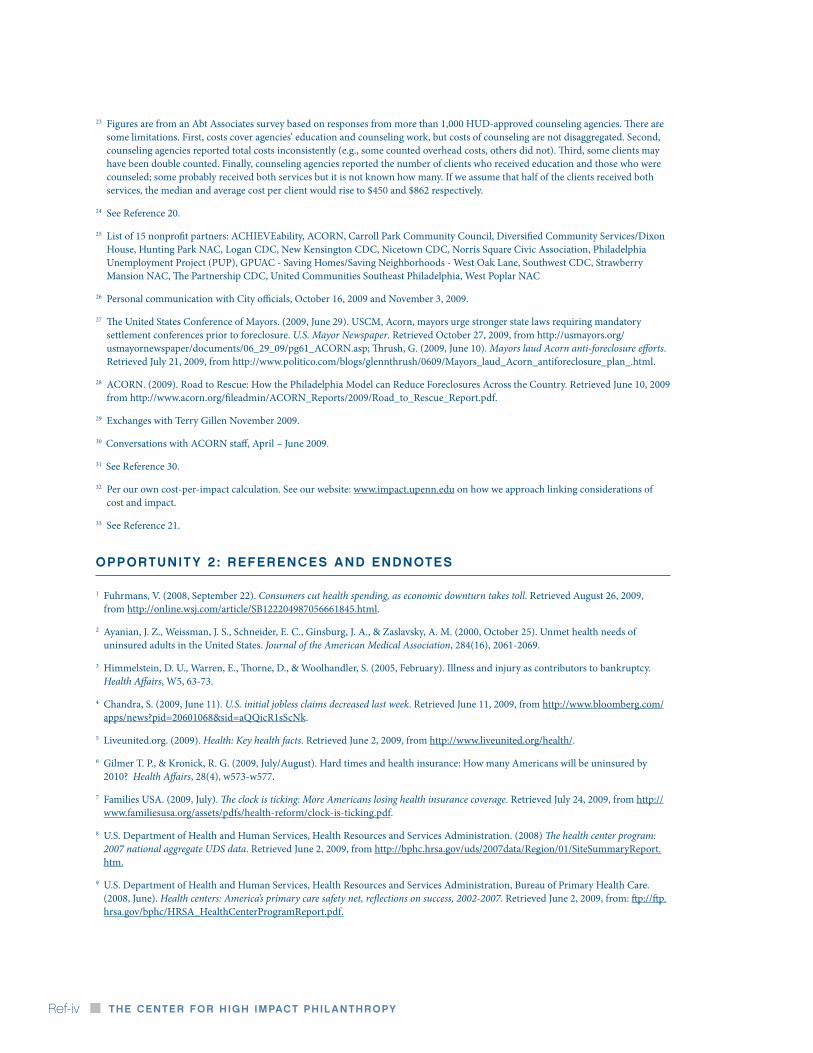
THe CeNTer for HIgH ImPaCT PHIlaNTHroPyRef-iv
23 Figures are from an Abt Associates survey based on responses from more than 1,000 HUD-approved counseling agencies. There are some limitations. First, costs cover agencies’ education and counseling work, but costs of counseling are not disaggregated. Second, counseling agencies reported total costs inconsistently (e.g., some counted overhead costs, others did not). Third, some clients may have been double counted. Finally, counseling agencies reported the number of clients who received education and those who were counseled; some probably received both services but it is not known how many. If we assume that half of the clients received both services, the median and average cost per client would rise to $450 and $862 respectively.
24 See Reference 20.
25 List of 15 nonprofit partners: ACHIEVEability, ACORN, Carroll Park Community Council, Diversified Community Services/Dixon House, Hunting Park NAC, Logan CDC, New Kensington CDC, Nicetown CDC, Norris Square Civic Association, Philadelphia Unemployment Project (PUP), GPUAC - Saving Homes/Saving Neighborhoods - West Oak Lane, Southwest CDC, Strawberry Mansion NAC, The Partnership CDC, United Communities Southeast Philadelphia, West Poplar NAC
26 Personal communication with City officials, October 16, 2009 and November 3, 2009.
27 The United States Conference of Mayors. (2009, June 29). USCM, Acorn, mayors urge stronger state laws requiring mandatory settlement conferences prior to foreclosure. U.S. Mayor Newspaper. Retrieved October 27, 2009, from http://usmayors.org/ usmayornewspaper/documents/06_29_09/pg61_ACORN.asp; Thrush, G. (2009, June 10). Mayors laud Acorn anti-foreclosure efforts. Retrieved July 21, 2009, from http://www.politico.com/blogs/glennthrush/0609/Mayors_laud_Acorn_antiforeclosure_plan_.html.
28 ACORN. (2009). Road to Rescue: How the Philadelphia Model can Reduce Foreclosures Across the Country. Retrieved June 10, 2009 from http://www.acorn.org/fileadmin/ACORN_Reports/2009/Road_to_Rescue_Report.pdf.
29 Exchanges with Terry Gillen November 2009.
30 Conversations with ACORN staff, April – June 2009.
31 See Reference 30.
32 Per our own cost-per-impact calculation. See our website: www.impact.upenn.edu on how we approach linking considerations of cost and impact.
33 See Reference 21.
opportunity 2 : referenCes And endnotes
1 Fuhrmans, V. (2008, September 22). Consumers cut health spending, as economic downturn takes toll. Retrieved August 26, 2009, from http://online.wsj.com/article/SB122204987056661845.html.
2 Ayanian, J. Z., Weissman, J. S., Schneider, E. C., Ginsburg, J. A., & Zaslavsky, A. M. (2000, October 25). Unmet health needs of uninsured adults in the United States. Journal of the American Medical Association, 284(16), 2061-2069.
3 Himmelstein, D. U., Warren, E., Thorne, D., & Woolhandler, S. (2005, February). Illness and injury as contributors to bankruptcy. Health Affairs, W5, 63-73.
4 Chandra, S. (2009, June 11). U.S. initial jobless claims decreased last week. Retrieved June 11, 2009, from http://www.bloomberg.com/apps/news?pid=20601068&sid=aQQicR1sScNk.
5 Liveunited.org. (2009). Health: Key health facts. Retrieved June 2, 2009, from http://www.liveunited.org/health/.
6 Gilmer T. P., & Kronick, R. G. (2009, July/August). Hard times and health insurance: How many Americans will be uninsured by 2010? Health Affairs, 28(4), w573-w577.
7 Families USA. (2009, July). The clock is ticking: More Americans losing health insurance coverage. Retrieved July 24, 2009, from http://www.familiesusa.org/assets/pdfs/health-reform/clock-is-ticking.pdf.
8 U.S. Department of Health and Human Services, Health Resources and Services Administration. (2008) The health center program: 2007 national aggregate UDS data. Retrieved June 2, 2009, from http://bphc.hrsa.gov/uds/2007data/Region/01/SiteSummaryReport.htm.
9 U.S. Department of Health and Human Services, Health Resources and Services Administration, Bureau of Primary Health Care. (2008, June). Health centers: America’s primary care safety net, reflections on success, 2002-2007. Retrieved June 2, 2009, from: ftp://ftp.hrsa.gov/bphc/HRSA_HealthCenterProgramReport.pdf.

HIgH ImPaCT PHIlaNTHroPy IN THe dowNTurN Ref-v
10 National Association of Community Health Centers, the Robert Graham Center and Capital Link. (2007, August). Access granted: The primary care payoff. Retrieved June 12, 2009, from http://www.nachc.com/client/Access_Granted_FULL_REPORT.pdf.
11 Shin, P., Finnegan, B., & Rosenbaum, S. (2008, February 25). How does investment in community health centers affect the economy? Geiger Gibson Program/ RCHN Community Health Foundation, Research Brief #1. Retrieved May 20, 2009, from: http://www.gwumc.edu/sphhs/departments/healthpolicy/dhp_Publications/pub_uploads/dhpPublication_A5C8D794-5056-9D20-3DD5D5A9CD2DAFD1.pdf
12 National Association of Community Health Centers. (2008, August). Health centers and the uninsured: Improving health and access to care factsheet. Retrieved April 20, 2009, from http://www.nachc.com/client/documents/Uninsured_Fact_Sheet_FINAL912.pdf.
13 In this report we use the term “community health center” generically to refer to health care organizations which receive (or are eligible to receive) federal funding under Section 330 of the U.S. Public Health Service Act. These are also known as federally qualified health centers (FQHCs). FQHC look-alikes are health centers that meet all the requirements of FQHC but do not currently receive federal funding.
14 See Reference 9.
15 Dor, A., Pylypchuck, Y., Shin, P. & Rosenbaum, S. (2008, August 13). Uninsured and Medicaid patients’ access to preventive care: Comparison of health centers and other primary care providers. Geiger Gibson Program/ RCHN Community Health Foundation, Research Brief #4. Retrieved April 20, 2009, from http://www.gwumc.edu/sphhs/departments/healthpolicy/CHPR/downloads/RCHN_brief4_8-13-2008.pdf.
16 Shin, P., Jones, K., & Rosenbaum, S. (2003, September). Reducing racial and ethnic health disparities: Estimating the impact of high health center penetration in low-income communities. Prepared for the National Association of Community Health Centers. Retrieved June 15, 2009, from http://www.gwumc.edu/sphhs/departments/healthpolicy/chsrp/downloads/GWU_Disparities_Report.pdf.
17 Eisert, S., Mehler, P., & Gabow, P. (2008). Can America’s urban safety net systems be a solution to unequal treatment? Journal of Urban Health: Bulletin of the New York Academy of Medicine, 85(5), 766-778.
18 Institute of Medicine. (2003). Unequal treatment: Confronting racial and ethnic disparities in health care. Washington, DC: National Academy Press.
19 See Reference 8.
20 Proser, M. (2005, December). Deserving the spotlight: Health centers provide high-quality and cost-effective care. Journal of Ambulatory Care Management, 28(4), 321-330.
21 Source A: Salud Family Heath Centers. (2009). Clinics. Retrieved May 1, 2009, from http://www.saludclinic.org/Salud-english-brighton.html#. Note: Salud Family Heath Clinic “Ability to Pay” discount is based on family size and income as determined at the time that patient registers at clinic. Source B: Aetna. (2009). Eight ways to save a little money—and still take care of you! Retrieved September 1, 2009, from http://www.aetna.com/healthysavings/8ways.html. Source C: Healthcare Blue Book. (2009). Office visit, established patient, level 3. Retrieved September 1, 2009, from http://www.healthcarebluebook.com/page_Results.aspx?id=225&dataset=MD.
22 Johnson, N., Oliff, P., & Williams, E. (2009, September 3). An update on state budget cuts: At least 41 states have imposed cuts that hurt vulnerable residents; federal economic recovery funds and state tax increases are reducing the harm. Center on Budget and Policy Priorities. Retrieved September 21, 2009, from http://www.cbpp.org/3-13-08sfp.pdf
23 Trust for America’s Health and Robert Wood Johnson Foundation. (2009, March). Shortchanging America’s health: A state-by-state look at how federal public health dollars are spent and key state health facts. Retrieved July 24, 2009, from http://www.healthyameri-cans.org/assets/files/shortchanging09.pdf.
24 Karoly, L. A., Kilburn, M. R., & Cannon, J. S. (2005). Early childhood interventions: Proven results, future promise. Santa Monica, CA: RAND Corporation. Retrieved May 21, 2009, from http://www.rand.org/pubs/monographs/2005/RAND_MG341.pdf.
25 Krieger, J.W., Takaro, T.K., Song, L., & Weaver, M. (2005, April). The Seattle-King county healthy homes project: A randomized controlled trial of a community health worker intervention to decrease exposure to indoor asthma triggers. American Journal of Public Health, 95(4), 652-659.
26 Sixta, C. S., & Ostwald, S. (2008, March/April). Texas-Mexico border intervention by promotores for patients with type 2 diabetes. Diabetes Educator, 34(2), 299-309.
27 Lam, T. K., McPhee, S. J., Mock, J., Wong, C., Doan, H. T., Nguyen, T., Lai, K. Q., Ha-Iaconis, T., & Luong, T. N. (2003). Encouraging Vietnamese –American women to obtain pap tests through lay health worker outreach and media education. Journal of General Internal Medicine, 18, 516-524.

THe CeNTer for HIgH ImPaCT PHIlaNTHroPyRef-vi
28 Staten, L. K., Scheu, L. L., Bronson, D., Peña, V., & Elenes, J. (2005, January). Pasos Adelante: The effectiveness of a community-based chronic disease prevention program. Preventing Chronic Disease: Public Health Research, Practice and Policy, 2(1), 1-10.
29 Nurse-Family Partnership. (2009, March). A sound investment that can yield substantial public and private gains. Retrieved June 17, 2009, from http://www.nursefamilypartnership.org/resources/files/PDF/Fact_Sheets/NFP_Public_Funding.pdf.
30 See Reference 24.
31 See Reference 24.
32 See Note 13.
33 The Joint Commission. (n.d.) What is accreditation? Retrieved July 24, 2009, from http://www.jointcommission.org/NR/rdonlyres/D4B67088-980B-4642-A14F-ADB6805C1335/0/mktg_ahc.pdf; The Joint Commission. (2009, April 24). Facts about ambulatory care accreditation. Retrieved July 24, 2009, from http://www.jointcommission.org/AccreditationPrograms/AmbulatoryCare/ahc_facts.htm.
34 Personal Communications with Jennifer Morse, development director, Salud Family Health Centers. May 2009.
35 Personal Communications with Stephen Schilling, chief executive officer (CEO), Clinica Sierra Vista. June 2009.
36 Personal Communications with Elizabeth Howell, assistant vice president for development and public relations, Community Healthcare Network. May - July 2009.
opportunity 3 : referenCes And endnotes
1 The Children’s Sentinel Nutrition Assessment Program (C-SNAP) & Medical-Legal Partnership for Children (MLPC) at Boston Medical Center. (2008, October). Bringing children in from the cold: Solutions for Boston’s hidden homeless. Retrieved July 31, 2009, from http://www.childrenshealthwatch.org/upload/resource/BringingChildreninFromtheCold.pdf.
2 Nord, M., Andrews, M., & Carlson, S. (2008, November). Household food security in the United States, 2007. United States Department of Agriculture Economic Research Report Number 66. Retrieved, July 21, 2009, from http://www.ers.usda.gov/Publications/ERR66/ERR66.pdf.
3 Berg, J. (2008). All you can eat: How hungry is America? New York: Seven Stories Press. (p. 28).
4 Estimation based on the figures from the following sources: USDA Center for Nutrition Policy and Promotion. (2009, July). Official USDA food plans: Cost of food at home at four levels, U.S. average, June 2009. Retrieved November 1, 2009, from http://www.cnpp.usda.gov/Publications/FoodPlans/2009/CostofFoodJun09.pdf; USDA Food and Nutrition Service. (2009). Supplemental Nutrition Assistance Program: Fact sheet on resources, income, and benefits. Retrieved November 1, 2009, from http://www.fns.usda.gov/fsp/applicant_recipients/fs_Res_Ben_Elig.htm; Cody, S., Castner, L., Mabli, J., & Sykes, J. (2007, November). Dynamics of food stamp program participation, 2001-2003. USDA Food & Nutrition Service, Office of Research, Nutrition and Analysis. Retrieved November 1, 2009, from http://www.fns.usda.gov/ora/MENU/published/snap/FILES/Participation/Dynamics2001-2003.pdf; Cody, S., Gleason, P., Schechte, B., Satake, M., & Sykes, J. (2005, Feruary 4). Food stamp program entry and exit: An analysis of participation trends in the 1990s. USDA Economic Research Service. Washington, DC: Mathematica Policy Research, Inc. Retrieved November 1, 2009, from http://www.mathematica-mpr.com/publications/redirect_PubsDB.asp?strSite=PDFs/FSPentryexit.pdf; Logan, C., Rhodes, W., & Sabia, J. (2006, January). Food stamp program costs and error rates, 1989-2001. USDA Contractor and Cooperator Report No. 15. Retrieved June 1, 2009, from http://www.ers.usda.gov/Publications/CCR15/ccr15a.pdf.
5 The United States Conference of Mayors. (2008, December). Hunger and homelessness survey: A status report on hunger and homelessness in America’s cities: A 25-city survey. Retrieved July 21, 2009, from http://usmayors.org/pressreleases/documents/ hungerhomelessnessreport_121208.pdf.
6 Feeding America. (2008). Local impact survey results summary. Retrieved July 21, 2009, from http://feedingamerica.org/~/media/Files/research/local-impact-survey/2008-impact-survey.ashx.
7 See Reference 5.
8 See Models in Practice for full details of cost and impact figures and sources.
9 USDA Center for Nutrition Policy and Promotion. (2009, July). Official USDA food plans: Cost of food at home at four levels, U.S. aver-age, June 2009. Retrieved November 1, 2009, from http://www.cnpp.usda.gov/Publications/FoodPlans/2009/CostofFoodJun09.pdf.
10 Michigan State University Outreach Partnerships. (1998-1999). Overcoming hunger in the United States. Best Practice Brief, No. 8, 1998-1999. Retrieved October 30, 2009, from http://outreach.msu.edu/bpbriefs/issues/brief8.pdf; Personal communication with John Arnold, Executive Director, West Michigan Food Bank. June 12, 2009.

HIgH ImPaCT PHIlaNTHroPy IN THe dowNTurN Ref-vii
11 Personal communication with John Arnold, Executive Director, West Michigan Food Bank. June 12, 2009.
12 Based on U.S. Department of Agriculture Economic Research Service figures and conversations with emergency food providers, we estimated daily per person food consumption at 4 to 5 lbs per person per day.
13 Calculation based on USDA Economic Research Service figures and emergency food providers estimate of daily per person food consumption.
14 Personal Communication with William Clark, President and Executive Director, Philabundance, June 4, 2009.
15 See Reference 14.
16 Calculation based on figures from personal communication with William Clark, President and Executive Director, Philabundance, June 4, 2009.
17 See Reference 9.
18 Wolkwitz, K. (2008, June). Trends in food stamp program participation rates: 2000 to 2006. Prepared by Mathematica Policy Research, Inc. for the U.S. Department of Agriculture, Food and Nutrition Service. Retrieved May 26, 2009, from http://www.fns.usda.gov/ora/MENU/Published/snap/FILES/Participation/Trends2000-2006.pdf.
19 Fox, M. K., Hamilton, W., & Lin, B. (2004, October). Effects of food assistance and nutrition programs on nutrition and health: Volume 3, literature review. Food Assistance and Nutrition Research Report Number 19-3. Retrieved October 29, 2009, from http://www.ers.usda.gov/publications/fanrr19-3/fanrr19-3.pdf; Brown, J., L., Shepard, D., Martin, T., & Orwat, J. (2007, June 5). The economic cost of domestic hunger: Estimated annual burden to the United States. An analysis commissioned by the Sodexho Foundation, in partnership with the Public Welfare Foundation and Spunk Fund, Inc. Retrieved October 29, 2009, http://www.sodexofoundation.org/hunger_us/Images/Cost%20of%20Domestic%20Hunger%20Report%20_tcm150-155150.pdf; Liu, X., & Yen, T. (2009, April). The Supplemental Nutrition Assistance Program and nutrient intakes. Selected Paper prepared for presentation at the Agricultural and Applied Economics Association’s Annual Meeting, Milwaukee, July 26–28, 2009. Retrieved October 29, 2009, from http://agecon-search.umn.edu/bitstream/49529/2/The%20Supplemental%20Nutrition%20Assistance%20Program%20and%20Nutrient%20Intake.pdf; Rosenbaum, D. & Neuberger, A. (2005, August 17). Food and nutrition programs: Reducing hunger, bolstering nutrition. Center on Budget and Policy Priorities. Retrieved October 29, 2009, from http://www.cbpp.org/files/7-19-05fa.pdf.
20 Rosenbaum, D. (2005, June 9). The food stamp program is effective and efficient: Savings cannot be achieved by targeting “Waste, Fraud, and Abuse”. Center on Budget and Policy Priorities. Retrieved October 30, 2009, from http://www.cbpp.org/files/3-10-05fa. pdf.
21 Zandi, M. (July 24, 2008). Written testimony of Mark Zandi, chief economic and co-founder, Moody’s Economy.com, before the House Committee on small business hearing on “economic stimulus for small business: A look back and assessing need for additional relief ”. Retrieved May 26, 2009, from http://www.house.gov/smbiz/hearings/hearing-07-24-08-stimulus/Zandi.pdf.
22 See Models in Practice for full details of costs and estimated impacts of benefits access programs.
23 Calculation based on figures in Zedlewski, S., Wittenburg, D., O’Brien, C., Koralek, R., Nelson, S., & Rowe, G. (2005, September). Evaluation of food stamp research grants to improve access through new technology and partnerships: Executive report. Urban Institute for the United States Department of Agriculture, Food and Nutrition Service. Office of Analysis, Nutrition and Evaluation. Retrieved June 1, 2009, from http://www.urban.org/UploadedPDF/411278_food_stamps_ES.pdf.
24 Sherman, A. (2009, July 6). Safety net effective at fighting poverty but has weakened for the very poorest. Center on Budget & Policy Priorities. Retrieved July 17, 2009, from http://www.cbpp.org/files/7-6-09pov.pdf.
25 See Reference 4.
26 See Reference 23.
27 Personal communications with Chauncy Lennon, Senior Vice President, Seedco, and Michelle Henry, Senior Program Manager for Asset Building, Seedco, June – August 2009.
28 See Reference 27.
29 See Reference 27.
30 Access to Benefits Coalition. (2005). Pathways to success: Meeting the challenge of enrolling Medicare beneficiaries with limited incomes. The National Council on Aging. Washington, DC. Retrieved July 6, 2009, from http://www.accesstobenefits.org/library/pdf/ABC%20ReportFNL62305.pdf.
31 Personal communications with Warren Kantor, Founder, Chairman and Chief Executive Officer, Benefits Data Trust, Ginger Zielinskie, Vice President, Benefits Data Trust, and Michele Raymond, Director of Development, Benefits Data Trust, June – November 2009.

THe CeNTer for HIgH ImPaCT PHIlaNTHroPyRef-viii
32 See Reference 31.
33 See Reference 31.
34 Personal communications with Robert Brand, President and CEO of Solutions for Progress, Inc., and Ralph Gildehaus, Senior Fellow, MDC, Inc., June – November 2009.
35 Personal communications with Robert Brand, President and CEO of Solutions for Progress, Inc., and Ralph Gildehaus, Senior Fellow, MDC, Inc., November 5, 2009.
36 See Reference 35.

ACKnoWledgements
We would like to thank the following people who shared their expertise, offered insights, or provided feedback on the report.
Pauline Abernathy, City of Philadelphia; Brad Aronson; Bill Ayers, Why Hunger; Alison Buttenheim, PhD, Carolyn Cannuscio, ScD, Dennis Culhane, PhD, Richard Gelles, PhD, Roberta Iversen, PhD, Michael Katz, EdD, Mary Summers, MPhil, Walter Tsuo, MD, Dominic Vitiello, PhD, Wendy Voet, MPH, Susan Wachter, PhD, university of Pennsylvania; Stacy Dean, MPP, Center on Budget and Policy Priorities; Kwaku Driskell, Eric Weingartner, Michael Weinstein, PhD, robin Hood foundation; Ingrid Ellen, PhD, New York university; Liz Ellers, MBA, globalislocal; David Ertel, Bayview Asset Management, LLC; Bob Giloth, PhD, Miriam Shark, Annie E. Casey foundation; Olivia Golden, PhD, urban Institute; Kathleen Gorman, PhD, feinstein Center for a Hunger free America; Peter Gould, superior Group Inc.; Sara Hall, New Philanthropy Advisors; Sarah Hovde, JD, Local Initiatives support Corporation (LIsC) NYC; Dan Immer-gluck, PhD, federal reserve Bank of Atlanta, Georgia Institute of technology; Georgia Levenson Keohane, slate/The Nation; Martha King, single stop usA; Michelle Larkin, JD, robert Wood Johnson foundation; Tony Macklin, MM, Independent Consultant; Giridhar Mallya, MD, Philadelphia Department of Public Health; Rachel Meeks, Greater Philadelphia Coalition Against Hunger; Patricia Nicklin, MBA, share Our strength; Kathleen Noonan, JD, Policy-Lab, Children’s Hospital of Philadelphia; Jeremy Nowak, PhD, The reinvestment fund; Erika Poethig, The John D. and Catherine t. MacArthur foundation; Michelle Proser, MPP, Malvise Scott, National Association of Community Health Centers; Karen Putnam, Bessemer trust; Nan Roman, National Alliance to End Homelessness; Peter Shin, PhD, George Washington university; Melissa Schoen, MBA, California Healthcare foundation; Faith Schwartz, Hope Now Alliance; Kristof Starzynski, Mortgage Bankers Association; Ellen Vollinger, frAC; John Weidman, MA, The food trust; Lowell Weiss, Cascade Philanthropy Advisors; Mark Willis, PhD, ford foundation; Rachel Yoskowitz, MPH, Jewish family services Detroit Michigan; Mark Zandi, PhD, Moody’s Economy.com
We would like to thank the following people who provided information on their organization’s work for our Models in Practice.
Catherine Abate, JD, Elizabeth Howell, Community Healthcare Network; John Arnold, JD, feeding America West Michigan food Bank; Suzanne Boas, Mark Cole, Michelle Jones, MSCP, Michele Pearce, CCCs of Atlanta; Bob Brand, Benefit Bank; Carolyn Brown, Hiram Carmona, Terry Gillen, Laura Taylor, City of Philadelphia; Michele Chivore, Michelle Henry, MPA, Chauncy Lennon, PhD, EarnBenefits/seedco; William (Bill) Clark, PhilAbundance; Bruce Dor-palen, Lez Trujillo, ACOrN Housing; Ralph Gildehaus, JD, MDC; Thomas Jenkins, MSSW, Nurse family Partnership; Warren Kantor, Michele Raymond, Ginger Zielinskie, Benefits Data trust; Austin King, Ian Phillips, ACOrN; Jennifer Morse, salud family Health Centers; Steven Schilling, Clinica sierra Vista
special Thanks
Autumn Walden for project coordination; Vikas Choudhary, Jennifer Levy, Zehua Li, Elizabeth Copson for research; Djenaba Lewis, Minh Chau, Liore klein, Jessica riegel, and Carlos Martinez ruiz for research assistance; Linda Cor-man for editorial services; Minh Chau for cover design; Cooper Graphic Design for graphic design
Please send comments about this guide to the Center for High Impact Philanthropy at impact @ sp2.upenn.edu.
As the publisher of this guide, we encourage the widespread circulation of our work and provide access to our content electronically without charge.
You are welcome to excerpt, copy, quote, redistribute, or otherwise make our materials available to others provided that you acknowledge the Center for High Impact Philanthropy’s authorship. Should you have questions about this policy, please contact us at impact @ sp2.upenn.edu.
Copyright © 2009 Center for High Impact Philanthropy

The Center for High Impact Phi lanthropySchool of Socia l Pol icy & Pract ice | Univers i t y of Pennsylvania
3815 Walnut StreetPhiladelphia, PA 19104
weBsITe www.impact.upenn.edu emaIl [email protected] (215) 573-7266